Embed Size (px)
Citation preview

March 2021
CLIMATE CHANGE MITIGATION THROUGH
THE CIRCULAR ECONOMY
LEAD AUTHORS AND RESEARCHERSJelmer Hoogzaad (Shifting Paradigms)Yasmina Lembachar Ola Bąkowska Jordi Pascual Jacco Verstraeten-Jochemsen Marc de Wit Nanna Morgenroth (Circle Economy)
This report was commissioned and paid for by the Scientific and Technical Advisory Panel (STAP) of the Global Environment Facility (GEF) A panel that provides independent advice to the Global Environment Facility
SUGGESTED CITATIONHoogzaad JA et al (2020) Climate change mitigation through the circular economy Amsterdam the Netherlands Circle Economy amp Shifting Paradigms
EDITORSAna Birliga Sutherland Laxmi Haigh (Circle Economy)
DESIGN amp L AYOUT Nicolas Raspail Gayle Tjong-Kim-Sang (Circle Economy)
LICENSEThis work is licensed under a Creative Commons Attribution-ShareAlike 40 International License
COLOPHON
32
6 1 Executive Summary
1 22 Looking beyond borders the circular greenhouse gas
mitigation opportunity
1 6 3 The most promising circular mitigation interventions
2 0 Intervention 1 Improved livestock management
2 8 Intervention 2 Regenerative crop production and agroforestry
3 8 Intervention 3 Bioeconomy and bio-based materials
4 6 Intervention 4 Reducing food losses from harvest to processing
5 2 Intervention 5 Avoiding food waste at the retailer and consumer
5 8 Intervention 6 Closing the loop on urban organic residues
6 6 Intervention 7 Recycling of glass paper metals and plastics
7 6 Intervention 8 Making the renewable transition circular
8 2 Intervention 9 Eco-innovation in industrial clusters and
informal networks
8 8 Intervention 10 Circular design in construction
9 8 Intervention 11 Non-motorised and shared transport
1 0 6 Intervention 12 Tapping into alternative proteins
1 1 4 4 Accelerating the transition to a low-carbon circular economy
1 1 8 5 Recommendations
1 2 2 References
1 4 1 Acknowledgements
CONTENTS
54
This report from Circle Economy and Shifting Paradigms for the Scientific and Technical Advisory Panel (STAP) which advises the Global Environment Facility (GEF) on strategies projects and policies investigates how the circular economy can reduce greenhouse gas (GHG) emissions in low- and middle-income countries It also uncovers the range of socio-economic and environmental co-benefits that circular mitigation interventions can bring to GEF countries of operation It aims to provide strategic advice to the GEF and its implementing partners and carve out a role for these bodies in accelerating the transition to a low-carbon circular economy
The topic of this report is a very timely one and supports what proponents of the circular economy have long suspected emissions are inevitably tied to our use of material resources Circle Economyrsquos Circularity Gap Report 2021 reported that circular economy strategiesmdashwhich allow us to do more with lessmdashimplemented across sectors and nations have the potential to slash global GHG emissions by 39 It also finds that as much as 70 of emissions stem from material extraction processing and handling2 enforcing the need for an approach that touts intelligent resource management In being a means to an end for a socially just and ecologically safe space3 the circular economy also holds promise in delivering co-benefits such as biodiversity and job creation4
However while evidence confirms that the circular economy holds significant potential for emissions mitigation in Europe and G7 countries5 6 its impact on other parts of the world is less known In these contexts the circular economy is known by other terminologies such as green growth sustainable production and consumption sustainable development and resource efficiency There are valuable lessons to learn on the application of circular economy principles in low- and middle-income countries especially as the circular economy is not yet leveraged to its full potential in any part of the world
1 E XECUTIVESUMMARY
While existing mitigation commitmentsmdashlaid out in countriesrsquo climate blueprints the Nationally Determined Contributions (NDCs)mdashprimarily focus on increasing the share of renewables in the energy mix improving energy efficiency and halting land-use-related emissions from deforestation room for improvement exists in the form of circular strategies which tap into previously unexplored mitigation possibilities This report makes a case for such strategies in sectors relevant to the work of the GEF including agriculture forestry renewable energy and waste construction and transport7 The proposed interventions currently do not play a large role in the Kyoto Protocolrsquos Clean Development Mechanism (CDM) which is seen as a lsquotrailblazerrsquo8 of global investments in GHG mitigationmdashhighlighting the further potential for mitigation opportunities that complement measures under the CDM
METHODOLOGY
This report has been guided by desk research expert interviews expert consultation meetings and consultation with the STAP and the GEF Interventions were selected through a broad literature review and further narrowed down based on their GHG mitigation potential ability to reduce material resource extraction scalability and provision of socio-economic and environmental co-benefits The selected interventions were then clustered such that each group presents a tangible GHG mitigation potential business case potential barriers enablers and co-benefits The mitigation potential of each cluster which was determined for GEF countries of operation was scaled down based on global data from the Intergovernmental Panel on Climate Change (IPCC) Food and Agriculture Organization (FAO) United Nations Framework Convention on Climate Change (UNFCCC) Project Drawdown and the World Resources Institute (WRI)
76
THE MOST PROMISING CIRCUL AR INTERVENTIONS FOR GEF COUNTRIES OF OPER ATION
This report presents 12 interventions which may be relevant to the work of the GEF These circular mitigation interventions were chosen based on theirpotential to go beyond existing climate action in the GEF countries of operation and their ability to deliversocio-economic and environmental co-benefits (which are related to GEFrsquos other focal areas of biodiversity chemicals and waste land degradation and international waters) The mitigation potential and business case potential for each intervention described in more detail in the report is given by the Figure below
The proposed interventions are
Improved livestock management Reduce emissions from livestock through productivity improvements improve manure management and introduce anaerobic digestion of manure
Regenerative crop production and agroforestry Invest in cropland management practices that regenerate soil health and increase biodiversity and carbon sequestration including the use of agroforestry and mixed cropping
Bioeconomy and bio-based materials Scale the mechanical and chemical processing of agricultural and forest residues to produce bio-based construction materials (and other industries)
Reducing food losses from harvest to processing Enhance harvest methods and timing and improve the capacity to safely store transport and process food products
Reducing food waste at the retailer and consumer stages Reduce food waste through improved inventory management the development of secondary markets for imperfect food products or products near their expiry date and improved value-chain management
Closing the loop on urban organic residues Recover and separate organic residues from urban solid waste and wastewater for composting biogas production water and nutrient recovery to support urban and peri-urban farming
Redesign reuse repair remanufacture of products and recycling of glass paper metals and plastics Enhance the collection sorting and processing of materials and recyclables diverting waste from landfills and incineration to increase the availability of secondary resources
Making the renewable energy transition circular Implement a life-cycle approach to renewable energy generation and storage capacity through design for disassembly improved repairability circular business models and the use of recycled materials
Eco-innovation in industrial clusters and informal networks Apply industrial symbiosis approaches to industrial parks and create formal and informal networks to encourage the use of secondary resources across industries
Circular design in construction Design buildings for improved energy efficiency and minimise waste in the construction process by applying passive design and modular and offsite construction
Non-motorised and shared transport Prioritise non-motorised transport vehicle sharing and public transport in urban development
Shifting to healthier and more sustainable diets Shift to healthy diets that bridge the nutrition gap for lower-income brackets while curbing meat consumption by diversifying diets to include more plant or insect-based protein
1
7
8
9
10
11
12
2
3
4
5
6
Figure 1 shows the business case potential and GHG mitigation potential of each of the interventions proposed specifically for the GEF recipient countries For two of the interventions literature did not provide a credible estimate of the GHG mitigation potential for the GEF recipient countries
Figure 1 Business case and GHG mitigation potential
2 1153 10
1
12
4
6
BUSINESS CASE
POTENTIAL
GHG MITIGATION POTENTIAL IN MILLION TONNES CO₂e (2020-2050)
100 (GT CO2e)
LOW
MEDIUM
HIGH
7 9
8
LEGEND
Undefined GHG mitigation potential
Upper bound GHG mitigation potential
Lower bound GHG mitigation potential
98
Additionally standardised data collection and formalised insights on the drawbacks of the linear economymdashpresented along with the advantages of the circular economymdashare crucial to advance circular solutions Collection and analysis systems that provide detailed data on resource flows and feed them into reporting systems could both enable policymakingand national development strategies
NEX T STEPS
Based on the findings above the report presents 12 recommendations for guiding efforts in implementing circular projects with GHG mitigation potential to get us on track for 15-degrees of warming The report provides tangible recommendations highlighting the importance of a systems-based highly participatory approachmdashinvolving donor countries the private sector businesses and communitiesmdashthat will demonstrate the far-reaching impact circular strategies can offer
While the proposed recommendations were developed in the context of the GEF they are also applicable to other actors in the circular economy The report finds that it is paramount to combine policy interventions with project supportmdashfor example by covering the cost difference between linear and circular approaches for a good or servicemdashwhich can crucially prevent negative rebounds It also emphasises the necessity to consider the embodied emissions in products that cross borders in particular since these products are responsible for up to 30 of a countryrsquos consumption-based carbon footprint Prioritising local materials in an effort to both slash transport emissions and involve all actors along value-chains in project design was also recommended as was targeting and involving micro small and medium-sized enterprises (MSMEs) along with the informal sector which represent a large share of the labour market in GEF countries of operation Finally as finance was found to be a significant barrier the report recommends tackling this challenge by implementing circular principles in its own procurement process as well as developing cooperative and blended finance mechanisms to support and de-risk early investment in circular initiatives
ACCELER ATING THE TR ANSITION TO A CIRCUL AR ECONOMY
Synergies exist among all the chosen interventions in terms of their co-benefits barriers and enabling conditions Overall the mitigation and business potential for the interventions proposed are significant If applied these strategies have the power to keep us on track for 15-degrees of warming and limit the impacts of climate change
Mitigation potentialThe 12 interventions have a joint mitigation potential of between 285 billion tonnes CO2 equivalents (CO2e) and 695 billion tonnes CO2e between 2020 and 2050 respectively Our remaining carbon budget for an ideal scenariomdashwhere we limit warming to 15-degreesmdashsits at 580 billion tonnes CO2 highlighting the necessity for circular GHG mitigation strategies
Co-benefitsAs highlighted in the United Nations Environment Programme (UNEP) 2019 Emissions Gap Report achieving climate goals will bring a myriad of other benefits in line with the Sustainable Development Goals As our proposed circular strategies also focus on reducing primary material extraction and waste disposal these co-benefits are even more pronounced
Improved crop yieldsmdashand consequentially higher revenuesmdashfood security lower levels of air pollution economic growth the creation of fair and decent jobs and greater personal wellbeing emerged as socio- economic co-benefits of our interventions Greater preservation of ecosystems habitat protection that allows biodiversity to flourish and reduced water usage prevail as synergistic environmental co-benefits
BarriersThe common barriers across the interventions emerged in distinctive categories legal regulatory and institutional technological cultural and economic and financial The short-term planning horizons of national governmentsmdashwhich may disfavour policy that requires long-term investment and actionmdashsurfaced as a significant institutional barrier as did policy that fails to consider systems-impact and afford attention to the potential knock-on effects of interventions Cultural barriers were often interlinked with regulatory challenges a short-term focus for example often means that more acute priorities (such as expanding housing stock) may be given precedence
over environmental priorities instead of being developed in tandem Rising incomes may also lead to increases in consumption especially due to cultural values that equate material consumption with success showing a tendency towards consumption patterns and perceptions common to higher-income countries
Technical barriers are often linked to economic ones lsquohigh-techrsquo circular interventionsmdashsuch as those that require internet access or digitisationmdashmay encounter challenges in countries with insufficient infrastructure Meanwhile low-tech measuresmdashcomposting or regenerative agriculturemdashlack sufficient financial backing to get off the ground This is especially the case in situations where the benefits from interventions such as increased revenues or returns on investments are not immediate Financially speaking the patience of funders and viability of circular business strategies were identified as barriers as was the inadequate pricing of environmental externalities in goods which fails to monetarily reward the benefits of circular initiatives Funding circular interventions at scalemdashespecially in the context of multilateral development banksmdashalso poses challenges while presenting an avenue for GEF projects to make a significant impact
Enabling ConditionsEnabling conditions were found to coincide with barriers and ultimately boiled down to one key point the benefits of circular strategies must be made clear to gain traction with decision-makers and those responsible for their implementation Demonstration projects that show tangible benefits are needed to galvanise changemdashand communication on these benefits will increase the willingness to adjust improve and scale policies The co-benefits identified come back into play as linking circular strategies to co-benefits that may be of greater political prioritymdashlike food security or job creationmdashmay both inspire and enable swift action To this end all stakeholders should be involved in the policy creation process matched by efforts to raise awareness provide education and training and analyse how solutions can encompass all aspects of the value chain
1110
Climate change is a major global challenge that asks for unprecedented greenhouse gas (GHG) emissions reductions across international value chains to be addressed effectively The Paris Agreement established in November 2015 marked an important milestonein meeting that objective yet progress and action to date is insufficient to meet internationally agreed-upon targets
Consensus is also growing that incremental improvement which is symptomatic of many ofthe Nationally Determined Contributions (NDCs) will not suffice and that transformational change is needed to achieve global goals9 The circular economy holds the promise for systemic transformation of our societies toward more resource efficiency and resilience10 11 12 A reality of the prevailing linear economy is that over-consumption has effectively become the norm whilst elsewhere minimum living standards are not even being reached Therefore any successful economic model that meets the needs of the society it serves while responsibly stewarding the natural systems upon which it is reliant should also encourage behavioural changes depending on context
This report identifies and describes the role that the circular economymdashwhen implemented with economically viable initiativesmdashcan have in mitigating climate change along with socio-economic and environmental co-benefits This includes providing strategic guidance and recommendations on potential projects programmes and activities that the GEF could consider in its future investments and how to develop and implement these
The opportunities identified consider the following premises which should guide our thinking on the application of the circular economy as a mitigation lever
These are
1 Exploring synergies The circular economy is a means towards reducing waste disposal and minimising the unsustainable extraction of primary resources Climate change mitigation on the other hand is about reducing GHG emissions whether they are CO2 from fossil fuel combustion methane emissions from livestock waste management or wastewater treatment or nitrous oxide from fertiliser application and hydrofluorocarbons from industry This report explores where these two concepts are aligned and where altering material flows to reduce excessive extraction and waste disposal is in line with the reduction of GHG emissions
2 Low carbon and material footprint The GEF countries of operation include low-income countries which have a relatively low per capita material and carbon footprint When looking at the material footprint of consumption they are also relatively circular since a large share of their material needs comes from regenerative resources in agriculture forestry and fisheries Circularity is defined as the share of materials in use on an annual basis which are from regenerative or secondary origin and which are cycled back into the system after reaching their end-of-life14 Where there are large (uncircular) mining operations these often serve foreign demand15 16 Next to this these countries often produce less waste per capita while the waste that is disposed of is managed by a large group of (often informal) stakeholders17 Although their decentralised collection and processing of recyclables may give rise to concerns about labour conditions health and safety it does drive the circularity scoring up
3 Stock build-up Some of the GEF countries of operation are rapidly developing their infrastructure buildings and vehicle fleets to be able to provide shelter mobility and other services for a growing population with increasing material wealth In the case of buildings and
2 LOOKING BE YOND BORDERS THE CIRCULAR GREENHOUSE GAS MITIGATION OPPORTUNITY
transport infrastructure their service life typically extends for several decades Where so-called produced stock is being developed countries have an opportunity to develop infrastructure that supports a low-carbon future allowing them to leapfrog toward societal models that are both circular and carbon neutral by design Next to this when reducing GHG emissions there is a fine balance between maintaining existing assets or accelerating their replacement with more energy-efficient technologies18
4 Detrimental linear flows On the other hand the remaining linear material flows are very damaging Most of the linear flows in low- and middle-income countries are from imported goods and materials and their waste management systems are ill-equipped to handle such foreign materials Examples are packaging waste e-waste and hazardous waste The unregulated disposal of these materials causes serious degradation of natural assets which threatens the long-term regenerative production capacity of the country for which it relies on healthy soils marine ecosystems and forests19 20
5 The informal sector Some low- and middle-income countries have thriving sectors that largely operate in the informal economy These often involve smallholder farming fishing trading and repair services manufacturing and waste collection sorting and management21 22 These small entrepreneurs jointly operate as a network providing decentralised infrastructure for the production and dissemination of products and sometimes make up a larger share of the labour force than those employed by the large companies23 24
6 Resource rents The extraction of primary resourcesmdashboth extracted minerals and agricultural or forestry productsmdashoften account for a large share of GDP andor employment in low- and middle-income countries National governments and international partners have
often supported growth models that rely on the extraction of primary resources According to Chatham House lsquoWithout meaningful dialogue at the national and international level around future growth pathways there is a risk that natural resource-exporting countries will see the circular economy not as an opportunity for economic diversification but as a threat to continued growthrsquo25
7 Value chain perspective Figure 2 shows that some 62 of global GHGs are emitted during the Take Process and Produce stages26 Circular economy strategies that extend product and material lifetimes and use-intensity cut these emissions This might require looking across borders27 since some of the emissions from extraction processing and production may occur in countries other than the countries of consumption and disposal
1312
The circular economy is defined along Circle Economyrsquos Key elements of the circular economy framework29
Figure 2 The global carbon emission footprint behind meeting key societal needs excluding emissions from land use change28
CIRCUL AR STRATEGIES KEY ELEMENTS OF THE CIRCUL AR ECONOMYlsquoThe circular economy is an economy that is restorative and regenerative by design [and in which] economic activity builds and rebuilds overall system health The concept recognises the importance of the economy needing to work effectively at all scalesmdashfor big and small businesses for organisations and individuals globally and locallyrsquo30
It assumes dynamic systems meaning thereis no specific end-point but it is rather aprocess of transformation The Key elementsframework describes eight key fundamentalsthat give direction to this transformative process Ultimate aims include slowing (use longer) and narrowing (use less) the flow of resources closing the loop and switching to regenerative resources and clean energy The eight elements describe the full breadth of relevant circular strategies and will be used to score the case studies
International cooperation on climate change mitigation and national climate policies does not yet leverage circular economy strategies to their full potential Under the Paris Agreement the years 2020 and 2021 mark an opportunity to strengthen the climate policy ambitions that countries expressed in their Nationally Determined Contributions (NDCs) and use the mechanisms within the agreement to facilitate international cooperation along global supply chains By mapping material and energy flows and developing an understanding of how these flows help meet societal needsmdasha process called metabolic analysismdashcountries can identify additional circular mitigation opportunities A metabolic analysis also helps identify opportunities to reduce GHG emissions that cut across sectors and national borders
Circular economy strategies can be important additional measures to consider in developing higher emissions reduction targets31 since the circular economymdashlet alone resource efficiencymdashis hardly considered in existing NDCs This also places certain types of mitigation measures which are covered in the NDCs and being acted upon in the GEF target countries further away from the main scope of this analysis These are for example renewable energy and energy efficiency as well as forest protection
Existing mitigation commitments typically rely on increasing renewable energy improving energy efficiency and avoiding methane and land-use related emissions32 Countries can still tap into circular mitigation options in two ways
1 Where materials and goods are produced domestically a more circular economy can reduce territorial emissions from virgin material extraction processing and production and
2 International cooperation can drive down emissions even further As the circular economy concept gains traction internationally there is increasing willingness to reduce the consumption of carbon-intensive goods and materials even if they were produced abroad These mitigation options are important as an estimated 20 to 30 of a nationrsquos carbon footprint stems from the emissions embedded in imported products32
1 2 5 G t
2 2 5 G t
3 1 8 G t
3 8 2 G t
5 0 9 G t
Ta ke
Pr o c e s s
Pr o d u c e
Pr ov i d e
Co n s u m e ampWa s te
1514
The Key elements of a circular economy
bull Design For the Future Adopt a systemic perspective during the design process to employ the right materials for appropriate lifetime and extended future use
bull Prioritise Regenerative Resources Ensure renewable reusable non-toxic resources are utilised as materials and energy in an efficient way
bull Incorporate Digital Technology Track and optimise resource use and strengthen connections between supply-chain actors through digital online platforms and technologies
bull Rethink the Business Model Consider opportunities to create greater value and align incentives through business models that build on the interaction between products and services
bull Sustain amp Preserve Whatrsquos Already There Maintain repair and upgrade resources in use to maximise their lifetime and give them a second life through take-back strategies where applicable
bull Team Up to Create Joint Value Work together throughout the supply chain internally within organisations and with the public sector to increase transparency and create shared value
bull Use Waste as a Resource Utilise waste streams as a source of secondary resources and recover waste for reuse and recycling
bull Strengthen and Advance Knowledge Develop research structure knowledge encourage innovation networks and disseminate findings with integrity
Twelve circular mitigation interventions have been chosen based on their potential to go beyond existing climate action and ability to deliver socio-economic and environmental co-benefits The mitigation potential could overlap with the potential already targeted in the Intended Nationally Determined Contributions (NDCs) submitted to the United Nations Framework Convention on Climate Change (UNFCCC) These are the first mitigation pledges put forward by Parties to the Paris Agreement but their actual implementation might still require support from the GEF while implementation is also partially conditional upon international support
Building on earlier research completed for Stanley Foundation34 the analysis prioritises interventions that are currently poorly incentivised under the mechanisms for international collaboration included in the Kyoto Protocol notably the Clean Development Mechanism (CDM) When looking at the emissions reductions certified under the CDM the vast majority comes from renewable energy energy efficiency fuel switching or avoiding the emission of greenhouse gases (GHG) other than CO2 An estimated 5 stems from interventions in material flows other than fuels or the adoption of circular business models Examples are closing nutrient cycles with digestion and composting clinker substitution and recovering caustic soda and the adoption of service models for transport and lighting35 In this analysis we prioritise circular mitigation opportunities that complement those already covered by the CDM
The selected interventions represent a substantial GHG mitigation potential which is achieved by altering material flows so that the excessive and unsustainable extraction of primary resources and the disposal of harmful waste are minimised The positive impact of these interventions beyond climate change mitigation are referred to as co-benefits These environmental and socio-economic co-benefits are related to biodiversity chemicals and waste land degradation and international waters
The research to identify and elaborate upon the most promising circular mitigation interventions followed five steps
1 Through a broad literature review a long-list of circular mitigation opportunities was compiled The consulted sources included academic literature the FAO projects and programmes listed on OnePlanetNetwork and the EU Switch programmes the results from Project Drawdown and other grey literature
2 The long-list was shortened by selecting the complementary interventions that take a circular economy approach or an ability to
bull Reduce GHG emissions while also reducing the extraction of depletive primary resources like minerals and metals and reducing the disposal of waste
bull Complement or scale approaches already widely adopted and applied in international collaboration under the UNFCCC notably the CDM and Joint Implementation and in the first NDCs submitted by the Parties to the Paris Agreement Project activities were excluded that only affect fuel use without improving resource use such as projects that aim to increase the production of renewable energy improve energy efficiency or reduce methane emissions by flaring
bull Reduce GHG emissions in the sectors of interest to the GEF notably agriculture urban development and the built environment forestry energy and waste management Such measures must also be relevant to biodiversity chemicals and waste climate change forests international waters and land degradation36
bull Deliver environmental and socio-economic co-benefits and catalyse transformational change37
3 The remaining interventions were clustered by theme By identifying synergies across interventions a shortlist of clusters emerged each containing a set of interventions from the long-list
4 The clusters identified were verified in an expert panel meeting
5 For each cluster of interventions the GHG mitigation potential business case potential barriers enabling conditions and co-benefits were identified through a literature review and 23 expert interviews
3 THE MOS T PROMISING CIRCULAR MITIGATION INTERVENTIONS
1716
2 1153 10
1
12
4
6
BUSINESS CASE
POTENTIAL
GHG MITIGATION POTENTIAL IN MILLION TONNES CO₂e (2020-2050)
100 (GT CO2e)
LOW
MEDIUM
HIGH
7 9
8
1
2
3
4
5
6
7
8
9
10
11
12
Improved livestock managementAgriculture Land use17mdash69 Gt CO2e
Regenerative crop production and agroforestryAgriculture Forestry95mdash161 Gt CO2e
Bioeconomy and bio-based materialsForestry Agriculture Industry Construction56mdash225 Gt CO2e
Reducing food losses from harvest to processingWaste management Agriculture Food processing Land use9mdash51 Gt CO2e
Reducing food waste at the retailer and consumer stagesWaste management Agriculture Food processing Land use57mdash32 Gt CO2e
Closing the loop on urban organic residuesWaste management15mdash22 Gt CO2e
Redesign reuse repair remanufacturing of products and recycling of glass paper metals and plasticsSolid waste management Industry Consumer goods and packaging 5mdash6 Gt CO2e
Making the renewable energy transition circularEnergy Industry Waste management Undefined
Eco-innovation in industrial clusters and informal networksHeavy industry Food processing Manufacturing and assembly Electricity generation97mdash108 Gt CO2e
Circular design in constructionBuilt environment value chain24mdash57 Gt CO2e
Non-motorised and shared transportBuilt environment Transport99mdash20 Gt CO2e
Shifting to healthier and more sustainable dietsAgriculture Land use15mdash166 Gt CO2e
LEGEND
INTERVENTIONS SECTORAL SCOPE AND MITIGATION POTENTIAL
Undefined GHG mitigation potential
Upper bound GHG mitigation potential
Lower bound GHG mitigation potential
CIRCUL AR ECONOMY INTERVENTIONS POTENTIAL
Figure One shows the business case potential and GHG mitigation potential of the interventions proposed For two of the interventions literature does not provide a credible estimate of the GHG mitigation potential
Figure 1 Business case and GHG mitigation potential
THE INTERVENTIONS PROPOSED ARE
Intervention 1 Improved livestock management
Intervention 2 Regenerative crop production and agroforestry
Intervention 3 Bioeconomy and bio-based materials
Intervention 4 Reducing food losses from harvest to processing
Intervention 5 Reducing food waste at the retailer and consumer stages
Intervention 6 Closing the loop on urban organic resides
Intervention 7 Redesign reuse repair remanufacture of products and recycling of glass paper metals and plastics
Intervention 8 Making the renewable energy transition circular
Intervention 9 Eco-innovation in industrial clusters and informal networks
Intervention 10 Circular design in construction
Intervention 11 Non-motorised and shared transport
Intervention 12 Shifting to healthier and more sustainable diets
1918
INTERVENTION 1 IMPROVED LIVESTOCK MANAGEMENTReduce emissions from livestock through productivity improvements improve manure management and introduce anaerobic digestion of manure
Sectoral scope Agriculture Land use
Synergy with GEF areas of operation
Biodiversity Chemicals and waste Climate change Food systems land use and Restoration
IPCC categories targeted
3A Livestock Reduced methane emissions from enteric fermentation and manure management 3C Aggregate sources and non-CO2 emissions sources on land Reduced nitrous oxide emissions from urea and manure application
2120
This strategy aims to reduce emissions from livestock As a proxy the carbon intensity38 of meat production in Latin American African and SouthSoutheast Asian countries often exceeds 80 tonnes CO2 equivalents (CO2e) per tonne of meat produced This is approximately twice as high as in North America and Europe39 For many of the GEF recipient countries agriculture is also the prime source of green-house gas (GHG) emissions40 The non-Annex 1 countries41 under the UNFCCC are mostly low- and middle-income countries With the exception of a few economies in transition the Annex 1 country list overlaps with the GEF recipient countries In Annex 1 countries livestock emissions account for 65 of total GHG emissions from agriculture when considering emissions from enteric fermentation manure application and manure management42 Out of all global GHG emissions from these activities 69 are from non-Annex 1 countries under the UNFCCC43
The most prominent source of GHG emissions from livestock stems from enteric fermentation which is difficult to abate without reducing herd size This is often not an option since livestock are an important source of income for smallholder farmers providing livelihood food and nutrition security to almost 13 billion people globally44 Next to this livestock plays an important role in a circular food system45 Livestock can for example use waste as a resource by converting residual flows or crops unsuitable for human consumption consuming grass and herbs from pastures in areas unsuitable for growing food and providing manure to enhance soil quality The latter is important in countries with low soil fertility46 47 48 and can keep GHG emissions from synthetic fertiliser production and application low
Livestock can also provide energy through the processing of manure in small-scale anaerobic digesters Anaerobic digestion produces biogas which can be used as an alternative energy source to fossil fuels or firewood the extraction of
which contributes to forest degradation49 These approaches in turn prioritise regenerative resources
Further opportunities to reduce GHG emissions from livestock include increasing feed quality and overall productivity by designing for the future50 For example managed grazing which refers to achieving an optimal balance in how long an animal grazes on a specific grassland and how long the land needs to rest before the animals return Managed grazing aims to prevent over- and undergrazing and the negative impacts of each namely a decline in soil health and carbon losses Feed and dietary additives may also be used which increase productivity and reduce emissions from enteric fermentation This could include prioritising locally produced feed avoiding over- or underfeeding and storing feed or silage for use during the dry seasons to maintain productivity
Selective breeding which prioritises breeds with higher productivity or reduced emissions from enteric fermentation may also be considered This design approach to circular livestock has been successfully applied in Kenya where livestock management food security and resilience were improved through veterinary services51 52 Additionally improved herd management which includes decreasing mortality improving sanitary conditions animal health herd renewal and diversifying animal species could be an important avenue in designing for the future Finally improved manure management which includes manipulating bedding and storage conditions such as reducing storage time or removing bedding from manure by using solids-liquid separators53 should be considered
1A STRATEGYDESCRIPTION
17 to 69 billion tonnes CO2e between 2020 and 2050 This figure is based on global mitigation potential for improved livestock management (6-72 billion tonnes CO2e)54 managed grazing (16-26 billion tonnes CO2e)55 and the implementation of small-scale anaerobic digesters for manure (19 billion tonnes CO2e)56 The global figures for GHG mitigation potential in the livestock sector are derived from the IPCC and Project Drawdown and have been corrected to cover only the GEF countries of operation For this correction the country grouping of non-Annex 1 countries under the UNFCCC57 has been used as a proxy for the GEF countries of operation This proxy is imperfect since the non-Annex 1 countries exclude all EU Member States and several economies in transition According to FAOSTAT 69 of global livestock-related GHG emissions are from non-Annex-1 countries under the UNFCCC This estimate is conservative as it does not account for the higher carbon intensity of meat production in non-Annex 1 countries The mitigation potential of aligning production methods with those in Annex 1 countries58 has deliberately not been considered This allows farmers to maintain free roam livestock practices even if intensified livestock systems with large-scale manure digesters can have lower GHG per tonne of meat or dairy produced On an annual basis the emissions reduction potential would be between 06 and 07 billion tonnes CO2e
Lowmedium Investments in low-carbon and resource-efficient livestock management often rely on subsidies or carbon incentives to become attractive for smallholder farmers On a global scale the total investment in improved feeding and grazing59 and anaerobic digesters at farm60 and smallholder level61 requires an investment of approximately |US$267 billion while the net savings in operational expenditures as a result of the investment amount to US$898 billion between 2020 and 2050 Even though the investment pays off in the long-run pay-back periods of over nine years when dividing the investment through the savings over 30 years are too long The business case for biogas development by smallholders differs it is determined by fuel and time savings and income generated by applying the slurry from the digester as fertiliser The majority of biogas users report money and time savings as a major benefit of the technology whereby the financial benefits of the bioslurry can be more important to the farm operations than the biogas Estimates suggest that households can recover their investment costs in two to three years62 Because of this estimated payback the business case potential for the range of measures proposed under this intervention is categorised as low to medium
1BGREENHOUSE GAS MITIGATION POTENTIAL
1C BUSINESS CASE POTENTIAL
2322
In addition to climate change mitigation climate resilience is another important benefit More productive livestock systems and specific measures such as improving animal feed storage to ensure its availability throughout dry periods63 or breeding better-adapted livestock all serve to improve food productivity and security64 65 and as a result increase the food systemrsquos resilience to climate change66 Globally increased food productivity has prevented up to 1514 million square kilometres of land from being exploited or degraded67
Improved manure management also increases the contribution that a low-carbon and resource-efficient livestock system can make in avoiding land degradation Additionally the production of biogas a renewable energy source can help reduce energy deficits in rural areas68 as well as deforestation and forest degradation by reducing firewood extraction below levels which exceed the annual increment Biogas production has the potential to reduce deforestation by 4 to 26 in 203069 In other countries it may help reduce the use of kerosene and liquified petroleum gas for cooking
Claims that livestock can contribute to bio-diversity and carbon sequestration in soils are true only under certain stocking and grazing management practices70 71 72
Socio-economic benefits include increased farmer incomes from productivity gains Effective manure application can increase crop yields in mixed farm systems The improved preservation of feed helps retain productivity in dry seasons which allows farmers to make better margins as dairy prices tend to increase in dry seasons Improved livestock productivity can also reduce desertification and land degradation for example through reduced stocking densitiesmdash73 the number of animals kept on a given area
Connecting toilets to anaerobic digesters also helps to improve sanitary health and environmental conditions74 as 80 of all
deaths in developing countries are related to water- and excreta-related diseases75
Using biogas for cooking instead of firewood has substantial health benefits from improvements in indoor air quality which may be of the order of 66 to 99 and could bring respiratory and cardiovascular health benefits a 20 to 25 reduction in risk of a wide range of diseases76 Indoor air pollution is an insidious killer according to the WHO with most casualties occurring in Africa and Southeast Asia77
Using biogas for cooking also saves farmersrsquo valuable time As women are primarily responsible for the collection of firewood in many countries78 the shift to biogas provides an additional gender benefit as women can regain up to 50 of their time79 Where there is excess biogas available it could also be used to run irrigation systems instead of solar panels or diesel engines Reliable irrigation can further improve the productivity of crops80 Finally the digester sludge is a safe organic fertiliser which can reduce expenditures on synthetic fertilisers and the emissions associated with their production
1DCO-BENEFITS
Economic and financial Smallholder farmersmdashconcerned with the immediate survival of their businessmdashcan be risk-averse They also lack the means and access to capital to make investments and banks often require smallholders to be organised in a cooperative to reduce lending risks Larger commercial farms may require additional incentives to switch to low-carbon livestock practices because of the initial level of investment required
Limited access to financial credit in part due to a lack of collateral is an additional barrier to improved manure management81 Next to capital investments farmers also need to invest in labour and knowledge which increases short-term production costs82 Overall shortage of labour was considered an important barrier by farmers83
For the implementation of smallholder biogas systems further economic barriers apply like the high upfront investment84 and maintenance costsand competition with firewood which is often freely available85
Finally financial incentives provided are often targeted at the construction of anaerobic digesters and sometimes at purchasing synthetic fertilisers There are little incentives for farmers to improve their manure management and livestock productivity86
Technological The interventions proposed are not complex but some of the technologies for improved feed storage and large-scale anaerobic digestion require bulk transport of manure which is not always available in rural areas due to limited access to credit The bulky nature of manure also makes it more labour-intensive to manage which can lead farmers to prefer synthetic fertilisers87 At a smallholder level investments in biogas systems are hampered by the lack of adequate feedstock and water poor technical expertise and poor design of the digestion systems88
Legal regulatory and institutional A lack of policies regulatory frameworks and standards that encourage private investment in digesters of high quality create institutional barriers for smallholders Where there is legislation in place the focus is often on energy production and addressing public health issues The fertiliser and food security value of manure is seldom a driver for policy89
Cultural In some societies there are cultural barriers to using manure as a fertiliser in food production systems In addition farmers are more risk averse towards livestock management practices they are unfamiliar with90 Cultural barriers for the adoption of biogas systems include a preference for traditional cooking practices and a gender barrier While women are the primary beneficiary men are more likely to make the investment choice91 Finally a lack of awareness and knowledge of the value of manure as fertiliser does not foster changes in manure management92
1EBARRIERS
2524
1FENABLING CONDITIONS
Technologies can be subsidised or soft loans provided to overcome financial barriers but also to bridge the long payback of some of the investment options Microfinance institutions can play an important role here Such financial incentives can compensate for the lack of pricing of negative externalities for example related to the extraction of firewood which could cause forest degradation or methane emissions from livestock systems To create a sense of ownership over the technology provided it is important that farmers co-invest
Technical barriers can be overcome with adequate training and sufficient stakeholder engagement in the design of interventions Solutions in livestock systems need to be tailored to specific local conditions
The development of explicit organisations that promote biogas support with addressing legal and financial barriers provide up-to-date information and support biogas research and development can help overcome knowledge and awareness barriers93
Cultural barriers can be overcome with extension services explaining the value of nutrient cycling in mixed farms and altering negative perceptions of manure handling and application94
The Kenya Biogas Program is a public-private partnership between development partners Hivos SNV (Netherlands Development Organization) and the Directorate General for International Cooperation (DGIS) of the Dutch Ministry of Foreign Affairs and the Africa Biogas Partnership Programme (ABBP) in Kenya Its objective was to develop a commercially viable and sustainable domestic bio-digester sector in Kenya using revenue from the sale of carbon credits to subsidise the programme95 For those who own dairy cattle just two cows can provide sufficient manure for a biogas plant that provides enough gas for cooking96
Over 17000 bio-digesters were installed across Kenya between 2009 and 2020 serving over 100000 beneficiaries This programme helped reduce emissions by 365200 tonnes CO2e and prevented the extraction of 223000 tonnes of wood The emissions reductions from the application of bio-digester sludge as fertiliser have not been included in the GHG mitigation estimate The programme also created job opportunities it trained at least 577 masons to build biogas domes 82 of which operate as business entities and 240 of which as sole proprietors97
The Kenya Biogas Program adopted a specific marketing model using lsquoBiogas Marketing Hubsrsquo This approach relies on concentrating bio-digester information training sales extension and marketing efforts on beneficiaries that have common interests such as dairy coffee and tea farmer Cooperatives
Beneficiaries of the programme confirmed that the use of biogas enhanced their lives improved indoor air quality lowered expenditures on synthetic fertiliser and increased yields Whatrsquos more the lowered expenditures resulted in more farmersrsquo children attending school98 and women were empowered as a result as they were previously responsible for the time-consuming collection of firewood Finally the programme resulted in significantly decreased firewood use in Kenya households with bio-digesters use 21 to 33 tonnes less wood per year than households without99
CASE STUDY EX AMPLE KENYA BIOGAS PROGRAM DEVELOPING A SUSTAINABLE DOMESTIC BIODIGESTER SECTOR IN KENYA
The programme also overcame a number of barriers To address increasing abandonment rates it launched customer service centres and repair campaigns in 2016 decreasing technical failures100 It also worked to improve the connection with target customers by adjusting the focus of marketing campaigns from the benefits of biogas to the benefits of the digester sludge for crop production However to protect the interests of the biogas sector in the long run the programme launched an Association of Biogas Contractors of Kenya (ABC-K) and Association of Biogas Sector of Kenya (ABSK) The membership of both organisations continued to safeguard the interest of the biogas sector also beyond the closure of the programme To secure access to finance for biogas plants under attractive terms the programme has initiated various credit partnerships with financial institutions To secure access to finance for biogas plants under attractive terms the programme has initiated various credit partnerships with financial institutions101
2726
INTERVENTION 2 REGENER ATIVE CROP PRODUC TION AND AGROFORESTRYInvest in cropland management practices that regenerate soil health and increase biodiversity and carbon sequestration including the use of agroforestry and mixed cropping
THIS INTERVENTION IN CONTEX T
One of the aspects of this intervention is to utilise foodlost and organic waste as a resource on the farm as compost For a discussion on avoiding post-harvest losses altogether see Intervention four For a discussion on avoiding food wastemdashor unused food at the retail and consumption levelsmdashsee Intervention five Where waste is unavoidable and stems from urban areas it is used as a resource through the solutions proposed in Intervention six
Sectoral scope Agriculture Forestry
Synergy with GEF areas of operation
Biodiversity Climate change International waters Sustainable forest management Chemicals and waste
IPCC categories targeted
3B Land 3C Aggregate sources and non-CO2 emissions sources on land 2B Chemical industry
2928
REGENER ATIVE CROP PRODUCTION
Circular regenerative farming makes optimal use of crops and crop residues replenishes soil health instead of clearing more land for agricultural use and reduces synthetic fertiliser use and associated emissions
Follow the green resource and emission flows to understand the resource use and its impact on emissions in a circular value chain compared to a linear value chain highlighted in red
Note that the flows in this graph are indicative only and aim to illustrate extreme opposite circular and linear value chain
C O 2N 2OC H 4
C O N V E N T I O N A LFA R M I N G
P R O C E S S U S E
C r o p
C r o p r e s i d u e s
F o o d p r o d u c t s
I r r i g a t i o n w a t e r
S y n t h e t i c f e r t i l i s e r
F o s s i l f u e l s
D I S C A R D
C R O P
R E S I D U E S
A B A N D O N I N G
D E P L E T E D S O I L S
A N D C L E A R I N G
N E W L A N D
C H 4
C O 2 F R O M L A N D
U S E C H A N G E
C O 2N 2OC H 4
R E G E N E R AT I V EFA R M I N G
C O 2 S I N K I N S O I L C A R B O N
P R O C E S S U S E
C r o p F o o d p r o d u c t s
I r r i g a t i o n w a t e r a n d n u t r i e n t s
H a r v e s t e d r a i n w a t e r n i t r o g e n fi x i n g c r o p s
B i o m a s s
C O 2 S O U R C E ( S O I L C A R B O N
D E C R E A S E )
P R O C E S S
F u e l f o r m e c h a n i c a l o p e r a t i o n s
O r g a n i c m a t t e r a n d n u t r i e n t s
O r g a n i c m a t t e r a n d n u t r i e n t s
E X T R A C T E D R E S O U R C E S
M I N E R A L S B I O M A S SF O S S I L F U E L S E M I S S I O N S WAT E R
R E S O U R C E amp E M I S S I O N S F L OW S
L I N E A R I M P O R TA N T
C I R C U L A R M O D E R AT E
M I N I M A LI N D I R E C T E M I S S I O N S
I N P U T S amp O U T P U T S
Figure 3 Value chain mapping in circular and linear scenarios
3130
Regenerative crop production refers to agricultural practices that invest in soil health and fertility and conserve overall biodiversity on croplands These practices also improve soilrsquos water retention and provide natural ways to control weeds pests and diseases As a result they reduce the need for chemical fertilisers and pesticides and mechanical operations like ploughing weeding and irrigation which often involve fossil fuels Synthetic fertiliser use alone is responsible for 7 to 26 of agricultural emissions in South Asia Sub-Saharan Africa North Africa the Middle East and Latin America combined even without accounting for the emissions associated with their production102
Regenerative crop production proposes a range of measures that partly rely on using organic waste as a resource by making better use of organic agricultural residues and prioritising regenerative resources since it steers away from fossil fuel use in mechanical operations It also relies on efforts to sustain and preserve whatrsquos already made which relates to the preservation conservation and enrichment of biological assets such as soil land and forests As such it relies on and overlaps with principles of organic farming conservation agriculture agroecology and climate-smart agriculture
Regenerative crop production also includes agroforestry and community-managed forests whereby forest ecosystems are protected and managed such that different layers of vegetation both sequester carbon and provide food Agroforestry can also provide food with lower fossil fuel and chemical inputs
Practices included under the umbrella terms of regenerative crop production and agroforestry include
bull No-till agriculture to preserve soil organic carbon and reduce GHG emissions from the soil
bull Improved crop varieties crop rotation the use of nitrogen fixing crops when the land is fallow103 cover crops to reduce soil erosion control weeds and improve water retention104
bull Improved water management including drainage of waterlogged mineral soils and irrigation of crops in arid or semi- arid conditions
bull Improved rice management including water management such as mid-season drainage and improved fertilisation and residue management in paddy rice systems
bull Increasing biodiversity with intercropping agroforestry and protecting communitiesrsquo forest tenure thereby preserving the eco-system services these forests provide105 106
This includes practices like using trees and shrubs to provide fodder and control erosion while branches can be used for fuel or food stakes for tomatoes or climbing beans107
bull Biochar application Biochar is a solid product from the pyrolysis of wood When applied it increases the water-holding capacity of the soil and may provide better access to water and nutrients for vegetation Biochar application is most effective in tropical regions but its positive impacts could be cushioned by additional pressure on land use if large quantities of biomass are required as feedstock for biochar production108
2 A STRATEGY DESCRIPTION
95 to 161 billion tonnes CO2e between 2020 and 2050 Assuming wide-scale adoption alongside forest coastland wetland and grassland protection efforts regenerative agriculture and agroforestry have the potential to reduce global GHG emissions by 95 to 161 billion tonnes CO2e between 2020 and 2050 This figure includes global GHG mitigation estimates from Project Drawdown that relate to conservation agriculture (9-13 billion tonnes) and combined agricultural and forestry activities These are regenerative annual cropping (15-22 billion tonnes) nutrient management (2-12 billion tonnes) perennial staple crops (15-31 billion tonnes) abandoned farmland restoration (12-20 billion tonnes) silvopasture (27-42 billion tonnes) multistrata agroforestry (11-20 billion tonnes) tree intercropping (15-24 billion tonnes) Indigenous peoplesrsquo forest tenure (9-13 billion tonnes) and improved rice production (9-14 billion tonnes) with intensification (3-4 billion tonnes)109
The global figures for GHG mitigation potential through regenerative agriculture and agroforestry from the IPCC and Project Drawdown have been corrected to cover only the GEF countries of operation For this correction the country grouping of non-Annex 1 countries under the UNFCCC110 has been used as a proxy for the GEF countries of operation As in Intervention one this proxy has its limitations111 This global figure of 12804 to 21743 billion tonnes CO2e is confirmed by the IPCC Special Report on Climate Change and Land which quantified the mitigation potential of improved cropland management agroforestry and increased soil organic carbon alone at 57 to 498 billion tonnes CO2e between 2020 and 2050112
The main GHG mitigation levers are land-use change to productive ecosystems with a higher equilibrium soil carbon level and forest carbon stock and reducing emissions from the production and application of chemicals as well as from mechanical farming operations
Implemented at scale these practices can increase food productivity and consequently reduce the need for converting more land for agriculture They also reduce emissions by decreasing the need for chemical fertilisers and mechanical farming operations and through agroforestry contribute to increasing forest carbon stocks114 The effectiveness of regenerative farming practices in increasing carbon content in soils however is still a topic of debate partly originating from different definitions of regenerative agriculture and accounting methodologies115
2BGREENHOUSE GAS MITIGATION POTENTIAL
3332
2CBUSINESS CASE POTENTIAL
2DCO-BENEFITS
High At a global level investments into the proposed regenerative agriculture and agroforestry mitigation options would require an upfront investment of around US$900 billion while net operational savings as a result of the investment are around US$9000 billion up to 2050116 This implies that the simple payback not considering interest rates if loan financing is required is around three years on average across the proposed interventions
The interviews conducted confirmed that shifting to regenerative agriculture is economically beneficial in low- and middle-income countries although the interviewees referred to a longer time horizon than reflected in the figures from Project Drawdown117
Climate change mitigation is an important benefit of this intervention but the underlying strategies proposed also contribute to improving the climate resilience of food production systems as higher soil carbon levels cover crops and agroforestry all improve water retention118
Further co-benefits include increased biodiversity both above ground and in the soil as soil life improves when monocropping is reduced119 Additionally farms practising regenerative agriculture can serve as corridors for wildlife by connecting nature reserves and green areas Having a more biodiverse food system also provides variety in the food products harvested while higher soil fertility improves the nutritional value of the products This supports a healthier diet
Regenerative agricultural systems also require fewer chemical inputs further decreasing chemicals and waste while investing in soil quality and providing soil cover helps prevent land degradation120 Reduced application of agrochemicals also provides health benefits There are concerns that chemicals banned in other countries are still applied in certain countries like Kenya despite the adverse health effects of chemical residues on crops121
In terms of socio-economic impacts the business case indicates that this intervention could improve yields In many areas trees are financially important Irvingia gabonensis for example grown in Nigeria Cameroon and Gabon bears nuts and flowers with significance in national markets and for exports122
Furthermore regenerative agriculture values the traditional knowledge of farmers and incorporates this knowledge into farm-level innovation Along the same lines preserving landscapes with mixed vegetation has an aesthetic value123 and supports community coherence where trees like the baobab are used as meeting places124
Economic and financial Prioritising regenerative agriculture and agroforestry systems is financially feasible as the long-term benefits far outweigh the investments However farmers often lack access to the financial means needed to make this investment Grants offered to farmers often lack the long-term perspective required to make such a transition work
For agroforestry in particular financing has put little emphasis on investing in seed quality Benevolent NGOs that hand out seeds and seedlings for free inadvertently diminish efforts to build a private market for these Instead private seed and seedling companies should be supported
Legal regulatory and institutional There is little political priority attached to regenerative farming and agroforestry While there are often logging bans in place to prevent deforestation enforcement is weak and activities continue to drive deforestation and soil depletion on the ground Policy loopholes allow for monoculture plantations like rubber farms for example to be counted towards reforestation quotas Additionally political priorities may change frequently resulting in uncertainty
Another legal issue is that policies aiming to prevent people from cutting down their trees also discourages them from planting them for future use For example policies in Niger126 which allowed people to use their trees led to a huge increase in tree cover Land tenure issues may also act as a barrier if farmers are concerned about paying the following yearsrsquo rent they will be discouraged from making long-term investments in regenerative practices
Technological The technologies available today are focussed on monocropping rather than implementing regenerative farming at scale The knowledge and experience to do so are often lacking as it requires breaking down complex farming systems into educational packages which potential practitioners can understand Research efforts capacity building
financing and pilot projects should go hand-in-hand and all relevant stakeholders should be involved127
Cultural Tied to a lack of access to financing and long-term land use perspective is an overall short-term planning perspective This can be aggravated by volatile political circumstances which give way to uncertainty
2EBARRIERS
3534
There is currently a lot of momentum128 for regenerative agriculture and agroforestry in the private sector with substantial investments being made around the world by corporations such as Nestleacute129 Danone130 and General Mills131 in the last year alone Still significant potential remains
Regenerative farming and agroforestry investments require long-term loans which must also consider the variation in annual yields and related revenues Following a common practice in microfinance lendingmdashgrouping smallholders in a single loan packagemdashcan reduce the overall risk of defaults132
Financial returns can be further increased by coupling the transition to regenerative agriculture and agroforestry with efforts to create a market for the associated products and input For example by creating a market for agroforestry products or products with a regional organic certification or developing the supply of tree seedlings for agroforestry
Small-scale pilots or demonstration farms can build proof and showcase the benefits of the technologies and practices applied in particular geographical contexts Furthermore trainings can help overcome the relatively short-term planning horizon of smallholders while the financial and capacity support provided by the programme should have a similarly long-term scope
2FENABLING CONDITIONS
The Union of Land Workers (UTT) works to improve food sovereignty and promote agroecology by bringing together and empowering farming families in Argentina
lsquoAgroecologyrsquo is a set of principles and agricultural practices that seeks to promote both a circular and solidarity economymdashone that lsquoprioritises local markets and supports local economic development through virtuous cyclesrsquo133 As such agroecology promotes resource efficiency and closed-loop recycling reduction of inputs such as pesticides herbicides or synthetic fertilisers and biodiversity conservation as much as social values fairness or the co-creation of knowledge134
The activities of UTT are an interesting example as they target a range of barriers in parallel while involving a broad range of stakeholders Their activities range from advocating for improved legislation and secure access to land for farmers the provision of micro and soft loan schemes for smallholders to training and capacity-building
UTT has reached 250 families producing agro-ecologically across various provinces of Argentina with a farmer-to-farmer training process According to UTT they have converted 300 hectares of land to agro-ecological production while increasing yields by 20 saving 80 in farm expenditures and doubling revenues by direct sales through UTT sales channels The food products have higher nutritional value and contain no traces of agro-chemicals while matching the market price of conventionally produced products The union negotiates with local governments to gain access to abandoned or degraded farmland Once access is granted they grant unemployed workers access to the land and train them in food production with regenerative agriculture and agroecology
principles These workers obtain soft loans to purchase the land and can sell their products through UTT sales channels Training is provided by farm technicians and farmers135
CASE STUDY EX AMPLE UNION OF L AND WORKERS TRANSFORMING ARGENTINArsquoS AGRICULTURAL L ANDSCAPE THROUGH AGROECOLOGY
3736
INTERVENTION 3 BIOECONOMY AND BIO-BASED MATERIAL SScale the mechanical and chemical processing of agricultural and forest residues to produce bio-based materials for construction (and other industries)
Sectoral scope Forestry Agriculture Industry Construction
Synergy with GEF areas of operation
Food systems land use and reforestation Chemicals and waste Sustainable forest management
IPCC categories targeted
2 Industrial processes and product use3C1 Biomass burning3D1 Harvested wood products 4A Solid waste disposal4C Incineration and open burning of waste
3938
Deploying bio-based materials is about prioritising regenerative resources When targeting the substitution of carbon-intensive materials with bio-based alternatives the bioeconomy has significant GHG mitigation potential The focus of this intervention is on the use of bio-based materials Biomass as a fuel source is not included as it is already covered at large in the CDM and thereby also well on the radar of policymakers and businesses136
This intervention reduces GHG emissions along value chains This means that by designing for the future by switching to regenerative materials in the production of goods or the construction of buildings and infrastructure emissions from industries that supply the displaced carbon-intensive materials can be reduced
It is crucial that the sourcing of bio-based materials does not compete with food production or drive other adverse impacts like biodiversity loss soil depletion or deforestation Using waste as a resource reduces competition with other land uses sourcing bio-based materials from waste streams from the production of food and forestry products for example (see also Interventions four and five) In addition biomass could be sourced from sustainable forest plantations or algae farms137 or use mycelium as an alternative resource to produce leather-like material without resource-intensive animal farming packaging foam or even bricks138
Bio-based materials are often viewed as crucial for halting environmental and marine pollution caused by excessive consumption of plastic However only biodegradable or compostable bio-based materials can effectively reduce marine pollution These materials must also decompose in lower marine temperatures or be properly disposed of in industrial composting facilities139 Bio-based materials thereby predominantly target sourcing Addressing the waste issue requires further investment in the development and end-of-life collection and treatment of bio-based materials
3A STRATEGY DESCRIPTION
56 to 225 billion tonnes CO2e between 2020 and 2050 According to the IPCC the total reduction of GHG emissions from the use of wood and agricultural biomass for building textiles and other applications can account for between 75 and 30 billion tonnes CO2e between 2020 and 2050 On an annual basis that is 025 to 1 billion tonnes CO2e per year140 These figures have been adjusted for the share of industrial GHG emissions that stem from non-OECD countries This share is 75141
As an example of the measures included in this estimate in the construction sector replacing conventional construction materials with industrial wood products like cross laminated timber reduces the embodied carbon in materials and structures from approximately 300 to 550 kilograms CO2 per square metre and structures can sequester 08 to 09 tonnes CO2 per cubic metre142 Emissions from cement production alone are responsible for 4 of global GHG emissions from fossil fuel use143
3BGREENHOUSE GAS MITIGATION POTENTIAL
3CBUSINESS CASE POTENTIAL
3DCO-BENEFITS
High Building with cross-laminated timber is cost-competitivemdash144 only a few percent higher than using reinforced concrete and can significantly reduce construction time When combined with offsite construction buildings can be erected in a timeframe of a few months145 also because the lighter construction materials reduces the requirements for the foundation of the building Shortening the time in which loan interests and land tenure have to be paid without having a functional building in place has a positive effect on the internal rate of return146
The advantages of using prefabricated cross-laminated timber147 panels are also referenced for bamboo construction148 Next to delivering more sustainable buildings the modular rapid and safe on-site assembly reduces costs construction activity impacts and waste
Bio-based plastics and packaging can improve resource security and reduce exposure to price volatility or new regulations that address the negative externalities of conventional materials The Centre for Economics and Business Research (CEBR) estimates that the bio-plastics sector has the potential to meet the United Kingdomrsquos economic goals by unlocking job creation potential along the value chain increase the direct employment contribution from 1000 to 14400 full-time equivalents and increase gross value added from pound505 million (US$ 689 million) to approximately pound7646 million (US$ 104275 million)149
The construction sector is a major source of GHG emissions mainly due to its use of carbon-intensive materials like concrete and steel150 151 152 Where sustainably sourced bio-based products are used the sector and industries providing construction materials can become a net carbon sink153 254 rather than a major source In fact the use of carbon-sequestering wood in construction is a far more effective way to mitigate climate change than the use of wood as a fuel155
When applying modular design and design for disassembly wood products can easily be recovered and reused at the end of the buildingrsquos functional lifetime The reusability is affected by how the timber has been treated and how the building has been constructed154
Bamboo is a renewable material which grows fast and can be cultivated in plantations in many of the GEF countries of operation Moreover bamboo has been found to be suitable for land restoration in degraded ecosystems157 However it is important that there are strong guarantees in place that plantations do not contribute to deforestation or compete with land use for food production
The use of natural construction materials has physiological and psychological benefits to the health and wellbeing of the users of a building such as decreasing stress levels or improving an individualrsquos emotional state158 In urban environments the reduced construction time has financial benefits but also reduces noise pollution for nearby residents Additionally the buildings are lightweight and more resilient to calamities like fire and earthquakes159
4140
The substitution of fossil fuel-based materials with bio-based materials has purposes outside of the construction sector However some notes to consider
bull Such substitution decouples non-renewable fossil resources that contribute to GHG emissions during combustion
bull Some bio-based materials can be composted after their use closing the nutrient cycle However composting facilities are not always available
bull If bio-based materials are compostable they can help protect marine and terrestrial ecosystems by avoiding persistent litter and environmental pollution caused by fossil fuel-based materials like plastics Marine plastic debris has been proven to lead to the death of wildlife hence irreversibly reducing biodiversity160
Overall the bioeconomy holds the potential to preserve biodiversity generate higher revenues for farmers and foresters provide products with a lower carbon footprint and biodegrade and enrich rather than pollute ecosystems161
Economic and financial The cost of investing in the industrial capacity to produce bio-based materials might be prohibitive for low- to middle-income countries
Even though there are case studies where Cross-Laminated Timber (CLT) has proven to reduce investment costs compared to other structural materials162 the level of cost-competitiveness that CLT has in new constructions varies depending on the type and complexity of the project This is shown by the fact that other studies point towards the opposite direction Fanella (2018) study states that the use of traditional structural materials in new constructions such as reinforced concrete have proven to be more cost-competitive than using Cross-Laminated Timber (CLT)163 Therefore we can conclude that the financial feasibility and cost-competitiveness of CLT compared to other structural materials needs further exploration to incentivise an increasing uptake of this biobased materials
Next to this the uptake of bio-based packaging remains low Despite research development and investmentmdashincluding from the EUmdashinto bioeconomic material solutions bio-based plastics represented only between 05 and 1 of EU annual plastic consumption in 2017164 The reason is mostly financial a lack of economies of scale and not pricing the externalities of plastic pollution and fossil fuel use or even considering the end-of-life impact in Life Cycle Assessments Bio-based packaging is three to five times more expensive than fossil-based packaging materials165
Legal regulatory and institutional In some countries building codes do not allow for the application of wood at scale 166 167 168
Several of the GEF target countries suffer from deforestation The raw materials for bio-based materials should be responsibly sourced While in the Northern Hemisphere forest cover is increasing in the Southern Hemisphere it is not Legal and institutional safeguards need to be implemented to avoid further deforestation
3EBARRIERS
Strict regulations are in place for all materials used in food packaging in which case biomaterials are expected to perform equally or better than fossil-based plastics Therefore documentation is required on the presence of inorganic contaminants such as heavy metals persistent organic contaminants and their capacity to transfer from bio-based packaging into food170 Allergenicity of bio-based materials might also become an issue in some applications
Technological Biomass is often a seasonal product while fossil fuels are not Biomass production is also affected by climate change This makes the sustainable mobilisation of biomass more challenging In addition poor data on biomass availability and accessibility for example in Africa hinders businesses in setting up bio-based industries171
While bioplastics are widely seen as an attractive substitute for plastic packaging as they can be used with existing injection moulding equipment the sophistication of materials and applications still remains a technological barrier172
A long-term concern is lsquothat the continuous introduction of new engineered bio-based materials that are incompatible with existing industrial feedstocks could lead to the contamination of product waste streams thereby making recycling more difficult and consequently constraining the current push towards a more circular economy173
Cultural Cultural barriers in applying bio-based construction materials relate to two common misperceptions lower fire resistance and lower durability In fact thick layers of timber burn only on the outside Just as a forest fire seldom takes down large trees timber buildings burn at a slow and predictable rate174 while reinforced concrete collapses at high temperatures175 The durability of wood depends on whether the building structure keeps moisture out That does require sometimes that concrete is used for the foundation
3FENABLING CONDITIONS
Public awareness campaigns176 177 178 help inform people of the advantages of regenerative construction materials and bio-based alternatives to conventional polymers used in consumer products Coalitions of timber and construction companies as well as architects and engineers also support revisions of the building codes where needed179 Simultaneously alliances180 conferences and roundtables are held on the topic of biopolymers bioplastics and the bioeconomy in general to discuss and showcase examples aiming to push the boundaries of what is perceived to be possible Similar campaigns in low-income countries could help improve public perception of more traditional building materials
Financial support is being offered to expand research and development on material innovations to reduce the consumption of fossil fuels181
While the push from the private sector establishing communities of practice and raising awareness are indispensable policy remains a significant driver 19 dedicated national and macro-regional bioeconomy policy strategies have already been developed over the past decade182
Another enabler is the complementary availability of regenerative materials Bamboo is often found in rapidly developing areas of the world where often timber resources are limited183
4342
Pintildeatextrade is a leather alternative developed and commercialised by Ananas Anam Pintildeatextrade aims to meet the growing demand for leather but without the negative social and environmental impacts Instead of animal hides it uses waste pineapple leaves from pineapple farms Biogas and organic fertiliser are by-products of the Pintildeatexrsquostrade production process The product is applied in the apparel footwear furnishing car and aeronautic industries
Local cooperatives in the Philippines produce fibres from the leaves through decortication the extraction of biomass fibres Since the cooperatives produce a higher-value-added product the initiative grants farmers the chance to generate higher and more sustainable earnings As women are involved in the decortication of biomass the project also improves womenrsquos participation
The fibres are then industrially processed into a non-woven mesh textile at a local factory to produce the basis of Pintildeatex before being shipped to a finishing factory near Barcelona Spain The product allows for efficiency gainsmdashthe irregular shape of leather hides can result in up to 25 waste yet these losses for Pintildeatex are just 5 In addition Pintildeatex does not use chemicals from the Cradle-to-Cradle list of banned substances and the process is closed loop Residual leaf biomass is used as natural fertiliser or biofuel The non-woven Pintildeatexmesh is biodegradable184
CASE STUDY EX AMPLE BIOFIBRE FOR APPAREL AND AUTOMOTIVE INDUSTRIES LEATHER ALTERNATIVE MADE FROM PINEAPPLE WASTE PHILIPPINES
45
Sustainable design can turn the construction industry and built environment into a net carbon sink rather than a source of GHG emissions Locally harvested bamboo is used to build private homes at Ibukursquos green village in Indonesia for example
The bamboo is treated with a natural and reusable boron solution to ensure the long-term quality of the material The bamboo is then applied to different functions from structural to furniture functions The dwellings are based around radially located clusters of thick bamboo columns while smaller beams are used to make chairs
The environmental impact of the building is reduced through the application of regenerative construction materials as the long-term application of wood acts as a net carbon sink186 The shift to low-carbon construction is associated with an average reduction potential of 01 tonnes CO2e per capita per year187
For comparison when applying cross laminated timber each cubic metre of wood sequesters an average of 08 to 09 tonnes CO2
188 Further benefits of applying bamboo in the case of Ibukursquos green village is that local craftsmen and construction workers can work with bamboo
Barriers remain as well since the use of non-bio-based resins glues and artificial preservatives in particular in engineered bamboo materials and composites can make products unfit for recycling or upcycling
CASE STUDY EX AMPLE IBUKUrsquoS GREEN VILL AGE COMMUNIT Y 181
SUSTAINABLE BUILDINGS USING TRADITIONAL CONSTRUCTION TECHNIQUES INDONESIA
4544
INTERVENTION 4 REDUCING FOOD LOSSES FROM HARVEST TO PROCESSINGEnhance harvest methods and timing and improve the capacity to safely store transport and process food products
THIS INTERVENTION IN CONTEX T
This intervention aims to avoid food losses which refer to food lost in the early phases of the food value chain before it reaches the retailer or consumer For a discussion on avoiding food wastemdashor unused food at the retail and consumption levelsmdashsee Intervention five Where waste is unavoidable it is used as a resource through the solutions proposed in Intervention six Where losses at the farm level are unavoidable they are used as a resource through the agricultural practices in Intervention two
Sectoral scope Waste management Agriculture Food processing Land use
Synergy with GEF areas of operation
Biodiversity Climate change Food systems land use and restoration International waters
IPCC categories targeted
3B Land 3C Aggregate sources and non-CO2 emissions sources on land 2B Chemical industry 2H Other industries
4746
48
Food loss and waste are estimated to be responsible for 8 of global emissions189 In Africa and Central Asia 36 of food is lost and wasted For Asia this value is between 26 and 31 and for Latin America 34 In all these regions more than half of the losses occur in the production handling storage and processing stages in the food value chain For example in Sub-Saharan Africa 13 of the harvest is lost at the farm stage during or just after harvest Another 36 is lost during handling and storage 3 during processing 6 during distribution and retail and 5 at the consumer stage This makes a total value chain loss of 36190
Food losses are caused mainly by poor storage facilities and lack of infrastructure lack of processing facilities demand uncertainties and inadequate market linkages191 192 As a result solutions to reduce losses involve preserving and extending whatrsquos already made through storage and handling solutions that limit crop exposure to moisture heat and pest infestationmdashfor example hermetic bags metal silos or gum arabic coating that prevents the ripening of fruits and vegetables193 Processing solutions can also be implemented specifically those which limit the handling and transportation of raw crops and that increase their shelf life like mobile processing units solar dryers graters and pressers194 Solutions also involve collaborating to create joint value through improvement of procurement channels to allow for the efficient transfer of crops from producers and agro-processors to consumersmdashfor example through the use of technology platforms that connect farmers and potential buyers or through contract farming direct sourcing or collection centres195
9 to 51 billion tonnes CO2e between 2020 and 2050 for industrialised Asia North Africa West and Central Africa Latin America South and Southeast Asia and Sub-Saharan Africa This value is based on the global figures from the IPCC which have been downsized to the specific geographies covered by the GEF196 By reducing food loss emissions from the production of food that does not reach the consumer are avoided In addition emissions from the disposal of organic waste in landfills dumpsites or surface waters are reduced This range is consistent although at the lower end of the 87 to 95 billion tonnes CO2e for the 2020ndash2050 global estimate of the mitigation potential from food waste and losses taken together by Project Drawdown According to Project Drawdown reducing food waste and losses is the mitigation option with the largest global potential197
The estimated emissions mitigation potential associated with reducing food losses and waste from the 2019 IPCC special report on Climate Change and Land198 can be split across different stages of the value chain199 This global figure was further scaled-down to GEF countries of operation by excluding nations in Europe North America and Oceania First total food loss and waste was calculated per region based on per capita figures from 2007200 201 As per capita figures do not distinguish between losses and waste data from the WRI was used to split these figures proportionally202
4A STRATEGY DESCRIPTION
4BGREENHOUSE GAS MITIGATION POTENTIAL
Mediumhigh Reducing food losses can be economically feasible for all actors along the supply chain203 204 201 The annual market value of the food that is lost and wasted along the full value chain is estimated at US$940 billion206 approximately half of which relates to food losses and half to food waste (Intervention five) Project Drawdown estimates the global economic environmental and social cost of food loss and waste at US$26 trillion207
Post-harvest loss solutions vary in their cost-effectiveness Solutions with the highest return on investment (where returns also include social and environmental returns such as advancing health or securing livelihoods) include 1) storage and transport solutions that are relatively inexpensive to manufacture andor procure but with significant post-harvest loss reduction gains and 2) the expansion of procurement channels208
Reducing food losses from harvest to processing improves the overall efficiency of the food value chain This reduces GHG emissions and improves climate resilience The latter is important since avoiding losses allows food systems to increase the volumes that reach the consumer without increasing the need for land or other agricultural resources like labour mechanical operations and agrochemicals
Reducing food losses in turn reduces the need to allocate land to the production of food products that never reach the consumer209 As such avoiding food loss helps protect terrestrial ecosystems preserve biodiversity and prevent further degradation of land Where agricultural systems rely on agrochemicals it could also reduce chemicals and waste
Estimates indicate that reducing the current rate of food loss and waste by 50 by 2050 would prevent the conversion of an area of natural ecosystems roughly the size of Argentina into agricultural land between 2010 and 2050210 Since agriculture irrigation accounts for 70 of global water use211 halving food loss and waste by 2050 would also reduce freshwater use by about 13212 and enhance water security
Furthermore food security could be improved as a lack of access to food is often related to availability Preventing food losses at the local level in smallholder production would have the biggest impact alleviating food shortages increasing farmersrsquo incomes and improving access213 Reducing food loss and waste by 50 by 2050 would close the gap between food needed in 2050 and food available in 2010 by more than 20214
The socio-economic benefits for stakeholders along the value chain are derived from the fact that reducing losses increases income since a larger share of the harvest or processed food volumes reaches the market215 216 However the impact on job creation is expected to be modest217
4CBUSINESS CASE POTENTIAL
4DCO-BENEFITS
4948
50
Economic and financial Farmers often lack funding to invest in reducing food losses and lengthening the shelf-life of their products For the larger food processing companies this is less of an issue Additionally data or case evidence that demonstrates the potential or impact of investments in reducing food losses is often lacking218 Low food prices are another barrier to investments219 Costs and savings vary considerably across geographies220 Once stakeholders are aware of the opportunity and have been provided access to finance and technical means they often take voluntary action Legal regulatory and institutional Food losses between harvest and processing is seldom a political priority even though the co-benefits related to food security and the environment are often featured high on the political agenda
Technological Food losses require an investment in storage capacity market information to better match supply and demand and sometimes additional processing steps to preserve the food longer These are typically readily available technologies but can be difficult to access in some regions for example where agriculture is dominated by smallholders
Cultural As peoplersquos disposable income rises the focus of the losses tends to shift from farmers and processing to retail and consumers thus increasing disposable income is a way to reduce food losses In fact since many GEF target countries have a growing middle class investments are required to reduce losses and avoid the growth of food waste
Initiatives to reduce food losses that go hand-in-hand with investments to improve production like regenerative agriculture and nutrient management is an enabling factor Such a value chain approach which involves all steps in the food value chain can also secure higher revenues when a larger share of the harvest reaches the market and thereby is more likely to be successful
Since there are large differences across geo-graphies in the costs and savings of interventions to reduce food losses demonstration projects should showcase the relevance and effectiveness of particular approaches in a specific region
As food losses are especially high in regions that periodically suffer from food deficits reducing food losses should be higher on the political agenda Capacity building and awareness raising can help connect food losses with food security and secure more political attention and stake-holder support
There is also an ethical angle to reducing food waste Many people consider it to be simply lsquothe right thing to dorsquo in a world where many people still suffer from malnourishment221 This helps build political momentum awareness and behavioral change and eases access to funding for initiatives that target food waste and losses
4EBARRIERS 4FENABLING CONDITIONS
ColdHubs is a post-harvest solar-powered cooling-as-service solution in Nigeria By offering a solution to store and preserve perishable foods that adequately meet the financing needs of smallholder farmers ColdHubs is an effective solution to the issue of post-harvest losses in fruits vegetables and other perishable foods in Sub-Saharan Africa
ColdHubs are installed in major food production and consumption centres (markets and farms) There farmers place their produce in clean plastic crates which are stacked inside the cold room Farmers and retailers pay ₦100 (US$050) to store one 20 kilogram returnable plastic crate per day222 This extends the freshness of fruits vegetables and other perishable food from two days to about 21 days223
In 2019 the 24 operational ColdHubs saved 20400 tonnes of food from spoilage increased the household income of their customers (3517 smallholders retailers and wholesalers) by 50 created 48 new jobs for women and mitigated 462 tonnes of CO2 emissions with an annual energy consumption reduction of 547 kilowatt-hours224 225
ColdHubs offers farmers a flexible pay-as-you-store subscription model at rates that they can afford helping to tackle the barrier of access to financing for cold chain solutions
CASE STUDY EX AMPLE COLDHUBS SOL AR-POWERED COOLING-AS-A-SERVICE SOLUTION
5150
52
INTERVENTION 5 AVOIDING FOOD WASTE AT THE RE TAILER AND CONSUMER STAGESReduce food waste through improved inventory management the development of secondary markets for imperfect food products or products near their expiry date and improved value chain management
THIS INTERVENTION IN CONTEX T
This intervention aims to prevent food waste and relates to the latter phases of the food value chainretail and consumption For a discussion on avoiding food losses in the earlier phases of the value chain see Intervention four Where waste is unavoidable it is used as a resource through the solutions proposed in Intervention six Where losses at the farm level are unavoidable they are used as a resource through the agricultural practices in Intervention two
Sectoral scope Waste management Agriculture Food processing Land use
Synergy with GEF areas of operation
Biodiversity Climate change Food systems land use and restoration International waters
IPCC categories targeted
3A Livestock Land 3C Aggregate sources and non-CO2 emissions sources on land 2H2 Food and beverages industry 4 Waste
5352
Food production is responsible for 26 of global emissions226 but a third of all food does not reach the consumer In Latin America North Africa and the Middle East food waste at the retail and consumer stages is responsible for 30 of all food losses and waste For Sub-Saharan Africa this figure is only 5 to 13 while for high-income countries it reaches 50 to 60227
Preventing food waste requires collaboration to create joint value in particular across food value chains For the production of food a range of scarce resources are used including seeds water energy land chemicals and labour thus ensuring these products actually feed people is a more effective use of resources
Preventing food waste involves most key elements of the circular economy It requires rethinking the business model to sustain and preserve whatrsquos already made through the development of markets for surplus food products nearing their expiry dates or imperfect products and by integrating these into food business menu planning product lines and marketing Collaborating to create joint value also has a key role through collaboration within the supply chain on standardised date labelling and consumer education campaigns while discouraging retail marketing campaigns aimed at purchasing excessive volumes of food from retailers such as discounts on large quantities Designing for the future and for minimal waste come into play through improved packaging and coatings perhaps allowing for resealable and reusable packaging Finally digital technology must be incorporated to improve inventory management and prevent waste due to mistakes in logistics planning forecasting and cold chain management at the retail level228
5A STRATEGY DESCRIPTION
57 to 32 billion tonnes CO2e between 2020 and 2030 for industrialised Asia North Africa West and Central Africa Latin America South and Southeast Asia and Sub-Saharan Africa229 230
As in the previous intervention this range is also consistent although at the lower end of the 87 to 95 billion tonnes CO2e for the 2020ndash2050 global mitigation potential estimate for food waste and losses from Project Drawdown231 The estimated emissions mitigation potential associated with reducing food losses and waste from the 2019 IPCC special report on Climate Change and Land232 can be split across different stages of the value chain233 This global figure was further scaled-down to GEF countries of operation by excluding nations in Europe North America and Oceania First total food loss and waste was calculated per region based on per capita figures from 2007234 235 As per capita figures do not distinguish between losses and waste data from the WRI was used to split these figures proportionally236
5BGREENHOUSE GAS MITIGATION POTENTIAL
5CBUSINESS CASE POTENTIAL
5DCO-BENEFITS
High Reducing food waste is often a positive financial opportunity for all actors along the supply chain237 238 Investments in food waste reduction are often incentivised by legal obligations also when they are not commercially attractive This may hamper long-term adoption and commitment239
The co-benefits of reducing food waste largely overlap with those from reducing food losses Although the strategies intervene in different parts of the value chain their co-benefits mostly relate to improving overall value chain efficiency and thereby reducing the environmental impact of agricultural production
In brief cutting food waste at retail and consumption stages reduces GHG emissions and improves climate resilience and food security It also reduces the need to allocate land to the production of food products that never reach the consumer240 and thereby supports biodiversity preventing further degradation of land and reducing the application of agrochemicals In addition as the irrigation of agricultural land accounts for 70 of global water use241 reducing food waste can enhance water security in freshwater systems242
Initiatives that connect leftover food with demand can also create new job opportunities and improve food security by providing low-income consumers with access to high-quality food products at a reduced price as illustrated in the Tekeya case study
5554
Enablers are political will and the use of public-private partnerships Governments will need to seek collaborations with the private sectormdashincluding national agriculture and environment agencies research institutions and food businesses from producers and manufacturers to retailers restaurants and hospitality companiesmdashto tackle food loss and waste Such partnerships are important to support collaboration along the entire food supply chain identify hotspots for action and implement supportive public policies to address them245
Next to this it is important that governments involve the private sector in policymaking involving the full range of government bodies that oversee agriculture environment public health and nutrition
Startups can also play an important facilitating role in matching residual food with demand Initiatives that support startups and provide access to office spaces financing and perhaps workshops can help address the socio-economic and environmental issues that some startups target
Economic and financial It is difficult to get funding for activities that target reductions in food waste at retail and consumer levels because there is often not enough data to quantify impact243 In some cases the investments in reducing food waste donrsquot pay off which is also related to food productsrsquo low prices Finally in some cases retailers are reluctant to donate residual food for fear of food poisoning when expiry date margins are small244
Legal regulatory and institutional In many countries food waste from retail and consumers is a new issue emerging from increasing incomes It is often not a political priority despite its co-benefits with high political prioritiesmdashthe income levels of large numbers of smallholder farmers and food security
Technological Food waste is not a very technical issue Most of the technology required is available but underutilised Educating retailers and consumers on food waste is important to increase awareness
Cultural As peoplersquos disposable income rises food waste increases In some cultures offering large volumes of food to visitors is associated with hospitality or status There are also perceptions that reducing food waste reduces farmersrsquo income Producing excess volumes of food is sometimes also considered an insurance whereby losses are factored in as a mere lsquocost of doing businessrsquo
5FENABLINGCONDITIONS
5EBARRIERS
In the Middle East and North Africa food waste at the consumption level amounts to roughly 85 kilograms per person per year246 Tekeya is a mobile app that connects hotels restaurants and retailers that have leftover food with consumers who want to order fresh food at a reduced price The app also connects businesses with charity organisations so that any unsold surplus food at the end of the day is donated to those in need247
The Tekeya app targets unserved ready meals or baked goods in restaurants previously refrigerated items or uneaten buffet servings Some users use the app to donate food to those in need while others use it to sell food products that are close to their expiry date at a reduced price248 The app also enables food businesses to estimate their waste and presents suggestions on how to reduce it249
The application does not rely on donations and has its own business model and revenue streams250 It also offers an additional revenue stream for food companies which can sell food that would have otherwise been thrown away The app also creates valuable brand exposure and public awareness of the issue of food waste251 After its initial success it is being expanded to several provinces in Egypt There are plans to expand further into the rest of the Middle East and the North African region252 253 Similar business models exist in Europe and have succeeded at scale such as Too Good to Go254
The app was launched in 2019255 and is already working with 405 businesses in Egypt has saved 3800 meals and prevented 95 tonnes of CO2 emissions The founder of Tekeya indicated that there are cultural barriers to using food waste256 357 358 while initially restaurants feared reputation damage from using the app this perception has changed and they now see the positive exposure it creates259
CASE STUDY EX AMPLE TEKEYA APP REDISTRIBUTING SURPLUS FO OD TO CONSUMERS AND CHARITIES IN EGYPT
5756
INTERVENTION 6 CLOSING THE LOOP ON URBAN ORGANIC RESIDUESRecover and separate organic residues from urban solid waste and wastewater for composting biogas production water and nutrient recovery to support urban and peri-urban farming
THIS INTERVENTION IN CONTEX T
The solutions in this intervention address food waste in the city They are end-of-life solutions that should be considered last after the solutions outlined in Interventions four and five The latter help to reduce food losses earlier in the value chain and to prevent food from becoming waste altogether Where food losses at the farm level are unavoidable they are used as a resource through the agricultural practices in Intervention two
Sectoral scope Waste management
Synergy with GEF areas of operation
Food systems land use and restoration Climate change Sustainable cities International waters Chemicals and waste
IPCC categories targeted
4A Solid waste disposal4B Biological treatment of solid waste4C Incineration and open burning of waste4D Wastewater treatment and discharge
5958
The anaerobic decomposition of organic material in landfills and dumpsites is responsible for 12 of global methane emissions260 and GEF countries of operation are the origin of more than half of these emissions261 262
Under business-as-usual these figures are set to increase Waste disposal tends to rise concurrently with income and population levels The daily per capita waste generation figures for low- and middle-income countries are expected to increase by approximately 40 or more in 2050263 This is especially problematic as low-income countries only collect 48 of waste in cities and as little as 26 outside of urban areas264
This intervention aims to prevent the disposal of valuable organic materials water and nutrients By using organic waste and wastewater as a resource through composting anaerobic digestion wastewater reuse and wastewater nutrient recovery cities can divert such waste from landfills and dumpsites One of the strategies of nutrient recycling is phosphorus recovery The recovery of this essential plant nutrient from organic residues can mitigate the negative consequences of mineral phosphorus application for ecosystems including loss of biodiversity due to eutrophication In the long-term it may prevent increased food prices due to lsquophosphorus peakrsquo265
These processes also facilitate the production organic fertilisers which when compliant with regulations can be safely returned to urban and peri-urban farms to regenerate soils266 allowing for the prioritisation of regenerative resources This lowers the demand for synthetic fertilisers and fossil fuels thereby reducing the emissions associated with their production and application Under the right conditions the reuse of wastewatermdashfor example to irrigate cropsmdashcan also serve a similar purpose by reducing the
amount of energy that would have otherwise been required to treat water and bring it to a potable standard267
A key prerequisite for these processes is the effective collection of separated uncontaminated organic streams and wastewater268 The infra-structure and logistics to support this can vary in scale and level of decentralisation They cover household level backyard or community composting to large-scale industrial anaerobic digesters from augmenting existing centralised waste-treatment plants with additional pipelines for delivering recycled water269 to decentralised networks of urban metabolic hubs that harness clean water energy nutrients and minerals from wastewater and organic waste such as the Biopolus270 Finally working on both creating a supply of organic fertilisers and on stimulating the demand for these fertilisers through urban and peri-urban farming (UPAF) allows the creation of local closed-loop urban systems that bypass the need for long-distance transportation and its associated emissions These small-scale local loops also have other advantages for example making these processes more cost-effective as they become more economically feasible if the point of (re)use is closer to the point of production271 272
6A STRATEGY DESCRIPTION
15 to 22 billion tonnes CO2e in the 2020 to 2050 timeframe This estimate is based on the global mitigation potential of composting urban organic waste that is largely being managed today via landfills and in some regions open dumping 214 to 313 billion tonnes CO2e
273 between 2020 and 2050 This global figure was corrected for the estimated 70 of global methane emissions from waste management stemming from East Asia and Pacific Latin America and the Caribbean the Middle East North Africa and Sub-Saharan Africa geographies that largely overlap with the GEF countries of operation274 Since the countries with an economy in transition are not yet included in the 70 the actual figure is likely to be even slightly higher Urban agriculture can mitigate emissions mainly by reducing urban heat island effects275 and the substitution of food from lsquonormalrsquo food supply systems276 which rely on the assumption that reduced food miles also reduce the systemrsquos overall carbon footprint However this is not always the case as some urban food systems are less efficient than conventional ones and might require more energy to sustain themselves277 278 Another understudied factor is the (potentially) positive relationship between urban agriculture and composting More data is needed to evaluate the net emissions savings of urban agriculture in developing countries and cities Developing indicators and monitoring frameworks to better understand the actual contributions of urban agriculture to climate change adaptation mitigation and disaster risk reduction are also needed279
6BGREENHOUSE GAS MITIGATION POTENTIAL
6CBUSINESS CASE POTENTIAL
Low The investment is more or less on par with the monetary savings over a 30 years timeline Composting requires an investment of US$64 billion worldwide while saving US$61 billion between 2020 and 2050280
6160
6DCO-BENEFITS
by minimising water pollution and recharging depleted aquifers289
If a business model is found organic waste management can also create jobs This ranges from the separate collection of organic waste to the supply of decentralised or centralised composting or anaerobic digestion facilities their operation and the commercial use of biogas as an energy source When job creation is coupled with a business model that allows for improved working conditions peoplersquos livelihoods can improve Urban agriculture favours social improvement as the poor spend up to 85 of their income on food and most urban farmers belong to the poorest populations290
Next to reducing GHG emissions from the decomposition of organic waste in landfills the collection and processing of urban organic waste can also improve climate resilience This is because soil application of compost or digester sludge helps improve soil fertility soil life and water retention
Urban and peri-urban farming can help to build resilient urban food systems at the city or regional level with positive impacts on food security281 health urban environmental management social inclusion community building and local economic development282 283
Agricultural production in cities for example often provides the poorest of the urban poor with greater access to safe and nutritional food which in turn helps improve their health284 It also favours social inclusion and the reduction of gender inequalities as 65 of urban farmers are women285
Diverting waste from landfills increases the lifespan of waste disposal facilities which saves valuable land resources Nutrient recovery from wastewater also offers a sustainable alternative to scarce resources with extractable mineral phosphorus resources predicted to become insufficient or even exhausted over the next decades286
The accumulation of methane in landfills is also a safety and health risk for people working and sometimes living at or near the landfill as landfills are more likely to catch fire287 due to the spontaneous combustion of decomposing waste involving methane Removing organic matter from the waste stream also reduces odor nuisance and enhances recycling and waste management operations288
Reduced landfilling of organic material will also reduce leachate from landfills which enhances water security and groundwater systems The reuse of wastewater for agriculture provides a similar ecosystem service as it reduces the need for freshwater abstractions and allows fisheries and other aquatic ecosystems to thrive
Economic and financial Organic waste management initiatives face difficulties in securing finance The revenue generated from the sale of compost will rarely cover processing transportation and application costs and often an adequate marketing plan is lacking for the compost This is not helped by the poor accounting for negative externalities such as methane emissions from landfilling organic waste nor costs related to diverting organic waste from processing and use as a fertiliser and soil enhancer291 the abstraction of freshwater292 soil degradation and erosion water contamination climate change and waste disposal costs
The rapid growth of cities in developing countries also leads to land value increases that limit land access for urban farmers who often occupy marginal lands with low fertility Other than limiting their productivity these lands also strongly reduce the choice of species they can cultivate293
Technological The lack of reliable data hampers proper waste management and planning City administrations often donrsquot know how much waste they generate nor its composition Furthermore informal waste collection by waste pickers is seldom a very effective way to collect and sort waste294
The current lack of infrastructure for collection and treatment is one of the main challenges facing improved wastewater management and the expansion of urban farming in developing countries295 296 As cities expand quickly they struggle to keep up with the demand for municipal services As a result the level of air soil and water pollution in cities makes growing healthy food more difficult as the risk of contamination is higher
Other technical barriers relate to the strong emphasis placed on mechanical rather than biological treatment of waste the use of inadequate feedstock which yields poor quality finished compost for example heavy metal contamination297
Legal regulatory and institutional Since waste collection is often part of the informal sectors in low- and middle-income countries proper data on waste volumes is often lacking and workers operate outside the health safety and income legislation which should protect their rights Formalising workers at landfills is often required to make landfill management safe
6EBARRIERS
6362
64
Organic waste is a valuable resource which can be used to improve soil quality This inturn can increase agricultural and biogas production This could reduce the import of fossil-based fuels and fertilisers On the flip side composting can be initiated with very little capital and operating costs298
The political will is often there but might compete with the more pressing need to provide adequate waste collection Separate organic waste collection299 and overall solid waste management both tend to be high on the political agenda300 as many urban and rural residents are exposed to the adverse impact of inadequate waste management systems301
Proposed waste management solutions need to consider many factors to be successful302 how to engage with citizens and communicate about the initiative for example but also various logistics aspects These range from how ambient temperatures will impact collection frequency to whether collection bags are provided to people for free or at a fee
Careful consideration of the interests of different stakeholder groups is also important The use of cooperatives for example can provide legal protection to workers involved in waste collection and improve data collection Private sector participation can create a market for organic soil enhancer from compost or digester sludge Where there is no waste collection in place community initiatives can be an alternative form of organisation In this case decentralised composting facilities can provide a soil enhancer for gardens parks or for sale
6FENABLING CONDITIONS
Decentralised composting yards collecting and composting organic waste from street markets and households
Satildeo Paulo Brazil has 883 street markets which generate 34000 tonnes of organic waste per year The municipality generates an additional 39000 tonnes from tree and plant pruning A system of decentralised composting locations allows Satildeo Paulo to divert organic waste from landfills and produce compost The composting facilities or lsquoyardsrsquo handle up to 50 tonnes of waste a day and in 2018 were estimated to prevent about 1920 tonnes of CO2e emissions annually303 As a result compost from street markets is used in the maintenance of public spaces in the city However these maintenance activities were estimated not to be enough at the moment to absorb 100 of the compost production foreseen in the cityrsquos Integrated Solid Waste Management Plan304 so compost is also sometimes given away for free to visitors The project also includes an urban garden programme in which citizens are encouraged to grow their own food305
The implementation of the project was one of piloting and careful upscaling When experience with the first composting yard was positive five more were opened The capacity of these six yards is around 15000 tonnes of organic waste per year306
The composting yards have an educational purpose since they enable citizens to familiarise themselves with the process of composting and the importance of organic matter for food production Composting facilities are regularly visited by schools local authorities and people interested in gardening and compost use One of the facilities also has a plant nursery
The initiative also has health benefits as waste collection at markets has improved supported by special bags made available by the composition yards The project creates employment since each composting yard employs four to five staff In addition the centralised location of the yards close to the markets reduces waste logistics in the city307
Important lessons have been learned from the project The quality of the compost is important to effectively use it as a soil enhancer for parks and food production To produce compost of high quality the feedstock needs to be clean This requires educating the market staff to make sure there is proper source separation in place The decision to realise small-scale composting facilities first allows for the local population to get closer to the production of compost Other lessons learned relate to the low-tech nature of the solution It did not require big investments and can be quickly deployed and scaled308
CASE STUDY EX AMPLE COMPOSTING IN SAtildeO PAULO
6564
INTERVENTION 7REDESIGN REUSE REPAIR AND REMANUFAC TURE OF PRODUC TS AND RECYCLING OF GL ASS PAPER ME TAL S AND PL ASTICS Enhance the collection sorting and processing of materials and recyclables diverting waste from landfills and incineration to increase the availability of secondary resources
Sectoral scope Solid waste management Industry Consumer goods and packaging
Synergy with GEF areas of operation
Climate change Sustainable cities Chemicals and wastersquo International waters
IPCC categories targeted
2A3 Glass production2C3 Aluminium production 2H1 Pulp and paper industry 4A Solid waste disposal4B Biological treatment of solid waste4C Incineration and open burning of waste
6766
REDESIGN REUSE REPAIR AND REMANUFACTURE OF PRODUCTS AND RECYCLING OF GL ASS PAPER METALS AND PL ASTICS
Recycling and designing for circularity reduces primary resource extraction and related CO2 emissions throughout the value chain
Note that the flows in this graph are indicative only and aim to illustrate extreme opposite scenarios
Figure 4 Value chain mapping in circular and linear scenarios
WA S T E M A N A G E M E N T S Y S T E M
C O 2
C O 2
C O 2
C H 4
U S EP R O C E S S S O R T I N GP R O V I D E
R e u s e
R e p a i r
R e c y c l e d f e e d s t o c k
R E C YC L I N G
I N D U S T R Y
C O 2
E X T R A C T E D R E S O U R C E S VA L U E C H A I N
S o l i d w a s t e
C O L L E C T I O N
L A N D F I L L
O R D U M P S I T E
I N C I N E R AT I O N
O R B U R N I N G
P R O D U C E
M I N E R A L S B I O M A S SF O S S I L F U E L S E M I S S I O N S
L I N E A R I M P O R TA N T
C I R C U L A R M O D E R AT E
M I N I M A L
I N P U T S amp O U T P U T S R E S O U R C E amp E M I S S I O N S F L OW S
6968
The global solid waste volume is 201 billion tonnes annually309 In low-income countries materials that could be recycled like paper cardboard plastic metal and glass account for 20 of the waste stream310 However the fastest-growing regions are Sub-Saharan Africa South Asia and the Middle East and North Africa where by 2050 total waste generation (not just that of recyclables) is expected to more than triple double and double respectively311
Recycling taps into using waste as a resource It reduces the volume of waste while on the other hand provides secondary raw materials to substitute primary extraction 62 of global GHG emissions stem from the extraction processing and production of materials and fuels312 Next to this 70 of global GHG stems from material management313 Next to this the carbon footprint of nearly all recycled materials is lower than that of similar products and materials from primary resources314 However the use of secondary resources is only a means to reduce GHG emissions if options for reuse remanufacturing and repair have been depleted and the separation of materials is accurate and the recycling well-organised315 The reduction in the extraction of virgin raw materials can help bring down global GHG emissions while reducing the volumes of waste going to landfill dumpsites or being combusted
The extent to which product and material lifecycles can be extended depends on whether they are designed for the future and existing enablers for reuse remanufacturing and repair If products are designed for disassembly for example or if they do not contain hazardous materials recycling is easier and safer Some GEF countries of operation produce substantial amounts of materials for domestic use and exports Importing countries can adopt standards and legislation requiring that imported goods and materials can be recycled
This intervention partly overlaps with the previous as both interventions require the separate collection and sorting of waste The opportunities also show synergies where the collection of waste and recyclables involves an informal workforce and thereby represents an opportunity for the empowerment inclusion and improvement of working conditions of the labour force
7ASTRATEGY DESCRIPTION
50 to 60 billion tonnes CO2e between 2020 and 2050 globally This includes the global figures for recycling of household and industrial waste other than paper and organic waste (550 billion tonnes CO2e globally) and recycled paper with a global mitigation potential of 110 to 195 billion tonnes CO2e between 2020 and 2050316 These figures have been adjusted for the share of industrial GHG emissions that stem from non-OECD countries This share is 75317
7BGREENHOUSE GAS MITIGATION POTENTIAL
7CBUSINESS CASE POTENTIAL
Mediumhigh The recovery and processing of industrial and household waste excluding paper requires a global investment of around US$11 billion while saving operational costs of US$238 billion between 2020 and 2050318 For paper recycling these figures are unavailable
7170
Economic and financial Municipalities often lack the means to invest in and operate a solid waste management system which is formalised offers safe and healthy working conditions and a decent salary
Legal regulatory and institutional An informal workforce manages most waste flows in low- and middle-income countries Alongside this a lack of capacity to enforce waste legislation makes it difficult to put a price on waste or a penalty on pollution even if such measures would create an incentive for recycling
The informal status of workers in waste management is a barrier to the social acceptance of their activities as a legitimate economic activity There remains a debate on the best way to resolve this by formalisation integration or professionalisation The OECD notes that lsquothe best-functioning systems are those which embrace an open strategy that includes both informal collectors and the existing value chain enterprises in the systemrsquo325 In practice it may require a combination of formalisation integration and professionalisation depending on the specific context326 327
On the other end of the value chain legislation might also hamper recycling efforts This occurs when the classification of waste inhibits its processing for example legislation on the processing of hazardous waste which hinders its recycling328 However simply abolishing this legislation may re-open the door for low-cost but improper disposal or treatment Furthermore some product standards do not allow or encourage the use of recycled content329 This is an issue mainly in food packaging where food safety needs to be safeguarded
Technological Without having a proper waste collection system in place cities lack information on waste volumes and composition making it difficult to oversee the value that is lost due to the untapped recycling potential
7EBARRIERS7DCO-BENEFITS
The recycling of glass plastics metals and paper reduces GHG emissions from primary resource use In addition the improved collection and sorting of waste as well as improved disposal in sanitary landfill can help reduce environmental impacts from unregulated disposal and open burning Dumpsites and the burning of waste can cause soil degradation freshwater and air pollution319 320 321 with toxic chemicals and persistent organic pollutants (POPs) These materials cause health issues when they accumulate in fauna and flora and along the food chain322
Furthermore recycling helps reduce waste flows going to landfills thereby prolonging their lifetime323 When organising waste collection and sorting it can help improve labour conditions notably health and safety and create new jobs Since the unregulated disposal of plastics in waterways causes these waterways to block recycling can also improve climate resilience by keeping drainage canals and rivers open324
This information is important for developing a business case for collection sorting and recycling
Looking at the technical cycle plastic recycling is hindered by the health risks posed by toxic chemical additives including POPs330 Similar issues occur in textiles where the lack of traceability of most textiles available for recycling carries the risk of re-introducing materials into the market that could pose a threat to product safety due to chemical contamination331 In the EU for example the Registration Evaluation Authorization and Restriction of Chemicals (REACH) safety regulations aim to regulate the use of harmful chemicals in products332
Technology can also pose barriers to recycling Waste incineration can create a lock-in effect whereby the available capacity needs to be properly used333 Plastics for example have a relatively high calorific value sometimes exceeding that of dry wood or coal334 which makes them a valuable fuel for waste incinerators
Cultural Development projects often try to address urgent waste issues in low- and middle-income countries Many projects however fail to understand the whole waste management processmdashwhich should be the projectrsquos starting point Next to this the implementation timeframe is often too short to allow instructions and stakeholders to develop along with the solution presented and thereby ensure adoption ownership and project permanence
Successful waste management and recycling initiatives are enabled with data collection capacity building and funding Data collection is important for understanding the volume and composition of waste flows but also for overseeing and understanding the role of formal and informal stakeholders in the waste sector Capacity is required to allow municipalities or waste management entities to develop business models that help develop long-term perspectives and attract financing Important financial enablers of functioning waste management and recycling systems are schemes that provide a sustainable revenue source An example is Extended Producer Responsibility whereby the producer is responsible for the proper management of the waste its products or services generate Such a scheme should be set up to encourage producers to design out waste altogether
Middlemen can divert revenues from the sale of recyclable materials away from those that do the waste collection and sorting Organising waste pickers in cooperatives can enhance their bargaining power and give them direct access to the demand for recyclable materials Besides a well-organised waste management system can also attract new private sector initiatives as a more reliable flow of recyclable material becomes available A cooperative also allows workers to register and obtain a safe workplace and perhaps more job satisfaction They may even gain the status of civil servant
Cooperative members consistently report a higher standard of living as well as improvements in self-esteem and self-reliance compared to when they work independently In addition organised workers are more productive and are healthier when provided with guaranteed collection routes and safe workingconditions outside of dumpsites335
7FENABLING CONDITIONS
7372
Cooperative SWaCH provides doorstep waste collection repair and recycling services in Pune India
In 1993 waste pickers and itinerant waste buyers in Pune and Pimpri Chinchwad formed a membership-based trade union This formalised waste pickers allowing them to access insurance loans and educational support for their children In 2005 the union collaborated with Pune Municipal Corporation to integrate waste pickers in the door-to-door waste collection system which further solidified their status It also led to the establishment of a workersrsquo cooperative fully owned by its employees called SWaCH Its board comprises waste pickers and municipal and union representatives
Since 2008 SWaCH provides a decentralised door-to-door collection of solid waste whereby recyclable and organic materials are separated The remaining non-recyclable fraction is dropped off at municipal lsquofeeder pointsrsquo from which municipal garbage trucks carry it to landfill This system is more cost-effective for the municipality as it saves the costs of waste collection and reduces the volumes that go to landfill
SWaCH collects over 850 tonnes of municipal solid waste per day of which around 150 tonnes is recycled and 130 tonnes is composted The organisation currently supports further waste separation since it installed e-waste collection points in private and government organisations schools and colleges Citizens can also drop off their e-waste at the SWaCH offices or opt to have it collected directly from home Where possible the e-waste is repaired and sold again while the remainder is dismantled and recycled
In 2018 SWaCH reported that it collects 398580 tonnes of waste annually of which 71744 tonnes are diverted from landfills As such the organisation contributes to a reduction of landfill gas emissions of 184609 tonnes CO2e while reducing energy use by 1793036 million British thermal units336
CASE STUDY EX AMPLE A PUBLIC-PRIVATE WASTE MANAGEMENT COOPERATIVE
7574
INTERVENTION 8 MAKE THE RENEWABLE ENERGY TR ANSITION CIRCUL ARImplement a life-cycle approach to renewable energy generation and storage capacity through design for disassembly improved repairability circular business models and the use of recycled metals
Sectoral scope Energy Industry Waste management
Synergy with GEF areas of operation
Climate Change Biodiversity Chemicals and waste Sustainable Cities
IPCC categories targeted
1A1 Energy industries 1A2 Manufacturing industries and construction 1B3 Other emissions from energy production 2E3 Photovoltaics
7776
78
With global economies looking to become climate neutral or fossil fuel-free it becomes clear that the metals used in clean energy production and storage technologies are scarce Therefore we need to prioritise truly regenerative resources and non-critical metals for the production of renewable energy infrastructure An important indicator of the renewable energy transitionrsquos progress in the power sector is the share of low-carbon technologies (renewables nuclear and carbon capture and storage) being used In 2019 37337 of generation came from low-carbon technologiesmdashan increase of just over 1 from 2018 In 2019 renewable electricity generation rose by 6 and reached almost 27 of global electricity generation the highest level ever recorded338 Solar photovoltaics (PV) and wind each accounted for about one-third of total 2019 renewable electricity generation growth with hydro representing 23 and bioenergy most of the rest Combined with weak electricity demand growth in 2019 renewables expansion outpaced the total rise in electricity generation for the first time during a period of global economic expansion Generation from renewables expanded more quickly than generation from any other fuel including coal and natural gas339 It is important that the materials used in new renewable energy infrastructure can be recovered when these capital goods reach the end of their lifetime Strategies to ensure that the renewable energy transition is also sustainable in the long-run are to design for the future in particular design for repairability and recyclability For existing capacity preserving and extending whatrsquos already made by maximising product lifetimes repairability and using waste as a resource to ensure that the materials in the current generation of renewable energy capacity can be reused Finally scarcity of rare earth metals may prompt companies to rethink their business model to ensure that they retain ownership over their assets and can recover them when they reach the end of their lifetime
8ASTRATEGY DESCRIPTION
Undefined The carbon footprint of producing all the renewable energy capacity that is required under a 2-degree scenario is only 6 of a continued reliance on fossil fuels
However the carbon footprint of producing renewable energy materials is still substantial Estimates indicate that emissions from the production and operation of renewable energy and storage technologies will be about 16 billion tonnes CO2e up to 2050 Aluminium graphite and nickel production for energy technologies account for a cumulative 14 billion tonnes CO2e up to 2050 when producing the equipment required for a 2-degree scenario340 Mitigating these emissions over the full lifecycle of the renewable energy generation and storage capacity is the scope of this intervention To our knowledge a quantification of the mitigation potential of applying circular economy principles to the renewable energy production and storage capacity is not available
8BGREENHOUSE GAS MITIGATION POTENTIAL
8DCO-BENEFITS 8CBUSINESS CASE POTENTIAL
This intervention targets the long-term since many countries are rapidly building up their renewable energy capacity which is still far from reaching the end of its lifetime It is estimated that China alone will generate 500000 tonnes of used lithium-ion batteries and that by 2030 the worldwide number will hit 2 million tonnes per year342 However there are already initiatives that aim to improve the recovery of valuable materials from dismantled renewable energy infrastructure and therefore some of the co-benefits manifest themselves already now at a smaller scale
Closing the loop on the materials needed to meet our renewable energy capacity reduces primary extraction and protects ecosystems where mining activities would otherwise take place
In addition material efficiency and recovery is a prerequisite for a successful renewable energy transition The demand for critical metals which are required for the energy transition will soon exceed global production Continued exponential growth in renewable energy capacity is not possible with present-day technologies and annual metal production This applies for example to the indium required for solar panels the tellurium and cadmium for highly efficient solar panels and the neodymium used for permanent magnets in wind turbines and electric vehicles343
High Many advanced and profitable engineering applicationsmdashincluding clean energy production and storage technologies communication systems computing applications wind turbines and solar panelsmdashuse rare earth elements and technology critical elements Current mining capacity doesnrsquot meet the growing demand so the potential for the recycling of those metals and minerals is significant Urban mining (the process of reclaiming metals from waste products for example electrical and electronic equipment) batteries and e-waste recycling can be strategically explored in many GEF target countries alongside upstream mining and bioleaching3415
7978
Economic and financial The recycling of metals like chromium cobalt niobium palladium platinum and rhodium is reaching 50 but financial barriers remain which prevent higher recycling rates The recycling rates of certain rare-earth metals are still below 1 Barriers to making recycling financially feasible are that the concentration of metals in the products that are to be recycled is often low the total volumes available for recycling are too low and many countries lack take-back infrastructure344
Technological Low-carbon technologies particularly solar photovoltaic (PV) wind and geothermal are more mineral intensive relative to fossil fuel technologies Because of the material intensity of low-carbon technologies any potential shortages in mineral supply could impact the speed and scale at which certain technologies may be deployed globally345
Low- and middle-income countries often lack the capacity to process rare earth metals The recycling industries for end-of-life renewable energy equipment are mostly found in the EU and North America
Looking at recycling of lithium-ion batteries from electric vehicles there are numerous improvements to be made to increase the scale and economic efficiency of the process Better sorting disassembly and separating of electrode materials need to be invested in and introduced as well as design for recyclability346
Cultural Companies and governments have a planning horizon which does not go beyond the lifetime of most renewable energy capacity
8EBARRIERS
An important driver for the circular design of renewable energy capacity is that already now the rare earth metals required are increasingly scarce There is also competition between industries for these resources since electric vehicles solar and wind capacity require partly the same materials
This scarcity is aggravated by the fact that the market for rare earth metals is dominated by only a few countries The primary supply chain of critical metals like neodymium praseodymium and dysprosium runs mainly through China347
With the energy transition demanding increasing volumes of these materials scarcity will likely increase That could drive these companies into alternative business models whereby they remain the owner of the assets and can secure access to these materials in the long run This also drives interests in urban mining and efficiency improvements in primary resource extraction
Land use titles and concessions for renewable energy capacity can be tied to lifetime requirements In the Netherlands newly installed offshore wind power capacity needs to be built to last at least 40 years348
Policy measures are needed that encourage energy efficiency environmentally and socially sound practices and innovation to ensure that clean energy technologies can be safely and efficiently dissembled and recycled343
Current lithium-ion battery design implies the use of adhesives bonding methods and fixtures that at the end of use require shredding or milling followed by sorting This causes component contamination and reduces the value of material streams350 For high-value recycling the purity of recovered materials is required which benefits from an analysis of the cell component chemistries and the
8FENABLING CONDITIONS
state of charge and health of the cells before disassembly At present this separation has only been performed at a laboratory scale It requires manual disassembly methods with high job creation potential
The lsquosystem performancersquo of the battery recycling industry will be strongly affected by a range of factors including collection transportation storage and logistics at the end-of-life As these vary between regions different jurisdictions may arrive at different solutions Research such as the Norwegian Research Council project351 which aims to understand the political economy of metals such as cobalt for green technologies and the impact of obtaining those metals on environmental decline and political conflict might enable emergence of more circular practices in the mining sector
Greening the power sector and battery production requires that upstream and downstream emissions-related challenges from clean energy technologies be meaningfully addressed through policy and innovation while integrating these emissions reductions into countriesrsquo NDCs under the Paris Agreement352
SoliTek plan 2020
Future08
bull New solar panel manufacturing lineinstalled
bull Production capacity expanded up to180 MW
TToottaall ffooccuuss oonn ccuussttoommeerr
bull New residential installations companygrowth by 150
bull Advanced building integrated PV (BIPV)services for corporate clients
PPrroodduuccttiioonn eexxppaannssiioonnSoliTek from Lithuania adopted circular design and business models for solar panels
SoliTek from Lithuania achieved the highest Silverlevel of Cradle-to-Cradle certification with its flagship SOLID series solar panels which are manufactured using a mix of solar and geothermal energy The company is able to recycle the majority of the waste generated during manufacturing Next to this the company is a partner in the Innovation Action project Circusol developing circular business models for solar panels and assessing the capacity for second-life re-use of solar panels and their components353 Their research and development efforts to become more sustainable and develop new business models are supported by the EU research programme Horizon 2020354
CASE STUDY EX AMPLE CRADLE-TO-CRADLE CERTIFIED SOL AR PANELS
8180
INTERVENTION 9 ECO-INNOVATION IN INDUSTRIAL CLUSTERS AND INFORMAL NE T WORKSApply industrial symbiosis approaches to industrial parks and create both formal and informal networks to encourage the use of secondary resources across industries
Sectoral scope Heavy industry Food processing Manufacturing and assembly Electricity generation
Synergy with GEF areas of operation
Climate change Chemicals and waste International waters
IPCC categories targeted
2 Industrial processes and product use4A Solid waste disposal4D Wastewater treatment and discharge
8382
Collaborating to create joint value is important for industrial symbiosis where waste is used as a resource In some cases the suppliers to industries or producers of consumer goods and capital equipment may have the opportunity to rethink their business models and consider opportunities to create greater value and align incentives that build on the interaction between products and services Examples are peer-to-peer sharing between businesses to improve the utilization rate of capital goods and chemical leasing whereby chemicals are offered as a service rather than sold In a sales model the supplier is incentivised to maximise the sales volume while in a leasing structure they are incentivised to provide a chemical service while using the least amount of chemicals355
Incorporating digital technology can support industrial symbiosis An example is the SymbioSys tool which is a database for companies to help them identify opportunities for material substitution and exchange It allows for the visualisation of synergies exchange of resources and joint waste management opportunities and has been tested by 25 small and medium enterprises (SMEs) in Northern Spain356
The circular economy potential of collaboration along and across industrial value chains is not limited to large industrial enterprises but also applies to the informal sector and micro small and medium enterprises (MSMEs) In Sub-Saharan Africa the informal sector contributes 72 of employment while it contributes 65 in Asia and 51 in Latin America The strategy here supports the drive in informal networks by removing barriers to innovation357 and providing them with access to circular economy concepts and technologies These include for example additive manufacturing (3D printing) online marketplaces for secondary products and materials and using waste as a resource connected with the skills and knowledge present in the informal sector
9ASTRATEGY DESCRIPTION
97 to 108 billion tonnes CO2e between 2020 and 2050 This value stems from the global mitigation potential of 1288 to 1438 billion tonnes CO2e between 2020 and 2050 which combines strategies that improve and reduce materialuse use waste as a resource reduce emissions of refrigerants and improve energy efficiency358
This global figure has been adjusted for the share of industrial GHG emissions that stem from non-OECD countries This share is 75359
Over time the share of non-OECD countries in global industrial GHG emissions is likely to increase The global added value from industry and construction is around US$236 trillion of which low- and middle-income countries provide 46 However their share is rising In 2000 low- and middle-income countries were responsible for only 28360
9BGREENHOUSE GAS MITIGATION POTENTIAL
9DCO-BENEFITS 9CBUSINESS CASE POTENTIAL
There are several co-benefits of collaboration in industrial clusters and networks of workshops that produce or assemble consumer products and capital equipment In addition to climate change mitigation it helps reduce water use and thereby safeguards freshwater resources362 19 of global water use stems from industries363 In addition it prevents chemicals and waste from going to landfill Where byproducts from processing forestry and food products are used landfill GHG emissions from the disposal of organic waste are also reduced
EIPs can be a supportive and enabling environment for entrepreneurship investment technological progress the upgrading of skills the creation of decent jobs and increased social mobility EIPs can help countries benefit from access to global trade and foreign direct investment
Socio-economic benefits include improvements in health and safety where waste creation is avoided Other benefits are that industrial activities concentrate on industrial parks which improves monitoring and often allows for more professional job opportunities in waste collection and processing364 An example where informal waste collection was combined with informal waste collection is the Sustainable Recycling Industries programme365 which seeks colocation spaces for informal collectors and industrial parks This is demonstrated by e-waste management in India where informal waste collectors dismantle e-waste and sell recovered materials to buyers at industrial parksmdashsometimes even supported by online marketplaces
So far eco-innovation at industrial parks focuses mostly on reaping the benefits of collaboration within the premises of the park The example of informal waste collection indicates that opportunities remain to further develop the relationship between consumers and producers through service models or take-back schemes
Mediumhigh The adoption of the eco-industrial parks (EIP) concept is growing The number of parks increased from 50 to 250 between 2000 and 2018 According to the World Bank EIPs offer the business advantages of traditional industrial parks while also using resources more efficiently improving productivity supporting firms in achieving their social responsibility goals and lowering exposure to climate change risks361
8584
Economic and financial Industrial symbiosis creates strong ties between companies This creates dependenciesmdashand when companies relocate new suppliers of raw materials need to be selected A precondition for industrial symbiosis to work is that all parties benefit and have a common interest to maintain the exchange of materials and energy
Legal regulatory and institutional Industrial parks are often developed to attract industries while not considering the competitive advantage offered by clustering certain industries Governments must take a design perspective to industrial clustering
9EBARRIERS
There are tools available on the Green Industry Platform to support the development design management and monitoring of EIPs366 To mobilise the private sector to become an active agent in the industry transformation the GEF has established a Private Sector Engagement Strategy (PSES) PSES helps to facilitate multi-stakeholder platforms for sustainability based on strong in-country networks and generate efficiencies that connect market demand with sustainable models of supply367
Other enabling factors are the early definition of a business case for all participants as well as legal requirements that improve the environmental performance of companies and reduce their waste volumes Additionally EIPs are more effective when they address both environmental and social issues such as job creation at the same time
9FENABLING CONDITIONS
The Vietnamese EIP initiative supported the adoption of industrial symbiosis in four industrial parks across Vietnam Within the initiative which was co-funded by the GEF 18 industrial symbiosis opportunities were identified After feasibility studies were completed 12 were implemented
At the beginning of the project approximately 70 of effluent from industrial zones was directly discharged without prior treatment causing severe pollution of surface and groundwater and the marine ecosystems Untreated solid waste with a high proportion of hazardous material was also on the rise in industrial zones Fast-pace economic development depended on high consumption of natural gas electricity and especially coal resulting in a rapid increase in GHG emissions368
The environmental benefits of implementing all 12 opportunities for industrial symbiosis would result in an annual GHG emissions reduction of 70500 tonnes CO2e additionally saving 885333 cubic metres of freshwater and reducing waste volumes by 84444 tonnes per year The payback time for each of these opportunities ranges between three months and eight years
Furthermore a total of around 1000 options to further improve resource efficiency and prevent waste were identified Of these 546 were implemented reducing electricity use by 19274 megawatt hours per year fossil fuels use by 142 terajoules per year reducing GHG emissions by 30570 tonnes CO2e per year reducing water usage by 488653 cubic metres per year and reducing the use of chemicals and materials by 3121 tonnes per year Next to this the interventions resulted in financial savings of euro29 million per year with an average payback time of seven to eight months
CASE STUDY EX AMPLE EIP INITIATIVE FOR SUSTAINABLE INDUSTRIAL ZONES IN VIETNAM
8786
88
INTERVENTION 10CIRCUL AR DESIGNIN CONSTRUC TIONDesign buildings to improve their energy efficiency and minimise waste in the construction process by applying passive design and modular and offsite construction
Sectoral scope Built environment value chain
Synergy with GEF areas of operation
Sustainable cities impact programme Climate change focal area strategy Chemicals and waste
IPCC categories targeted
1A Fuel combustion activities 1A2 Manufacturing industries and construction2A Mineral industry 2B Chemical industry 2C Metal industry 3B Land 4A Solid waste disposal
8988
CIRCUL AR DESIGN IN CONSTRUCTION
Optimising the design of buildings to minimise energy use at end-of-life urban mining and substituting materials with high embodied emissions with bio-based materials can significantly mitigate GHG emissions and reduce virgin resource use
Note that the flows in this graph are indicative only and aim to illustrate extreme opposite scenarios
I N P U T S amp O U T P U T S
L I N E A R I M P O R TA N T
C I R C U L A R M O D E R AT E
M I N I M A L
R E S O U R C E amp E M I S S I O N S F L OW S
M I N E R A L S B I O M A S SF O S S I L F U E L S E M I S S I O N S
C O 2
C O 2
C O 2
C O 2
C O 2 C O 2 C O 2
C O 2
C O 2
C I R C U L A R C O N S T R U C T I O N( O F F ) S I T E A N DM A I N T E N A N C E
B U I L D I N G
S T O C K ( U S E )
L I N E A R C O N S T R U C T I O N
S I T E A N D M A I N T E N A N C E
P R O D U C E S O R T I N G
C A R B O NS I N K
R E C YC L I N G
I N D U S T R Y
D I S A S S E M B LY
L A N D F I L L
c o n s t r u c t i o nm a t e r i a l s
d e m o l i t i o n w a s t e
C o n s t r u c t i o n m a t e r i a l s
C o n s t r u c t i o n w a s t e
R e u s e d f e e d s t o c k
R e c y c l e d f e e d s t o c k
M o d u l a r c o m p o n e n t s
P R O V I D EP R O C E S S
Figure 5 Value chain mapping in circular and linear scenarios
9190
Low- and middle-income countries are rapidly constructing the necessary infrastructure and building stock to meet the demands of a growing and increasingly wealthy population This however increases resource extraction and emissions related to the production of building materials Yet it presents a major opportunity to design buildings and infrastructure in a way that minimises energy use and emissions throughout their full life cycles369 370
The built environment is responsible for over one-third of global energy consumption371 and is a significant source of CO2 emissions372 With the energy efficiency of buildings gradually improving the environmental impact of the construction phase and the emissions embodied in construction materials becomes more prominent373 374 Cement production alone is responsible for 4 of global CO2 emissions375
This intervention focuses on designing for the future where the design of buildings is optimised376 to minimise energy use throughout the life cycle and allow for disassembly rather than demolition at the end of the lifetime Preserving and extending whatrsquos already made and using waste as a resource also come into play in the form of urban mining whereby secondary building materials are harvested Although partly covered in the Intervention three on bio-based materials design can also help prioritise regenerative resources whereby the impact of materials with high embodied emissions can be reduced Materials such as concrete are heavy contributors to the embodied emissions associated with the building stock There are several alternative forms of concrete such as flashcrete377 hempcrete and timbercrete378 where renewable materials and recycled concrete379 lower the impact of the material aggregate
The interventions for circular design in construction target the whole life cycle of the building For example applying passive design
10ASTRATEGY DESCRIPTION
principles to reduce the overall energy use of the building throughout its use phase and to make use of its natural surroundings including the application of green roofs Green roofs use soil and vegetation as living insulation thereby reducing the energy required for heating and air conditioning Waste should also be minimised in the construction process for example with offsite construction and modular design The end-of-life value of buildings should be optimised through design for disassembly and modular design and urban mining whereby demolition becomes disassembly and the design of new buildings incorporates building elements and materials from demolition sites should be incorporated380
Biomimicry the practise of looking to nature for inspiration to solve design problems in a regenerative way can be applied to enhance building design381 Similarly with the incorporation of digital technology software can improve the design of a building organise the construction process and limit waste It can also help develop a database of materials and construction modules applied in buildings to ease their recovery at the end of their lifetimes382
10BGREENHOUSE GAS MITIGATION POTENTIAL
10CBUSINESS CASE POTENTIAL
High Passive design is seen as an important strategy to provide housing that is both affordable and efficient388 Passive building standards are stated to be at or near profitability for most new-build segments389 Offsite construction methods modular design and design for disassembly are already implemented at scale and have become increasingly competitive390 391 While insulation and green roofs are feasible with the global savings far outweighing the costs that is not yet the case for high-performance glass392
The implementation of different circular design applications at scale (green roofs smart thermostats insulation and smart glass) which partially represent the full scope of this intervention would require an investment of US$206 trillion worldwide while saving US$2694 trillion between 2020 and 2050393
24 to 57 billion tonnes CO2e from 2020 to 2050Passive house design can reduce GHG emissions by around 05 tonnes CO2e per person per year383 This figure has been applied to a global population of 78 billion 90 of which live in non-OECD countries384 and a period of 30 years between 2020 and 2050 As by 2050 the current floor space of the building stock of 223 billion square meters will almost double to 415 billion square meters385 around 46 of the global floor space by 2050 will be built in the coming 30 years Assuming linear growth of this building stock 50 of the potential of passive design can mature already before 2050 This estimate is conservative as it does not account for population growth and growth in mitigation potential per capita if floor space per capita increases To make a global estimate for passive design estimates for building design with proper insulation and high-performance glass have been added to the higher end of the range only Although these can reduce global GHG emissions by 27 to 32 billion tonnes CO2e between 2020 and 2050 it is unclear whether these are already included in the estimates for passive design Green and cool roofs can reduce an additional 06 to 11 billion tonnes CO2e between 2020 and 2050 These have also only been added to the higher end of the range Adopting more efficient production processes can reduce CO2 emissions by 50 to 55 compared to conventional construction methods386 In Europe alone reducing waste in construction with prefabrication off-site construction and 3D printing has the potential to reduce GHG emissions by 02 billion tonnes CO2 per year387 These figures have not been included in the estimates above
9392
Passive design improves climate resilience as it keeps indoor climates pleasant even during periods of extreme heat or when the power supply is disrupted394 This feature of passive design reduces household expenditure on energy services and helps improve the trade balance of countries which rely on imports for their energy needs
The reduction of waste produced during construction also helps reduce the disposal of chemicals and waste If waste remains it is easier to carefully handle this waste during offsite construction in a manufacturing environment compared to waste produced at construction sites A related co-benefit is that higher material efficiency during construction also reduces the volume of construction materials required which reduces both GHG emissions and material use
Offsite construction can also help improve labour conditions and safety as it is easier to create a secure working environment in an assembly setting than on a construction site395 396 Next to this the modular layout of the building can add flexibility in its use but also retains a higher end-of-life value397 398
10DCO-BENEFITSEconomic and financial A barrier to improving the material efficiency of the construction sector is the low prices for construction materials This is in part due to the fact that negative externalities are not priced or taxed Negative externalities relate to the impact of primary extraction and GHG emissions from the production of carbon-intensive construction materials
The end-of-life value of construction materials is low Even when deploying modular design financial institutions often lack the necessary understanding of circular business models to factor in a high end-of-life value in their mortgage lending399
Legal regulatory and institutional A regulatory enabling framework that allows for offsite construction is often lacking
Technological Construction value chains with multiple actors are exceedingly complex while buildings have long life cycles and multiple users with diverging interests creating a technical barrier400 When a building reaches the end of its lifetime there are additional technical barriers regarding the recovery of building materials like bricks especially when they are connected by Portland cement and reinforced concrete elements or composite materials in general401
Capacity limitations stem from the limited familiarity and adoption of circular economy design and collaboration tools information and metrics This includes design tools and guides detailing circular economy methods such as402 design for disassembly and design for adaptability as well as a range of collaboration building and material information tools and circularity metrics These tools can help streamline the design and construction process and inspire a lifecycle approach A building information model for example enables stakeholders along the value chain to collaborate more efficiently which fosters optimised resource management and maintenance More concretely a building information model has the potential to foster reusability and recycling of materials by using the information provided by materials passports403 404
10EBARRIERSCultural The construction sector is often organised in silos which hampers collaboration across disciplines and organisations In some cases the sector is dominated by protecting vested interests which is a barrier to innovation 405 406
Key enabling conditions for modular design passive design and offsite construction are the available software tools that can facilitate collaboration in the design construction and even disassembly processes
Policymakers and development partners need a stronger evidence base to adopt circular principles in construction This is important as governments have development partners and together have significant procurement power which they can leverage by adopting circular procurement principles When incorporating environmental considerations like passive design modular design waste volumes or the incorporation of recycled or reused building elements procurement can select proposals with a lower environmental impact
Other enablers are the adoption of standards and building codes that are essential to support the innovations needed at scale as well as the effective adoption of design principles for the construction sector407
10FENABLING CONDITIONS
9594
The ecomo home is a sustainable house built in South-Africa and designed for living in collaboration with nature
Modular design and offsite construction makes the Ecomo Home low-maintenance and provides flexibility in the functionality and size of spaces The house uses timber frame construction to prevent the use of carbon-intensive construction materials By prefabricating the modules and assembling them on-site waste can be minimised The modular and flexible design allows the users of the building to adapt the design to changing requirements which reduces costs during the lifetime of the building
The carbon footprint of construction is 50 to 55 lower than when using conventional building materials and carrying out on-site construction The application of each cubic metre of a timber frame can sequester an average of 08 to 09 tonnes CO2e
Barriers to the wider application of passive design offsite and modular construction are low awareness and familiarity with design and collaboration tools information and metrics that enable the application of circular economy principles
CASE STUDY EX AMPLE THE ECOMO HOME408
Office and shopping complex constructed in Zimbabwe using green architecture and biomimicry principles
The design of the Eastgate Centre mimics that of termite mounds which have a design that allows air to be refreshed even in the deepest parts of the mound Due to its passive design the Eastgate Centre no longer requires a conventional air conditioning or heating system
Overall the centre uses less than 10 of the energy of a conventional building with a similar size and the lower energy bill saves considerable costs to the users of the building Meanwhile the absence of an air conditioning and heating system also enables the tenants to pay rent that is 20 lower than those in the surrounding buildings
Even though the construction was a success the higher upfront investment was considered to be a barrier for replication
CASE STUDY EX AMPLE EASTGATE CENTRE409
9796
98
INTERVENTION 11 NON-MOTORISED AND SHARED TR ANSPORTPrioritise non-motorised transport vehicle sharing and public transport in urban development
Sectoral scope Built environment Transport
Synergy with GEF areas of operation
Climate change Sustainable cities
IPCC categories targeted
1A Fuel combustion activities from 1A3 Transport
9998
The transport sector is responsible for nearly 10 of all emissions across Africa South Asia East Asia and the Pacific Latin America North Africa and the Middle East410 In addition transport emissions are amongst the fastest-growing sources of GHG emissions Between 2000 and 2016 transport emissions increased 23 globallymdashbut by close to 50 in non-OECD countries Growth was the largest in Asia with an average 98 increase in CO2 emissions from passenger and freight transport largely due to a combination of population growth and increased motorisation411
Modal shifts away from private car use and ownership is a promising strategy Private passenger vehicles contribute 75 of passenger transport emissions yet public transport accounts for just 7 while covering one-fifth of global passenger transport Railways account for 8 of global passenger transport while contributing only 3 of global transport emissions412
In cities the transport sector is also responsible for air pollution at levels which far exceed those considered safe by the World Health Organization413
This intervention focuses on the prioritisation of regenerative resources by creating space for walking and cycling transport modalities that do not require fossil fuels and have a positive rather than negative health impact The second approach is to rethink the business model whereby vehicle sharing and public transport are preferred over underused privately owned assets Here the incorporation of digital technology can help match supply and demand for mobility and thereby support an increase in vehicle utility rates both in terms of reducing the time in which a vehicle stands idle and increasing the occupancy rate of all its seats More specifically this intervention targets urban planning for walkable cities investing in cycling infrastructure rolling out public transit systems and promoting carpooling or car-sharing
11ASTRATEGY DESCRIPTION
99 to 20 billion tonnes CO2e between 2020 and 2050 for Asia Latin America and Africa alone The global mitigation potential for walkable cities cycling infrastructure public transit and carpooling is 19 to 40 billion tonnes CO2e between 2020 and 2050414 This estimate is adjusted for the target region whereby 51 of global transport emissions were from Asia Latin America and Africa in 2016415
The International Resource Panel estimates that if 25 of drivers shift to car-sharing GHG emissions could be reduced by 10 Shifting 25 of trips to shared rides would reduce emissions by 20416
11BGREENHOUSE GAS MITIGATION POTENTIAL
11CBUSINESS CASE POTENTIAL
11DCO-BENEFITS
High Investments in walkable cities and public transit vary considerably across regions However when investing in cycling infrastructure municipalities tend to save on investments in car infrastructure When saving US$2030 trillion in car infrastructure to make way for bicycles annual operational savings amount to 400 billion globally For carpooling the business case is evident as it requires no investment but potentially saves US$186 million for just the US and Canada This positive return on investments in active or non-motorised transport modes is confirmed by the Ellen MacArthur Foundation which estimates that the return on investment of improved cycling infrastructure in Amsterdam was 151 Similar estimates for Delhi and Bogotaacute arrived at returns of 201 and 71 respectively417
The returns on investment go even further Investing in active transport modalities improves air quality and has health benefits due to the physical exercise involved This saves healthcare costs In Portugal these savings were estimated to be between euro38 billion to euro68 billion (US$46 billion to US$82 billion)418 and in New Zealand between NZ$127 million and NZ$21 billion (US$912 million to US$15 billion)419
The environmental benefits of shared non-motorised and public transport are significant Along with the reduction in GHG emissions420 lower fossil fuel use also improves air quality421 which has major health benefits422 Improved vehicle utility through sharing also saves large amounts of valuable urban space423 that unused vehicles would otherwise take up and that oversized infrastructure requires when cars transport less than their capacity
There are also social benefits improving the walkability of streets can reduce urban crime424 and an increased number of cyclists and pedestrians on the roads is linked to an increase in road safety425 Walkable cities also give residents greater opportunities for social interaction enhancing their sense of community and in doing so individualsrsquo health and happiness426
101100
transport Technology also offers opportunities For example if Google Maps nudged434 users into choosing available alternatives to private car mobility However the key to reducing transport emissions and developing relevant co-benefits is not in improving car efficiency or the use of big data to steer traffic flows but rather a modal shift which faces habitual and cultural barriers435 436
The knowledge to prioritise public shared and non-motorised transport is available but overall government administration planning capacity in low- and middle-income countries is often insufficient437 438 There is also a strong push towards economic growth which can be at odds with wellbeing and pro-poor development strategies the choice between expensive or largely inaccessible modes of transport and low-cost alternatives which are available to larger target groups439 Here equity is crucial cycling infrastructure tends to be extended to areas of privilege only440 441 Furthermore large commercial project developers sometimes offer solutions that require big investments but fail to consider peoplersquos interests and preferences This leads to a bias for big highways and residential towers instead of considering public spaces safety accessibility and health
Cultural In some locations cycling and walking are considered a risky endeavour as the traffic may not be used to cyclists and using a car also makes one less vulnerable to street crime However there is clear evidence that with separate and dedicated cycling infrastructure and increased numbers of cyclists the risk of injuries actually goes down442
Another cultural barrier is that people attach personal identity and status to material possessions such as cars443 which is often encouraged by marketing
The covid-19 pandemic presents a further opportunity to demand more space for safe non-motorised transport and draw more attention to public health and resilience In response several municipalities have started investing in new infrastructure444
Economic and financial Interestingly the economic and financial barrier for bicycle infrastructure is not that there is no funding available On the contrary allocating funds to public shared or non-motorised transport often avails investments in expensive infrastructure for cars427 which requires a lot more space to both move and park428 Although an increasing number of municipalities see the importance of non-motorised transport for public health safety and wellbeing infrastructure for cycling and walking continue to receive only a small fraction of public funds spent on transportation This only requires a different allocation of transport budgets429 and perhaps a shift in underlying political priorities
Health wellbeing and the safety benefits of the public stemming from shared or non-motorised transport are difficult to quantify in monetary terms Existing studies on monetary benefits often have their origin in OECD countries and are not applicable to the GEF recipient countries
Legal regulatory and institutional More emphasis can be placed on the configuration and layout of cities as this predetermines mobility and has a significant influence on transport emissions Laws on spatial planning are often outdated Sometimes zoning building requirements or regulations on urban development in Global South cities have good intentions but derive from post-colonial models that restrict the kinds of neighbourhoods that can facilitate shared mobility
Some municipalities are seeing trends in the other direction Crime can deter people from choosing to walk or cycle430 and where air quality is low or hazardous outdoor travel modes may also be deprioritised431 These trends exist even though a growing car fleet only aggravates these issues
Technological The technology for public shared and non-motorised transport is available Digital technology can help in matching supply and demand432 and improve the overall occupancy rate of vehicles433 or accessibility of public
11EBARRIERS 11FENABLING CONDITIONS
A key enabler is political will and courage In Bogotaacute former mayor Enrique Pentildealosa championed cycling infrastructure and introduced a bus rapid transit system at the expense of car lanes445 446 This also helped create alignment between different government bodies residents and non-governmental organisations and interest groups Additionally the roll-out of public transport requires carefully balancing supply and demand while its use should be effectively promoted
103102
A public private partnership delivering a successful tramline in Morocco447
In 2007 the twin cities of Rabat and Saleacute in Morocco were connected by a tram line which was operated by the Socieacuteteacute du Tramway de Rabat Saleacute (STRS) The tram services approximately 110000 passengers and provides more than 32 million trips a year The tram operator employs 312 staff to run 22 trams It recovers over 96 of the operational costs from ticket sales alone
The Rabat-Saleacute Tramway changed peoplersquos perception of public transport According to a poll 77 of respondents reported that public transport is affordable The tram is widely viewed as a success and was expanded to serve additional routes into the city and its surrounding areas
The Rabat and Saleacute municipalities are struggling to densify the cities to reduce transport requirements and allow for effective public transport An unsatisfactory bus system in the past encouraged the growth of the informal transport sector which will remain there until there is a successful modern transportation system That requires more than a tramwayHowever the tramway is a good example of public transport that can exist and expand in tandem with an informal transport system
Key enablers for the Rabat-Saleacute Tramway were political will financing and operational tools such as public-private partnerships which came together to create a viable opportunity for large-scale investment in transport The financing for the tram is a fifty-fifty combination of government funding and international development loans Repayment started five to seven years after the start of construction and the loans have a term of 20 to 25 years
The 30-year concession agreement with Transdev from France to operate the tram system also played a role in its success Enacted in 2011 the contract gave Transdev the responsibility for operating the tram from ticket sales to wagon maintenance and also
required Transdev to provide training In 2017 local engineers had already developed a strong sense of ownership over the tramline and rolling stock part of which is assembled in Morocco
CASE STUDY EX AMPLE RABAT-SALEacute TRAMWAY
105104
INTERVENTION 12 SHIF TING TO HE ALTHIER AND MORE SUSTAINABLE DIE TSShift to healthy diets that bridge the nutrition gap for lower-income brackets while curbing meat consumption by diversifying diets to include more plant or insect-based proteins
Sectoral scope Agriculture Land use
Synergy with GEF areas of operation
Climate change Food systems land use and restoration
IPCC categories targeted
3A Livestock3A1 Enteric fermentation3A2 Manure management
107106
The livestock sector accounts for between 12 and 18 of global GHG emissions448 Global meat production and consumption have grown exponentially since the 1960s Projections indicate that it will grow an additional 70 to 80 by 2050 due to increasing incomes and populations from developing and emerging economies449
A healthy diet lsquooptimises health by ensuring an optimal caloric intake and consists largely of a diversity of plant-based foods low amounts of animal source foods more unsaturated than saturated fats and limited amounts of refined grains highly processed foods and added sugarsrsquo450 It is also protective and respectful of biodiversity and ecosystems culturally acceptable accessible and economically fair and affordable451 The transition towards such a diet will look different in different countries Where high-income countries need to curb meat protein intake for example low-income countries may need to boost it to ensure optimal caloric levels452
While high-income countries should take the lead in promoting dietary change it is also important that low- and middle-income countries curb trends towards growing and excessive meat consumption In these countries it is crucial that meat consumption reaches healthy levelsfor groups whose minimum nutritional needsare not met453
While there is growing willingness by governments to support more plant-based diets454 in particular because of their health benefits and ability to provide food security in the long run455 there are now also a growing number of international examples of governments that have successfully incentivised dietary shifts at scale456
Dietary shifts are about improving the efficiency of agricultural commodities and thereby prioritise regenerative resources Indeed
plant-based foods are less resource-intensive than animal-based foods457 and as such can be considered a more effective use of resources458 Technical solutions to support the transition to more plant-based diets include plant- or lab-based alternatives to meat and dairy as well as insect-based proteins However shifting diets is a cultural issue first and foremost that will require greater education and awareness-raising efforts to inform and persuade consumers and producers to change the choices they make Key levers of the transition are 1) evolving social norms 2) minimising disruption 3) selling compelling benefits and 4) maximising awareness459
In regions where there is a calorie deficit and meat consumption is unlikely to increase dramatically in the coming years the solutions in Interventions one and two to improve food productivity can play a crucial role instead
12ASTRATEGY DESCRIPTION
15 to 166 billion tonnes CO2e for the period 2020 to 2050 This estimate stems from the 2019 IPCC Special Report on Climate Change and Land which estimated the global mitigation potential at 21 to 240 billion tonnes CO2e460 It relies on a range of studies from 2009 to 2017 whereby the higher-end estimates are based on veganism vegetarianism or very low ruminant meat consumption The lower-end estimates are based on diets that involve moderate but not limited meat consumption The global estimate has been corrected for the share of livestock emissions from GEF countries of operation For this correction the country grouping of non-Annex 1 countries under the UNFCCC461 has been used as a proxy for the GEF countries of operation This proxy is imperfect since the non-Annex 1 countries exclude all EU Member States and several economies in transition According to FAOSTAT 69 of global livestock-related GHG emissions are from non-Annex-1 countries under the UNFCCC The proxy is also imperfect as it disregards the trade of livestock products from Annex 1 to non-Annex 1 countries The global estimates from the IPCC can be compared to those from Project Drawdown for plant-rich diets 6501 to 9172 billion tonnes CO2e between 2020 and 2050462 These estimates are lower as Project Drawdown based its modelling on reduced quantities of meat rather than vegetarianism in regions where diets projected for 2050 exceed established health recommendations According to Project Drawdown different regions are modelled to require different lsquoshiftsrsquo The order of magnitudes are in line with sources stating that nearly 3 billion tonnes CO2e per year could be mitigated through changes in diets and reductions in food waste in 2030 compared to a business-as-usual scenario of which 75 would be due to dietary changes463
The main contribution a shift to healthy diets makes to climate mitigation stems from the reduced demand for livestock farming from countries where there is an overconsumption of meat This reduces associated emissions from enteric fermentation and prevents deforestation and land use change for agriculture
12BGREENHOUSE GAS MITIGATION POTENTIAL
109108
110
12CBUSINESS CASE POTENTIAL
12DCO-BENEFITS
Medium The business case for shifting to plant-rich diets is difficult to estimate464 However the relation to improved food security is strong In addition investing in more meat production is simply too costly The need to improve the efficiency of food value chains by reducing meat consumption has already driven the Chinese government to push for a shift away from meat to ensure food security for example465
Traditional plant-based proteins such as lentils and other dried beans are typically cheaper than animal-based proteins466 However as incomes rise so does the intake of animal protein Meat alternatives then serve a substitution purpose Though their production costs are currently prohibitive for the mass market they are falling very rapidly and have the potential to become less expensive than real meat467 Globally the alternative protein market is expected to grow at a Compound Annual Growth Rate (CAGR) of 95 from 2019 to reach $179 billion by 2025rsquo468 Furthermore meat production has been in decline for two years in a row469
Interviews indicate that the suggested dietary changes have multiple health benefits They can improve food security and thereby reduce undernourishment For high-income brackets such diets can also reduce health issues related to the over-consumption of meat470 Excessive beef consumption can cause cancer heart disease and obesity Furthermore insect-based proteins could potentially be significantly healthier than other conventional proteins For low- and middle-income countries the food security argument is important in particular when access to healthy nutritious and diverse food is already limited471 Whatrsquos more reductions in intensive animal productionmdashstemming from dietary changesmdashcould significantly lessen air-pollution-related impacts affecting those living in proximity to animal farming operations Agricultural emissions significantly contribute to the formation of particulate matter 25472 impacting respiratory function and causing cardiovascular illnesses473 Reducing agriculture-related ammonia emissionsmdashlargely attributable to livestock farmingmdashcould prevent as many as 200000 deaths per year and have an economic benefit of several billion US dollars474
Furthermore investing in plant-based or insect-based proteins has lower costs than trying to meet growing demands for meat475 In addition
improved animal welfare is an important co-benefit as industrial animal agriculture is characterised by its poor treatment of livestock
Environmental arguments are mostly related to efficiency Tapping into alternative protein sources in low- and middle-income countries can help prevent land degradation in countries with large herds It also reduces air pollution and as livestock require a lot of water enhances water security in freshwater systems Finally it would help preserve forest ecosystems Meat production requires vast quantities of soybean for feed often imported from countries with high deforestation rates476
Policy measures and awareness-raising programmes to promote healthy and sustainable diets484 485 are key enablers as illustrated by the case studies in this chapter Public food procurement policies in schools hospitals prisons and government offices in particular can play a crucial role in influencing consumer choices486 Public health policies could have a big impact as the overconsumption of meat has been linked to an increased risk of diabetes487 and other non-communicable diseases and its production linked to serious air pollution488 Furthermore framing the issue from a health angle tends to be more impactful and accepted than environmental arguments as illustrated by the drastic shifts in lifestyle that occurred during the covid-19 pandemic many of which have been advocated for decades by the environmental community
A cultural enabler is that perceptions are changing A carbon tax on beef for example is more realistic today than it was just a few years ago There is also a synergy with prioritising local protein sources Traditional cuisines in developing countries are often primarily plant-based489 and traditional or culturally appropriate foods are considered a key aspect of a sustainable diet490 Meat alternatives that closely mimic the taste of meat such as the Impossible Burger or Beyond Meat have also risen in popularity491 and are increasingly penetrating mainstream markets through partnerships with fast food giants such as Burger King492 or McDonalds493
Clearly the availability of sufficient and affordable nutritious food and access to diverse food sources makes it easier to change diets Finally the labelling naming and packaging of products is also an important enabler as shown by the example of packaging unhealthy food products from Chile Other strategies to nudge consumer behaviours494 both from a policy and a marketing perspective are also crucial to shifting consumption
12FENABLING CONDITIONS
12EBARRIERS
Economic and financial Agricultural subsidies act as a critical barrier Although outside of the GEF target region the US livestock industry benefits from price-distorting government subsidies As a result the price of animal protein far from reflects its true cost477
Legal regulatory and institutional The meat industry tends to lobby against change In meat-producing countries like Brazil for example the industry has a significant influence on policy making478
Technological Animal products are often recommended to meet protein needs because they provide dietary protein at a modest caloric load Plant-based proteins do not perform as well but novel meat alternatives that use soy or pea concentrates offer comparable benefits479 However these are not a suitable solution for most lower-income countries where livestock can be a crucial mechanism to ensure the livelihood of many smallholder farmers480 These novelties also take years and significant investment481 and expertise to develop which may be less available in lower income countries
Cultural This intervention is most closely related to cultural barriers Food is strongly tied to peoplersquos identity and symbolises many characteristics wealth hospitality and even masculinity482 Furthermore when there are parts of the population that suffer from a lack of access to protein it is hard to adopt policies that only target excessive consumption of meat Finally there is the lsquomeat paradoxrsquo483 which refers to the cognitive dissonance of consumers who are aware of welfare issues in the meat industry but still choose to eat meat
111110
Dietary guidelines taxes and private sector initiatives to promote a reduction in meat consumption
In 2016 the Chinese government issued guidelines to reduce domestic meat consumption by 50 by 2030495
Of 2000 Chinese people surveyed in 2018 70 of respondents indicated that lsquomeat reduction campaigns have made them more aware of the benefits of eating less meatrsquo496 138 reported eating less pork and 64 reported eating less poultry497
Another example of a policy intervention aimed at changing diets comes from Chile where the government has implemented advertising restrictions on unhealthy foods front-of-package warning labels and a ban on junk food in schools 18 months following the adoption of these regulations consumption of sugar-sweetened drinks dropped by nearly 25 while the sale of bottled water diet soft drinks and fruit juices without added sugar increased498
A private-sector example also comes from Chile The Not Company sells plant-based meat alternatives as well as plant-based milk and ice creams The company is valued at US$250 million according to TechCrunch and sells products in Chile Argentina and Brazil499 According to the company founder the Not Company has also already captured 10 of the (admittedly small) Chilean market for mayonnaise in just 8 months in storesrsquo500
Alternatives to animal products are a huge (and still growing) category for venture investors501 which has helped the Not Company secure funding to invest in their alternative meat technology The Not Company positions themselves as a lsquotech company not a food companyrsquo502 which may also help explain the funding they are able to attract from private equity firms including Jeff Bezosrsquo personal investment firm503
CASE STUDY EX AMPLE PROMOTING DIETARY CHANGES FROM VARIOUS ANGLES
113112
GREENHOUSE GAS MITIGATION POTENTIAL
The 12 interventions listed have a joint mitigation potential of between 285 billion tonnes CO2e and 695 billion tonnes CO2e between 2020 and 2050 With a remaining carbon budget of 580 billion tonnes CO2e in a 15-degree scenario or 800 billion tonnes CO2e in a 175-degree scenario circular greenhouse gas (GHG) mitigation is necessary to bring the global economy back on track to limit global warming to 15-degrees504 Discounting the years from 2018 to the end of 2020 with around 56 billion tonnes CO2e emissions per year505 we only have a carbon budget of 633 billion tonnes CO2e left for a 175-degree scenario by early 2021
REAPING THE CO-BENEFITS
According to the UNEPrsquos Emissions Gap Report 2019 lsquoThere are multiple benefits from achieving climate change goals for other Sustainable Development Goals (SDGs) with these synergies being more pronounced than trade-offs especially if the implementation is holistic and concurrentrsquo506 Many of the SDGs relate to the adverse impacts of primary resource extraction and the disposal of waste to soils water and air including GHGs507 Since circular economy approaches to mitigating climate change also aim to reduce primary material extraction and waste disposal the co-benefits are even more pronounced
Environmental co-benefits include the preservation of ecosystems by reducing the extraction of resources and disposal of harmful waste both as co-benefits of prioritising regenerative resources and developing the bio-based economy By protecting the natural habitat of species reducing water usage and moving away from monocropping into intercropping and agroforestry practices biodiversity can be maintained and perhaps restored
Socio-economic co-benefits range from increased agricultural and forestry production by increasing yields per hectare Reducing food loss and waste can further improve food security Other health benefits stem from the reduced air pollution in urban centres from transport interventions the diversification of agricultural production which allows for more diverse diets and even personal wellbeing by using regenerative construction materials like wood and bamboo and relying on passive and biophilic design
In addition the circular economy promises economic growth In China for example the Ellen MacArthur Foundation quantified that the circular economy could save businesses and households approximately yen32 trillion (US$51 trillion) in 2030 and yen70 trillion (US$112 trillion) in 2040 in spending on high-quality products and services compared to Chinarsquos current development path These savings equal 14 and 16 of Chinarsquos projected GDP in 2030 and 2040 respectively508 Although similar estimates of the economic benefits of the circular economy are underway for other countries so far they are only available for the EU China and India
The circular economy is confirmed to be able to create valuable jobs also in areas where there is a shortage of job opportunities partly by focussing on local services509 and materials Furthermore the quality of jobs can be improved by empowering the informal sector in the circular economy and strengthening their role in the recovery and recycling of materials production of new products and maintenance of existing products Finally the interventions proposed represent an opportunity to reduce income inequality by prioritising human resources creativity and ingenuity over natural resources as a driver of economic development
4 ACCELERATING THE TRANSITION TO A LOW-CARBON CIRCULAR ECONOMY
OVERCOMING BARRIERS
Identifiable barriers re-occurred throughout our different interventions In relation to the legal regulatory and institutional context the short-term planning horizon within government frequently emerged which distracts from policy interventions with a more long-term impact Another issue is the implementation of policies that do not account for possible knock-on effects and fail to address the root causes of issues An example is a ban on using timber in Niger which aimed at protecting trees from logging but when implemented the policy also discouraged people to plant new trees for future use Finally the informal sector often has an important role in low- and middle-income countries but is difficult to reach through policy510 Vested interests from industries lobbying against the adoption of environmental regulations is also a barrier to the adoption of effective legislation
With technological barriers we should distinguish between circular economy interventions that are low-tech like composting reducing food loss and waste urban planning and regenerative agriculture or waste collection and those that require internet access and more sophisticated technologies like urban farming or the production of cross-laminated timber Certain technologies will disseminate slower in low- and middle-income countries where certain infrastructure is lacking or internet access is limited Finally the lack of awareness of the circular economy concept and lack of successful demonstration projects within the context where they can be scaled can be a barrier for the broader adoption of an intervention
In addition the impacts of circular economy interventions cross sectors and territorial boundaries and are therefore difficult to quantify or monitor
This hampers their justification and makes attracting investments more difficult511
Where circular economy solutions are low-tech the necessary skills and technologies exist but are missing the financial incentives ability to mobilise early adopters and means to deploy them
A knowledge barrier which can also be perceived as a cultural barrier is the misperception that issues need to be addressed in isolation and target the direct sources of emissions rather than considering them in a systemrsquos context This applies to all stakeholders in climate change mitigation Another knowledge barrier is that in practice the end-users of circular products and services are sometimes poorly consulted This is counter effective as they are the main adopters of the products and services This is particularly prominent in urban planning but also in agroecology and developing environmental policies
The short-term focus of policymakers and competition from more acute priorities like expanding the housing stock to accommodate a rapidly growing population prevail over long-term environmental priorities This was referred to as a cultural barrier The short-term implementation time of some development programmes can also lead to failure if interventions require several years to be successfully implemented In addition it is important to inculcate a culture of data-driven decision making and collaboration across departments with different mandates The siloed mandates of government bodies512 or siloed structure of corporate entities is another barrier to the identification and implementation of circular economy opportunities
Another cultural barrier is that personal success is commonly defined in material terms as in the possession of consumer goods and the consumption
115114
of meat This stands in the way of the adoption of service models and dietary changes As disposable income goes up so does waste and consumptionmdashand this issue is especially prevalent in high-income countries which provide a poor example
An economic and financial barrier is the lead time for projects to bring in higher revenuesmdashfor example regenerative agriculture or agroforestry Such interventions take time to bring tangible results such as higher yields and revenues Funders do not always have the patience needed to see such projects through Furthermore current accounting principles approaches to risk estimation and mitigation put circular economy solutions at a disadvantage513
In the current economic climate incumbent technologies and approaches are more financially attractive This could be because their negative externalities are not priced514 Without adequately pricing externalities also the benefits of circular initiatives are insufficiently rewarded in monetary terms That also affects the ability of circular innovators to access affordable funding
Furthermore it is difficult to incubate circular businesses and make them profitable given that most non-circular-economy products are cheaper on the market Local governments may not have sufficient authority to change market conditions and factor in the negative externalities of linear products Although it is clear that we need to decouple material consumption from well-being it is challenging to actually get companies on board given that a reduction in material consumption could mean a reduction in sales515 Although there are alternative business models available business models that rely on sales can be deeply ingrained into corporate culture
Multilateral development banks also face challenges in financing circular economy activities at scale These include a reactive and risk-averse approach to financing A second issue is that multilateral development banks often have the mandate to work with national agencies while the circular economy asks for smaller-scale funding for subnational or municipal projects In general traditional project-based finance is less suitable for the systemic and multi-stakeholder approaches that the circular economy requires516
ENABLING CONDITIONS
An enabling condition frequently repeated by experts interviewed within this project was that the circular economyrsquos benefits should be made clear to decision-makers Agricultural projects bolstered by demonstration projects that show what certain interventions could achieve for example helped to spark the confidence farmers needed to follow in the footsteps of the pioneer If a solution is functional and successful people will adopt it Also at a government level communication on the benefits is very important to create the willingness to adjust policies whereby policymakers are more willing to act on positive impacts in the short run
Furthermore various government bodies and levels will have to collaborate to be able to act effectively on the cross-sectoral nature of circular economy opportunities National and subnational governments should show leadership and an ability to convene stakeholders and leverage circular public procurement Successful pilots can be scaled through peer-to-peer exchange between local governments as observed in the ICLEI network517
Connecting circular economy interventions with an immediate political priority like job creation or reducing the emission and disposal of pollutants is a clear enabler for the adoption of effective policies While supporting legislation is a clear driver for action lacking enforcement of that legislation for example on responsible forest management can significantly dilute the potential policy impact Involving and consulting stakeholders in the policy making process but also tailoring the circular economy interventions to a specific context can further prevent policies from having a counterproductive effect This could be matched by efforts to raise awareness and provide education and training addressing misperceptions about a certain intervention Solutions proposed should be all-encompassing consider the full value chain to prevent issues from spilling over to other parts of the value chain518 and take technologies procurement channels and enabling factors into account519 In some cases this may require taking interventions together for example when considering regenerative agriculture the bio-based economy and reducing food loss and waste
Where industries or sectors rely on informal workers the organisation formalisation and in some cases also attaching public recognition or status to a certain job have been proven to address waste management issues Micro small and medium-sized enterprises on the other hand can play a pivotal role in experimenting with and testing innovations in different contexts Allowing for that experimentation and learning to happen necessitates supporting small grassroots decentralised and community-based initiatives This could enable larger scale but well-informed programmatic approaches later onFinancial incentives can aid the adoption of circular interventions for example to cover the incremental costs between the conventional technology and the circular alternative
Finally data and insights on the drawbacks of the linear economy and the advantages of the circular alternative are important Robust data collection and analysis systems can provide detailed data on resource flows and feed them into reporting systems building information on materials consumption and related impacts520 These systems could also identify circular economy opportunities while transparency and openness on primary resource extraction from finite sources GHG emissions and waste data can help put more pressure on companies to change course
117116
This paper clearly illustrates the role of the circular economy in mitigating climate change while providing both socio-economic and wider environmental benefits The previous chapter (Chapter Four) provides a summary of our interventionsrsquo greenhouse gas (GHG) mitigation potential co-benefits and how to overcome the potential barriers in place for their realisation This chapter seeks to provide solid recommendations for implementing circular projects with strong GHG mitigation potential
STRUCTURING A CIRCUL AR PROJECT
The GEF is already very well-positioned to use circular economy principles as a means towards reducing finite resource extraction and waste disposal Being organised along themes that cut across sectors and industries as the circular economy does521 the GEF is already dedicated to supporting recipient countries with lsquobreaking down institutional and national silos and developing integrated and innovative policy tools to leverage resources for environmental protection including from the private sectorrsquo522 The GEF also often takes a regional or value chain perspective which supports its ambition to lsquoto respond to global challenges at the systemic level and leverage resources that would not otherwise be availablersquo The GEF is already operating at the level we need to see for systemic change surpassing the incremental changes which for a long time have characterised our global climate mitigation efforts
5 RECOMMENDATIONS
1 Combine policy interventions with project support Policies can become barriers in themselves to circular economy opportunities Policymakers should have access to the macro-economic modelling that provides insight on the impact of creating the appropriate fiscal conditions for the adoption and scaling of circular economy interventions such as abolishing subsidies on fossil fuels and introducing carbon taxes levies on water extraction tipping fees or duties on the import of carbon-intensive products
2 Consult and involve stakeholders To adequately consider end-user interests in circular economy solutions we need stakeholder involvement From engaging stakeholder consultants in policies that aim to address the use or disposal of single-use plastics to the integration of indigenous knowledge in natural asset management Anticipating demographic changes and economic development is also crucial especially considering how these shifts will impact lifestyles
3 Prevent negative rebounds It is paramount that negative rebounds of efficiency gains are prevented Experience with improving the energy efficiency of appliances shows that it results in increases in use for example partly offsetting the energy efficiency gains526 Both stakeholder involvement in developing the appropriate legal context for circular economy opportunities and combining policies with project support are important ways to prevent rebounds
4 Apply systemic levers for change Focus often remains on making existing assets or incumbent industries with their high and verifiable historical GHG emissions baseline more efficient rather than exploring truly sustainablemdashand perhaps even zero-carbon or carbon-negativemdashalternatives Doing so will require a systems approach that aims to reduce negative impacts across the value chains involved in an intervention such as regenerative farming527 It also helps to
119118
where the reduction takes place is often also the entity where the intervention takes place In the circular economy however that is not always the casemdashthe reduced application of carbon-intensive materials by a project developer leverages reductions in emissions for the production of materials for example Such value chain dynamics should become an integral part of estimating mitigation or sequestration impacts at the project level This could take the form of socio-economic indicators such as for job creation health and poverty alleviation532 533
9 Target and involve micro small and medium-sized enterprises (MSMEs) and the informal sector MSMEs provide a large share of the jobs in low- and middle-income countries but receive little political priority Instead of attracting foreign investment for large scale operations countries could invest in upgrading and greening informal production systems and providing them with proper infrastructure and training while projects could target them through microfinancing and capacity building Another advantage of targeting MSMEs is that they rely on the voluntary adoption of circular business models which reduces the risk of public opposition that some large-scale and often foreign-owned investments may face Projects can also formalise the role of informal workers which can represent a large share of the labour force and marginalised groups to ensure that the benefits of circular interventions reach all parts of society as well as improve their position labour conditions and perhaps even social status
10 Address the finance barrier Support the leveraging of private sector finance by adopting circular procurement principles in procurement process and by developing cooperative and blended finance mechanisms to support and de-risk early investment in circular economy initiatives534 Financing should target demonstration projects and their upscaling including the private sector with its MSMEs philanthropies and foundations
identify collaborative strategies to develop a circular economy in line with national objectives to safeguard natural assets avoid waste creation and reduce GHG emissions all in parallel528 529
5 Cut across national borders and consider embedded emissions The sources of GHG emissions are commonly taken as the starting point for interventions However this fails to take into account emissions that are embodied in products that cross over bordersmdashwhich accounts for 20 to 30 of global GHG emissions This could create a bias for interventions that target incumbent entities with a high emissions baseline with investments that help improve their efficiency as opposed to systemic transformation530
6 Create a low-carbon lock-in Core levers and drivers for low-carbon development must be identified and targeted For developing countries this implies identifying opportunities to build vital infrastructure while minimising GHG emissions during construction and creating low-carbon lock-in for the future
7 Prioritise local produce Emissions from international transport are rising so it is important to keep transport distances short Besides bypassing emissions prioritising local products can also make it easier to take a systemic approach in which all stakeholders including those who benefit and those who may not have a say in the design of the project It therefore safeguards against approaches where the benefits are geographically separated from potential negative socio-economic and environmental impacts
8 Demonstrate impact Metrics to demonstrate circular impact can be lacking but they are vital to report on the broad range of circular economy project benefits The wealth of methodologies available under the CDM and IPCC that estimate GHG mitigation and sequestration impacts at project level inadequately address circular economy opportunities Under the CDM the entity
11 Involve the donor countries The circular economy requires collaboration involving the demand-side and addressing the excessive material consumption that exists there Consumers in the GEF donor countries are the end-users of some of the products whose value chains are partly in GEF recipient countries For these value chains international cooperation is necessary to effectively address environmental and socio-economic challenges Examples are palm oil value chains cocoa but also electronics
12 Involve the private sector The circular economy is an attractive entry-point to the private sector especially through its ability to maintain material value along product value chains The GEF can use the circular economy as a guiding principle in its collaboration with the private sector while staying away from negative rebounds or business models and marketing strategies which rely on increasing material output instead of delivering a high service level with stable or even decreasing levels of resource use
121120
1 EXECUTIVE SUMMARY
1 The GEF focal areas include biodiversity chemicals and waste climate change international waters and land degradation Retrieved from GEF Website
2 Circle Economy (2021) The circularity gap report 2021 (pp1-71 Rep) Amsterdam Circle Economy Retrieved from CGRi Website
3 Raworth K (2017) Doughnut economics Seven ways to think like a 21st-century economist Chelsea Green Publishing
4 Raworth K (2017) Doughnut economics Seven ways to think like a 21st-century economist Chelsea Green Publishing
5 Material Economics (2018) The circular economy A powerful force for climate mitigation (pp 1-176 Rep) Stockholm Material Economics Retrieved from Material Economics website
6 International Resource Panel (IRP) (2020) Resource efficiency and climate change Material efficiency strategies for a low-carbon future (pp 1-173 Rep) Nairobi United Nations Environment Programme Retrieved from IRP Website
7 Circle Economy (2021) The circularity gap report 2021 (pp 1-71 Rep) Amsterdam Circle Economy Retrieved from CGRi Website
8 United Nations Framework Convention on Climate Change (UNFCCC) (nd) The clean development mechanism Retrieved from UNFCCC website
2 LOOKING BEYOND BORDERS THE CIRCUL AR GREENHOUSE GAS MITIGATION OPPORTUNIT Y
9 Intergovernmental Panel on Climate Change (IPCC) (2018) Global Warming of 15degC An IPCC Special Report on the impacts of global warming of 15degC above pre-industrial levels and related global greenhouse gas emission pathways in the context of strengthening the global response to the threat of climate change sustainable development and efforts to eradicate poverty (Masson-Delmotte V P Zhai H-O Poumlrtner D Roberts J Skea PR Shukla A Pirani W Moufouma-Okia C Peacutean R Pidcock S Connors JBR Matthews Y Chen X Zhou MI Gomis E Lonnoy T Maycock M Tignor and T Waterfield Eds) Retrieved from IPCC website
10 Circle Economy (2019) The circularity gap report 2019 (pp 1-51 Rep) Amsterdam Circle Economy Retrieved from CGRi Website
11 Material Economics (2018) The circular economy A powerful force for climate mitigation (pp 1-176 Rep) Stockholm Material Economics Retrieved from Material Economics website
12 IRP (2020) Resource efficiency and climate change Material efficiency strategies for a low-carbon future (pp 1-173 Rep) Nairobi United Nations Environment Programme Retrieved from IRP website
13 The GEF focal areas include biodiversity chemicals and waste climate change international waters and land degradation Retrieved from GEF website
14 United Nations Development Programme (2021) Circular economy opportunities Vanuatu Concise metabolic analysis (pp 1-46 Rep) New York UNDP Retrieved from UNDP website
15 Findings based on preliminary metabolic analysis undertaken by Shifting Paradigms to identify circular economy opportunities and enhance the NDCs of Vanuatu the Gambia and Lao PDR under the Climate Promise Programme with the UNDP
16 Schaffartzik A Mayer A Gingrich S Eisenmenger N Loy C amp Krausmann F (2014) The global metabolic transition Regional patterns and trends of global material flows 1950-2010 Global Environmental Change Human and Policy Dimensions 26 87ndash97 doi101016 jgloenvcha201403013
17 Kaza S Yao L Bhada-Tata P amp van Woerden F (2018) What a Waste 20 A Global Snapshot of Solid Waste Management to 2050 Washington DC World Bank Retrieved from World Bank website
18 Circle Economy (2019) The circularity gap report 2019 (pp 1-51 Rep) Amsterdam Circle Economy Retrieved from CGRi Website
19 Rationale and findings obtained from literature research and stakeholder feedback from UNDP Circular economy opportunities in the Gambia A metabolic approach to define a resource efficient and low-carbon future (draft for publication in 2021)
20 UNDP (2021) Circular economy opportunities Vanuatu Concise metabolic analysis (pp 1-46 Rep) New York UNDP Retrieved from UNDP website
21 Global Alliance for Waste Pickers (nd) Retrieved from Global Rec
22 The Conversation (2020) How waste pickers in the global south are being sidelined by new policies Retrieved from The Conversation
REFERENCES
23 UNDP (Draft for publication in 2021) Circular economy opportunities in the Gambia - A metabolic approach to define a resource efficient and low-carbon future
24 Daniels S(2010) Making domdashinnovation in Kenyarsquos informal economy (pp 1-128 Rep) Retrieved from Steve Daniels website
25 Preston F Lehne J amp Wellesley L (2019) An inclusive circular economy Priorities for developing countries (pp 1-82 Rep) London Chatham House Retrieved from Chatham House website
26 Circle Economy (2020) The circularity gap report 2020 (pp 1-64 Rep) Amsterdam Circle Economy Retrieved from CGRi Website
27 Stanley Foundation (2018) Looking beyond borders The circular economy pathway for pursuing 15degC Retrieved from Shifting Paradigms website
28 Circle Economy (2019) The circularity gap report 2019 (pp 1-51 Rep) Amsterdam Circle Economy Retrieved from CGRi Website
29 Circle Economy (2021) The key elements of the circular economy Retrieved from Circle Economy website
30 Ellen MacArthur Foundation (2020) The circular economy in detail Retrieved from Ellen MacArthur Foundation website
31 Shifting Paradigms amp Circle Economy (2017) Five ways the circular economy can raise the ambition of climate policies and strategies [Web log post] Retrieved from Shifting Paradigms website
32 IRP (2020) Resource efficiency and climate change Material efficiency strategies for a low-carbon future (pp 1-173 Rep) Nairobi United Nations Environment Programme Retrieved from IRP website
33 Shifting Paradigms (2017) Circular economy strategies for Lao PDR (pp 1-66 Rep) New York UNDP Retrieved from Shifting Paradigms website
3 THE MOST PROMISING CIRCUL AR MITIGATION INTERVENTIONS
34 Stanley Foundation (2018) Looking beyond borders The circular economy pathway for pursuing 15degC Retrieved from Shifting Paradigms website
35 Analysis of the CDM pipeline from December 2017 by Shifting Paradigms as background research to the publication Stanley Foundation (2018) Looking beyond borders the circular economy pathway for pursuing 15degC
36 The Global Environment Facility (2020) Our work Retrieved from GEF website
37 The GEF (2019) The GEF and climate change-catalyzing transformation Retrieved from GEF website
INTERVENTION 1 IMPROVED LIVESTOCK MANAGEMENT
38 Carbon intensity refers to the amount of greenhouse gas emissions per unit of product (in kilograms of CO2 per kilogram of product) FAOSTAT (2019) Methodological note Retrieved from FAO website
39 Food and Agriculture Organization (2020) Emissions intensity by country of meat cattle - Average 1961 - 2017 Retrieved from FAO website
40 Arcipowska A Mangan E Lyu Y Waite R (2019) 5 Questions about agricultural emissions answered Retrieved from WRI website
41 Non-Annex 1 countries are mostly low- and middle-income countries under the United Nations Framework Convention on Climate Change The non-Annex 1 countries are used as a conservative proxy for the GEF recipient countries The non-Annex 1 countries under the UNFCCC exclude some major transition economies like Russian and Ukraine which are GEF recipient countries For the full list see UNFCC website
42 FAOSTAT (2017) Agriculture total Retrieved from FAO website
43 FAOSTAT (2017) Agriculture total Retrieved from FAO website
44 FAO (2021) Animal production Retrieved from FAO website
45 van Zanten HE (2019) The role of farm animals in a circular food system Global Food Security 21 18-22 doi101016jgfs201906003
46 Touray KS (2020) Agroecology assessment of agricultural production and food systemsmdashthe Gambia Part of the FAO programme on lsquoIncorporating Agroecological approaches to Increase Climate Resilience in Integrated Agricultural Production for Improved Nutrition and Sustainable Food Systems in the Sahel and West Africa Regionrsquo
47 Rationale and findings obtained from literature research and stakeholder feedback from UNDP (Draft for publication in 2021) Circular economy opportunities in the Gambia - A metabolic approach to define a resource efficient and low-carbon future
123122
48 UNDP (2021) Circular economy opportunities Vanuatu Concise metabolic analysis (pp 1-46 Rep) New York UNDP Retrieved from UNDP website
49 This is also supported by experts interviewed within this project
50 IPCC (2019) Special report on climate change and land Retrieved from IPCC website
51 UNDP (Draft for publication in 2021) Circular economy opportunities in the Gambia - A metabolic approach to define a resource efficient and low-carbon future
52 World Bank (2016) Climate smart agriculturemdashsuccesses in Africa Retrieved from World Bank website
53 Rojas-Downing M M Nejadhashemi A P Harrigan T amp Woznicki S A (2017) Climate change and livestock Impacts adaptation and mitigation Climate Risk Management 16 145ndash163 doi101016jcrm201702001
54 IPCC (2019) Special report on climate change and land Retrieved from IPCC website
55 Project Drawdown (nd) Table of solutions Retrieved from Project Drawdown website
56 Hawken P (2017) distinguishes large from small-scale digesters
57 UNFCCC (nd) Parties Retrieved from UNFCCC website
58 FAO (2020) Emissions intensity by country of meat cattle - Average 1961 - 2017 Retrieved from FAO website
59 Hawken P (Ed) (2017) Drawdown The most comprehensive plan ever proposed to reverse global warming Penguin
60 Hawken P (Ed) (2017) Drawdown The most comprehensive plan ever proposed to reverse global warming Penguin
61 Hawken P (Ed) (2017) Drawdown The most comprehensive plan ever proposed to reverse global warming Penguin
62 Clemens H Bailis R Nyambane A amp Ndungrsquou V (2018) Africa biogas partnership program a review of clean cooking implementation through market development in East Africa Energy for Sustainable Development 46 23-31 doi101016jesd201805012
63 This is also supported by experts interviewed within this project
64 Teenstra E Andeweg K amp Vellinga T (2016) Manure helps feed the world integrated manure management demonstrates manure is a valuable resource Retrieved from FAO website
65 Preston F Lehne J amp Wellesley L (2019) An inclusive circular economy Priorities for developing countries Retrieved from Chatham House website
66 IPCC (2019) Special report on climate change and land Retrieved from IPCC website
67 IPCC (2019) Special report on climate change and land Retrieved from IPCC website
68 Yasar A Nazir S Tabinda A B Nazar M Rasheed R amp Afzaal M (2017) Socio-economic health and agriculture benefits of rural household biogas plants in energy scarce developing countries A case study from Pakistan Renewable Energy 108 19-25 doi101016jrenene201702044
69 Subedi M Matthews R B Pogson M Abegaz A Balana B B Oyesiku-Blakemore J amp Smith J (2014) Can biogas digesters help to reduce deforestation in Africa Biomass and Bioenergy 70 87-98 doi101016jbiombioe201402029
70 World Bank (2019) Moving towards sustainability the livestock sector and the World Bank Retrieved from World Bank website
71 FAO (nd) Biodiversity and the livestock sector Guidelines for quantitative assessment Retrieved from FAO website
72 FAO (nd) Livestock grazing and soil carbon Retrieved from FAO website
73 IPCC (2019) Special report on climate change and land Retrieved from IPCC website
74 van Nes W J amp Nhete T D (2007) Biogas for a better life an African initiative Appropriate Technology 34(4) 58 Retrieved from SNV website
75 Butare A amp Kimaro A (2002) Anaerobic technology for toilet wastes management the case study of the Cyangugu pilot project World Transactions on Engineering and Technology Education 1(1) 147-151 Retrieved from SSWM website
76 Yasar A Nazir S Tabinda A B Nazar M Rasheed R amp Afzaal M (2017) Socio-economic health and agriculture benefits of rural household biogas plants in energy scarce developing countries A case study from Pakistan Renewable Energy 108 19ndash25 doi101016jrenene201702044
77 WHO (nd) Indoor air pollution and household energy Retrieved from WHO website
78 Koumlhlin G Sills E O Pattanayak S K amp Wilfong C (2011) Energy gender and development what are the linkages Where is the evidence Retrieved from World Bank website
79 Yasar A Nazir S Tabinda A B Nazar M Rasheed R amp Afzaal M (2017) Socio-economic health and agriculture benefits of rural household biogas plants in energy scarce developing countries A case study from Pakistan Renewable Energy 108 19-25 doi101016jrenene201702044
80 IPCC (2019) Special report on climate change and land Retrieved from IPCC website
81 This is also supported by experts interviewed within this project
82 Teenstra E D Th V Vellinga N Aktasaeng W Amatayaku A Ndambi D Pelster L Germer A Jenet C Opio and Karin Andeweg Global assessment of manure management policies and practices No 844 Wageningen UR Livestock Research 2014 Retrieved from WUR website
83 Teenstra E D Th V Vellinga N Aktasaeng W Amatayaku A Ndambi D Pelster L Germer A Jenet C Opio and Karin Andeweg Global assessment of manure management policies and practices No 844 Wageningen UR Livestock Research 2014 Retrieved from WUR website
84 Clemens H Bailis R Nyambane A amp Ndungrsquou V (2018) Africa biogas partnership program a review of clean cooking implementation through market development in East Africa Energy for Sustainable Development 46 23-31 doi101016jesd201805012
85 World Bank (2019) The power of dung Lessons Learned from on-farm biodigester programs in Africa World Bank Retrieved from World Bank website
86 Teenstra E D Th V Vellinga N Aktasaeng W Amatayaku A Ndambi D Pelster L Germer A Jenet C Opio and Karin Andeweg Global assessment of manure management policies and practices No 844 Wageningen UR Livestock Research 2014 Retrieved from WUR website
87 Ndambi O A Pelster D E Owino J O de Buisonje F amp Vellinga T (2019) Manure management practices and policies in sub-Saharan Africa implications on manure quality as a fertilizer Frontiers in Sustainable Food Systems 3 29 doi103389fsufs201900029
88 World Bank (2019) The power of dung lessons learned from on-farm biodigester programs in Africa World Bank Retrieved from World Bank website
89 Teenstra E D Th V Vellinga N Aktasaeng WAmatayaku A Ndambi D Pelster L Germer A Jenet C Opio and Karin Andeweg Global assessment of manure management policies and practices No 844 Wageningen UR Livestock Research 2014 Retrieved from WUR website
90 Teenstra E D Th V Vellinga N Aktasaeng W Amatayaku A Ndambi D Pelster L Germer A Jenet C Opio and Karin Andeweg Global assessment of manure management policies and practices No 844 Wageningen UR Livestock Research 2014 Retrieved from WUR website
91 World Bank (2019) The power of dung lessons learned from on-farm biodigester programs in Africa World Bank Retrieved from World Bank website
92 Teenstra E D Th V Vellinga N Aktasaeng W Amatayaku A Ndambi D Pelster L Germer A Jenet C Opio and Karin Andeweg Global assessment of manure management policies and practices No 844 Wageningen UR Livestock Research 2014 Retrieved from WUR website
93 World Bank (2019) The power of dung lessons learned from on-farm biodigester programs in Africa World Bank Retrieved from World Bank website
94 Teenstra E D Th V Vellinga N Aktasaeng W Amatayaku A Ndambi D Pelster L Germer A Jenet C Opio and Karin Andeweg Global assessment of manure management policies and practices No 844 Wageningen UR Livestock Research 2014 Retrieved from WUR website
95 Shifting Paradigms (2015) Biogas in Nepal pioneering UN-registered carbon offset projects at household level Retrieved from Shifting Paradigms website
96 Kenya Biogas (nd) About Retrieved from Kenya Biogas website
97 Gold Standard Marketplace (2020) Kenya biogas programme Retrieved from Gold Standard website Kenya Biogas (nd) About Retrieved from Kenya Biogas website
98 Kenya Biogas (nd) About Retrieved from Kenya Biogas website
99 Clemens H Bailis R Nyambane A amp Ndungrsquou V (2018) Africa biogas partnership program A review of clean cooking implementation through market development in East Africa Energy for Sustainable Development 46 23-31 doi101016jesd201805012
100 Clemens H Bailis R Nyambane A amp Ndungrsquou V (2018) Africa biogas partnership program A review of clean cooking implementation through market development in East Africa Energy for Sustainable Development 46 23-31 doi101016jesd201805012
101 Africa Biogas Partnership Programme (nd) Countries - Kenya Retrieved from Africa Biogas website
INTERVENTION 2 REGENER ATIVE CROP PRODUC TION AND AGROFORESTRY
102 FAOSTAT (2017) Agriculture total Retrieved from FAO website
103 Cardinael R Mao Z Chenu C amp Hinsinger P (2020) Belowground functioning of agroforestry systems recent advances and perspectives Plant Soil 453 1ndash13 doi101007s11104-020-04633-x
104 FAO (2011) Green manurecover crops and crop rotation in conservation agriculture on small farms (Vol 12 Integrated Crop Management pp 1-109 Rep) Rome FAO Retrieved from FAO website
125124
105 FAO (nd) Agroforestry Retrieved from FAO website
106 FAO (nd) Community-based forestry Retrieved from FAO website
107 This is also supported by experts interviewed for this project
108 IPCC (2019) Interlinkages between desertification land degradation food security and greenhouse gas fluxes Synergies trade-offs and integrated response options Retrieved from IPCC website
109 Project Drawdown (nd) Table of solutions Retrieved from Project Drawdown website
110 (UNFCCC) (nd) Parties Retrieved from UNFCCC website
111 As the non-Annex 1 countries exclude all EU Member States and several economies in transition the proxy is imperfect According to FAOSTAT 74 of global GHG emissions from agriculture are from non-Annex-1 countries under the UNFCCC
112 IPCC (2019) Special report on climate change and land Retrieved from IPCC website
113 IPCC (2019) Special report on climate change and land Retrieved from IPCC website
114 IPCC (2019) Special report on climate change and land Retrieved from IPCC website
115 Ranganathan J Waite R Searchinger T amp Zionts J (2021) Regenerative agriculture Good for soil health but limited potential World Resources Institute Retrieved from WRI website
116 Hawken P (Ed) (2017) Drawdown The most comprehensive plan ever proposed to reverse global w
117 This is also supported by experts interviewed for this project
118 Gosnell H Gill N amp Voyer M (2019) Transformational adaptation on the farm Processes of change and persistence in transitions to ldquoclimate-smartrdquo regenerative agriculture Global Environmental Change 59 101965 doi101016jgloenvcha2019101965
119 According to an interviewee regenerative agriculture overlaps with lsquoagroecologyrsquo which aims to increase the diversity in what we plant and eat which is healthier for the soil and for consumers
120 IPCC (2019) Special report on climate change and land Retrieved from IPCC website
121 Capital Business (2019) Government urged to withdraw harmful agro-chemicals from the market Retrieved from Capital website This is also supported by experts interviewed within this project
122 This is also supported by experts interviewed within this project
123 Hawken P (Ed) (2017) Drawdown The most comprehensive plan ever proposed to reverse global warming Penguin
124 This is also supported by experts interviewed within this project
125 Preston F Lehne J amp Wellesley L (2019) An inclusive circular economy Priorities for Developing Countries Retrieved from Chatham House website
126 Focus on Land (2012) Rights to trees and livelihoods in Niger Retrieved from Focus on Land website
127 Franzel S Denning G L Lillesoslash J P B amp Mercado A R (2004) Scaling up the impact of agroforestry Lessons from three sites in Africa and Asia Agroforestry Systems 61-62(1-3) 329ndash344 doi101023bagfo0000029008717432d
128 Yu D (2020) Consumer companies are accelerating investments in regenerative agriculture to combat climate change Forbes Retrieved from Forbes website
129 Das D (2020) Nestleacute invests CHF25m in forest preservation in Ivory Coast ESM Magazine Retrieved from ESM Magazine
130 Burwood-Taylor L (2019) Danone leads a coalition of AgriFood leaders to transition dairy farming to regenerative practices AgFunderNews Retrieved from AgFunderNews website
131 Bedord L (2020) General Mills believes farmers have a massive role to play in solving climate change Successful Farming Retrieved from Agriculture website
132 Own recommendations
133 FAO (nd) Agroecology Knowledge Hub circular and solidarity economy it reconnects producers and consumers and provides innovative solutions for living within our planetary boundaries while ensuring the social foundation for inclusive and sustainable development Retrieved from FAO website
134 Agroecology Europe (2020) Principles of agroecology Retrieved from Agroecology Europe website
135 Cuesta F (2020) UTT and the struggle for land in Argentina Rosa Luxemburg Foundation Retrieved from Rosa Luxemburg Foundation website
INTERVENTION 3 BIOECONOMY AND BIO-BASED MATERIALS
136 Analysis of the CDM pipeline from December 2017 by Shifting Paradigms as background research to the publication Stanley Foundation (2018) Looking beyond borders The circular economy pathway for pursuing 15degC
137 Deutsche Welle (nd) 5 sustainable alternatives to plastic Retrieved from DW website
138 Scientific American (2019) The mycelium revolution is upon us Retrieved from Scientific American website
139 European Bioplastics (nd) Bioplastics Retrieved from European Bioplastics website
140 IPCC Climate change and land (2019) Retrieved from IPCC website
141 WRI (2020) 4 charts explain greenhouse gas emissions by countries and sectors Retrieved from WRI website
142 Lehmann S (2013) Low carbon construction systems using prefabricated engineered solid wood panels for urban infill to significantly reduce greenhouse gas emissions Sustainable Cities and Society 6 57-67 doi101016jscs201208004
143 Andrew R M (2019) Global CO2 emissions from cement production 1928ndash2018 Earth System Science Data 11(4) 1675-1710 doi105194essd-10-195-2018
144 Mallo M F L amp Espinoza O (2016 August) Cross-laminated timber vs concretesteel cost comparison using a case study In World Conference on Timber EngineeringndashWCTE Vienna Austria Retrieved from Research Gate website
145 Think Wood (2020) How mass timber can cut your construction cost Retrieved from Think Wood website
146 Cazemier DS (2017) Comparing cross laminated timber with concrete and steel A financial analysis of two buildings in Australia Modular and Offsite Construction Summit amp the 2nd International Symposium on Industrialized Construction Technology Shanghai China
147 Lehmann S (2013) Low carbon construction systems using prefabricated engineered solid wood panels for urban infill to significantly reduce greenhouse gas emissions Sustainable Cities and Society 6 57-67 doi101016jscs201208004
148 Esti Asih N (2016) The potential of bamboo as building material in organic shaped buildings Procedia - Social and Behavioral Sciences 216 30 ndash 38 doi101016jsbspro201512004 doi101016jsbspro201512004
149 CEBR (2015) The future potential economic impacts of a bio-plastics industry in the UK Retrieved from BBIA website
150 Sandanayake M Lokuge W Zhang G Setunge S amp Thushar Q (2018) Greenhouse gas emissions during timber and concrete building constructionmdashA scenario based comparative case study Sustainable Cities and Society 38 91-97 doi101016jscs201712017
151 CEBR (2015) The future potential economic impacts of a bio-plastics industry in the UK (pp 6 and 40-44) Retrieved from BBIA website
152 Arup amp Ellen MacArthur Foundation (2018) First steps towards a circular built environment (pp 35-36) Retrieved from Arup website
153 Lehmann S (2013) Low carbon construction systems using prefabricated engineered solid wood panels for urban infill to significantly reduce greenhouse gas emissions Sustainable Cities and Society 6 57-67 doi101016jscs201208004
154 Churkina G Organschi A Reyer C P Ruff A Vinke K Liu Z amp Schellnhuber H J (2020) Buildings as a global carbon sink Nature Sustainability 3 269-276 Retrieved from Nature website
155 BBC (2019) Could wooden buildings be a solution to climate change Retrieved from BBC website
156 Circl (nd) The making of Circl Retrieved from Circl website
157 Mishra G Giri K Panday S Kumar R amp Bisht N S (2014) Bamboo potential resource for eco-restoration of degraded lands Journal of Biology and Earth Sciences 4(2) B130-B136 Retrieved from Research Gate website
158 Planet Ark (nd) Make it wood Retrieved from Planet Ark website
159 Guumlccedilhan N Ş (2007) Observations on earthquake resistance of traditional timber-framed houses in Turkey Building and environment 42(2) 840-851 doi101016jbuildenv200509027
160 van Crevel R (2016) Bio-based food packaging in Sustainable Development Retrieved from FAO website
161 Climate Scorecard (2020) EU focus on the bioeconomy holds great promise for the growth of green jobs Retrieved from Climate Scorecard website
162 Fanella D A (2018) Cost comparison of cross laminated timber (CLT) and cast-in-place reinforced concrete structures Retrieved from Research Gate website
163 Mallo M F L amp Espinoza O (2016) Cross-laminated timber vs concretesteel cost comparison using a case study World Conference on Timber EngineeringndashWCTE Vienna Austria
164 European Commission (2017) A European strategy for plastics in a circular economy Retrieved from EC website
165 van Crevel R (2016) Bio-based food packaging in sustainable development Retrieved from FAO website
166 Dosumu O S amp Aigbavboa C (2020) An investigation of the barriers to the uptake of local materials in Africa A literature review approach African Journal of Science Technology Innovation and Development 12(4) 365-371 doi1010802042133820191654251
127126
167 Abraham P S amp Gundimeda H (2017) lsquoGreeningrsquo the buildings an analysis of barriers to adoption in India Cities and the Environment (CATE) 10(1) 10 Retrieved from Digital Commons website
168 Gosselin A Blanchet P Lehoux N amp Cimon Y (2017) Main motivations and barriers for using wood in multi-story and non-residential construction projects BioResources 12(1) 546-570 doi1015376biores121546-570
169 UNECE (2015) Forests in the Northern Hemisphere are growing but reforms are needed to maximise their economic and social use Retrieved from UNECE website
170 Packaging Law (2020) Biobased Plastics and the Sustainability Puzzle Retrieved from Packaging Law website
171 van Crevel R (2016) Bio-based food packaging in sustainable development Retrieved from FAO website
172 Clean Tech (2019) Are plants the solution to our plastics problem Retrieved from Clean Tech website
173 Scientific and Technical Advisory Panel (2018) Novel Entities Retrieved from STAP website
174 Pierobon F Huang M Simonen K amp Ganguly I (2019) Environmental benefits of using hybrid CLT structure in midrise non-residential construction An LCA based comparative case study in the US Pacific Northwest Journal of Building Engineering 26 100862 doi101016jjobe2019100862
175 Lu X Li Y Guan H amp Ying M (2017) Progressive collapse analysis of a typical super-tall reinforced concrete frame-core tube building exposed to extreme fires Fire Technology 53(1) 107-133 doi101007s10694-016-0566-6
176 Thinkwood (2020) The whole wood world of Think Wood Retrieved from Thinkwood website
177 mgb ARCHITECTURE + DESIGN (2012) The case for tall wood buildings how mass timber offers a safe economical and environmental friendly alternative for tall building structures Retrieved from TRAE website
178 B1M (2017) Top 5 the worldrsquos tallest timber buildings Retrieved from B1M website
179 Mass Timber Code Coalition (2018) Tall mass timber buildings factsheet Retrieved from Thinkwood website
180 Bioplastic Feedstock Alliance (nd) The role of bioplastics in a circular economy Retrieved from BFA website
181 Office of Energy Efficiency and Renewable Energy (nd) Plastics or fibers from bio-based polymers Retrieved from Energygov website
182 IACGB (2020) Global Bioeconomy Policy Report (IV) A decade of bioeconomy policy development around the world Retrieved from Global Bioeconomy Summit website
183 Sharma B Gatoacuteo A Bock M amp Ramage M (2015) Engineered bamboo for structural applications Construction and building materials 81 66-73
184 Ananas Anam (nd) Responsibility Retrieved from Ananas Anam website
185 Designboom amp Hudson D (2018 June 8) Bamboo houses shape Ibukursquos green village community in indonesia Designboom Architecture amp Design Magazine Retrieved from Designboom website
186 PIK (2020) Buildings can become a global CO2 sink if made out of wood instead of cement and steel Retrieved from Science Daily website
187 Ivanova D Barrett J Wiedenhofer D Macura B Callaghan M amp Creutzig F (2020) Quantifying the potential for climate change mitigation of consumption options Environmental Research Letters 15(9) 093001 doi1010881748-9326ab8589
188 Lehmann S (2013) Low carbon construction systems using prefabricated engineered solid wood panels for urban infill to significantly reduce greenhouse gas emissions Sustainable Cities and Society 6 57-67 doi101016jscs201208004
INTERVENTION 4 REDUCING FOOD LOSSES FROM HARVEST TO PROCESSING
189 Hanson C Flanagan K Robertson K Axmann H Bos-Brouwers H Broeze J amp Westra E (2019) Reducing food loss and waste Ten interventions to scale impact Retrieved from WRI website
190 Hanson C Flanagan K Robertson K Axmann H Bos-Brouwers H Broeze J amp Westra E (2019) Reducing food loss and waste Ten interventions to scale impact Retrieved from WRI website
191 FAO (2011) Global food losses and food waste ndash Extent causes and prevention Retrieved from FAO website
192 InspiraFarms (nd) Retrieved from Inspira Farms website
193 Deloitte (2015) Reducing food loss along African agricultural value chains Retrieved from Deloitte website
194 Deloitte (2015) Reducing food loss along African agricultural value chains Retrieved from Deloitte website
195 Deloitte (2015) Reducing food loss along African agricultural value chains Retrieved from Deloitte website
196 IPCC (2019) Special report on climate change and land Retrieved from IPCC website
197 Project Drawdown (nd) Table of solutions Retrieved from Project Drawdown website
198 IPCC (2019) Special report on climate change and land Retrieved from IPCC website
199 FAO (2013) Food wastage footprint - Impacts on natural resources Summary report Retrieved from FAO website
200 FAO (2011) Global food losses and food waste ndash Extent causes and prevention Retrieved from FAO website
201 Population Reference Bureau (2007) World population data sheet Retrieved from PRB website
202 Flanagan K Robertson K A I Hanson C amp Timmermans A J M (2019) Reducing food loss and waste setting a global action agenda WRI Retrieved from WRI website
203 Flanagan K Robertson K A I Hanson C amp Timmermans A J M (2019) Reducing food loss and waste setting a global action agenda WRI Retrieved from WRI website
204 FAO (2019) The state of food and agriculture Retrieved from FAO website
205 This is also supported by experts interviewed within this project
206 Hanson C Flanagan K Robertson K Axmann H Bos-Brouwers H Broeze J amp Westra E (2019) Reducing food loss and waste Ten interventions to scale impact Retrieved from WRI website
207 Project Drawdown (nd) Reduced food waste - Technical summary Retrieved from Project Drawdown website
208 Deloitte (2015) Reducing food loss along African agricultural value chains Retrieved from Deloitte website
209 Hanson C Flanagan K Robertson K Axmann H Bos-Brouwers H Broeze J amp Westra E (2019) Reducing food loss and waste Ten interventions to scale impact Retrieved from WRI website
210 Hanson C Flanagan K Robertson K Axmann H Bos-Brouwers H Broeze J amp Westra E (2019) Reducing food loss and waste Ten interventions to scale impact Retrieved from WRI website
211 Gruegravere G Shigemitsu M Crawford S (2020) Agriculture and water policy changes stocktaking and alignment with OECD and G20 recommendations OECD Food Agriculture and Fisheries Papers No 144 OECD Publishing Paris doi101787f35e64af-en
212 Hanson C Flanagan K Robertson K Axmann H Bos-Brouwers H Broeze J amp Westra E (2019) Reducing food loss and waste Ten interventions to scale impact Retrieved from WRI website
213 FAO (2019) The state of food and agriculture Retrieved from FAO website
214 Hanson C Flanagan K Robertson K Axmann H Bos-Brouwers H Broeze J amp Westra E (2019) Reducing food loss and waste Ten interventions to scale impact Retrieved from WRI website
215 This is also supported by experts interviewed within this project
216 This is also supported by experts interviewed within this project
217 Hanson C Flanagan K Robertson K Axmann H Bos-Brouwers H Broeze J amp Westra E (2019) Reducing food loss and waste Ten interventions to scale impact Retrieved from WRI website
218 FAO (2014) Reducing food losses and waste in the Near East amp North Africa region Retrieved from FAO website
219 WWF (2017) Food loss and waste Facts and futures Retrieved from WWF website
220 Hawken P (Ed) (2017) Drawdown The most comprehensive plan ever proposed to reverse global warming Penguin
221 Flanagan K Robertson K A I Hanson C amp Timmermans A J M (2019) Reducing food loss and waste setting a global action agenda WRI Retrieved from WRI website
222 Cooling as a Service Initiative (2020) Cooling as a Service case study CaaS prize winner ColdHubs improves cold storage access in Nigeria Retrieved from CaaS Initiative website
223 ColdHubs (nd) Retrieved from ColdHubs website
224 Energy Base (2020) Meet the global CaaS prize winner ColdHubs Retrieved from Energy Base website
225 Cooling as a Service Initiative (2020) Cooling as a Service case study CaaS prize winner ColdHubs improves cold storage access in Nigeria Retrieved from CaaS initiative website
INTERVENTION 5 AVOIDING FOOD WASTE AT THE RETAILER AND CONSUMER STAGES
226 Poore J amp Nemecek T (2018) Reducing foodrsquos environmental impacts through producers and consumers Science 360(6392) 987-992 doi101126scienceaaq0216
227 Flanagan K Robertson K A I Hanson C amp Timmermans A J M (2019) Reducing food loss and waste Setting a Global Action Agenda WRI Retrieved from WRI website
228 ReFed (2016) A roadmap to reduce US food waste by 20 percent Retrieved from Refed website
229 IPCC (2019) Special report on climate change and land Retrieved from IPCC website
129128
230 FAO (2011) Global food losses and food waste ndash Extent causes and prevention Retrieved from FAO website
231 Project Drawdown (nd) Table of solutions Retrieved from Project Drawdown website
232 IPCC (2019) Special report on climate change and land Retrieved from IPCC website
233 FAO (2013) Food wastage footprint - Impacts on natural resources Summary report Retrieved from FAO website
234 FAO (2011) Global food losses and food waste ndash Extent causes and prevention Retrieved from FAO website
235 Population Reference Bureau (2007) 2007 world population data sheet Retrieved from PRB website
236 Flanagan K Robertson K A I Hanson C amp Timmermans A J M (2019) Reducing food loss and waste Setting a Global Action Agenda WRI Retrieved from WRI website
237 rdquoFlanagan K Robertson K A I Hanson C amp Timmermans A J M (2019) Reducing food loss and waste setting a global action agenda WRI Retrieved from WRI website
238 FAO (2019) The state of food and agriculture Retrieved from http FAO website
239 This is also supported by experts interviewed within this project FAO (2019) The state of food and agriculture Retrieved from http FAO website
240 Hanson C Flanagan K Robertson K Axmann H Bos-Brouwers H Broeze J amp Westra E (2019) Reducing food loss and waste ten interventions to scale Impact Retrieved from WRI website
241 Gruegravere G Shigemitsu M Crawford S (2020) Agriculture and water policy changes stocktaking and alignment with OECD and G20 recommendations OECD Food Agriculture and Fisheries Papers No 144 OECD Publishing Paris doi101787f35e64af-en
242 Hanson C Flanagan K Robertson K Axmann H Bos-Brouwers H Broeze J amp Westra E (2019) Reducing food loss and waste Ten interventions to scale impact Retrieved from WRI website
243 FAO (2014) Reducing food losses and waste in the Near East amp North Africa region Retrieved from FAO website
244 WWF (2017) Food loss and waste Facts and futures Retrieved from WWF website
245 Hanson C Flanagan K Robertson K Axmann H Bos-Brouwers H Broeze J amp Westra E (2019) Reducing food loss and waste Ten interventions to scale impact Retrieved from WRI website
246 FAO (nd) FAO regional office for Near East and North Africa Retrieved from FAO website
247 Tekeya (nd) Retrieved from Tekeya website
248 Mansour M (2020) Egyptian entrepreneur tackling challenges of gender issues and food wastage China Africa Retrieved from Chinafrica website
249 Mansour M (2020) Menna Shahin Egyptian social entrepreneur and role model Inside Arabia Retrieved from Inside Arabia website
250 Tekeya (nd) Retrieved from Tekeya website
251 Mansour M (2020) Menna Shahin Egyptian social entrepreneur and role model Inside Arabia Retrieved from Inside Arabia website
252 Mansour M (2020) Egyptian entrepreneur tackling challenges of gender issues and food wastage China Africa Retrieved from Chinafrica website
253 StartUpScene (2020) Tekaya is Egyptrsquos first tech startup tackling food waste Retrieved from Start Up Scene website
254 Zero Waste Europe (2020) The story of too good to go Retrieved from Zero Waste Europe website
255 CrunchBase (nd)TeKeya - Crunchbase company profile amp funding Retrieved from CrunchBase website
256 Mansour M (2020) Egyptian entrepreneur tackling challenges of gender issues and food wastage China Africa Retrieved from Chinafrica website
257 Maged M (2019) Tekeya app turning food waste into affordable wholesome meals Retrieved from Egypt Independent website
258 Mansour M (2020) Egyptian entrepreneur tackling challenges of gender issues and food wastage China Africa Retrieved from Chinafrica website
259 Middle East North Africa Financial Network (2019) Tekeya The food charity distribution app combating hunger in Egypt Retrieved from MENAFN website
INTERVENTION 6 CLOSING THE LOOP ON URBAN ORGANIC RESIDUES
260 Climate Focus Ecofys (2017) Pilot Auction Facility Opportunities beyond the piloting phase (p 27) Retrieved from Pilot Auction Facility website
261 Scarlat Nicolae amp Motola Vincenzo amp Dallemand Jean amp Monforti Fabio amp Mofor Linus (2015) Evaluation of energy potential of Municipal Solid Waste from African urban areas Renewable and Sustainable Energy Reviews 50 doi101016jrser201505067
262 WRI (2020) Climate Watch Historical GHG Emissions [2016 data] Washington Retrieved at Climate Watch website
263 World Bank (nd) Trends in Solid Waste Management Retrieved from World Bank website
264 World Bank (nd) Trends in Solid Waste Management Retrieved from World Bank website
265 Project on Urban Reduction of Eutrophication (PURE) (2012) Good practices in sludge management p90-92
266 Ellen MacArthur Foundation (2019) Cities and circular economy for food Retrieved from Ellen MacArthur Foundation website
267 Science for Environment Policy (2017) Decentralised supply of recycled water may save energy and reduce greenhouse gas emissions Retrieved from European Commission website
268 Ellen MacArthur Foundation (2019) Cities and circular economy for food Retrieved from Ellen MacArthur Foundation website
269 Science for Environment Policy (2017) Decentralised supply of recycled water may save energy and reduce greenhouse gas emissions Retrieved from European Commission website
270 Ellen MacArthur Foundation (2019) Circular economy in cities - Mobility factsheets Retrieved from Ellen MacArthur Foundation website
271 Connor R Renata A Ortigara C Koncaguumll E Uhlenbrook S Lamizana-Diallo B M amp Brdjanovic D (2017) Wastewater the untapped resource The United Nations World Water Development Report Retrieved from UNESCO website
272 Weidner T amp Yang A (2020) The potential of urban agriculture in combination with organic waste valorization Assessment of resource flows and emissions for two european cities Journal of Cleaner Production 244 118490 doi101016jjclepro2019118490
273 Project Drawdown (nd) Table of solutions Retrieved from Project Drawdown website
274 WRI (2020) Climate Watch Historical GHG Emissions [2017 data] Washington Retrieved from Climate Watch website
275 Lwasa S Mugagga F Wahab B Simon D Connors J amp Griffith C (2014) Urban and peri-urban agriculture and forestry Transcending poverty alleviation to climate change mitigation and adaptation Urban Climate 7 92-106 doi101016juclim201310007
276 Kulak M Graves A amp Chatterton J (2013) Reducing greenhouse gas emissions with urban agriculture A Life Cycle Assessment perspective Landscape and Urban Planning 111 68-78 doi101016jlandurbplan201211007
277 Hamilton A J Burry K Mok H F Barker S F Grove J R amp Williamson V G (2014) Give peas a chance Urban agriculture in developing countries A review Agronomy for Sustainable Development 34(1) 45-73 doi101007s13593-013-0155-8
278 Weidner T amp Yang A (2020) The potential of urban agriculture in combination with organic waste valorization Assessment of resource flows and emissions for two European cities Journal of Cleaner Production 244 118490 doi101016jjclepro2019118490
279 Dubbeling M (2014) Urban agriculture as a climate change and disaster risk reduction strategy Urban Agriculture Magazine 27 3-7 Retrieved from OpenEditions Journals
280 Hawken P (Ed) (2017) Drawdown The most comprehensive plan ever proposed to reverse global warming Penguin
281 Lwasa S Mugagga F Wahab B Simon D Connors J amp Griffith C (2014) Urban and peri-urban agriculture and forestry Transcending poverty alleviation to climate change mitigation and adaptation Urban Climate 7 92-106 doi101016juclim201310007
282 Dubbeling M (2014) Urban agriculture as a climate change and disaster risk reduction strategy Urban Agriculture Magazine 27 3-7 Retrieved from OpenEditions Journals
283 Ellen MacArthur Foundation (2019) Cities and circular economy for food Retrieved from Ellen MacArthur Foundation website
284 Hamilton A J Burry K Mok H F Barker S F Grove J R amp Williamson V G (2014) Give peas a chance Urban agriculture in developing countries A review Agronomy for Sustainable Development 34(1) 45-73 doi101007s13593-013-0155-8
285 Hamilton A J Burry K Mok H F Barker S F Grove J R amp Williamson V G (2014) Give peas a chance Urban agriculture in developing countries A review Agronomy for Sustainable Development 34(1) 45-73 doi101007s13593-013-0155-8
286 Connor R Renata A Ortigara C Koncaguumll E Uhlenbrook S Lamizana-Diallo B M amp Brdjanovic D (2017) Wastewater the untapped resource The United Nations World Water Development Report Retrieved from UNESCO website
287 Aderemi A O amp Otitoloju A A (2012) An assessment of landfill fires and their potential health effects-a case study of a municipal solid waste landfill in Lagos Nigeria International Journal of Environmental Protection 2(2) 22-26 Retrieved from Research Gate website
288 This is also supported by experts interviewed within this projectHoornweg D Thomas L amp Otten L (1999) Composting and its applicability in developing countries World Bank working paper series 8 1-46 Retrieved from ELAW website
289 Connor R Renata A Ortigara C Koncaguumll E Uhlenbrook S Lamizana-Diallo B M amp Brdjanovic D
131130
290 Hamilton A J Burry K Mok H F Barker S F Grove J R amp Williamson V G (2014) Give peas a chance Urban agriculture in developing countries A review Agronomy for Sustainable Development 34(1) 45-73 doi101007s13593-013-0155-8
291 Hoornweg D Thomas L amp Otten L (1999) Composting and its applicability in developing countries World Bank working paper series 8 1-46 Retrieved from ELAW website
292 Hamilton A J Burry K Mok H F Barker S F Grove J R amp Williamson V G (2014) Give peas a chance Urban agriculture in developing countries A review Agronomy for Sustainable Development 34(1) 45-73 doi101007s13593-013-0155-8
293 [293]Hamilton A J Burry K Mok H F Barker S F Grove J R amp Williamson V G (2014) Give peas a chance Urban agriculture in developing countries A review Agronomy for Sustainable Development 34(1) 45-73 doi101007s13593-013-0155-8
294 Preston F Lehne J amp Wellesley L (2019) An inclusive circular economy Priorities for developing countries Retrieved from Chatham House website
295 Connor R Renata A Ortigara C Koncaguumll E Uhlenbrook S Lamizana-Diallo B M amp Brdjanovic D (2017) Wastewater the untapped resource The United Nations World Water Development Report Retrieved from UNESCO website
296 Hamilton A J Burry K Mok H F Barker S F Grove J R amp Williamson V G (2014) Give peas a chance Urban agriculture in developing countries A review Agronomy for Sustainable Development 34(1) 45-73 doi101007s13593-013-0155-8
297 Hoornweg D Thomas L amp Otten L (1999) Composting and its applicability in developing countries World Bank working paper series 8 1-46 Retrieved from ELAW website
298 Hoornweg D Thomas L amp Otten L (1999) Composting and its applicability in developing countries World Bank working paper series 8 1-46 Retrieved from ELAW website
299 Hoornweg D Thomas L amp Otten L (1999) Composting and its applicability in developing countries World Bank working paper series 8 1-46 Retrieved from ELAW website
300 Preston F Lehne J amp Wellesley L (2019) An inclusive circular economy Priorities for Developing Countries Retrieved from Chatham House website
301 Lou Z Wang M Zhao Y amp Huang R (2015) The contribution of biowaste disposal to odor emission from landfills Journal of the Air amp Waste Management Association 65(4) 479-484 doi1010801096224720141002870
302 Hawken P (Ed) (2017) Drawdown The most comprehensive plan ever proposed to reverse global warming Penguin
303 C40 Cities (2018) The sustainable street markets amp parks project From organic waste to a high-quality compost resource C40 Retrieved from C40 website
304 Climate and Clean Air Coalition (2016) Strategy for organic waste diversion - Collection treatment recycling and their challenges and opportunities for the city of Sao Paulo Brazil Retrieved from CCAC website
305 C40 Cities (2019) Composting waste in Satildeo Paulo to boost the circular economy C40 Knowledge Hub Retrieved from C40 Knowledge hub
306 Ricci-Juumlrgensen M (2019) Sao Paulorsquos strategy for organic waste management Urbanet Retrieved from Urbanet website
307 C40 Cities (2019) Composting waste in Satildeo Paulo to boost the circular economy C40 Knowledge Hub Retrieved from C40 knowledge hub
308 C40 Cities (2019) Composting waste in Satildeo Paulo to boost the circular economy C40 Knowledge Hub Retrieved from C40 knowledge hub
INTERVENTION 7 REDESIGN REUSE REPAIR AND REMANUFACTURE OF PRODUCTS AND RECYCLING OF GL ASS PAPER METALS AND PL ASTICS
309 Kaza S Yao L Bhada-Tata P amp van Woerden F (2018) What a Waste 20 A Global Snapshot of Solid Waste Management to 2050 Washington DC World Bank Retrieved from World Bank website
310 Kaza S Yao L Bhada-Tata P amp van Woerden F (2018) What a Waste 20 A Global Snapshot of Solid Waste Management to 2050 Washington DC World Bank Retrieved from World Bank website
311 Kaza S Yao L Bhada-Tata P amp van Woerden F (2018) What a Waste 20 A Global Snapshot of Solid Waste Management to 2050 Washington DC World Bank Retrieved from World Bank website
312 Stanley Foundation (2018) Looking beyond borders The circular economy pathway for pursuing 15degC Retrieved from Shifting Paradigms website
313 Circle Economy (2021) The circularity gap report 2021 (pp1-71 Rep) Amsterdam Circle Economy Retrieved from CGRi website
314 Turner D A Williams I D amp Kemp S (2015) Greenhouse gas emission factors for recycling of source-segregated waste materials Resources Conservation and Recycling 105 186-197 doi101016jresconrec201510026
315 Chatham House (2019) Inclusive Circular Economy Retrieved from Chatham House website
316 Hawken P (Ed) (2017) Drawdown The most comprehensive plan ever proposed to reverse global warming Penguin
317 WRI (2020) 4 charts explain greenhouse gas emissions by countries and sectors Retrieved from WRI website
318 Hawken P (Ed) (2017) Drawdown The most comprehensive plan ever proposed to reverse global warming Penguin
319 Bogner J Ahmed M A Diaz C Faaij A Gao Q Hashimoto S amp Zhang T (2007) Waste management in climate change 2007 Mitigation contribution of working group iii to the fourth assessment report of the intergovernmental panel on climate change Cambridge University Press Cambridge Retrieved from IPCC 2007
320 Abul S (2010) Environmental and health impact of solid waste disposal at Mangwaneni dumpsite in Manzini Swaziland Journal of Sustainable development in Africa 12(7) 64-78 doi101016jis201005003
321 UN-Habitat (2010) Solid waste management in the worldrsquos cities UN-HABITAT
322 Burnley S (2001) The impact of the European landfill directive on waste management in the United Kingdom Resources Conservation and Recycling 32 349-358
323 Productivity Commission (2006) Waste Management Report no 38 Canberra Productivity Commission Retrieved from Productivity Commission website
324 Kaza S Yao L Bhada-Tata P amp van Woerden F (2018) What a Waste 20 A Global Snapshot of Solid Waste Management to 2050 Washington DC World Bank Retrieved from World Bank website
325 Scheinberg A amp OECD (2015) Extended producer responsibility and the informal sector Retrieved from OECD website
326 Godfrey L Strydom W and Phukubye R (2016) Integrating the informal sector into the South African waste and recycling economy in the context of extended producer responsibility Retrieved from CSIR website
327 United Nations Environment Programme (2018) Africa Waste Management Outlook Nairobi United Nations Environment Programme Retrieved from UNEP website
328 EPA (nd) Hazardous waste recycling Retrieved from EPA website
329 OECD (nd) Strengthen markets for recycled plastics Retrieved from OECD website
330 SCPRAC (2020) Toxic additives in plastics Hidden hazards linked to common plastic products Retrieved from CPRAC website
331 Interreg NWE Fibersort (2018) Policy Recommendations Retrieved from NWE website
332 EC (2020) REACH Retrieved from EC website
333 Zero Waste Europe (2017) ldquoDeliver or payrdquo or how waste incineration causes recycling to slow down Retrieved from Zero Waste Europe website
334 Igniss Energy (nd) Calorific value of waste Retrieved from Igniss Energy website
335 Kaza Silpa Yao Lisa C Bhada-Tata Perinaz van Woerden Frank (2018) What a Waste 20 A Global Snapshot of Solid Waste Management to 2050 Urban Development Washington DC World Bank copy World Bank Retrieved from World Bank website
336 SWACH Cooperative (nd) Swaach impact Retrieved from Swach website
INTERVENTION 8 MAKE THE RENEWABLE ENERGY TR ANSITION CIRCUL AR
337 IEA (2020) Renewable Power Retrieved from IEA website
338 IEA (2020) Renewable Power Retrieved from IEA website
339 IEA (2020) Renewable Power Retrieved from IEA website
340 World Bank (2020) Minerals for climate action The mineral intensity of the clean energy transition Retrieved from World bank website
341 Ali S amp Katima J (2020) Technology critical elements and their relevance to the Global Environment Facility A STAP Background Document Washington DC Scientific and Technical Advisory Panel to the Global Environment Facility Retrieved from GEF website
342 Chemical amp Engineering News (2019) It rsquos time to get serious about recycling lithium-ion batteries Retrieved from CampEN website
343 Copper8 (2018) Metal demand for renewable electricity generation in the Netherlands Retrieved from Copper8 website
344 Ali S and Katima J (2020) Technology critical elements and their relevance to the Global Environment Facility A STAP Background Document Scientific and Technical Advisory Panel to the Global Environment Facility Washington DC Retrieved from GEF website
345 World Bank (2020) Minerals for climate action The mineral intensity of the clean energy transitionRetrieved from World Bank website
346 Harper G Sommerville R Kendrick E et al (2019) Recycling lithium-ion batteries from electric vehicles Nature 575(7781) 75-86 doi101038s41586-019-1682-5
347 USGS (2020) Mineral commodity summaries Retrieved from USGS website
133132
348 This is also supported by experts interviewed within this project
349 World Bank (2020) Minerals for climate action The mineral intensity of the clean energy transition Retrieved from World Bank website
350 Harper G Sommerville R Kendrick E et al (2019) Recycling lithium-ion batteries from electric vehicles Nature 575(7781) 75-86 doi101038s41586-019-1682-5
351 PRIO (2020) Green curses and violent conflicts The security implications of renewable energy sector Development in Africa Retrieved from PRIO website
352 World Bank (2020) Minerals for climate action The mineral intensity of the clean energy transition Retrieved from World Bank website
353 Circusol (nd) What to expect Retrieved from Circusol Project website
354 CABRISS (nd) Implementation of a circular economy based on recycled reused and recovered indium silicon and silver materials for photovoltaic and other applications Retrieved from Spire 2030 website
355 Chemical Leasing (2020) What is chemical leasing Retrieved from Chemical Leasing website
INTERVENTION 9 ECO-INNOVATION IN INDUSTRIAL CLUSTERS AND INFORMAL NET WORKS
356 Portas Roberto amp Ruiz-Puente Carmen (2017) Development of the tool symbioSyS to support the transition towards a circular economy based on industrial symbiosis strategies Waste and Biomass Valorization 8 doi101007s12649-016-9748-1
357 Daniels S (2010) Making Do - Innovation in Kenyarsquos informal economy Retrieved from Issuu website
358 Hawken P (Ed) (2017) Drawdown The most comprehensive plan ever proposed to reverse global warming Penguin
359 WRI (2020) 4 charts explain greenhouse gas emissions by countries and sectors Retrieved from WRI website
360 World Bank (2020) Industry (including construction) value added (constant 2010 US$) Retrieved from World Bank website
361 World Bank (2018) Eco-industrial parks emerge as an effective approach to sustainable growth Retrieved from World Bank website
362 This is also supported by experts interviewed within this project
363 FAO (nd) AQUASTATmdashFAOrsquos global information system on water and agriculture Retrieved from FAO website
364 This is also supported by experts interviewed within this project
365 SRI (nd) Sustainable recycling Retrieved from SRI website
366 Green Industry Platform (2020) UNIDOrsquos eco-industrial parks (EIP) tools Retrieved from Green Industry Platform website
367 The Private Sector Advisory Group (2019) GEFrsquos private sector engagement strategy Retrieved from GEF website
368 UNIDO (2020) Fostering eco-industrial parks in Viet Nam Retrieved from UNIDO website
369 Circle Economy (2020) The circularity gap report 2020 (pp 1-64 Rep) Amsterdam Circle Economy Retrieved from CGRi Website
INTERVENTION 10 CIRCUL AR DESIGN IN CONSTRUCTION
370 Gallego-Schmid A Chen H M Sharmina M amp Mendoza J M F (2020) Links between circular economy and climate change mitigation in the built environment Journal of Cleaner Production 121115 doi101016jjclepro2020121115
371 International Energy Agency amp Directorate of Sustainable Energy Policy (2013) Transition to sustainable buildings strategies and opportunities to 2050 Retrieved from IEA website
372 Schulze G (2016) Growth within A circular economy vision for a competitive Europe Ellen MacArthur Foundation and the McKinsey Center for Business and Environment 1-22 Retrieved from Ellen MacArthur Foundation website
373 Roumlck M Ruschi Mendes Saade M Balouktsi M Nygaard F Birgisdottir H Frischknecht R Habert G amp Luumltzkendorf T (2019) Embodied GHG emissions of buildingsndashthe hidden challenge for effective climate change mitigation Applied Energy 258 114107 doi101016japenergy2019114107
374 Osobajo O A Oke A Omotayo T amp Obi L I (2020) A systematic review of circular economy research in the construction industry Smart and Sustainable Built Environment doi101108sasbe-04-2020-0034
375 Andrew R M (2019) Global CO2 emissions from cement production 1928ndash2018 Earth System Science Data 11(4) 1675-1710 doi105194essd-10-195-2018
376 Ghisellini P Ripa M amp Ulgiati S (2018) Exploring environmental and economic costs and benefits of a circular economy approach to the construction and demolition sector A literature review Journal of Cleaner Production 178 618-643 doi101016jjclepro201711207
377 Thomas M D A (2007) Optimizing the use of fly ash in concrete (Vol 5420) Skokie IL Portland Cement Association Retrieved from Cement website
378 Srinivasan R amp Logadharani S (2019) A cracking alternative to cement-An innovative approaches Retrieved from Chennai ME amp MC Council website
379 Mapei (nd) Re-con Zero Evo Retrieved from Mapei website
380 Fischer A (2019) Building Value A pathway to circular construction finance Circle Economy Retrieved from Circle Economy website
381 Biomimicry Institute (nd) Retrieved from Biomimicry Institute website
382 Arup (2016) The circular economy in the built environment Retrieved from Arup website
383 Ivanova D Barrett J Wiedenhofer D Macura B Callaghan M amp Creutzig F (2020) Quantifying the potential for climate change mitigation of consumption options Environmental Research Letters 15(9) 093001 doi1010881748-9326ab8589
384 OECD (2018) OECD Factbook 2013 Economic environmental and social statistics Paris OECD Publishing doi101787factbook-2013-en
385 Victoria Burrows J L (2017) From thousands to billions-coordinated action towards 100 net zero carbon buildings by 2050 World Green Building Council Retrieved from APO website
386 Lehmann S (2013) Low carbon construction systems using prefabricated engineered solid wood panels for urban infill to significantly reduce greenhouse gas emissions Sustainable Cities and Society 6 57-67 doi101016jscs201208004
387 Ellen MacArthur Foundation (2019) Completing the picture How the circular economy tackles climate change Retrieved from Ellen MacArthur Foundation website
388 Akhimien N G amp Latif E (2019) Incorporating circular economy into passive design strategies in tropical Nigeria International Journal of Economics and Management Engineering 13(10) 1380-1385 doi105281zenodo3566345
389 Acharya D Boyd R Finch O (2018) From principles to practices First steps towards a circular built environment Retrieved from Arup website
390 Circular Economy Club (nd) Modular building Brummen Town Hall Retrieved from Circular Economy club
391 Thelen D van Acoleyen M Huurman W Tom T van Brunschot C Edgerton B amp Ben K (2018) Scaling
the circular built environment Pathways for business and government World Business Council for Sustainable Development amp Circle Economy Retrieved from WBCSD website
392 Project Drawdown (nd) High-performance glass Retrieved from Project Drawdown website
393 Project Drawdown (nd) Solutions Retrieved from Project Drawdown website
394 Mick Pearce (nd) Eastgate project description Retrieved from Mick Pearce website
395 Shen L Tam V Tam L and Ji Y (2010) Project feasibility study the key to successful implementation of sustainable and socially responsible construction management practice Journal of Cleaner Production 18 254-9 doi101016jjclepro200910014
396 Arif M amp Egbu C (2010) Making a case for offsite construction in China Engineering Construction and Architectural Management doi10110809699981011090170
397 [397] Kamali M Hewage K amp Sadiq R (2019) Conventional versus modular construction methods A comparative cradle-to-gate LCA for residential buildings Energy and Buildings 204 109479 doi101016jenbuild2019109479
398 Quale J Eckelman M J Williams K W Sloditskie G amp Zimmerman J B (2012) Construction matters comparing environmental impacts of building modular and conventional homes in the United States Journal of Industrial Ecology 16(2) 243-253 doi101111j1530-9290201100424x
399 Hoogzaad JA (2018) Two circular economy scans for North Holland Amsterdam Shifting Paradigms Retrieved from Shifting Paradigms website
400 Hart J Adams K Giesekam J Tingley D D amp Pomponi F (2019) Barriers and drivers in a circular economy the case of the built environment Procedia Cirp 80 619-624 doi101016jprocir201812015
401 Hopkinson P Chen H M Zhou K Wang Y amp Lam D (2018 August) Recovery and reuse of structural products from end-of-life buildings Proceedings of the Institution of Civil Engineers-Engineering Sustainability 172(3) 119-128 doi101680jensu1800007
402 Hart J Adams K Giesekam J Tingley D D amp Pomponi F (2019) Barriers and drivers in a circular economy the case of the built environment Procedia Cirp 80 619-624 doi101016jprocir201812015
403 Aguiar A Vonk R amp Kamp F (2019) BIM and circular design IOP Conference Series Earth and Environmental Science 225(1) 012068 IOP Publishingdoi1010881755-13152251012068
135134
404 Arup (2016) The circular economy in the built environment Retrieved from Arup website
405 Thelen D van Acoleyen M Huurman W Tom T van Brunschot C Edgerton B amp Ben K (2018) Scaling the circular built environment Pathways for business and government World Business Council for Sustainable Development amp Circle Economy Retrieved from WBCSD website
406 Hart J Adams K Giesekam J Tingley D D amp Pomponi F (2019) Barriers and drivers in a circular economy the case of the built environment Procedia Cirp 80 619-624 doi101016jprocir201812015
407 Arup (2016) The circular economy in the built environment Retrieved from Arup website
408 Arch Daily (nd) The Ecomo home project description Retrieved from Arch Daily website
409 Mick Pearce (nd) Eastgate project description Retrieved from Mick Pearce website
INTERVENTION 11 NON-MOTORISED AND SHARED TR ANSPORT
410 Climate Watch (2020) Historical GHG Emissions [2016 data] Washington DC WRI Retrieved from Climate Watch Data website
411 SLoCaT (2018) Transport and climate change global status report 2018 Retrieved from SLoCaT website
412 SLoCaT (2018) Transport and climate change global status report 2018 Retrieved from SLoCaT website
413 World Health Organization (nd) Transport air pollution and climate change Retrieved from WHO website
414 Project Drawdown (nd) Table of solutions Retrieved from Project Drawdown website
415 SLoCaT (2018) Transport and climate change global status report 2018 Retrieved from SLoCaT website
416 UNEP (2019) Emissions gap report 2019 Nairobi UNEP Retrieved from UNEP website
417 Ellen MacArthur Foundation (2019) Circular economy in cities - Mobility factsheets Retrieved from Ellen MacArthur Foundation website
418 Rodrigues P F Alvim-Ferraz M C M Martins F G Saldiva P Saacute T H amp Sousa S I V (2020) Health economic assessment of a shift to active transport Environmental Pollution 258 113745 doi101016jenvpol2019113745
419 Mizdrak A Blakely T Cleghorn C L amp Cobiac L J (2019) Potential of active transport to improve health reduce healthcare costs and reduce greenhouse gas emissions A modelling study PloS one 14(7) e0219316 doi101371journalpone0219316
420 Cooke S Koinange C amp Zuidgeest M (2019) Calculating the potential climate value of non-motorised transport projects in African cities Retrieved from Analysis amp Policy Observatory website
421 Titos G Lyamani H Drinovec L Olmo F J Močnik G amp Alados-Arboledas L (2015) Evaluation of the impact of transportation changes on air quality Atmospheric Environment 114 19-31 doi101016jatmosenv201505027
422 World Health Organization (nd) Preventing disease through healthy environments a global assessment of the burden of disease from environmental risks Retrieved from WHO website
423 Tuominen A Rehunen A Peltomaa J amp Maumlkinen K (2019) Facilitating practices for sustainable car sharing policies-An integrated approach utilizing user data urban form variables and mobility patterns Transportation Research Interdisciplinary Perspectives 2 100055 doi101016jtrip2019100055
424 City of Rotterdam (2011) Neighbourhood Takes Charge project [Fact sheet] Retrieved from European Forum for Urban Security website
425 Jacobsen P L (2015) Safety in numbers more walkers and bicyclists safer walking and bicycling Injury Prevention 21(4) 271-275 doi101136ip93205rep
426 Charron D (2017 October 9) Walkable neighborhoods provide health environmental and financial benefits Retrieved from Washington Post website
427 This is also supported by experts interviewed within this project
428 Goumlssling S (2020) Why cities need to take road space from cars-and how this could be done Journal of Urban Design 25(4) 443-448 doi1010801357480920201727318
429 Hawken P (Ed) (2017) Drawdown The most comprehensive plan ever proposed to reverse global warming Penguin
430 Appleyard B S amp Ferrell C E (2017) The Influence of crime on active amp sustainable travel New geo-statistical methods and theories for understanding crime and mode choice Journal of Transport amp Health 6 516-529 doi101016jjth201704002
431 Bunds K S Casper J M Hipp J A amp Koenigstorfer J (2019) Recreational walking decisions in urban away-from-home environments The relevance of air quality noise traffic and the natural environment Transportation research part F traffic psychology and behaviour 65 363-375 doi101016jtrf201908006
432 Ciulli F Kolk A amp Boe-Lillegraven S (2020) Circularity brokers digital platform organizations and waste recovery in food supply chains Journal of Business Ethics 167(2) 299-331 doi101007s10551-019-04160-5
433 Tirachini A Chaniotakis E Abouelela M amp Antoniou C (2020) The sustainability of shared mobility Can a platform for shared rides reduce motorized traffic in cities Transportation Research Part C Emerging Technologies 117 102707 doi101016jtrc2020102707
434 Arbaizar C (2020 May 13) On the deep implications of nudging in circular economy ndash Veltha ndash the blog Retrieved from Veltha website
435 This is also supported by experts interviewed within this project
436 Zipper D (2019 November 13) Therersquos no app for getting people out of their cars Retrieved from Bloomberg website
437 This is also supported by experts interviewed within this project
438 Siame G amp Muvombo M (2016 August 22) Developing countries face a catastrophic lack of urban planning capacity Retrieved from Citiscope website
439 This is also supported by experts interviewed within this project
440 Marshall W E amp Ferenchak N N (2019) Why cities with high bicycling rates are safer for all road users Journal of Transport amp Health 13 100539 doi101016jjth201903004
441 Hawken P (Ed) (2017) Drawdown The most comprehensive plan ever proposed to reverse global warming Penguin
442 Project Drawdown (nd) Bicycle infrastructure Retrieved from Project Drawdown website
443 Gatersleben B (2011) The car as a material possession Exploring the link between materialism and car ownership and use In Auto motives Emerald Group Publishing Limited
444 McCarthy N (2020 October 7) How much is Europe spending to boost cycling during COVID-19 World Economic Forum Retrieved from World Economic Forum website
445 Bain A (2013 September 20) Reclaiming the streets in Bogota Retrieved from BBC website
446 Hidalgo D (2018 December 3) Bogotaacutersquos new bike lane Not just a change in direction but a change in message Retrieved from TheCityFix website
447 All the information for this case study was sourced from Hamukoma N Doyle N amp Muzenda A (2018) Future of african cities project Rabat and Saleacutendashbridging the gap (No 1814) Policy Center for the New South Retrieved from Policy Center for the New South website
INTERVENTION 12 SHIFTING TO HEALTHIER AND MORE SUSTAINABLE DIETS
448 Gonzaacutelez N Marquegraves M Nadal M amp Domingo J L (2020) Meat consumption which are the current global risks A review of recent (2010-2020) evidence Food Research International 109341 doi101016jfoodres2020109341
449 Dickie A Streck C Roe S Zurek M Haupt F and Dolginow A (2014) Strategies for mitigating climate change in agriculture Report by Climate Focus and 544 California Environmental Associates 545 Retrieved from Climate Focus website
450 EAT Foundation (2015) Healthy diets from sustainable food systems Retrieved from EAT Foundation
451 FAO (nd) Dietary guidelines and sustainability Retrieved from FAO website
452 Ranganathan J Vennard D Waite R Dumas P Lipinski B Searchinger T I M amp GLOBAGRI-WRR M A (2016) Shifting diets for a sustainable food future WRI 831878447-1548317259 Retrieved from WRI website
453 IPCC (2019) Special report on climate change and land Retrieved from IPCC website
454 Dickie A Streck C Roe S Zurek M Haupt F and Dolginow A (2014) Strategies for mitigating climate change in agriculture Report by Climate Focus and 544 California Environmental Associates 545 Retrieved from Climate Focus website
455 IPCC (2019) Special report on climate change and land Retrieved from IPCC website
456 Ranganathan J Vennard D Waite R Dumas P Lipinski B Searchinger T I M amp GLOBAGRI-WRR M A (2016) Shifting diets for a sustainable food future WRI 831878447-1548317259 Retrieved from WRI website
457 Ranganathan J Vennard D Waite R Dumas P Lipinski B Searchinger T I M amp GLOBAGRI-WRR M A (2016) Shifting diets for a sustainable food future WRI 831878447-1548317259 Retrieved from WRI website
458 Dickie A Streck C Roe S Zurek M Haupt F and Dolginow A (2014) Strategies for mitigating climate change in agriculture Report by Climate Focus and 544 California Environmental Associates 545 Retrieved from Climate Focus website
459 Searchinger T Waite R Hanson C Ranganathan J Dumas P Matthews E amp Klirs C (2019) Creating a sustainable food future A menu of solutions to feed nearly 10 billion people by 2050 Final report WRI Retrieved from CIRAD website
460 IPCC (2019) Special report on climate change and land Retrieved from IPCC website
137136
461 UNFCCC (nd) Parties Retrieved from UNFCCC website
462 Project Drawdown (nd) Plant-rich diets Retrieved from Project Drawdown website
463 Dickie A Streck C Roe S Zurek M Haupt F and Dolginow A (2014) Strategies for mitigating climate change in agriculture Report by Climate Focus and 544 California Environmental Associates 545 Retrieved from Climate Focus website
464 Hawken P (Ed) (2017) Drawdown The most comprehensive plan ever proposed to reverse global warming Penguin
465 This is also supported by experts interviewed within this project
466 Ranganathan J Vennard D Waite R Dumas P Lipinski B Searchinger T I M amp GLOBAGRI-WRR M A (2016) Shifting diets for a sustainable food future WRI 831878447-1548317259 Retrieved from WRI website
467 Vermeulen S J Park T Khoury C K amp Beacuteneacute C (2020) Changing diets and the transformation of the global food system Annals of the New York Academy of Sciences 1478(1) 3 doi101111nyas14446
468 Meticulous Market Research Pvt Ltd (2020 February 26) Alternative proteins The market at the cusp of multi-billion dollar growth Retrieved from Press release Globe News Wire website
469 Remmers J (2020 July 31) FAO Global meat production decline True Animal Protein Price Coalition Retrieved from True Animal Protein Price Coalition website
470 IPCC (2019) Special report on climate change and land Retrieved from IPCC website
471 This is also supported by experts interviewed within this project
472 Lelieveld J Evans J S Fnais M Giannadaki D amp Pozzer A (2015) The contribution of outdoor air pollution sources to premature mortality on a global scale Nature 525(7569) 367-371 doi101038nature15371
473 Mikkelsen R (2009) Ammonia emissions from agricultural operations Fertilizer Better Crops 93(4) 9-11 Retrieved from Research Gate website
474 Giannadaki D Giannakis E Pozzer A amp Lelieveld J (2018) Estimating health and economic benefits of reductions in air pollution from agriculture Science of the Total Environment 622 1304-1316 doi101016jscitotenv201712064Get
475 This is also supported by experts interviewed within this project
476 Oliveira G McKay B Liu J (2021) Beyond land grabs new insights on land struggles and global agrarian change Globalizations 18(3) 321-338 doi1010801474773120201843842
477 Project Drawdown (nd) Plant-rich diets Retrieved from Project Drawdown website
478 This is also supported by experts interviewed within this project
479 van Vliet S Kronberg S L amp Provenza F D (2020) Plant-based meats human health and climate change Frontiers in Sustainable Food Systems 4 128 doi103389fsufs202000128
480 Baltenweck I (2019 September 16) Alternative meat products are not the answer for poorer countries Retrieved from Financial Times website
481 Lamb C (2019 March 29) Singapore to invest $535 million in RampD including cultured meat and robots Retrieved from The Spoon website
482 Zaraska M (2016) Meathooked The history and science of our 25-million-year obsession with meat Basic Books
483 University of Oslo (2016 October 11) The meat paradox ScienceDaily Retrieved from Science Daily website
484 Schulte I Bakhtary H Haupt F Siantidis S Fleckenstein M OrsquoConnor C (2020) Enhancing NDCs for food systems - Recommendations for decision-makers Retrieved from Climate Focus website
485 Ranganathan J Vennard D Waite R Dumas P Lipinski B Searchinger T I M amp GLOBAGRI-WRR M A (2016) Shifting diets for a sustainable food future WRI 831878447-1548317259 Retrieved from WRI website
486 Ranganathan J Vennard D Waite R Dumas P Lipinski B Searchinger T I M amp GLOBAGRI-WRR M A (2016) Shifting diets for a sustainable food future WRI 831878447-1548317259 Retrieved from WRI website
487 Du H Guo Y Bennett D A Bragg F Bian Z Chadni M amp Chen Z (2020) Red meat poultry and fish consumption and risk of diabetes a 9 year prospective cohort study of the China Kadoorie Biobank Diabetologia 63(4) 767-779 doi101007s00125-020-05091-x
488 Mikkelsen R (2009) Ammonia emissions from agricultural operations Fertilizer Better Crops 93(4) 9-11 Retrieved from Research Gate website
489 Solomons N W (2000) Plant-based diets are traditional in developing countries 21st century challenges for better nutrition and health Asia Pacific journal of clinical nutrition 9(S1) S41-S54 doi101046j1440-6047200000165x
490 FAO (nd) Dietary guidelines and sustainability Retrieved from FAO website
491 van Vliet S Kronberg S L amp Provenza F D (2020) Plant-based meats human health and climate change Frontiers in sustainable food systems 4 128 doi103389fsufs202000128
492 Gilliver L (2021 January 5) Burger King launches new vegan burger in UK says report Retrieved from Plant Based News website
493 Staff R (2020 November 9) McDonaldrsquos to debut ldquoMcPlantrdquo in 2021 Beyond Meat says co-created patty Retrieved from Reuters website
494 Ranganathan J Vennard D Waite R Dumas P Lipinski B Searchinger T I M amp GLOBAGRI-WRR M A (2016) Shifting diets for a sustainable food future WRI 831878447-1548317259 Retrieved from WRI website
495 Briefing C (2019 September 11) Is a ldquoMeatless Meatrdquo revolution really underway in China Retrieved from China Briefing News website
496 [496] Phelps T (2018) Protein A Chinese perspective A report prepared for Plant amp Food Research and MBIE Retrieved from Plantan Food website
497 Briefing C (2019 September 11) Is a ldquoMeatless Meatrdquo revolution really underway in China Retrieved from China Briefing News website
498 Jacobs A (2020 February 12) Sugary drink consumption plunges in Chile after new food law Retrieved from The New York Times website
499 Mridul A (2020 July 24) NotCo Latin Americarsquos leading plant-based company to be worth $250 million Retrieved from The Vegan Review website
500 [500] Shieber J (2018 July 28) The Not Company is looking to start a food revolution from Chile Retrieved from TechCrunch website
501 Shieber J (2020 July 24) The Not Company a maker of plant-based meat and dairy substitutes in Chile will soon be worth $250M Retrieved from TechCrunch website
502 Shieber J (2018 July 28) The Not Company is looking to start a food revolution from Chile Retrieved from TechCrunch website
503 Shieber J (2020 July 24) The Not Company a maker of plant-based meat and dairy substitutes in Chile will soon be worth $250M Retrieved from TechCrunch website
4 ACCELER ATING THE TR ANSITION TO A LOW-CARBON CIRCUL AR ECONOMY
504 Carbon Tracker (2020) Carbon budgets where are we now Retrieved from Carbon Tracker website
505 Olivier J G Schure K M amp Peters J A H W (2017) Trends in global CO2 and total greenhouse gas emissions PBL Netherlands Environmental Assessment Agency 5
Retrieved from PBL website
506 UNEP (2019) Emissions gap report 2019 Nairobi UNEP Retrieved from UNEP website
507 Stanley Foundation (2018) Looking beyond borders The circular economy pathway for pursuing 15degC Retrieved from Shifting Paradigms website
508 Ellen MacArthur Foundation (2018) The circular economy opportunity for urban amp industrial innovation in China Retrieved from Ellen MacArthur Foundation website
509 Preston F Lehne J amp Wellesley L (2019) An inclusive circular economy Priorities for developing countries London Chatham House Retrieved from Analysis amp Policy Observatory website
510 Preston F Lehne J amp Wellesley L (2019) An inclusive circular economy Priorities for developing countries London Chatham House Retrieved from Analysis amp Policy Observatory website
511 This is also supported by experts interviewed within this project
512 Expert Panel meeting on 13 January 2021
513 Expert Panel meeting on 13 January 2021
514 Ellen MacArthur Foundation (2018) The circular economy opportunity for urban amp industrial innovation in China Retrieved from Ellen MacArthur Foundation website
515 Expert Panel meeting on 13 January 2021
516 Preston F Lehne J amp Wellesley L (2019) An inclusive circular economy Priorities for developing countries London Chatham House Retrieved from Analysis amp Policy Observatory website
517 Expert Panel meeting on 13 January 2021
518 This is also supported by experts interviewed within this project
519 Deloitte (2015) Reducing Food Loss Along African Agricultural Value Chains Retrieved from Deloitte website
520 Expert Panel meeting on 13 January 2021
5 RECOMMENDATIONS
521 The GEF (nd) Our work Retrieved from GEF website
522 International Institute for Sustainable Development (2020) GEF Bulletin - A publication of the International Institute for Sustainable Development Monday 14 December 2020 Vol 192 No 25 Retrieved from IISD website
139138
523 Sims R Bierbaum R Leonard S amp Whaley C (2018) A future food system for healthy human beings and a healthy planet Scientific and Technical Advisory Panel to the Global Environment Facility Washington DC
524 Barra et al (2018) Plastics and the circular economy Scientific and Technical Advisory Panel to the Global Environment Facility Washington DC
525 Sims R Bierbaum R Leonard S amp Whaley C (2018) A future food system for healthy human beings and a healthy planet Scientific and Technical Advisory Panel to the Global Environment Facility Washington DC Retrieved from STAP website
526 Greening L A Greene D L amp Difiglio C (2000) Energy efficiency and consumptionmdashthe rebound effectmdasha survey Energy policy 28(6-7) 389-401 doi101016s0301-4215(00)00021-5
527 STAP (2019) Achieving enduring outcomes from GEF investment - A STAP document Retrieved from GEF website
528 UNDP (Draft for publication in 2021) Circular economy opportunities in The Gambia - A metabolic approach to define a resource efficient and low-carbon future
529 UNDP (2021) Circular economy opportunities Vanuatu Concise metabolic analysis (pp 1-46 Rep) New York UNDP Retrieved from UNDP website
530 Stanley Foundation (2018) Looking beyond borders The circular economy pathway for pursuing 15degC Retrieved from Shifting Paradigms website
531 The GEF (2019) The GEF and climate change-catalyzing transformation Retrieved from GEF website
532 STAP (2020) Delivering multiple benefits through the sound management of chemicals and waste - A STAP Advisory Document Retrieved from GEF website
533 Bierbaum R Cowie A Barra R Ratner B Sims R Stocking M amp Whaley C (2018) Integration To solve complex environmental problems Scientific and Technical Advisory Panel to the Global Environment Facility Washington DC Retrieved from GEF website
534 Preston F Lehne J amp Wellesley L (2019) An inclusive circular economy Priorities for developing countries London Chatham House Retrieved from Analysis amp Policy Observatory website
Shifting Paradigms and Circle Economy would like to thank the funder authors contributors Expert Panel members and interviewees for their contribution to the preparation of this Climate Change Mitigation through the Circular Economy report for the Scientific and Technical Advisory Panel (STAP) which advises the Global Environment Facility (GEF) on strategies projects and policies
INTERVIEWEESAdrienna Zsakay (Circular Economy Asia) Andrew Rudd (UN Habitat) Asaah Ndambi (WUR) Beatriz Luz (Exchange4Change) Burcu Turner (ICLEI) Claire Kneller (WRAP) Craig Hanson (WRI) David Rowlinson (Planet Ark) Franzisca Haupt (Climate Focus) Kariuki Waweru (African Circular Economy Network Kenya) Kathrin Zeller (C40) Klaus Tyrkko (UNIDO) Luis E Gonzales Carrasco (CLAPES UC) Marijn Zwinkels (Living Lands) Marta Gomez San Juan (FAO) Moeko Saito-Jensen (UNDP Cambodia) Pablo Tittonell (affiliated with INTA-CONICET WUR University of Groningen) Patrick Schroeder (Chatham House) Pawel Gluszynski (Towarzystwo na Rzecz Ziemi) Sarah Rhodes (Plastic Free Southeast Asia) Steven Franzel (World Agroforestry Centre) Sybren Bosch (Copper8) Veronica de la Cerda (TriCiclos)
CONTRIBUTORSAlexander Vasa (Inter-American Development Bank) Andrew Rudd (UN-Habitat) Anne Katrin Bogdanski (FAO) Brendan Edgerton (World Business Council for Sustainable Development) Burcu Tuncer (ICLEI) David McGinty (PACE) Gareth Philips (African Development Bank Group) Haseeb Bakhtary (Climate focus) Kariuki Waweru (African Circular Economy Network Kenya) Kathrin Zeller (C40) Klaus Tyrkko (UNIDO) Margaret Barihaihi (NDC Partnership Support Unit) Moeko Saito-Jensen (UNDP Cambodia) Ndaindila Haindongo (FAO) Nilgun Tas (UNIDO) Patrick Schroeder (Chatham House) Steven Franzel (World Agroforestry Centre)
ACKNOWLEDGEMENTS
STAP CONTRIBUTORS Sunday Leonard Alessandro Moscuzza Chris Whaley Rosina Bierbaum Saleem Ali
GEF CONTRIBUTORSAnil Bruce Sookdeo Claude Gascon Gustavo Fonseca Leah Bunce Karrer Milena Gonzalez Vasquez Ming Yang Satoshi Yoshida Pascal Martinez
141140
circle-economycom
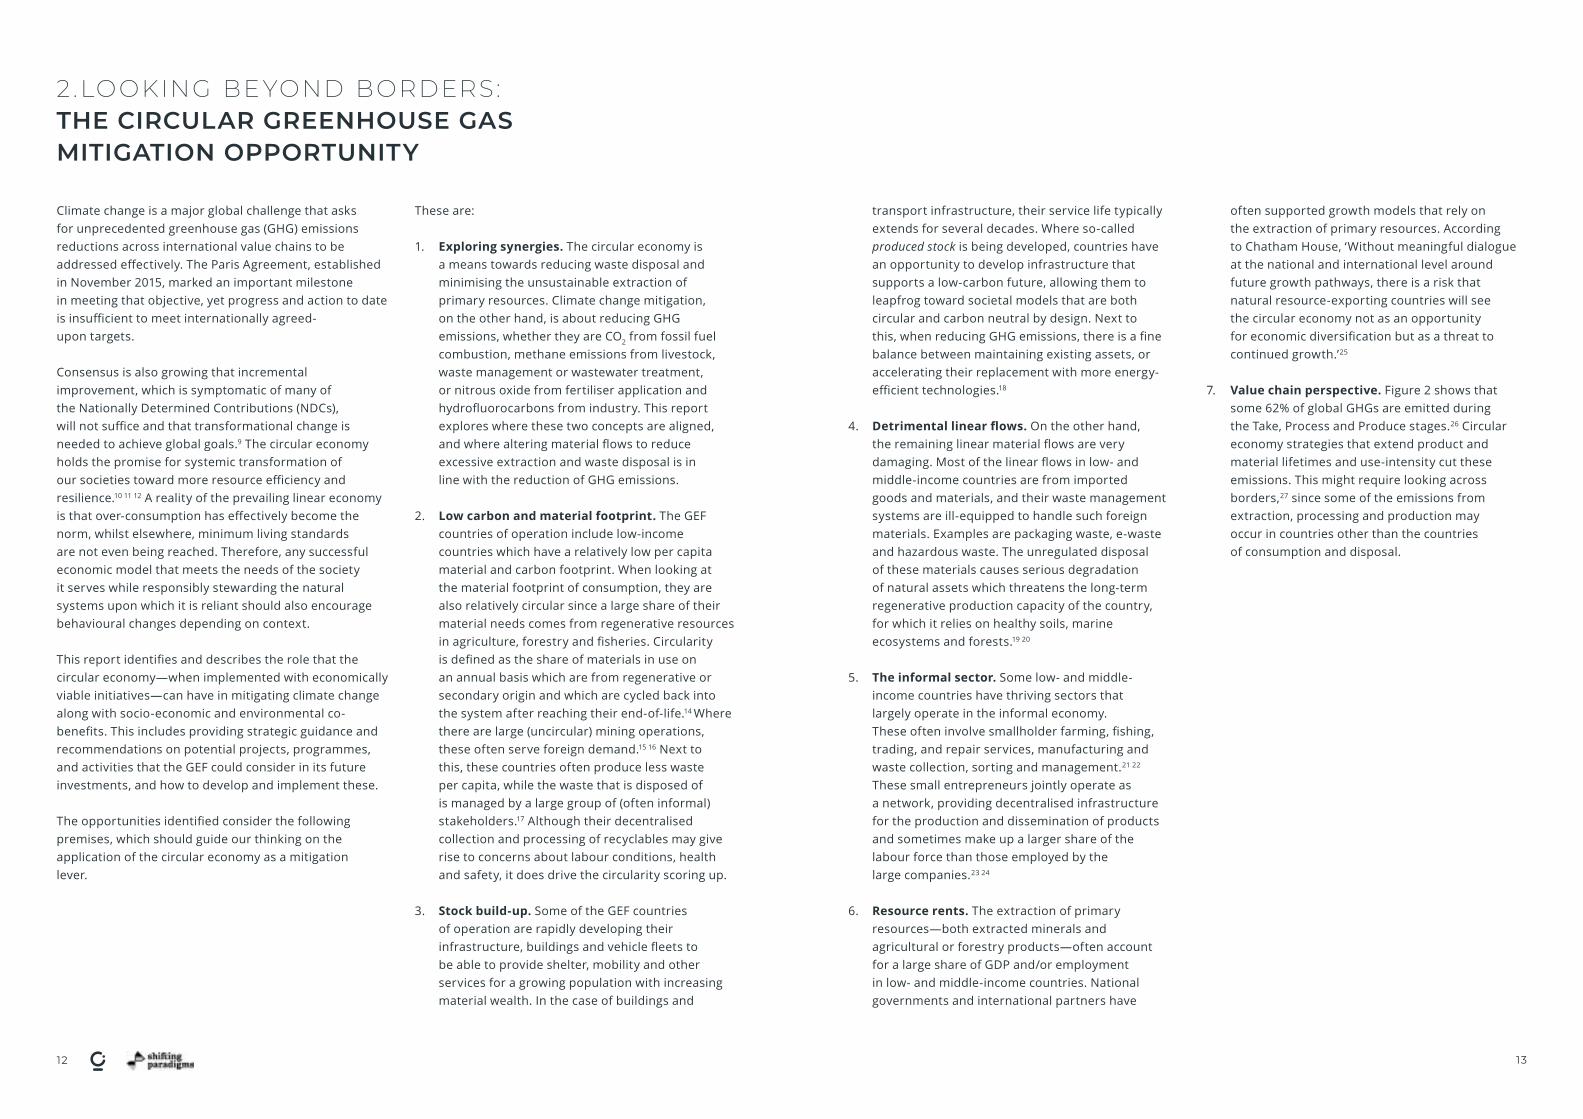