Embed Size (px)
Citation preview
Climate Change Researchin Northeastern US and
Eastern Canadian Forest Ecosystems
Lindsey RustadUSDA Forest Service
October 26, 2005, Albany New York
Overview• Set the Stage – Climate Change
• Overview of Regional Research
• A New Synthesis and Outreach Project
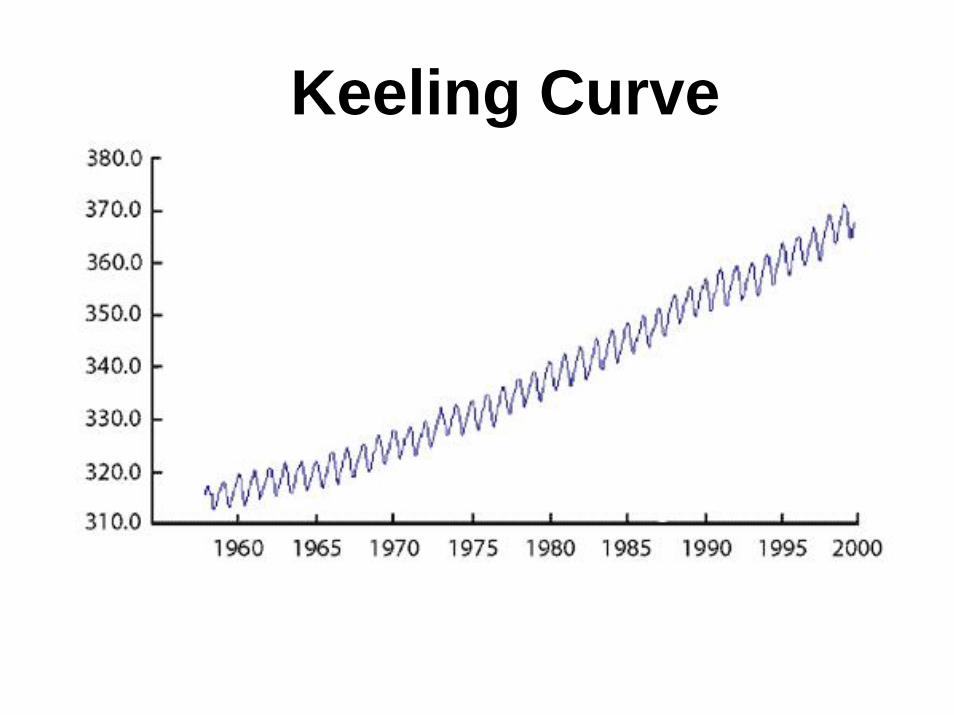
Keeling Curve
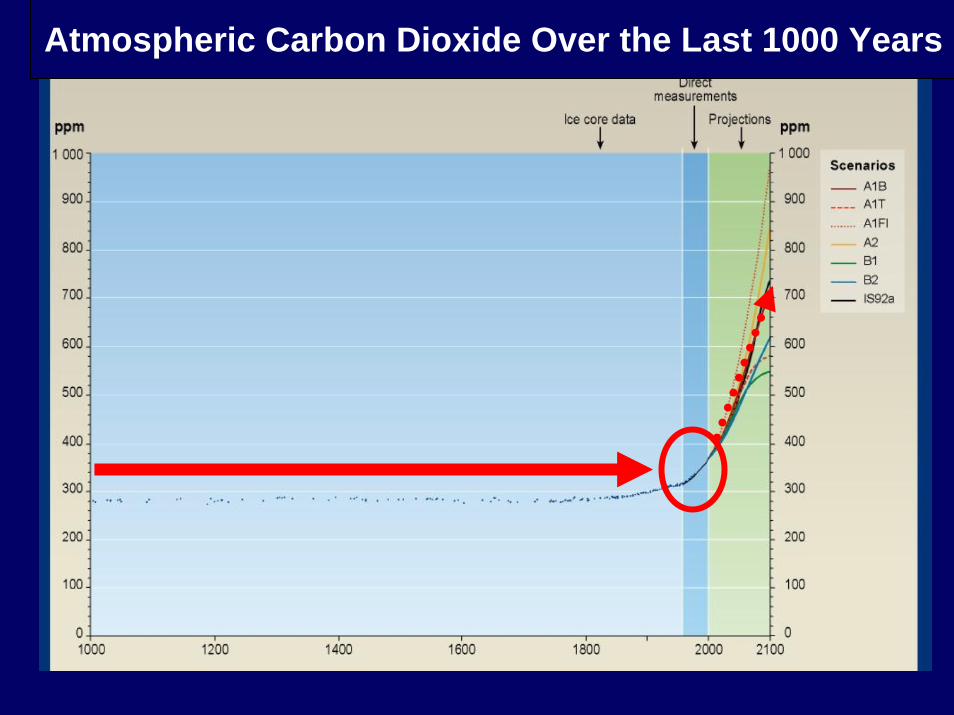
Atmospheric Carbon Dioxide Over the Last 1000 Years
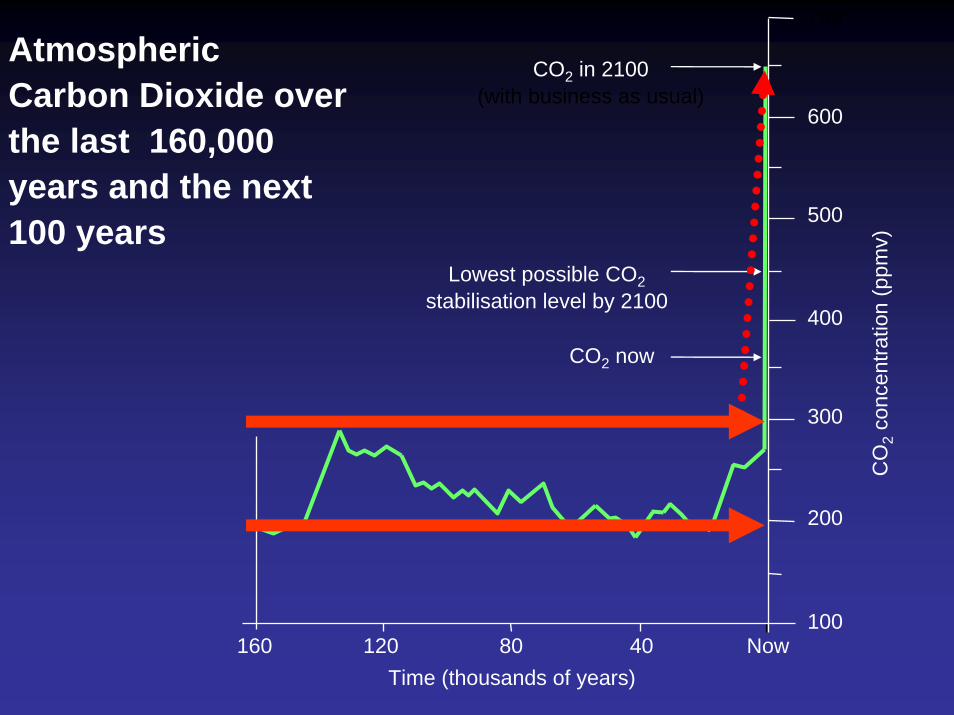
Atmospheric Carbon Dioxide over the last 160,000 years and the next 100 years
Time (thousands of years)160 120 80 40 Now
100
200
300
400
500
600
700
CO2 in 2100(with business as usual)
Lowest possible CO2stabilisation level by 2100
CO2 now
CO
2co
ncen
tratio
n (p
pmv)
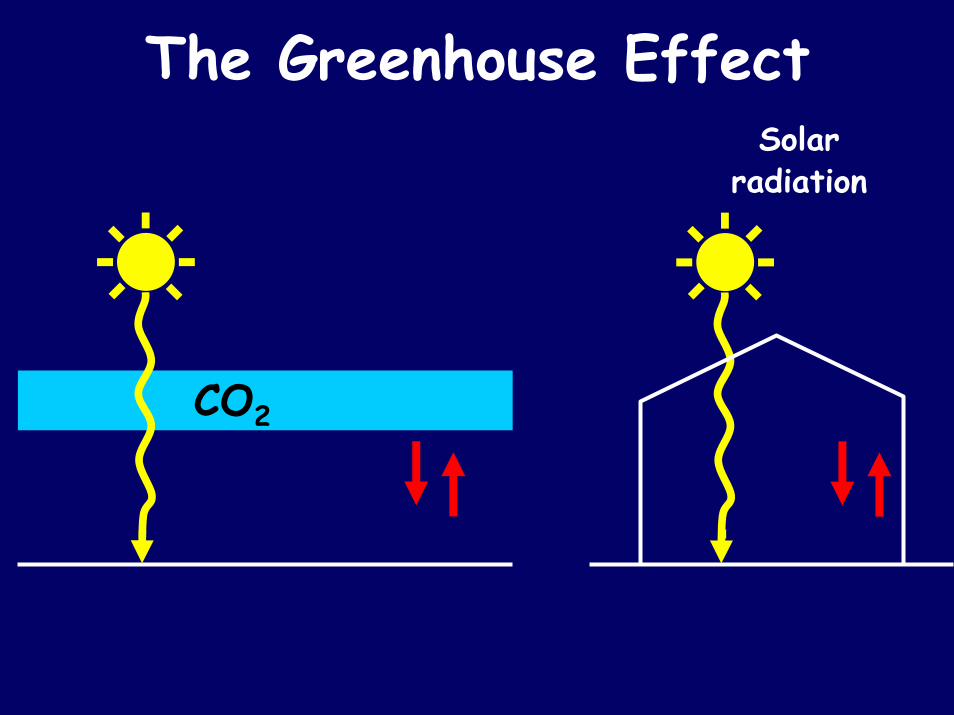
The Greenhouse EffectSolar
radiation
CO2
Time (thousands of years)160 120 80 40 Now
–10
0
10
100
200
300
400
500
600
700
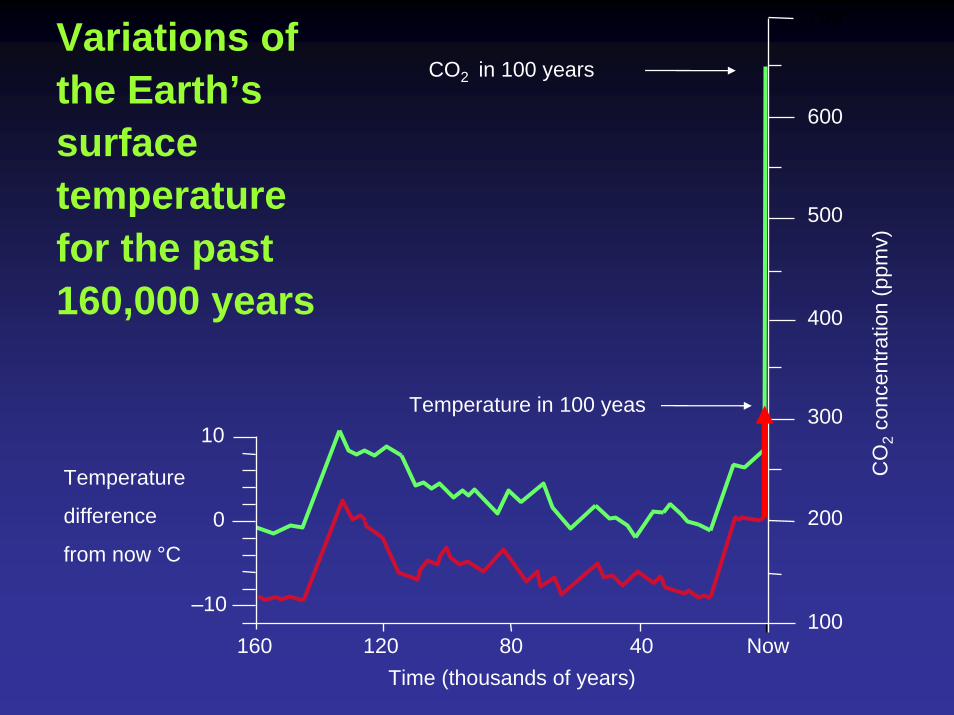
Temperature in 100 yeas
Temperature
difference
from now °C
CO
2co
ncen
tratio
n (p
pmv)
CO2 in 100 yearsVariations of the Earth’s surface temperature for the past 160,000 years
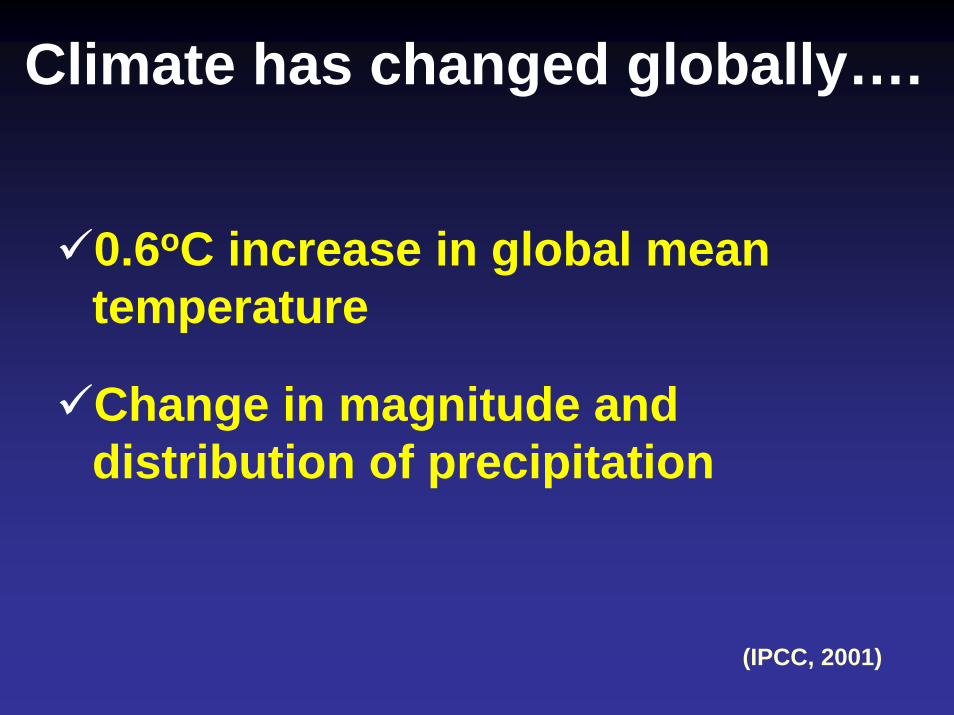
Climate has changed globally….
0.6oC increase in global mean temperature
Change in magnitude and distribution of precipitation
(IPCC, 2001)
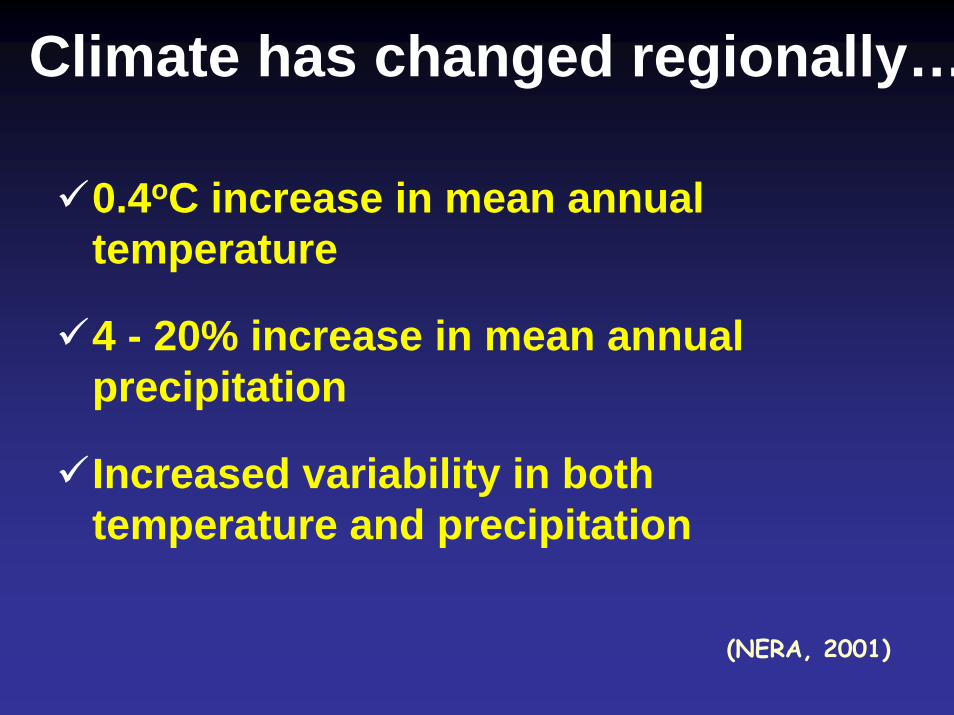
Climate has changed regionally…
0.4oC increase in mean annual temperature
4 - 20% increase in mean annual precipitation
Increased variability in both temperature and precipitation
(NERA, 2001)
Indicators of Climate Change(Tom Huntington et al.)
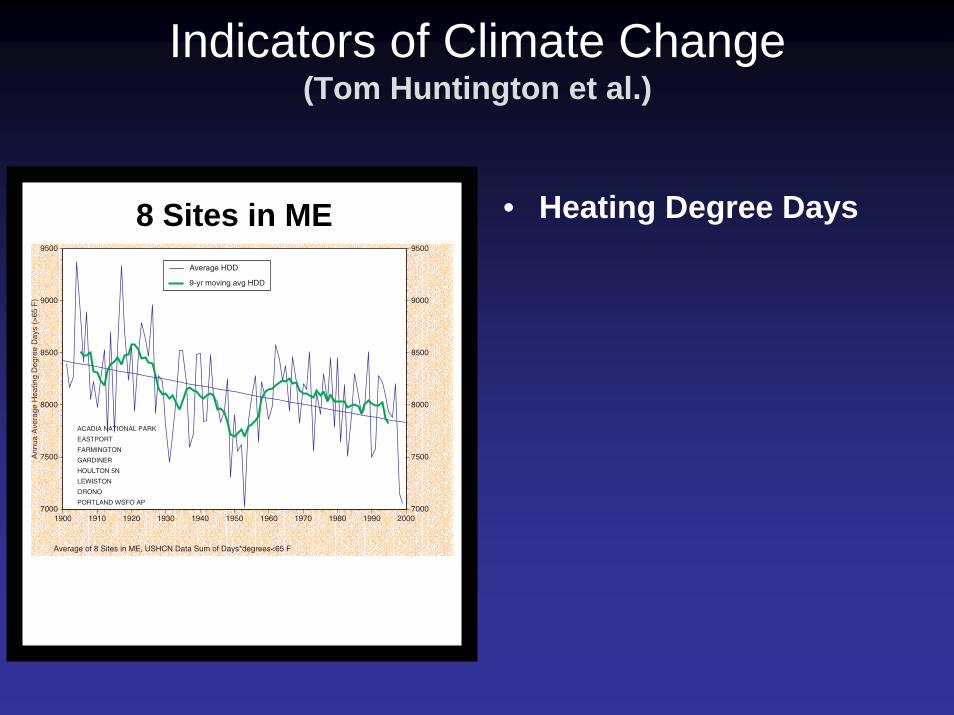
Indicators of Climate Change(Tom Huntington et al.)
7000
7500
8000
8500
9000
9500
7000
7500
8000
8500
9000
9500
1900 1910 1920 1930 1940 1950 1960 1970 1980 1990 2000
Ann
ua A
vera
ge H
eatin
g D
egre
e D
ays
(>65
F)
Average HDD
9-yr moving avg HDD
Average of 8 Sites in ME, USHCN Data Sum of Days*degrees<65 F
ACADIA NATIONAL PARK
EASTPORT
FARMINGTON
GARDINER
HOULTON 5N
LEWISTON
ORONO
PORTLAND WSFO AP
8 Sites in ME • Heating Degree Days
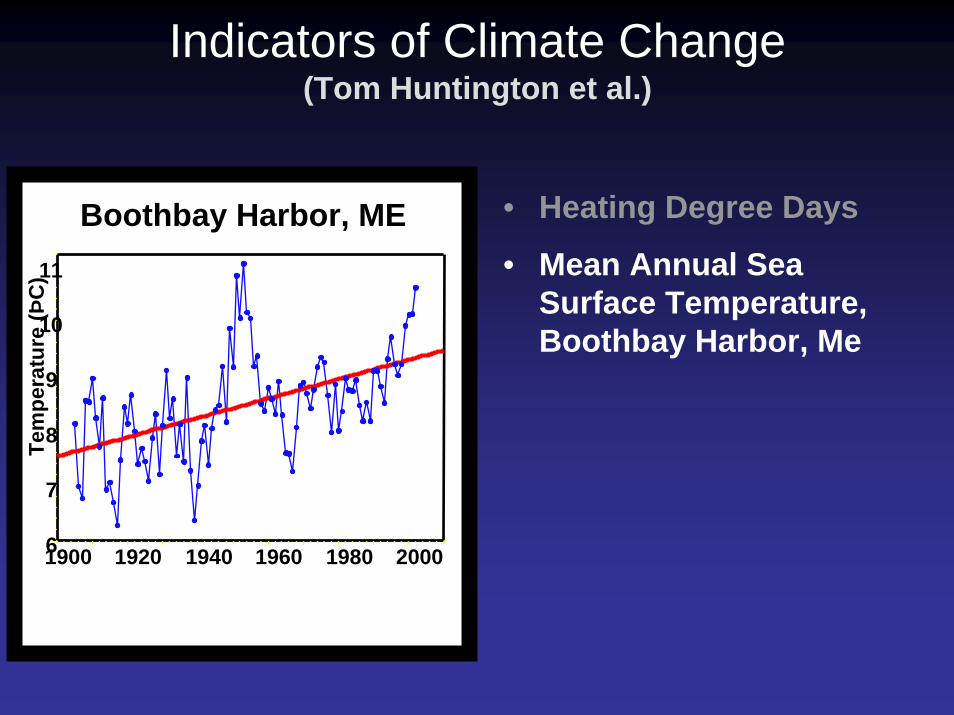
• Heating Degree Days
• Mean Annual Sea Surface Temperature, Boothbay Harbor, Me
Indicators of Climate Change(Tom Huntington et al.)
•Boothbay Harbor, Me
6
7
8
9
10
11
1900 1920 1940 1960 1980 2000
Tem
pera
ture
(ÞC
)
Boothbay Harbor, ME
• Heating Degree Days
• Mean Annual Sea Surface Temperature, Boothbay Harbor, ME
• Water Temperature at the Wild River, ME
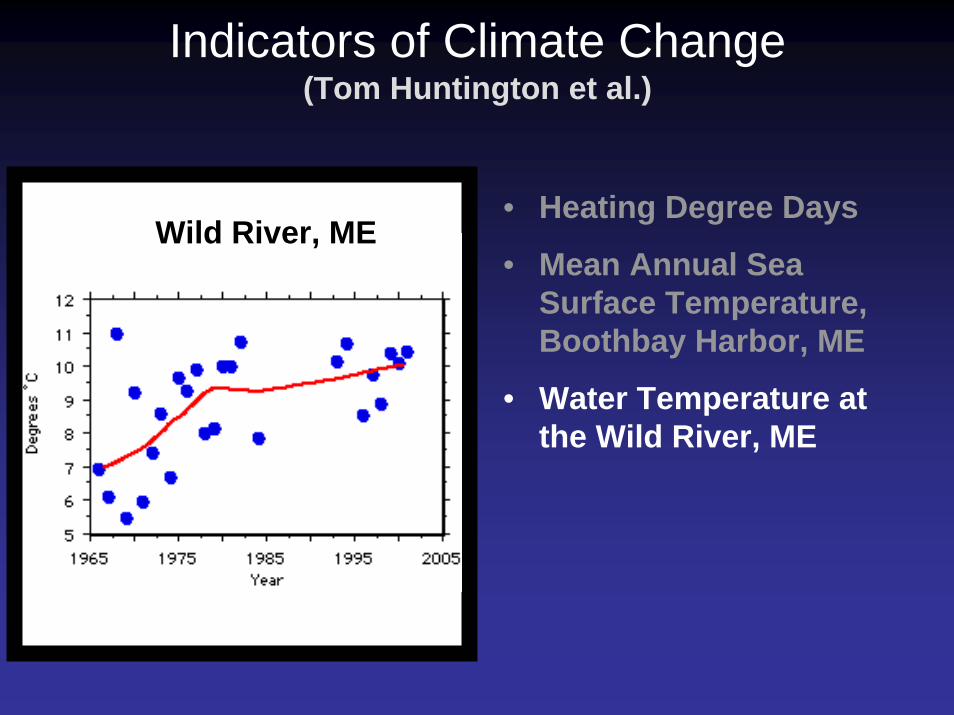
Indicators of Climate Change(Tom Huntington et al.)
•Boothbay Harbor, Me
Wild River, ME
• Heating Degree Days
• Mean Annual Sea Surface Temperature, Boothbay Harbor, ME
• Water Temperature at the Wild River, ME
• Ice Thickness, Piscataquis River, ME
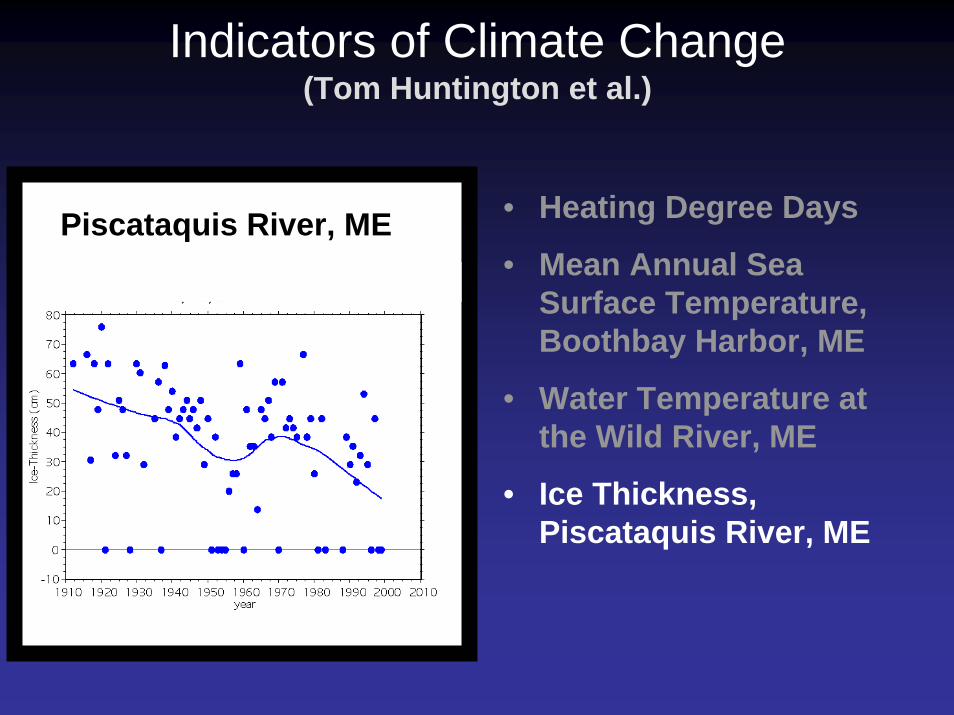
Indicators of Climate Change(Tom Huntington et al.)
•Boothbay Harbor, Me
Piscataquis River, ME
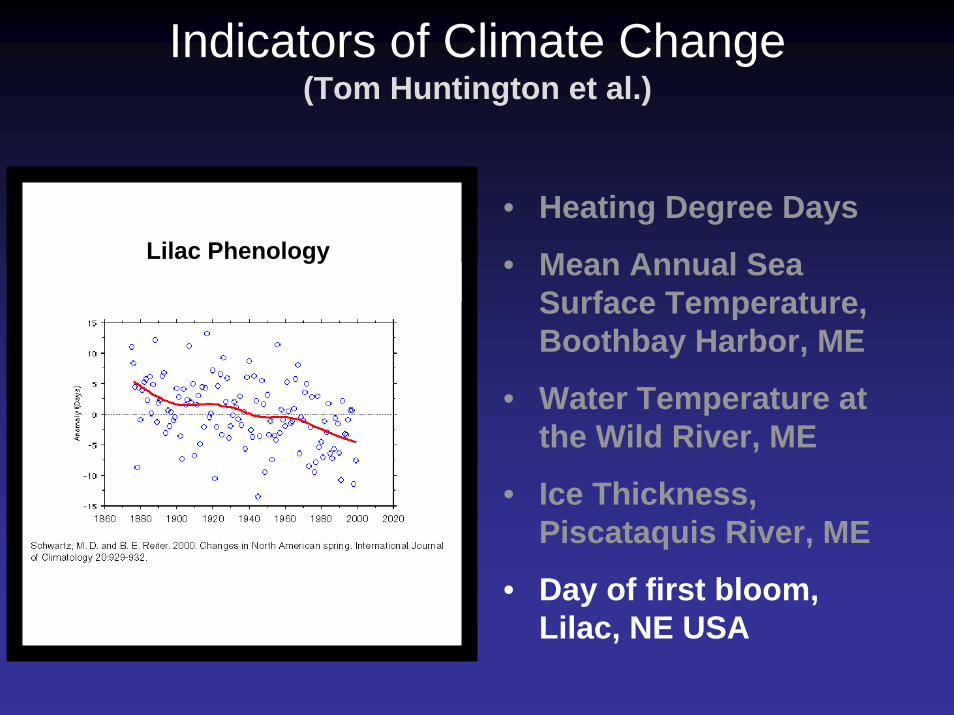
• Heating Degree Days
• Mean Annual Sea Surface Temperature, Boothbay Harbor, ME
• Water Temperature at the Wild River, ME
• Ice Thickness, Piscataquis River, ME
• Day of first bloom, Lilac, NE USA
Indicators of Climate Change(Tom Huntington et al.)
•Boothbay Harbor, Me
Lilac Phenology
Clean Air/Cool Plant

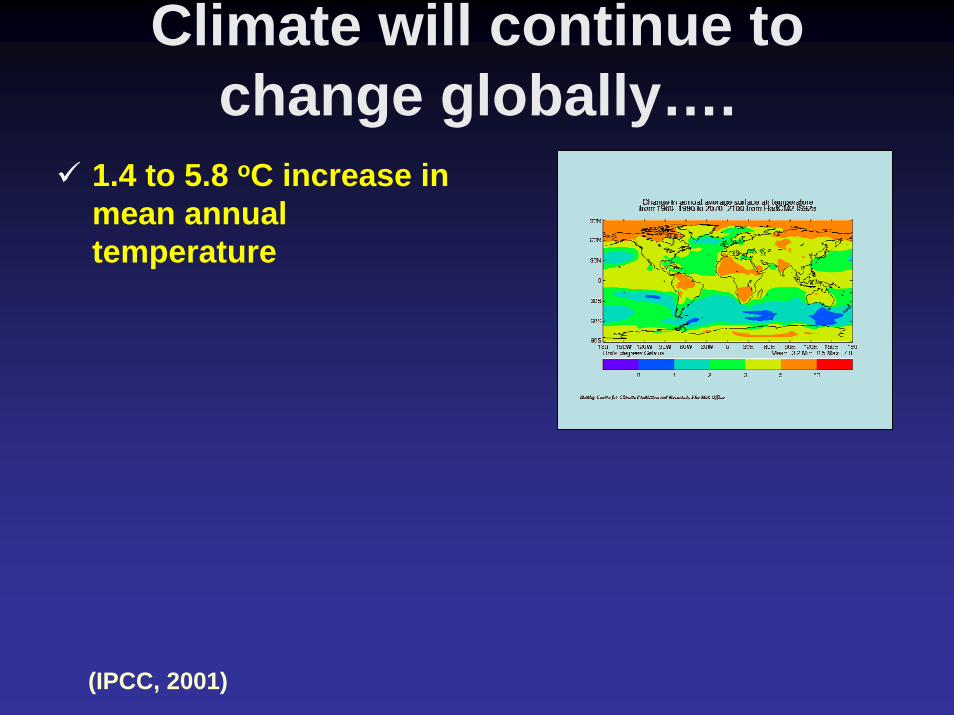
Climate will continue to change globally….
Climate will continue to change globally….
1.4 to 5.8 oC increase in mean annual temperature
(IPCC, 2001)
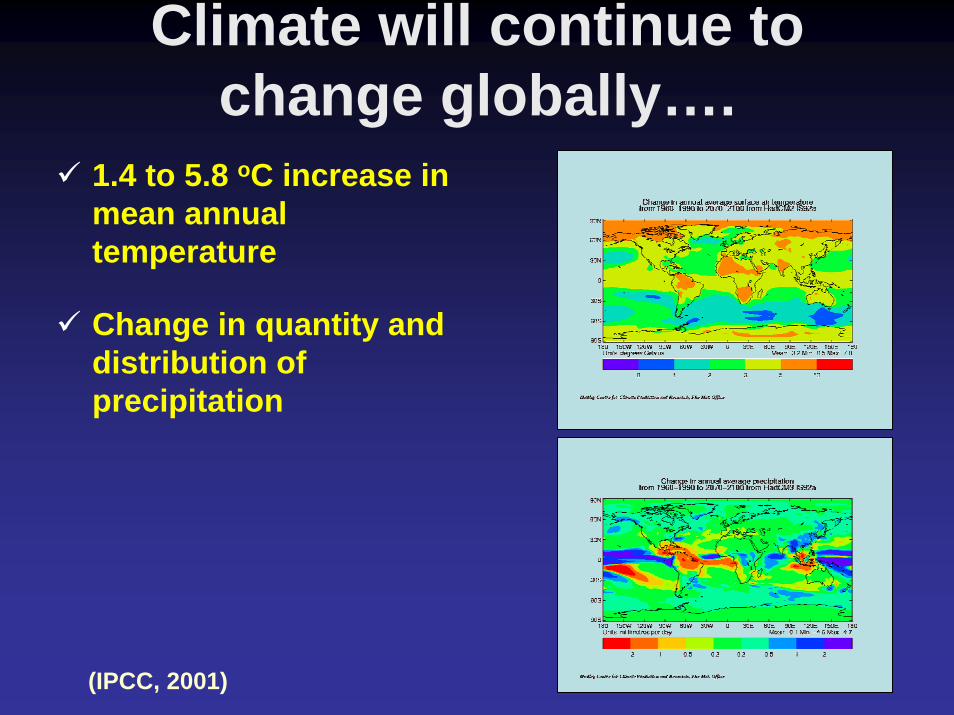
Climate will continue to change globally….
1.4 to 5.8 oC increase in mean annual temperature
Change in quantity and distribution of precipitation
(IPCC, 2001)
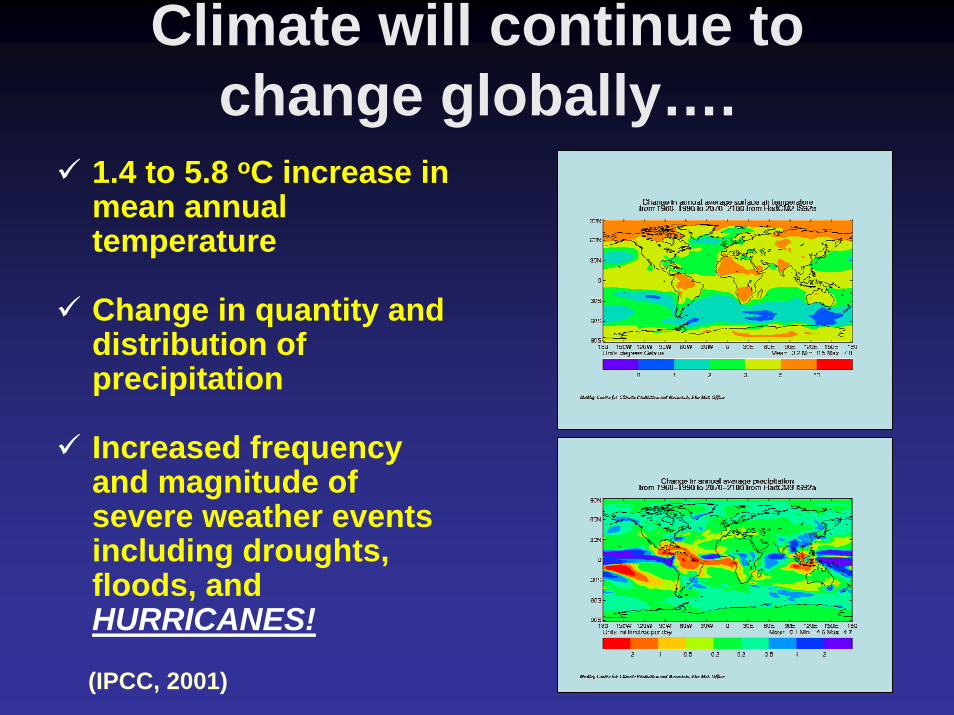
Climate will continue to change globally….
1.4 to 5.8 oC increase in mean annual temperature
Change in quantity and distribution of precipitation
Increased frequency and magnitude of severe weather events including droughts, floods, and HURRICANES!
(IPCC, 2001)
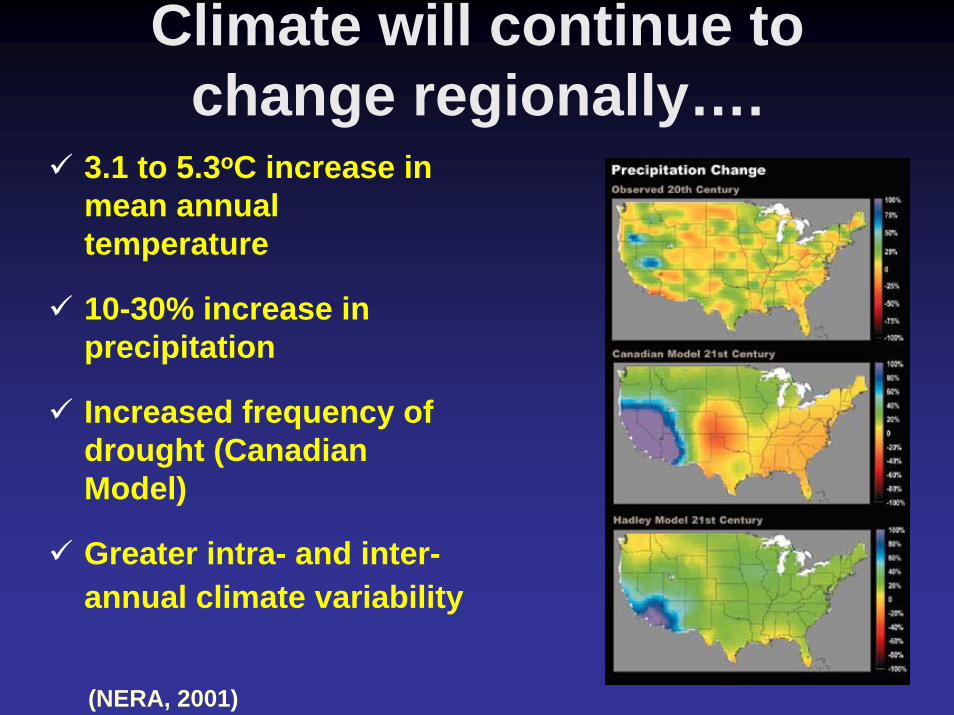
Climate will continue to change regionally….
3.1 to 5.3oC increase in mean annual temperature
10-30% increase in precipitation
Increased frequency of drought (Canadian Model)
Greater intra- and inter-annual climate variability
(NERA, 2001)

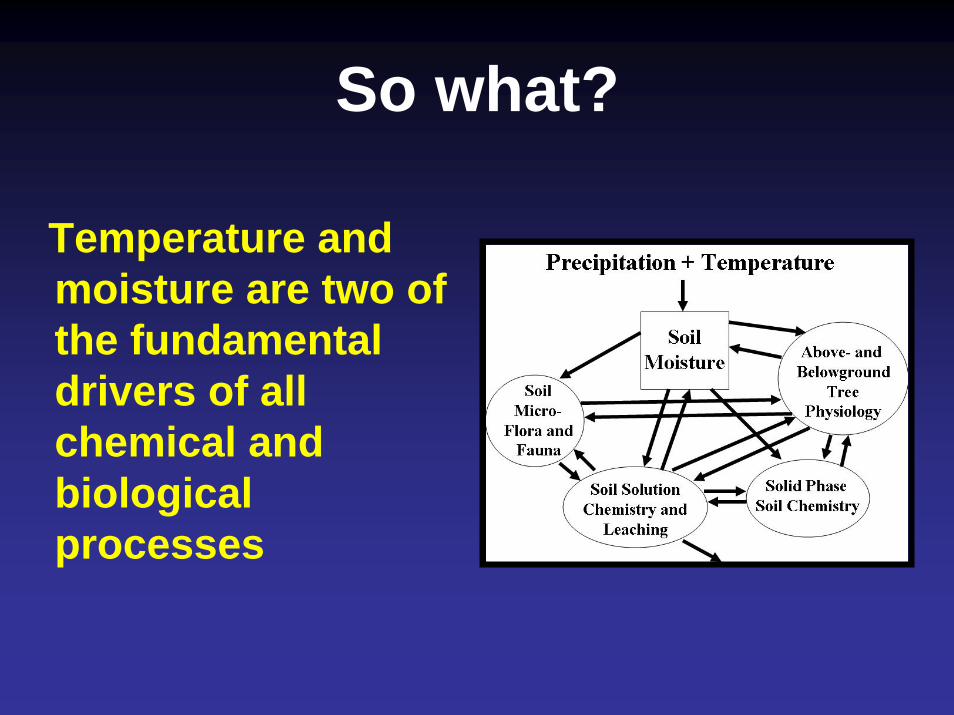
So what?
So what?
Temperature and moisture are two of the fundamental drivers of all chemical and biological processes
The Research• Experimental Manipulations
• Gradients
• Biological Observations
• Modeling
Experimental Manipulations
#
#
#
#
#
#
#
#
#
#
#
#
#
#
#
#
#
#
##
#
##
#
##
#
###
#
#
#
##
#
#
#
#
#
#
###### ##
MGS
#
Huntington Wildlife Forest
#
Harvard Forest
#
Howland Forest
#
MEGS
# Ecosystem warming sites
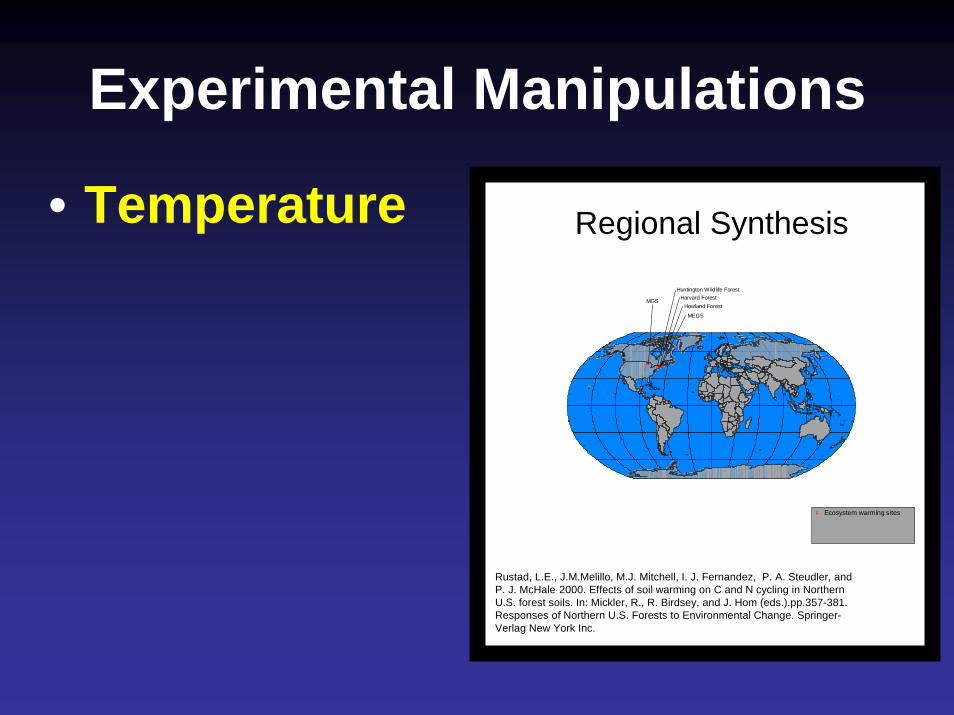
Rustad, L.E., J.M.Melillo, M.J. Mitchell, I. J. Fernandez, P. A. Steudler, and P. J. McHale. 2000. Effects of soil warming on C and N cycling in Northern U.S. forest soils. In: Mickler, R., R. Birdsey, and J. Hom (eds.).pp.357-381. Responses of Northern U.S. Forests to Environmental Change. Springer-Verlag New York Inc.
Regional Synthesis• Temperature
Experimental Manipulations
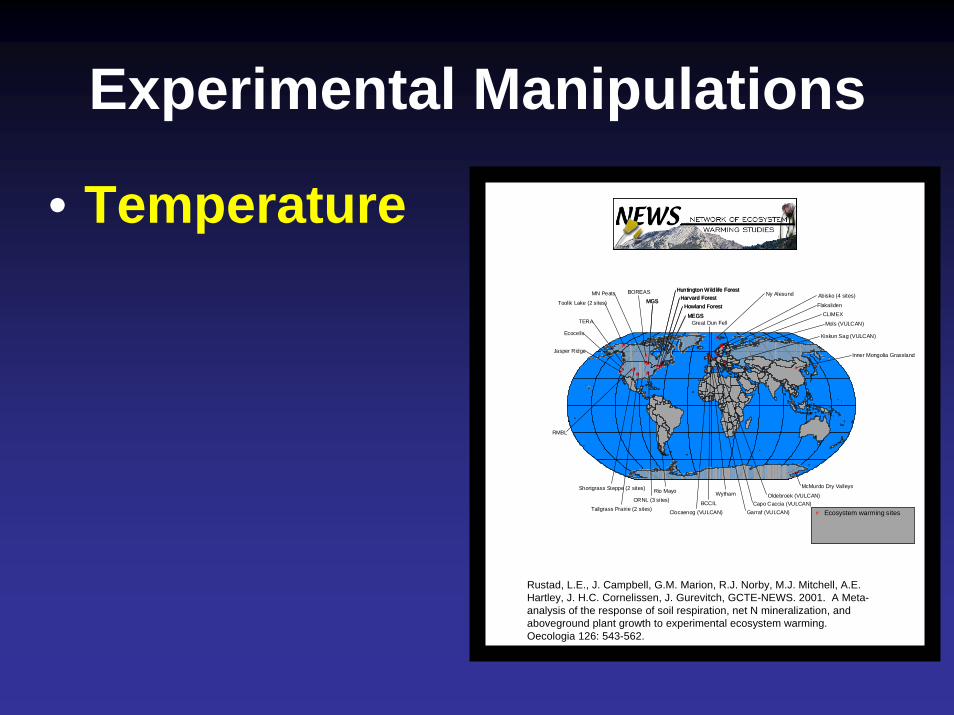
• Temperature
#
#
#
#
#
#
#
#
#
#
#
#
#
#
#
#
#
#
##
#
##
#
##
#
###
#
#
#
##
#
#
#
#
#
#
###### ##
MGS
#
Huntington Wildlife Forest
#
Harvard Forest
#
Howland Forest
#
MEGS
# Ecosystem warming sites
#
##
#
##
#
##
#
#
##
#
#
#
#
#
##
###
#
###
### #
#
#
# ###
#
#
##
#
Toolik Lake (2 sites)
#
MN Peats
#
BOREAS
#
MGS
#
TERA
#
Ecocells
#
Jasper Ridge
#
RMBL
#
Tallgrass Prairie (2 sites)
#
Huntington Wildlife Forest
#
Harvard Forest
#
Howland Forest
#
MEGS
#
Great Dun Fell
#
Shortgrass Steppe (2 sites)
#
ORNL (3 sites)
#
Rio Mayo
#
Ny Alesund
#
Clocaenog (VULCAN)
#
BCCIL
#
Wytham
#
Abisko (4 sites)
#
Flakaliden
#
CLIMEX
#
Mols (VULCAN)
#
Kiskun Sag (VULCAN)
#
Garraf (VULCAN)
#
Capo Caccia (VULCAN)
#
Oldebroek (VULCAN)
#
McMurdo Dry Valleys
#
Inner Mongolia Grassland
# Ecosystem warming sites
Rustad, L.E., J. Campbell, G.M. Marion, R.J. Norby, M.J. Mitchell, A.E. Hartley, J. H.C. Cornelissen, J. Gurevitch, GCTE-NEWS. 2001. A Meta-analysis of the response of soil respiration, net N mineralization, and aboveground plant growth to experimental ecosystem warming.Oecologia 126: 543-562.
Experimental Manipulations
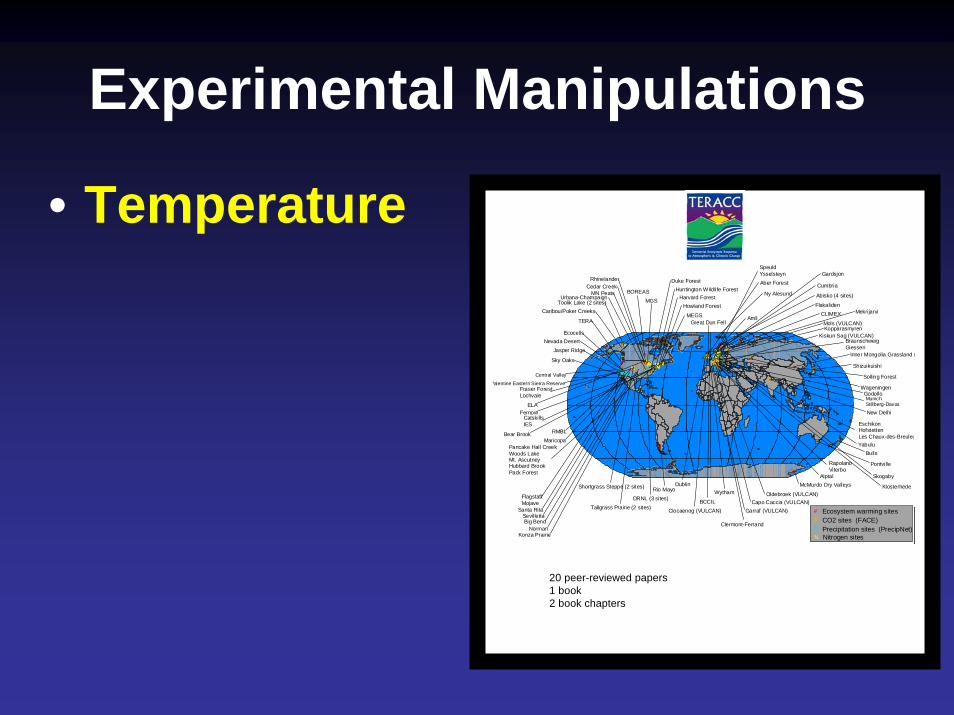
• Temperature
#
#
#
#
#
#
#
#
#
#
#
#
#
#
#
#
#
#
##
#
##
#
##
#
###
#
#
#
##
#
#
#
#
#
#
###### ##
MGS
#
Huntington Wildlife Forest
#
Harvard Forest
#
Howland Forest
#
MEGS
# Ecosystem warming sites
#
##
#
##
#
##
#
#
##
#
#
#
#
#
##
###
#
###
### #
#
#
# ###
#
#
##
#
Toolik Lake (2 sites)
#
MN Peats
#
BOREAS
#
MGS
#
TERA
#
Ecocells
#
Jasper Ridge
#
RMBL
#
Tallgrass Prairie (2 sites)
#
Huntington Wildlife Forest
#
Harvard Forest
#
Howland Forest
#
MEGS
#
Great Dun Fell
#
Shortgrass Steppe (2 sites)
#
ORNL (3 sites)
#
Rio Mayo
#
Ny Alesund
#
Clocaenog (VULCAN)
#
BCCIL
#
Wytham
#
Abisko (4 sites)
#
Flakaliden
#
CLIMEX
#
Mols (VULCAN)
#
Kiskun Sag (VULCAN)
#
Garraf (VULCAN)
#
Capo Caccia (VULCAN)
#
Oldebroek (VULCAN)
#
McMurdo Dry Valleys
#
Inner Mongolia Grassland
# Ecosystem warming sites
#
##
#
##
#
##
#
#
##
#
#
#
#
#
##
###
#
###
### #
#
#
# ###
#
#
##
$
$
$$
$$$$ $
$
$$$ $
$
$
$$$$$
$
$$
$$
$$$ $$
Ñ ÑÑÑÑÑ ÑÑ
ÑÑÑ
ÑÑ
ÑÑ
Ñ
Ñ ÑNNNNN NN
N
N
N
NN
N
NNN
NNNNNNNN N
N
N
N
N#
Toolik Lake (2 sites)
#
MN Peats
#
BOREAS
#
MGS
#
TERA
#
Ecocells
#
Jasper Ridge
#
RMBL
#
Tallgrass Prairie (2 sites)
#
Huntington Wildlife Forest
#
Harvard Forest
#
Howland Forest
#
MEGS
#
Great Dun Fell
#
Shortgrass Steppe (2 sites)
#
ORNL (3 sites)
#
Rio Mayo
#
Ny Alesund
#
Clocaenog (VULCAN)
#
BCCIL
#
Wytham
#
Abisko (4 sites)
#
Flakaliden
#
CLIMEX
#
Mols (VULCAN)
#
Kiskun Sag (VULCAN)
#
Garraf (VULCAN)
#
Capo Caccia (VULCAN)
#
Oldebroek (VULCAN)
#
McMurdo Dry Valleys
#
Caribou/Poker Creeks
#
Nevada Desert
#
Sky Oaks
#
Maricopa
#
Urbana-Champaign
#
Duke Forest
#
Cedar Creek
#
Rhinelander
#
Mekrijarvi
#
Kopparasmyren
#
Inner Mongolia Grassland#
Clermont-Ferrand
#
RapolanoViterbo
#
EschikonHofstettenLes Chaux-des-Breuleu
#
BraunschweigGiessen
#
MunichStillberg-Davos
#
Wageningen
#Shizuikuishi
#
New Delhi#
Yabulu#
Bulls
#
Pontville
#
Godollo
#
Dublin
#
Cumbria
#
Konza Prairie
#
Norman
#
Big Bend
#
Sevilletta
#
Santa Rita
#
FlagstaffMojave
#
Valentine Eastern Sierra Reserve
#
Central Valley#
Fraser ForestLochvale
#
CatskillsIES
#
ELA
#
Fernow
#
Pancake Hall CreekWoods LakeMt. AscutneyHubbard BrookPack Forest
#
Bear Brook
#
Gardsjon
#
Amli
#
Skogaby
#
Alptal
#
Aber Forest
#
SpeuldYsselsteyn
#
Klosterhede
#
Solling Forest
# Ecosystem warming sites$ CO2 sites (FACE)Ñ Precipitation sites (PrecipNet)N Nitrogen sites
20 peer-reviewed papers1 book2 book chapters
Experimental Manipulations
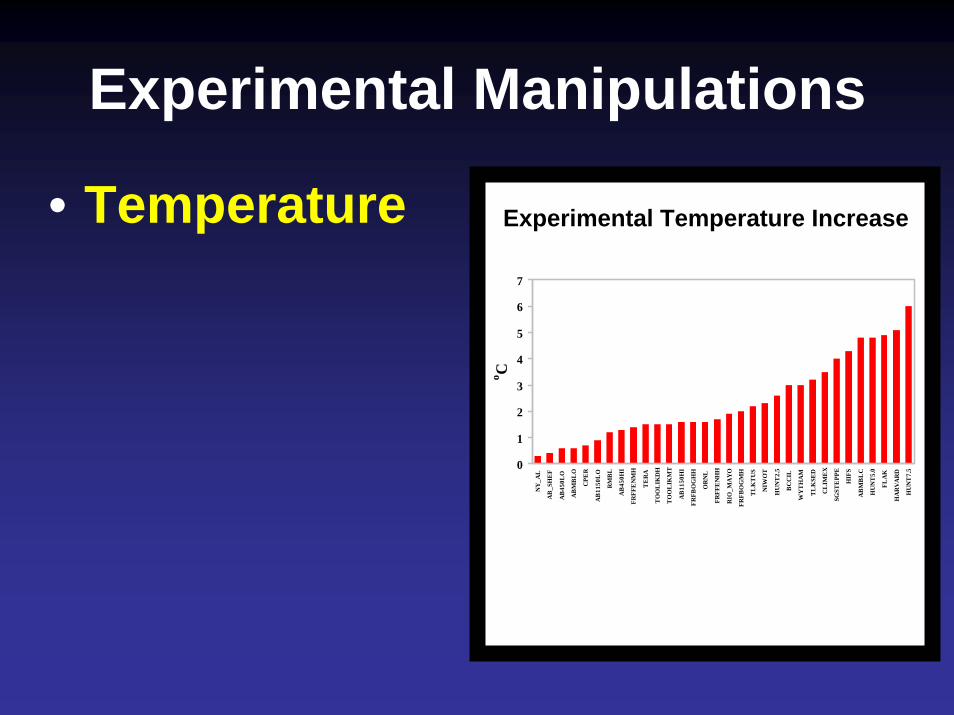
• Temperature
0
1
2
3
4
5
6
7
NY
_AL
AB
_SH
EF
AB
450L
O
AB
MB
LO
CPE
R
AB
1150
LO
RM
BL
AB
450H
I
FRFF
EN
MH
TE
RA
TO
OL
IKD
H
TO
OL
IKM
T
AB
1150
HI
FRFB
OG
HH
OR
NL
FRFF
EN
HH
RIO
_MA
YO
FRFB
OG
MH
TL
KT
US
NIW
OT
HU
NT
2.5
BC
CIL
WY
TH
AM
TL
KSE
D
CL
IME
X
SGST
EPP
E
HIF
S
AB
MB
LC
HU
NT
5.0
FLA
K
HA
RV
AR
D
HU
NT
7.5
o C
Experimental Temperature Increase
Experimental Manipulations
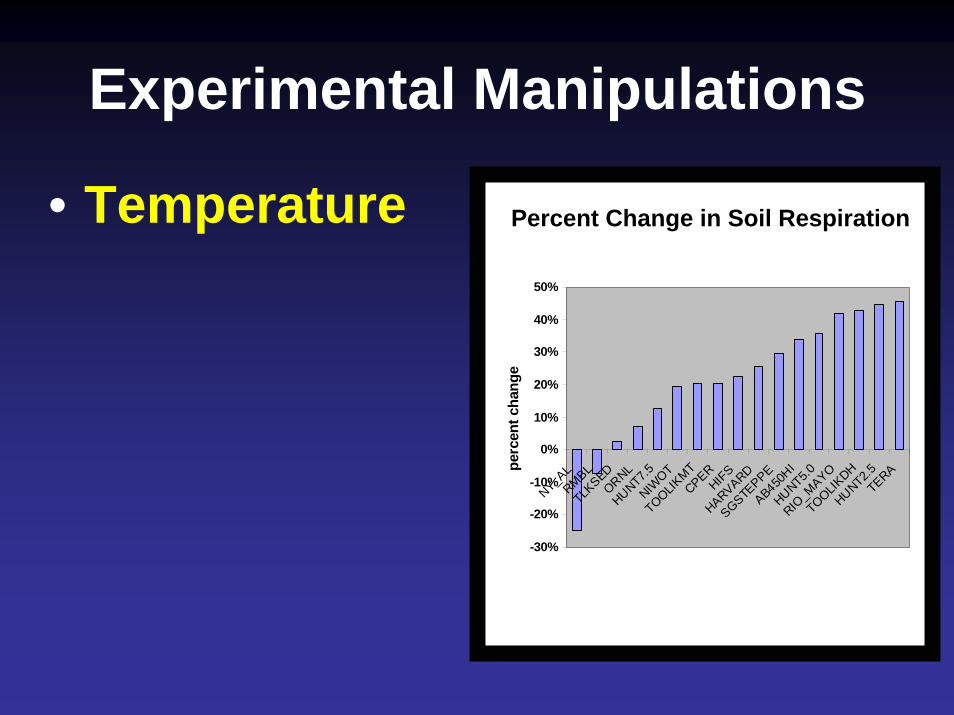
• Temperature
-30%
-20%
-10%
0%
10%
20%
30%
40%
50%
NY_AL
RMBLTLK
SEDORNL
HUNT7.5NIW
OTTOOLIK
MTCPER
HIFSHARVARD
SGSTEPPE
AB450HI
HUNT5.0
RIO_M
AYOTOOLIK
DHHUNT2.5
TERAperc
ent c
hang
e
Percent Change in Soil Respiration
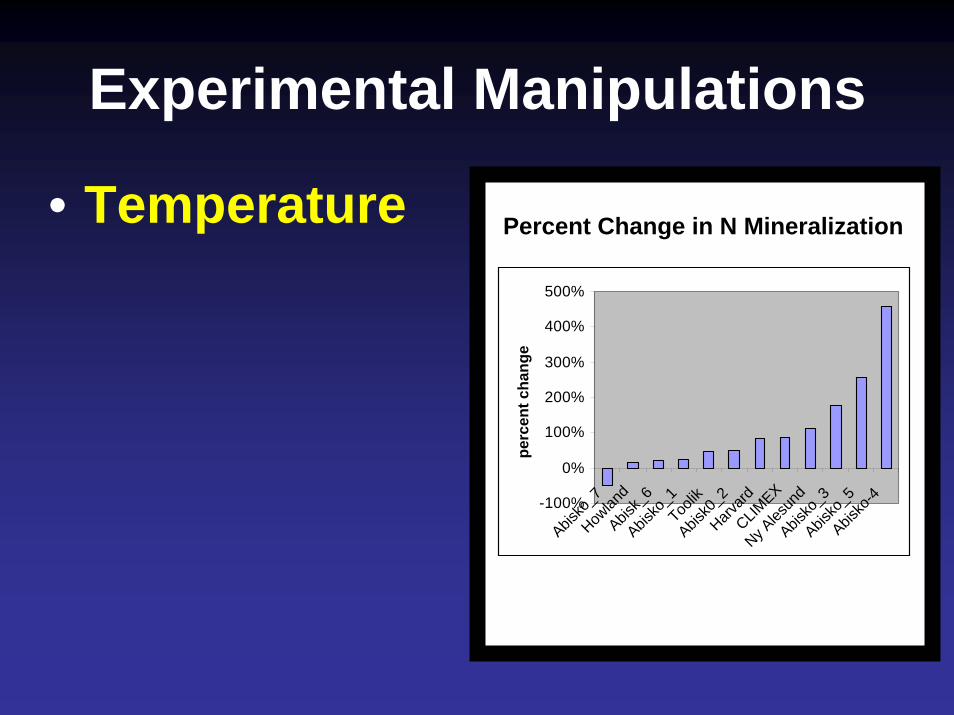
Experimental Manipulations
• Temperature
-100%
0%
100%
200%
300%
400%
500%
Abisko
_7How
land
Abisk_
6Abis
ko_1
Toolik
Abisk0
_2Harv
ardCLIM
EXNy A
lesun
dAbis
ko_3
Abisko
_5Abis
ko-4
perc
ent c
hang
e
Percent Change in N Mineralization

Experimental Manipulations
• Temperature
-60
-40
-20
0
20
40
60
80
100
120
140
160
TACITTERA
Abisko
_1RMBL
Wytham
Woo
dsBux
tonAbis
ko_2
MN_Bog
_loORNL
Shortg
rass S
teppe
MN_bog
_hi
Abisko
_6Ny A
lesun
dToo
lik_d
ry
Mn_fen
_med
Mn_Fen
_hi
Flakali
den
Abisko
_5Abis
ko_4
Toolik_
wetAbis
ko_3pe
rcen
t cha
nge
in p
rodu
ctiv
ity
Percent Change in Plant Productivity
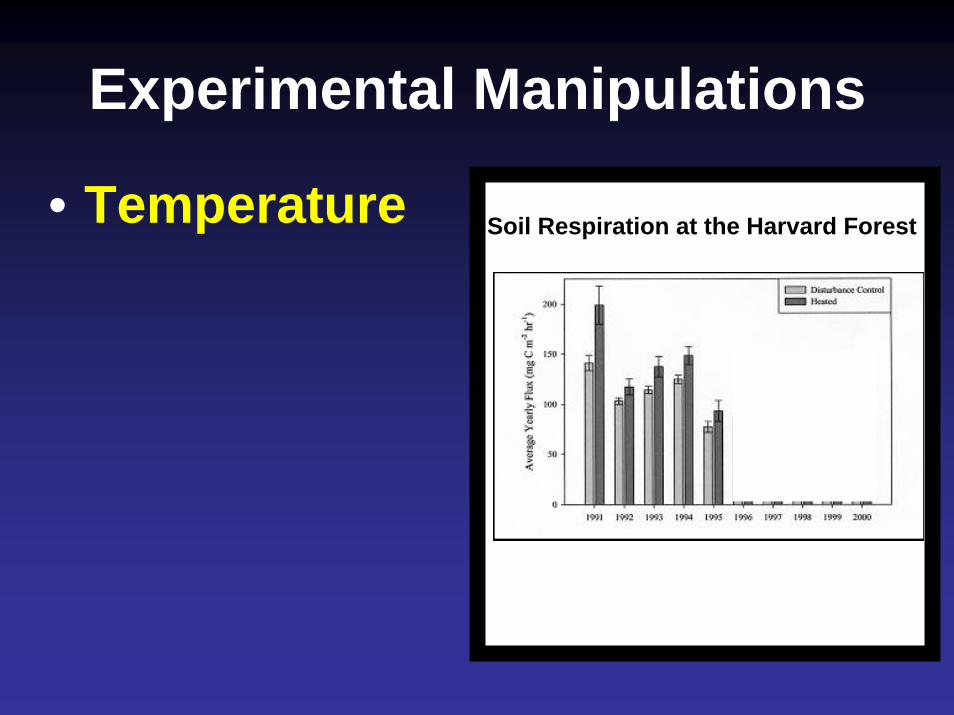
Experimental Manipulations
• Temperature Soil Respiration at the Harvard Forest
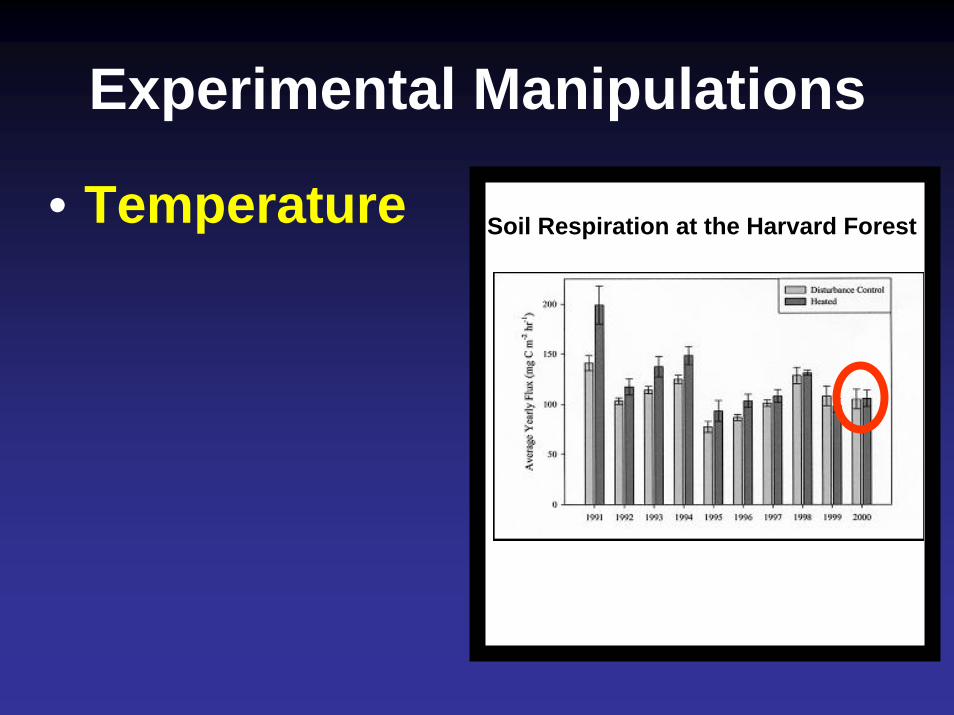
Experimental Manipulations
• Temperature Soil Respiration at the Harvard Forest
Experimental Manipulations
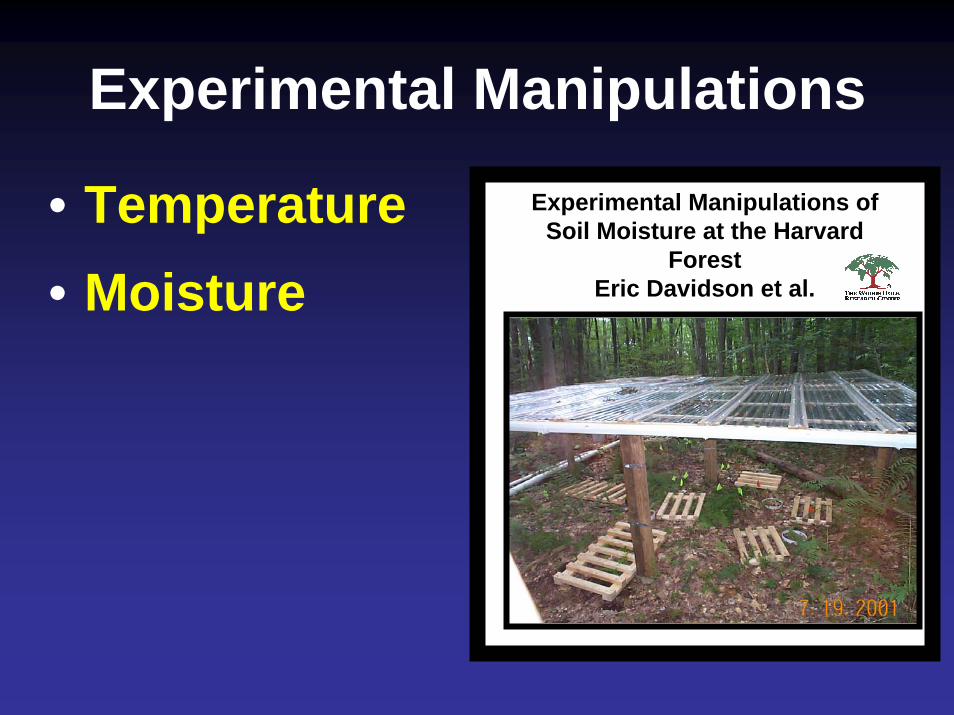
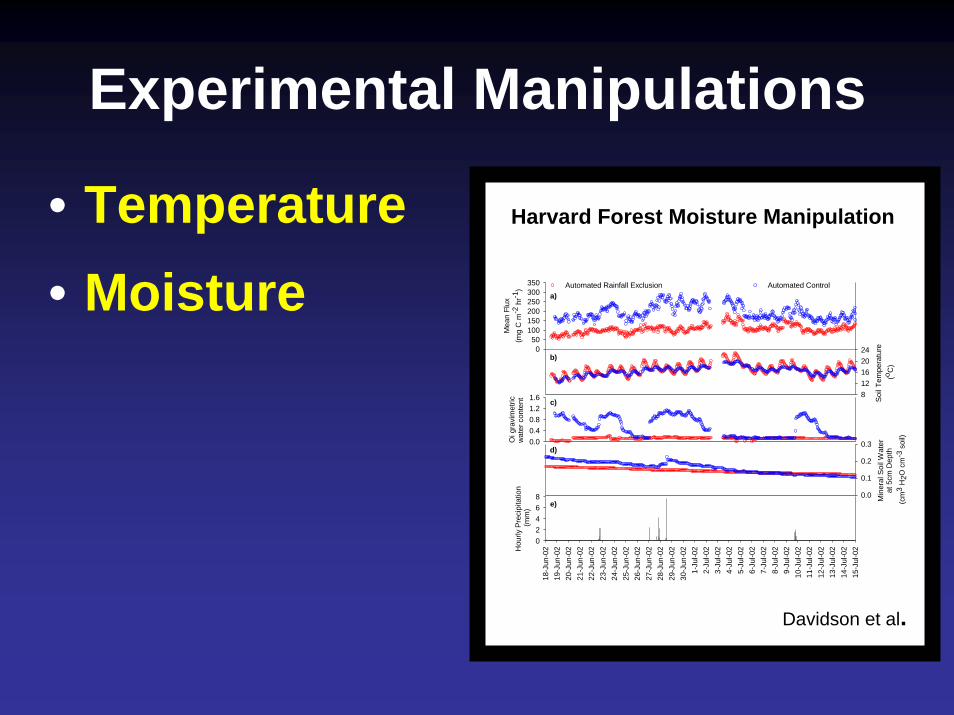
• Temperature• Moisture
Experimental Manipulations of Soil Moisture at the Harvard
Forest Eric Davidson et al.
Experimental Manipulations
• Temperature• Moisture
Mea
n Fl
ux(m
g C
m-2
hr-1
)
050
100150200250300350
Soil
Tem
pera
ture
(o C
)
812162024
Oi g
ravi
met
ricw
ater
con
tent
0.00.40.81.21.6
18-J
un-0
219
-Jun
-02
20-J
un-0
221
-Jun
-02
22-J
un-0
223
-Jun
-02
24-J
un-0
225
-Jun
-02
26-J
un-0
227
-Jun
-02
28-J
un-0
229
-Jun
-02
30-J
un-0
21-
Jul-0
22-
Jul-0
23-
Jul-0
24-
Jul-0
25-
Jul-0
26-
Jul-0
27-
Jul-0
28-
Jul-0
29-
Jul-0
210
-Jul
-02
11-J
ul-0
212
-Jul
-02
13-J
ul-0
214
-Jul
-02
15-J
ul-0
2Hou
rly P
reci
pita
tion
(mm
)
02468
Automated Rainfall Exclusion Automated Control
Min
eral
Soi
l Wat
er
at 5
cm D
epth
(cm
3 H
2O c
m-3
soil)
0.0
0.1
0.2
0.3
a)
b)
c)
d)
e)
Harvard Forest Moisture Manipulation
Davidson et al.
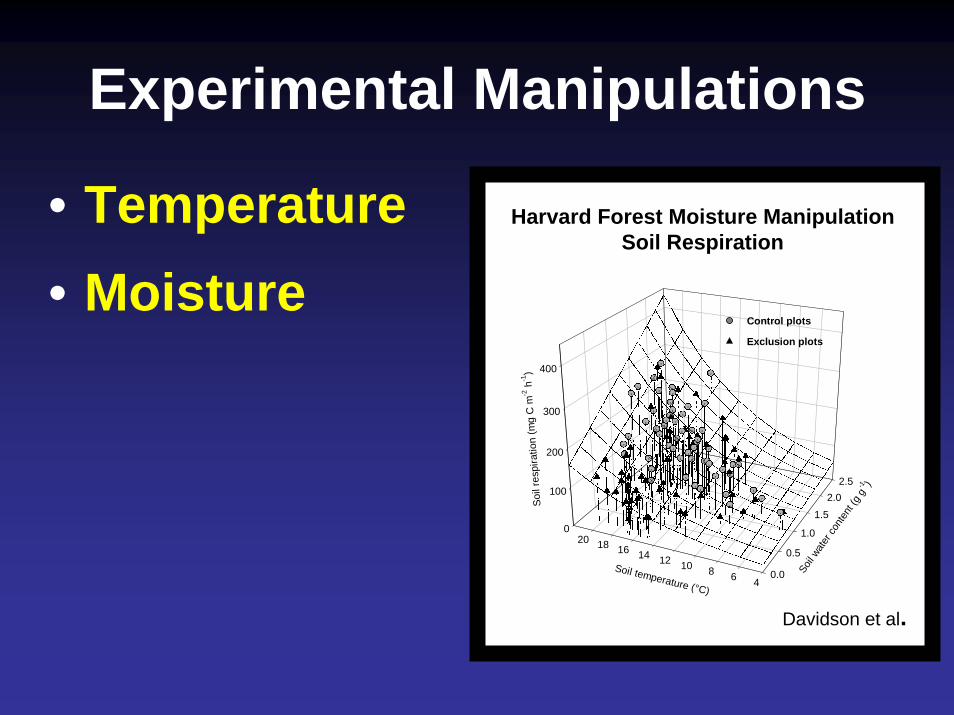
Experimental Manipulations
• Temperature• Moisture
0
100
200
300
400
0.0
0.5
1.0
1.5
2.02.5
468101214161820So
il re
spira
tion
(mg
C m
-2 h
-1)
Soil w
ater
cont
ent (
g g
-1 )
Soil temperature (°C)
Control plots
Exclusion plots
Davidson et al.
Harvard Forest Moisture ManipulationSoil Respiration
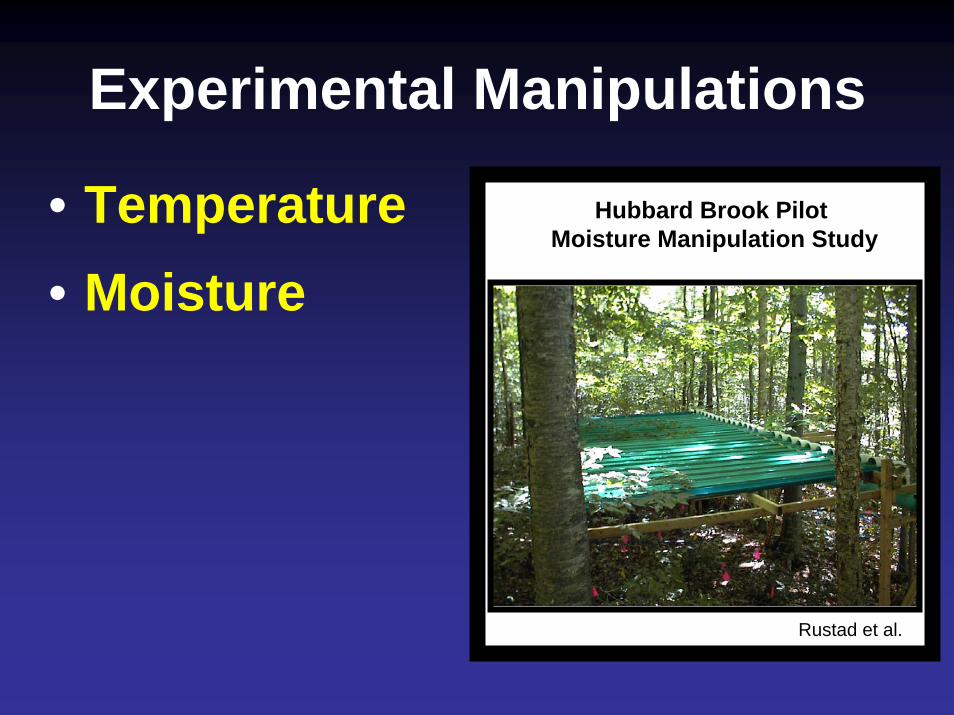
Experimental Manipulations
• Temperature• Moisture
Hubbard Brook Pilot Moisture Manipulation Study
Rustad et al.
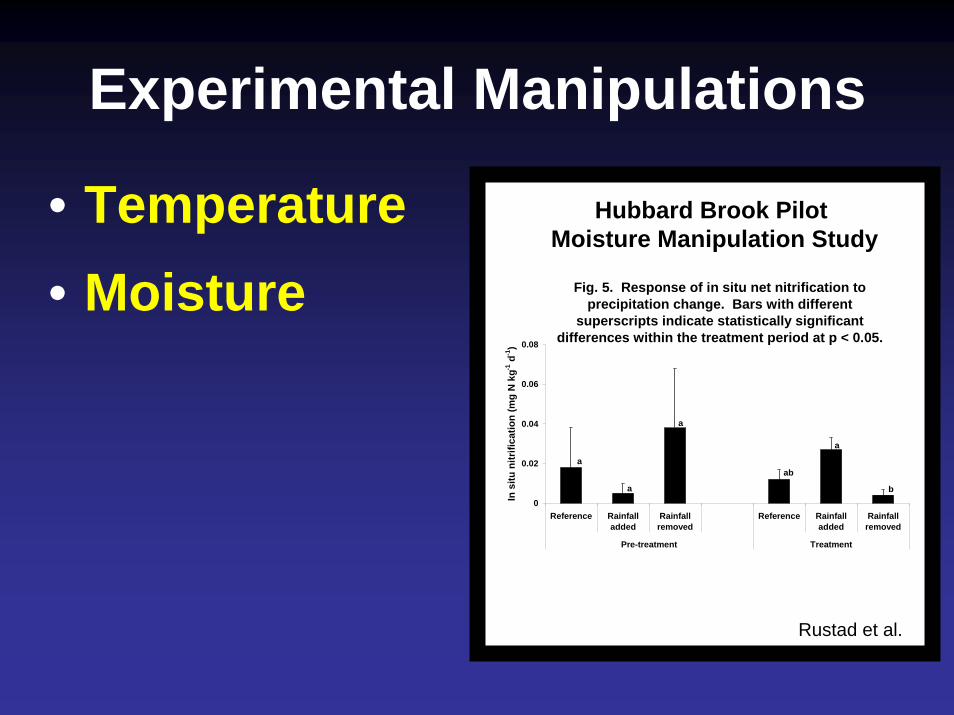
Experimental Manipulations
• Temperature• Moisture Fig. 5. Response of in situ net nitrification to
precipitation change. Bars with different superscripts indicate statistically significant
differences within the treatment period at p < 0.05.
0
0.02
0.04
0.06
0.08
Reference Rainfalladded
Rainfallremoved
Reference Rainfalladded
Rainfallremoved
Pre-treatment Treatment
In s
itu n
itrifi
catio
n (m
g N
kg-1
d-1
)
a
a
a
a
b
ab
Rustad et al.
Hubbard Brook Pilot Moisture Manipulation Study
Experimental Manipulations
• Temperature• Moisture
Future Research?
$$$$$$$$
Experimental Manipulations
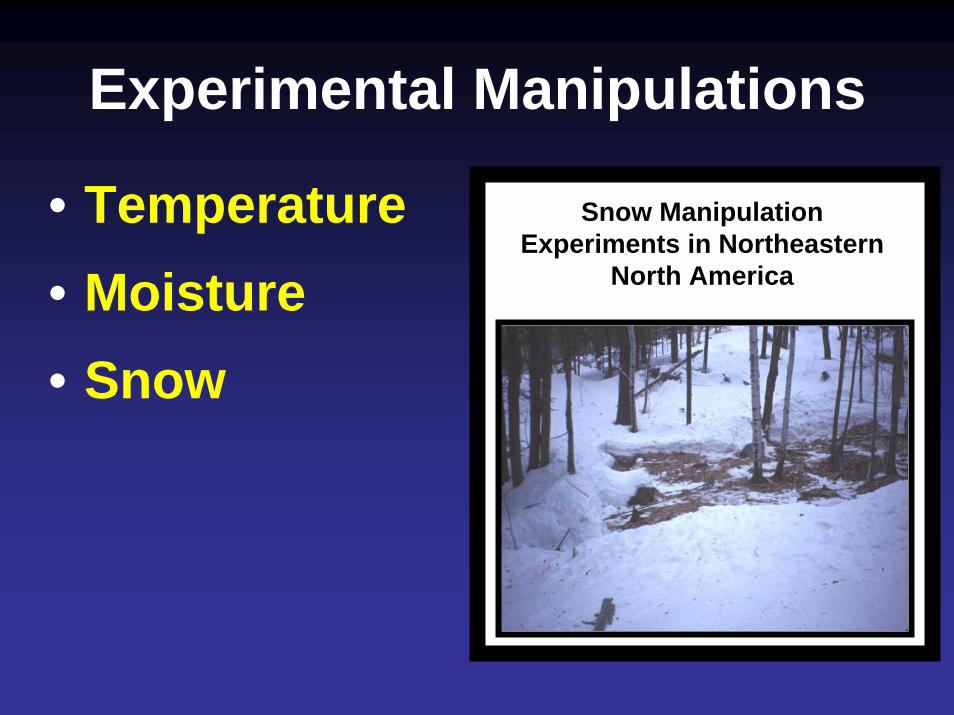
• Temperature• Moisture• Snow
Snow Manipulation Experiments in Northeastern
North America
Experimental Manipulations
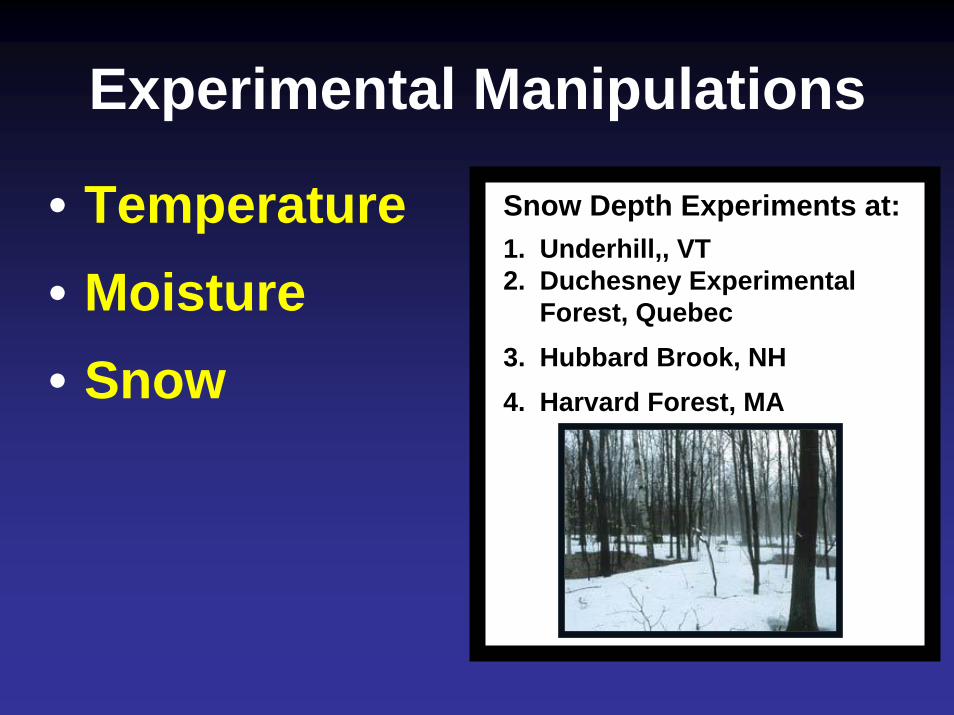
Snow Depth Experiments at:1. Underhill,, VT2. Duchesney Experimental
Forest, Quebec3. Hubbard Brook, NH4. Harvard Forest, MA
• Temperature• Moisture• Snow
Experimental Manipulations
• Temperature• Moisture• Snow
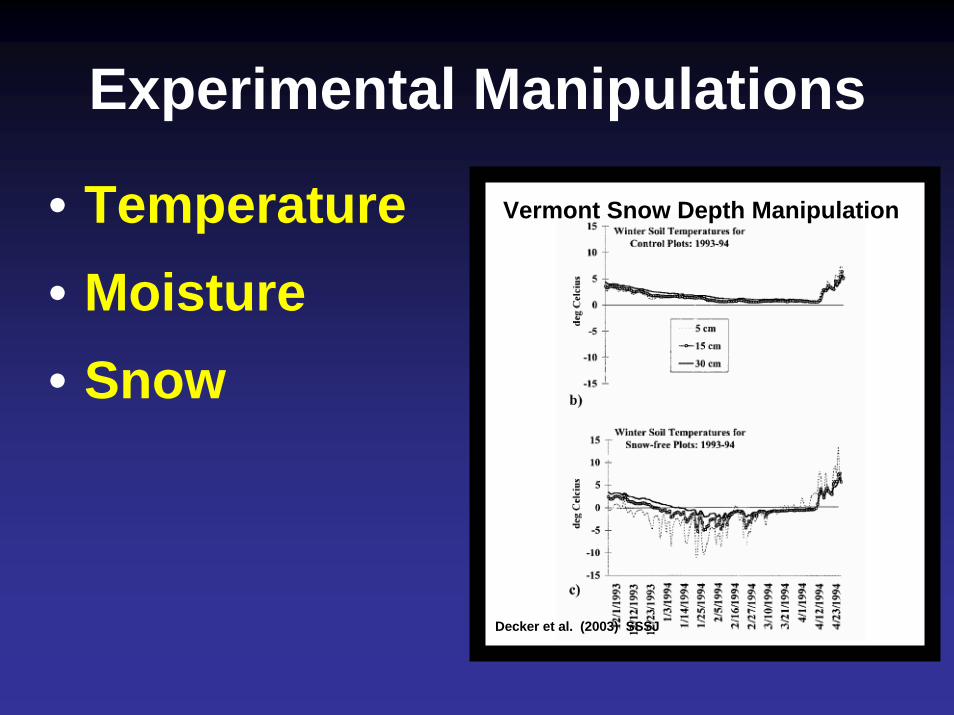
Decker et al. (2003) SSSJ
Vermont Snow Depth Manipulation
Experimental Manipulations
• Temperature• Moisture• Snow
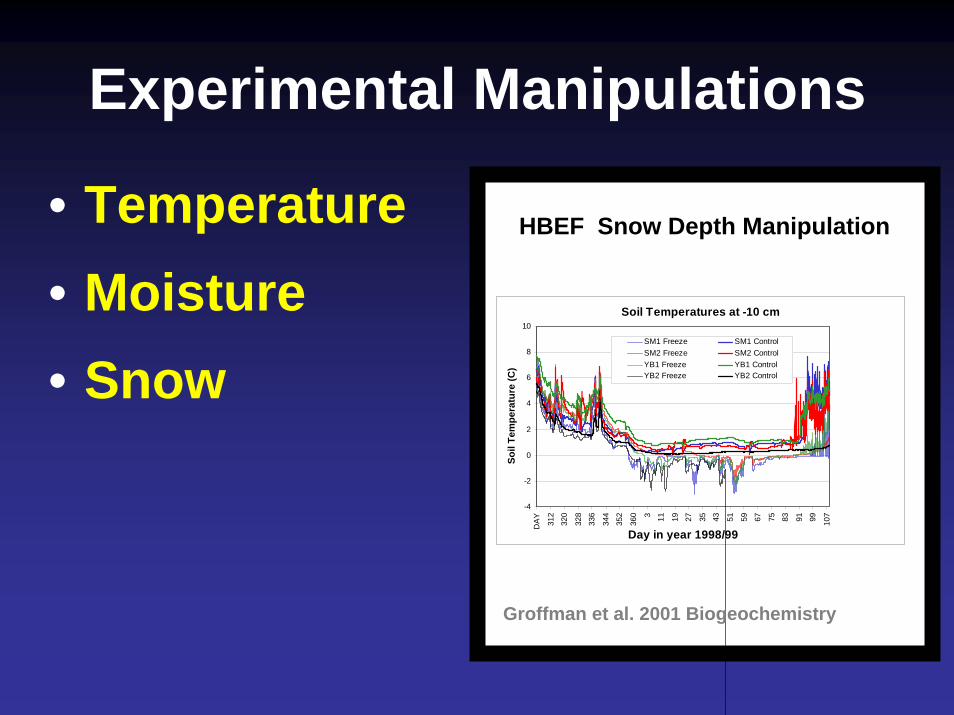
HBEF Snow Depth Manipulation
Soil Temperatures at -10 cm
-4
-2
0
2
4
6
8
10
DA
Y
312
320
328
336
344
352
360 3 11 19 27 35 43 51 59 67 75 83 91 99 107
Day in year 1998/99
Soil
Tem
pera
ture
(C)
SM1 Freeze SM1 ControlSM2 Freeze SM2 ControlYB1 Freeze YB1 ControlYB2 Freeze YB2 Control
Groffman et al. 2001 Biogeochemistry
Experimental Manipulations
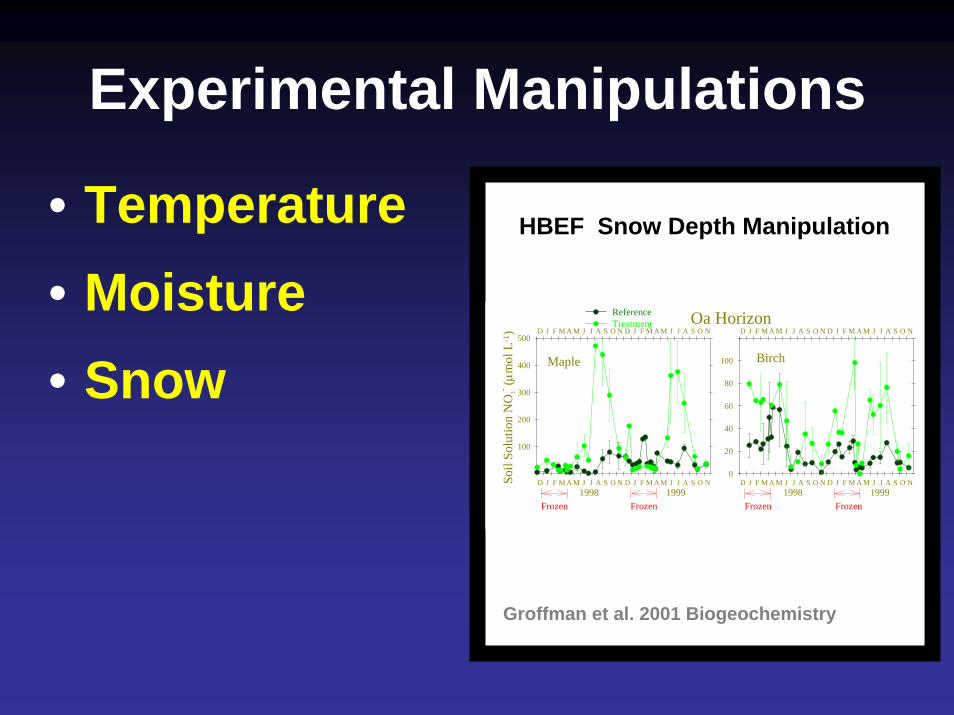
• Temperature HBEF Snow Depth Manipulation
1998 1999
b
*D J F M A M J J A S O N D J F M A M J J A S O N
D J F M A M J J A S O N D J F M A M J J A S O N
Soil
Solu
tion
NO
3- ( µm
ol L
-1)
100
200
300
400
500
ReferenceTreatment
D J F M A M J J A S O N D J F M A M J J A S O N
D J F M A M J J A S O N D J F M A M J J A S O N
0
20
40
60
80
100 BirchMaple
1998 1999
Oa Horizon
Frozen Frozen Frozen Frozen
• Moisture• Snow
Groffman et al. 2001 Biogeochemistry
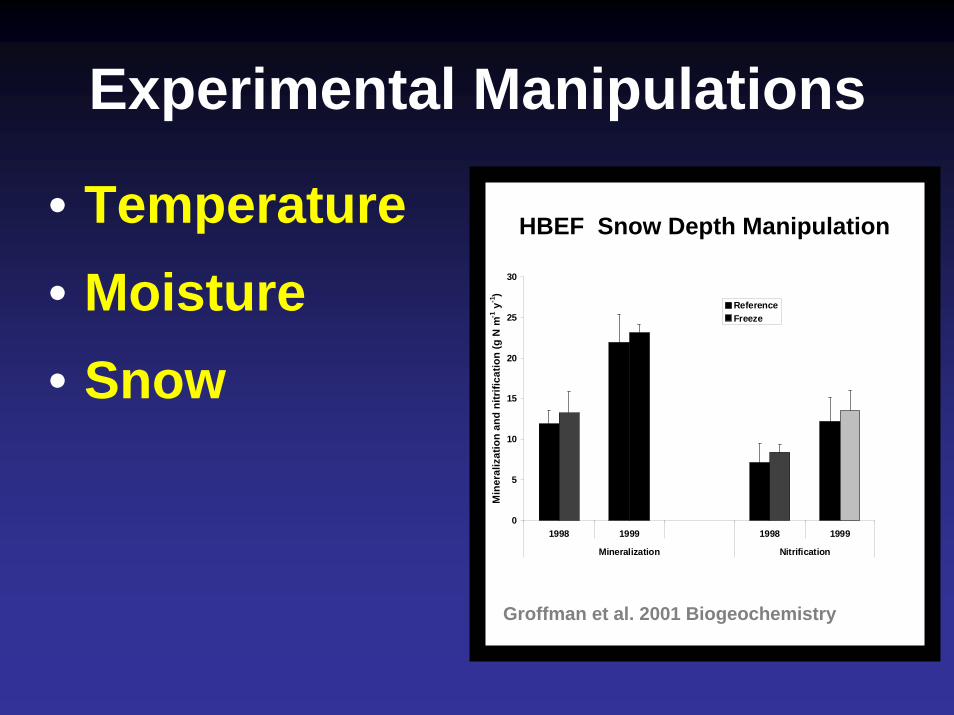
Experimental Manipulations
• Temperature• Moisture• Snow
HBEF Snow Depth Manipulation
0
5
10
15
20
25
30
1998 1999 1998 1999
Mineralization Nitrification
Min
eral
izat
ion
and
nitr
ifica
tion
(g N
m-1
y-1
)
ReferenceFreeze
Groffman et al. 2001 Biogeochemistry
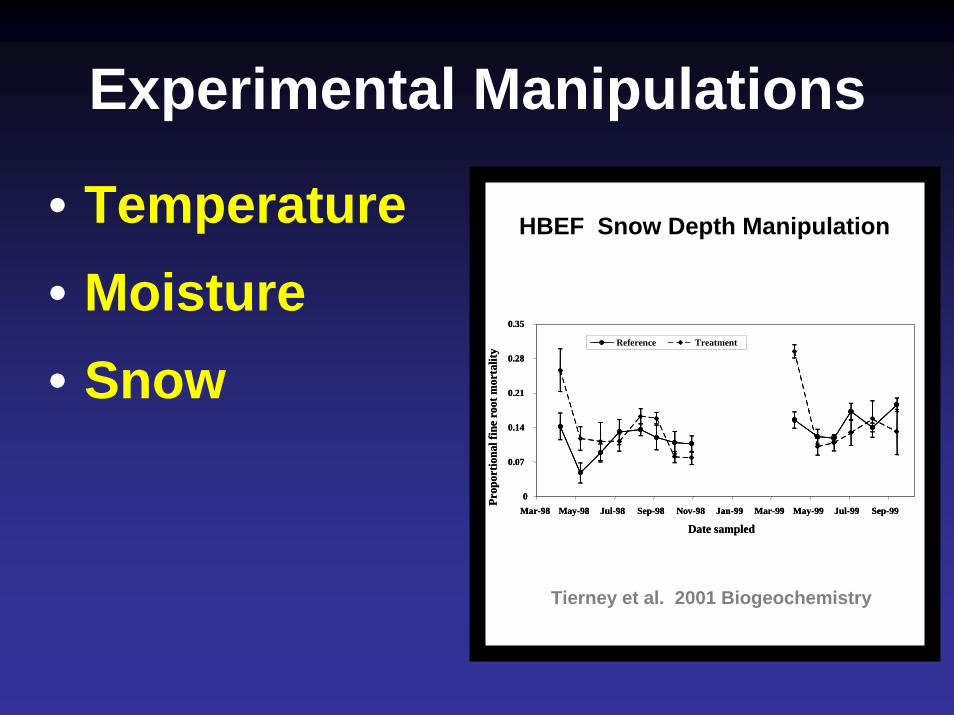
Experimental Manipulations
• Temperature• Moisture• Snow
HBEF Snow Depth Manipulation
0
0.07
0.14
0.21
0.28
0.35
Mar-98 May-98 Jul-98 Sep-98 Nov-98 Jan-99 Mar-99 May-99 Jul-99 Sep-99
Date sampled
Prop
ortio
nal f
ine
root
mor
talit
y
Reference Treatment
0
0.07
0.14
0.21
0.28
0.35
Mar-98 May-98 Jul-98 Sep-98 Nov-98 Jan-99 Mar-99 May-99 Jul-99 Sep-99
Date sampled
Prop
ortio
nal f
ine
root
mor
talit
y
Reference Treatment
Tierney et al. 2001 Biogeochemistry

Gradient Studies
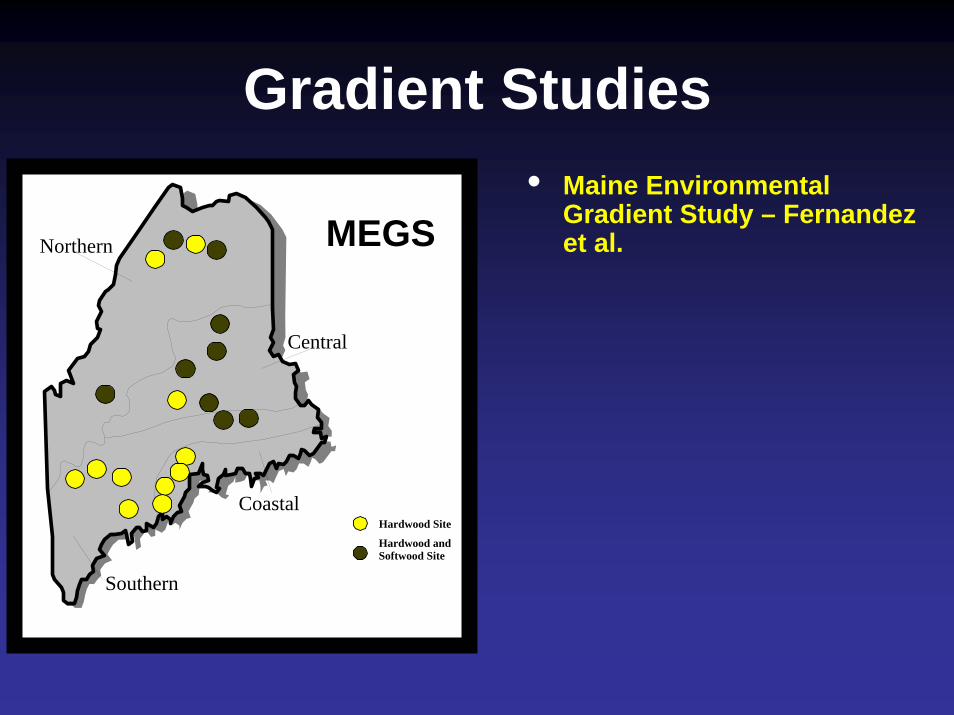
Gradient Studies• Maine Environmental
Gradient Study – Fernandez et al.Northern
Central
Southern
CoastalHardwood Site
Hardwood and Softwood Site
MEGS
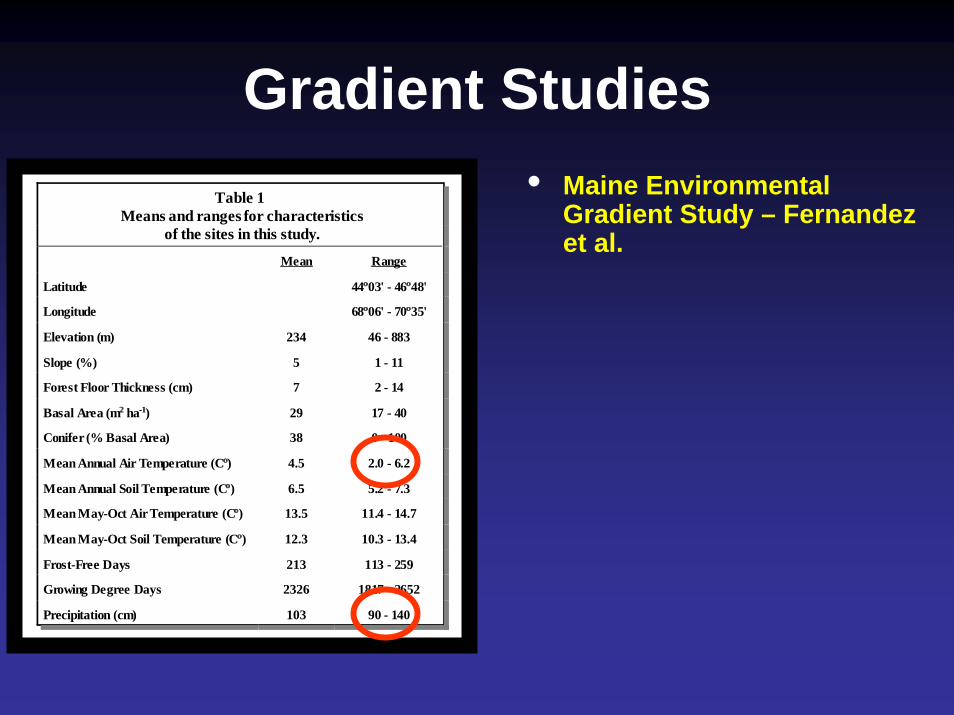
Gradient Studies• Maine Environmental
Gradient Study – Fernandez et al.
Table 1 Means and ranges for characteristics
of the sites in this study.
Mean Range
Latitude 44oo03' - 46oo48'
Longitude 68oo06' - 70oo35'
Elevation (m) 234 46 - 883
Slope (%) 5 1 - 11
Forest Floor Thickness (cm) 7 2 - 14
Basal Area (m22 ha-1-1) 29 17 - 40
Conifer (% Basal Area) 38 0 - 100
Mean Annual Air Temperature (Coo) 4.5 2.0 - 6.2
Mean Annual Soil Temperature (Coo) 6.5 5.2 - 7.3
Mean May-Oct Air Temperature (Coo) 13.5 11.4 - 14.7
Mean May-Oct Soil Temperature (Coo) 12.3 10.3 - 13.4
Frost-Free Days 213 113 - 259
Growing Degree Days 2326 1817 - 2652
Precipitation (cm) 103 90 - 140
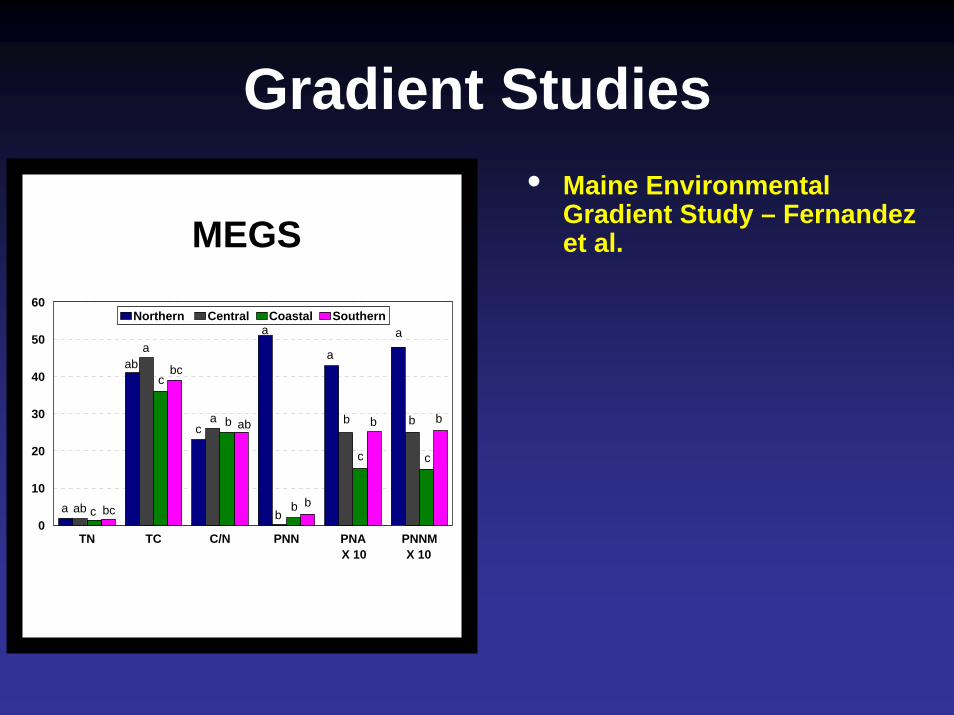
Gradient Studies• Maine Environmental
Gradient Study – Fernandez et al.
TN TC C/N PNN PNA PNNM0
10
20
30
40
50
60Northern Central Coastal Southern
a
b
a
ba
ca
c
b
a
X 10
ab bc
aba
cbc
c ab
b b
b
c
b b
X 10
MEGS
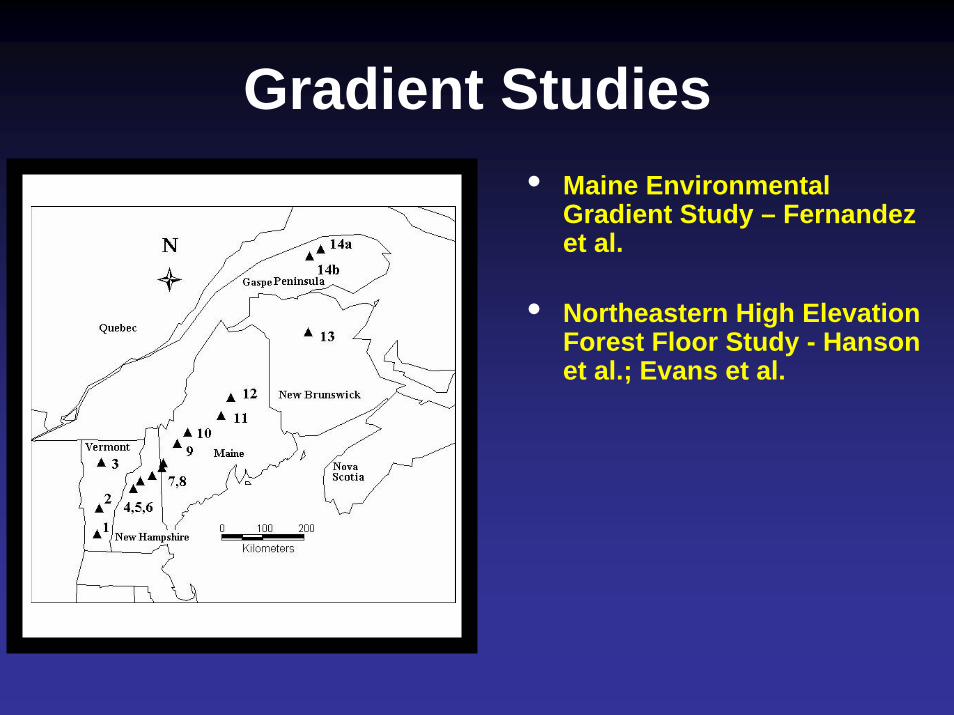
Gradient Studies• Maine Environmental
Gradient Study – Fernandez et al.
Northeastern High Elevation Forest Floor Study - Hanson et al.; Evans et al.
•
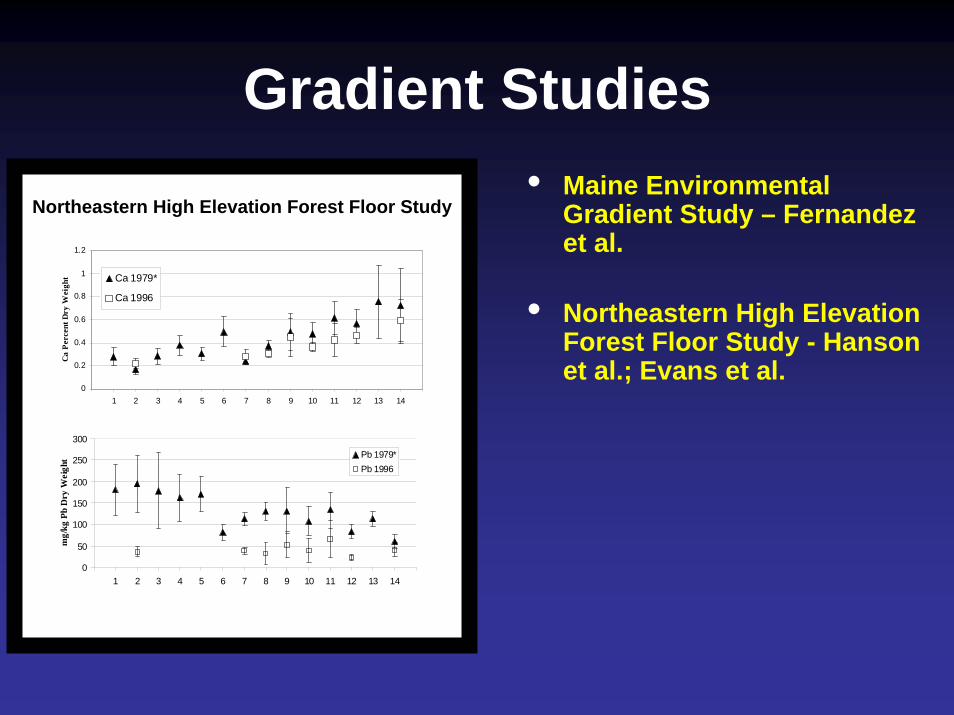
Gradient Studies• Maine Environmental
Gradient Study – Fernandez et al.
• Northeastern High Elevation Forest Floor Study - Hanson et al.; Evans et al.
0
0.2
0.4
0.6
0.8
1
1.2
1 2 3 4 5 6 7 8 9 10 11 12 13 14
Ca
Per
cent
Dry
Wei
ght Ca 1979*
Ca 1996
0
50
100
150
200
250
300
1 2 3 4 5 6 7 8 9 10 11 12 13 14
mg/
kg P
b D
ry W
eigh
t Pb 1979*Pb 1996
Northeastern High Elevation Forest Floor Study
Gradient Studies• Maine Environmental
Gradient Study – Fernandez et al.
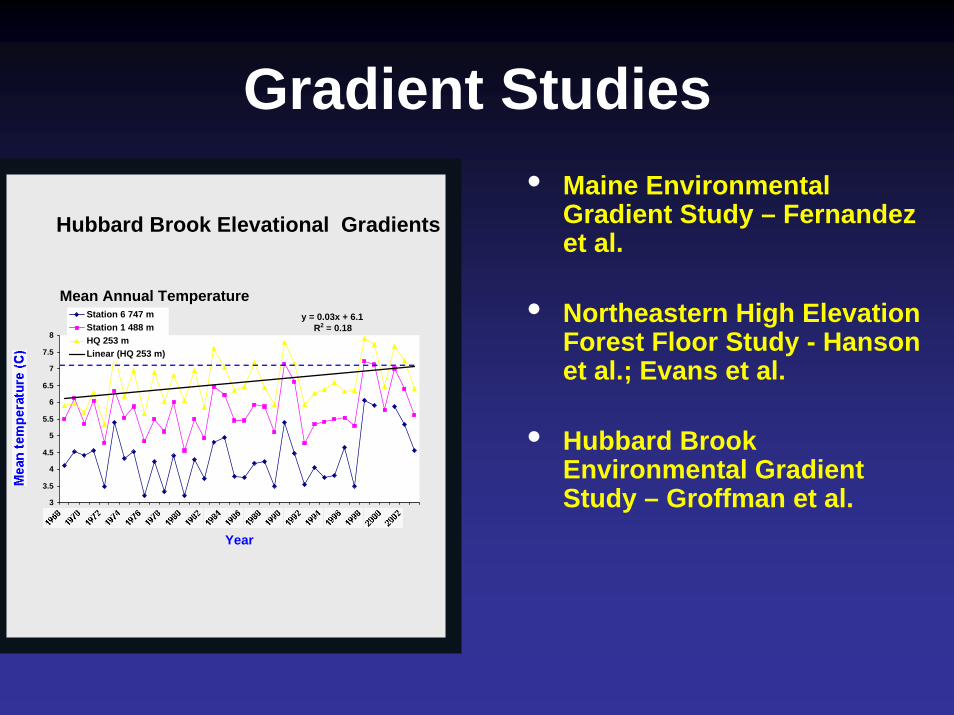
• Northeastern High ElevationForest Floor Study - Hansonet al.; Evans et al.
• Hubbard Brook Environmental Gradient Study – Groffman et al.
Mean Annual Temperaturey = 0.03x + 6.1
R2 = 0.18
3
3.5
4
4.5
5
5.5
6
6.5
7
7.5
8
1968
Year
Station 6 747 mStation 1 488 mHQ 253 mLinear (HQ 253 m)
Hubbard Brook Elevational Gradients
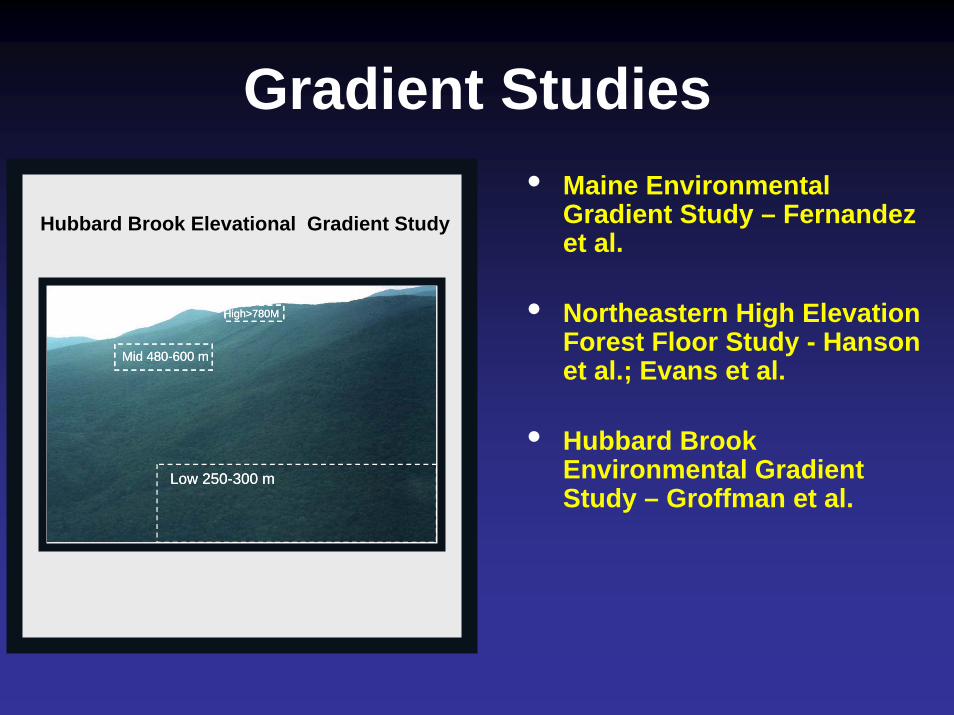
Gradient Studies• Maine Environmental
Gradient Study – Fernandez et al.
• Northeastern High Elevation Forest Floor Study - Hanson et al.; Evans et al.
• Hubbard Brook Environmental Gradient Study – Groffman et al.
Low 250-300 m
Mid 480-600 m
High>780M
Low 250-300 m
Mid 480-600 m
High>780M
Low 250-300 m
Mid 480-600 m
High>780M
Hubbard Brook Elevational Gradient Study
Gradient Studies• Maine Environmental
Gradient Study – Fernandez et al.
• Northeastern High Elevation Forest Floor Study - Hanson et al.; Evans et al.
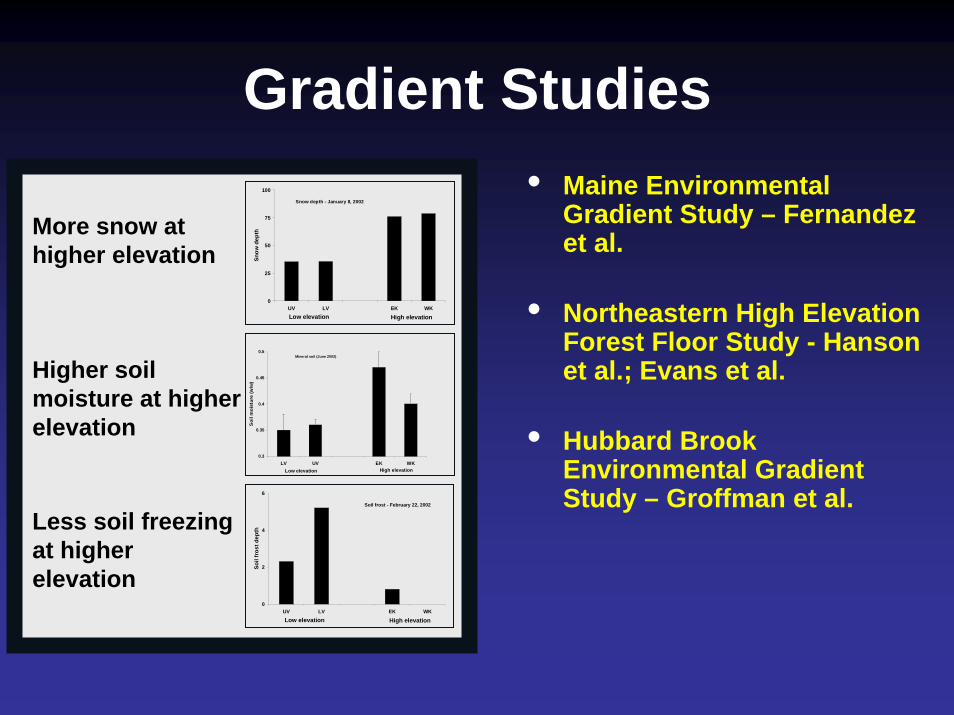
Hubbard Brook Environmental Gradient Study – Groffman et al.
0
25
50
75
100
UV LV EK WK
Snow
dep
th
Low elevation High elevation
Snow depth - January 8, 2002
0
2
4
6
UV LV EK WK
Soil
fros
t dep
th
Low elevation High elevation
Soil frost - February 22, 2002
0.3
0.35
0.4
0.45
0.5
LV UV EK WK
Soi
l moi
stur
e (w
/w)
Low elevation High elevation
Mineral soil (June 2002)
More snow at higher elevation
Higher soilmoisture at higherelevation
Less soil freezingat higher elevation
•
Gradient Studies• Maine Environmental
Gradient Study – Fernandez et al.
• Northeastern High Elevation Forest Floor Study - Hanson et al.; Evans et al.
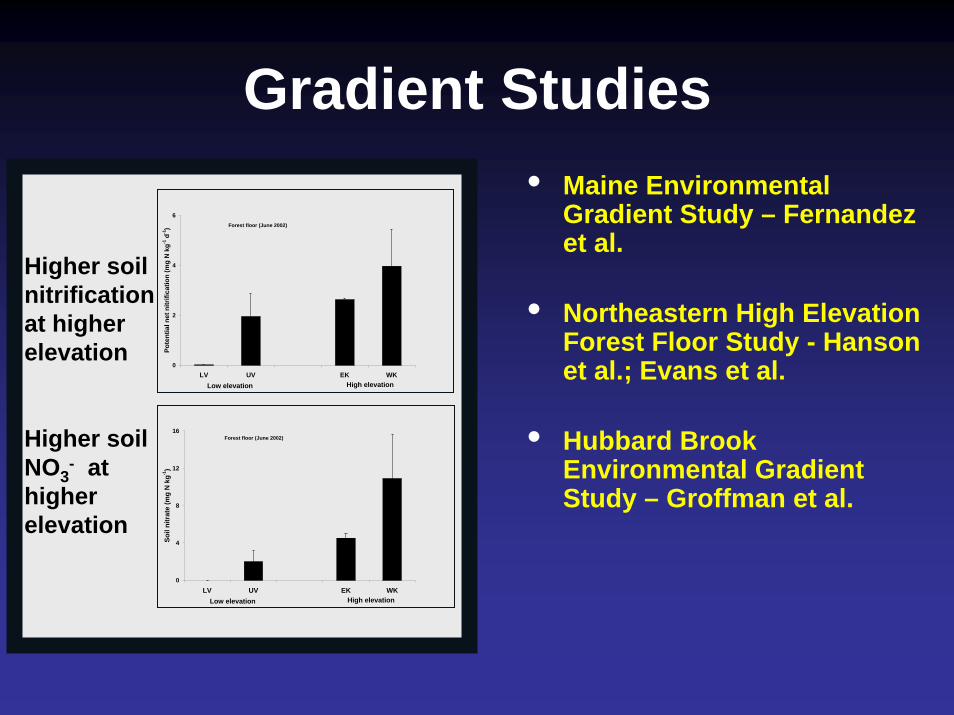
• Hubbard Brook Environmental Gradient Study – Groffman et al.
0
4
8
12
16
LV UV EK WK
Soil
nitr
ate
(mg
N k
g-1)
Low elevation High elevation
Forest floor (June 2002)
0
2
4
6
LV UV EK WK
Pote
ntia
l net
nitr
ifica
tion
(mg
N k
g-1 d
-1)
Low elevation High elevation
Forest floor (June 2002)
Higher soilnitrificationat higher elevation
Higher soil NO3
- at higher elevation
Gradient Studies• Maine Environmental
Gradient Study – Fernandez et al.
• Northeastern High Elevation Forest Floor Study - Hanson et al.; Evans et al.
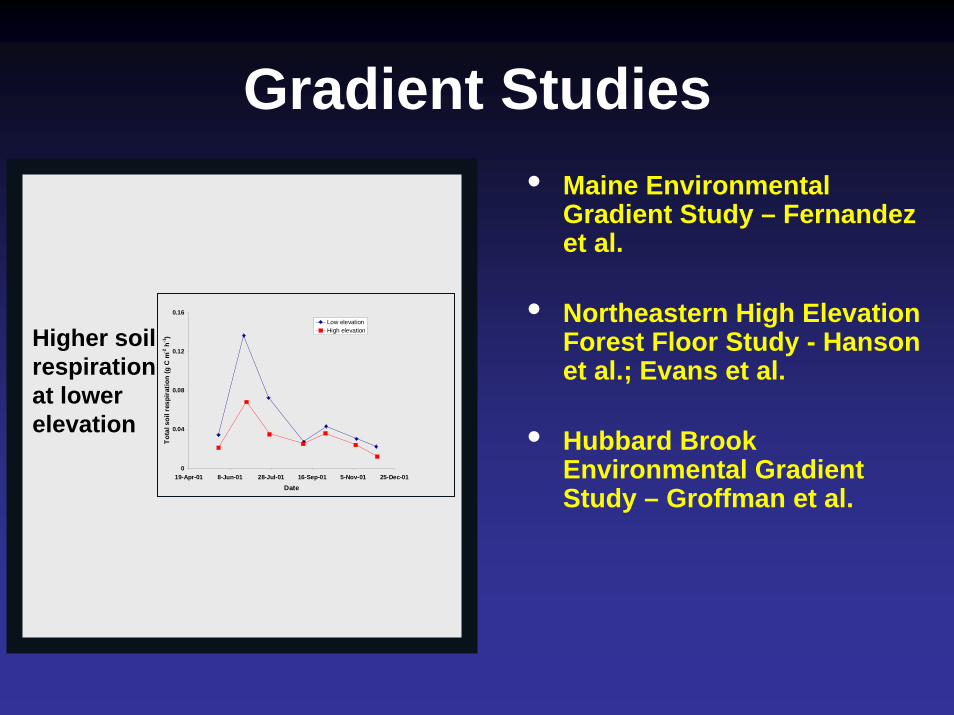
• Hubbard Brook Environmental Gradient Study – Groffman et al.
0
0.04
0.08
0.12
0.16
19-Apr-01 8-Jun-01 28-Jul-01 16-Sep-01 5-Nov-01 25-Dec-01
Date
Tota
l soi
l res
pira
tion
(g C
m-2
h-1
)
Low elevationHigh elevationHigher soil
respirationat lower elevation

Biological Observations
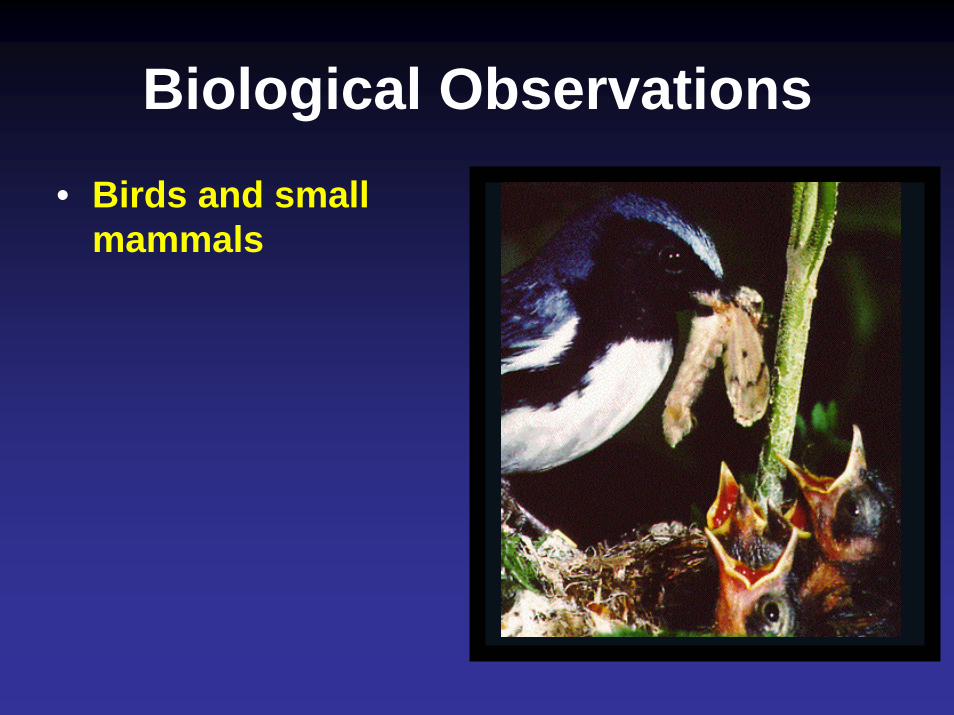
Biological Observations• Birds and small
mammals
Rodenhouse et al.
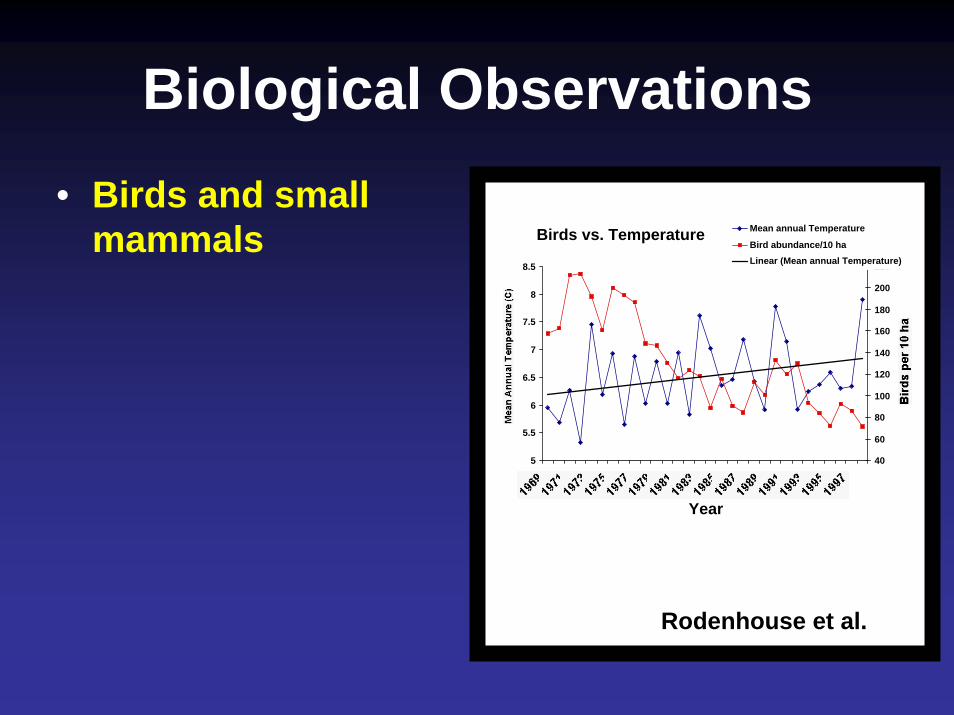
Biological Observations• Birds and small
mammals
Rodenhouse et al.
Birds vs. Temperature
5
5.5
6
6.5
7
7.5
8
8.5
1969
19 19 19 19 19 19 19 19 19 19 19 19 19 19
Year
40
60
80
100
120
140
160
180
200
220
Bird
s pe
r 10
ha
Mean annual Temperature
Bird abundance/10 haLinear (Mean annual Temperature)
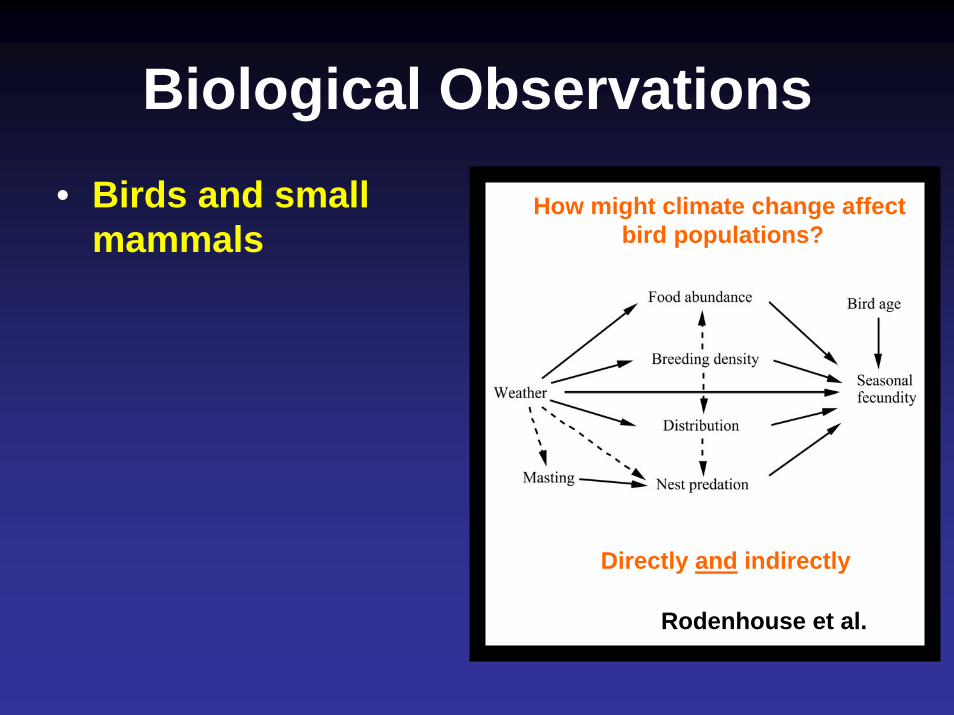
Biological Observations• Birds and small
mammalsHow might climate change affect
bird populations?
Directly and indirectly
Rodenhouse et al.
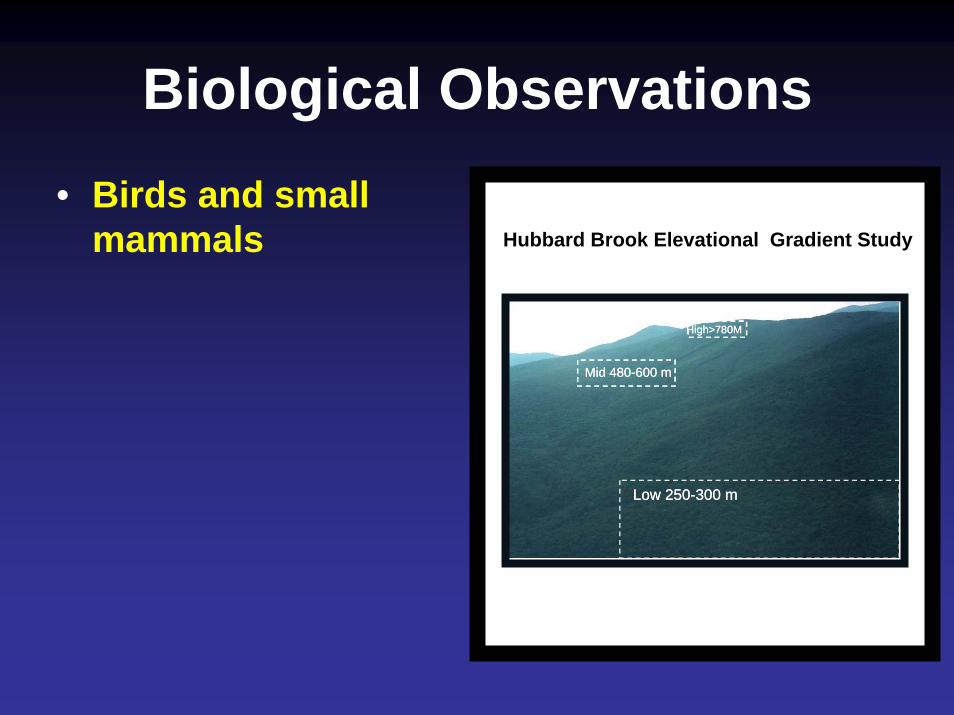
Biological Observations• Birds and small
mammals
Low 250-300 m
Mid 480-600 m
High>780M
Low 250-300 m
Mid 480-600 m
High>780M
Low 250-300 m
Mid 480-600 m
High>780M
Hubbard Brook Elevational Gradient Study
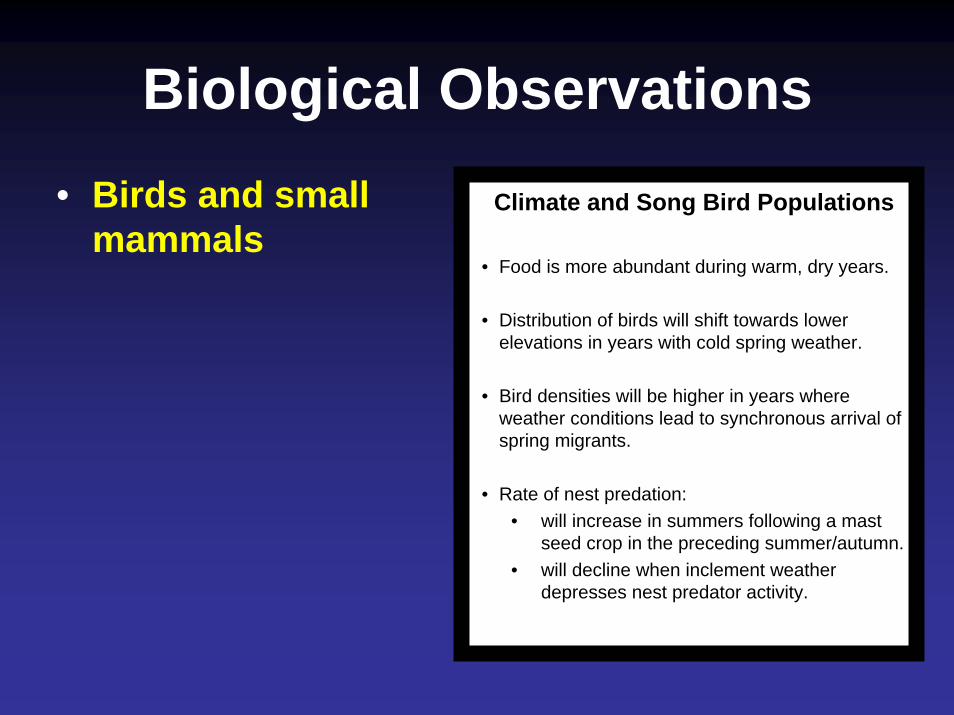
Biological Observations• Birds and small
mammalsClimate and Song Bird Populations
• Food is more abundant during warm, dry years.
• Distribution of birds will shift towards lower elevations in years with cold spring weather.
• Bird densities will be higher in years where weather conditions lead to synchronous arrival of spring migrants.
• Rate of nest predation:• will increase in summers following a mast
seed crop in the preceding summer/autumn.• will decline when inclement weather
depresses nest predator activity.
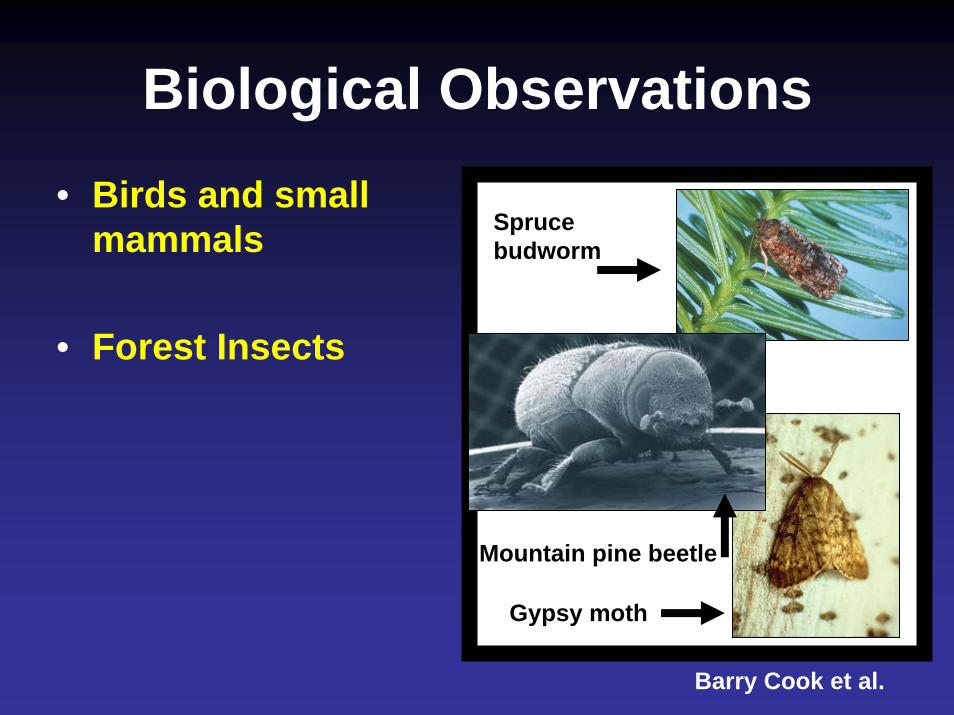
Biological Observations• Birds and small
mammals
• Forest Insects
Sprucebudworm
Mountain pine beetle
Gypsy moth
Barry Cook et al.
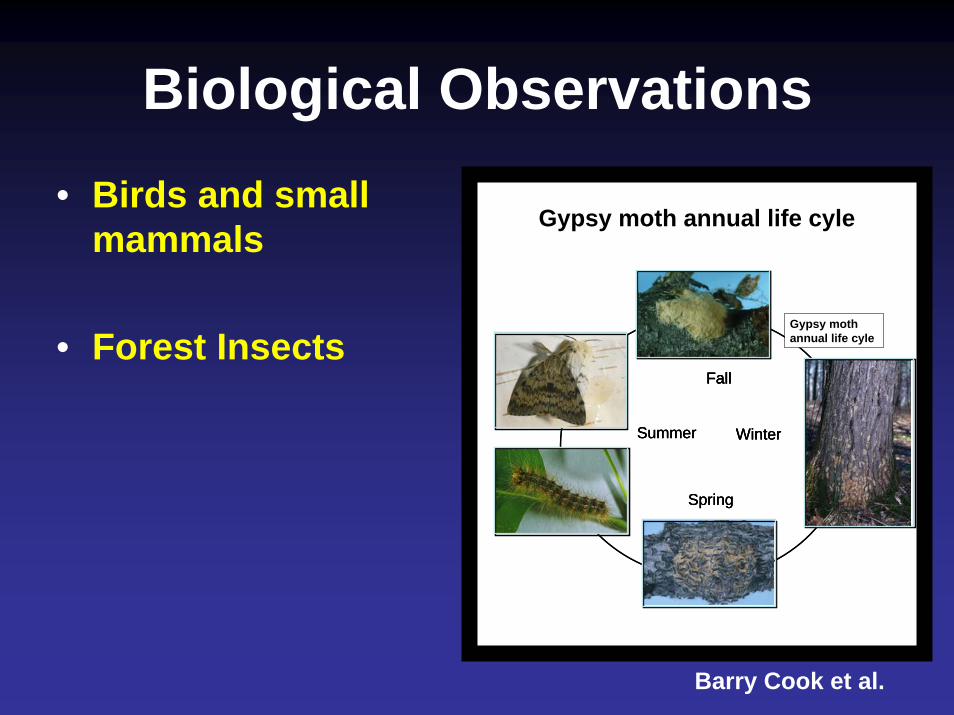
Biological Observations• Birds and small
mammals
• Forest InsectsFallFallFallFall
SummerSummerSummer WinterWinterWinter
SpringSpringSpring
Gypsy moth annual life cyle
Gypsy moth annual life cyle
Barry Cook et al.
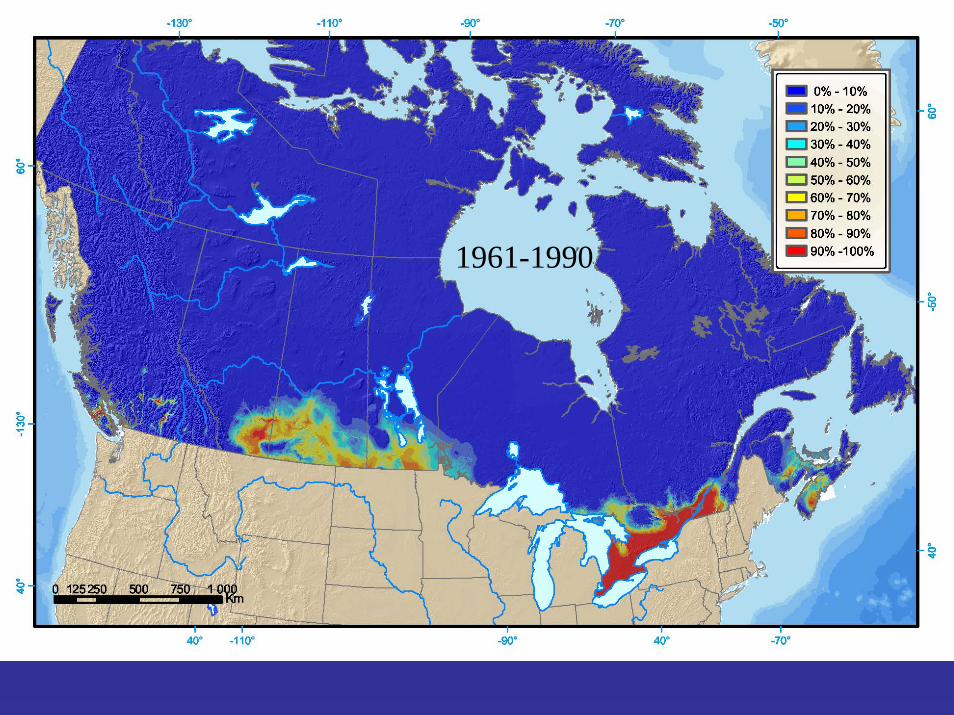
1961-1990
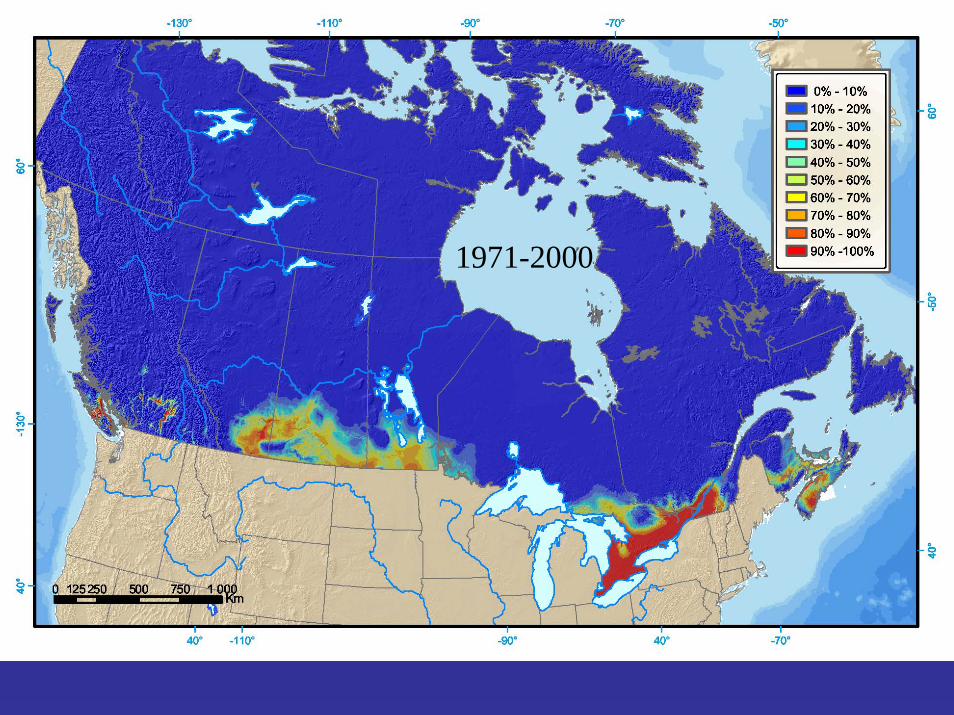
1971-2000
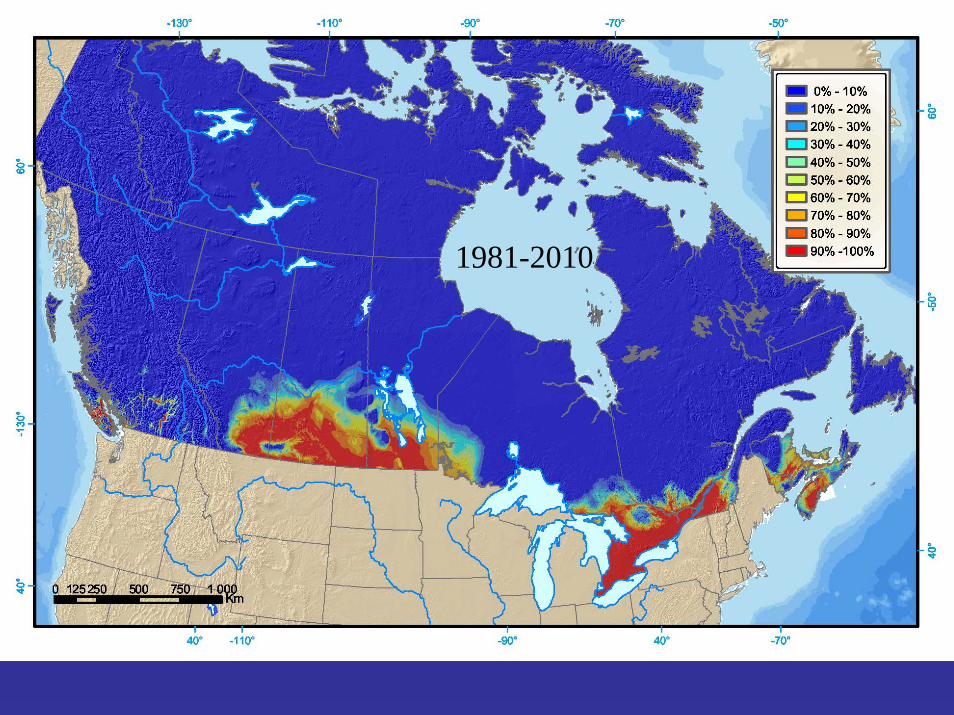
1981-2010

1991-2020
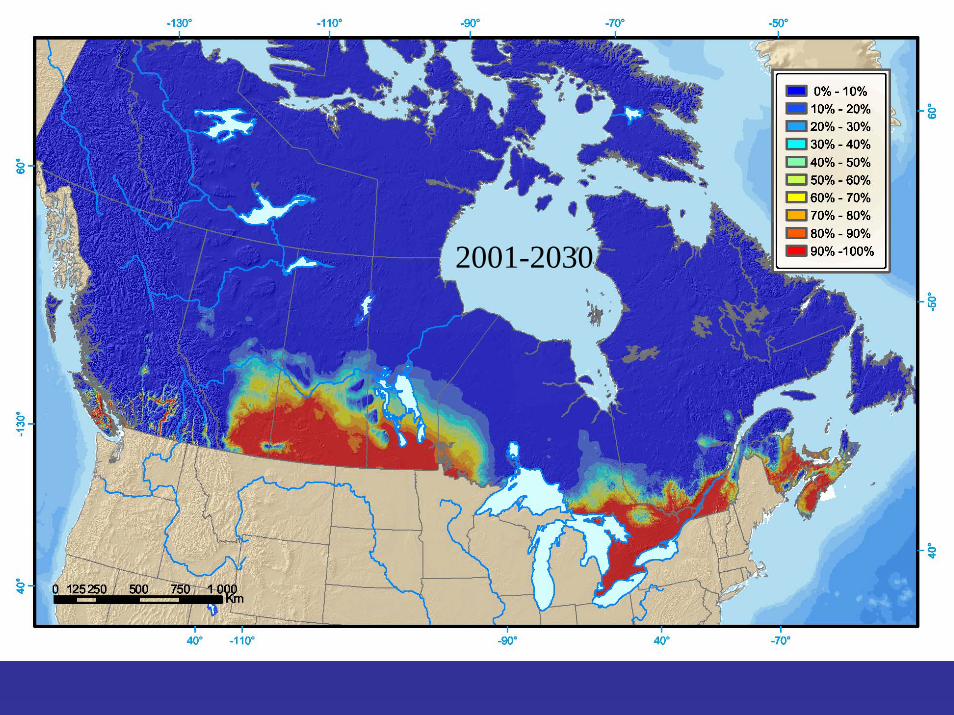
2001-2030
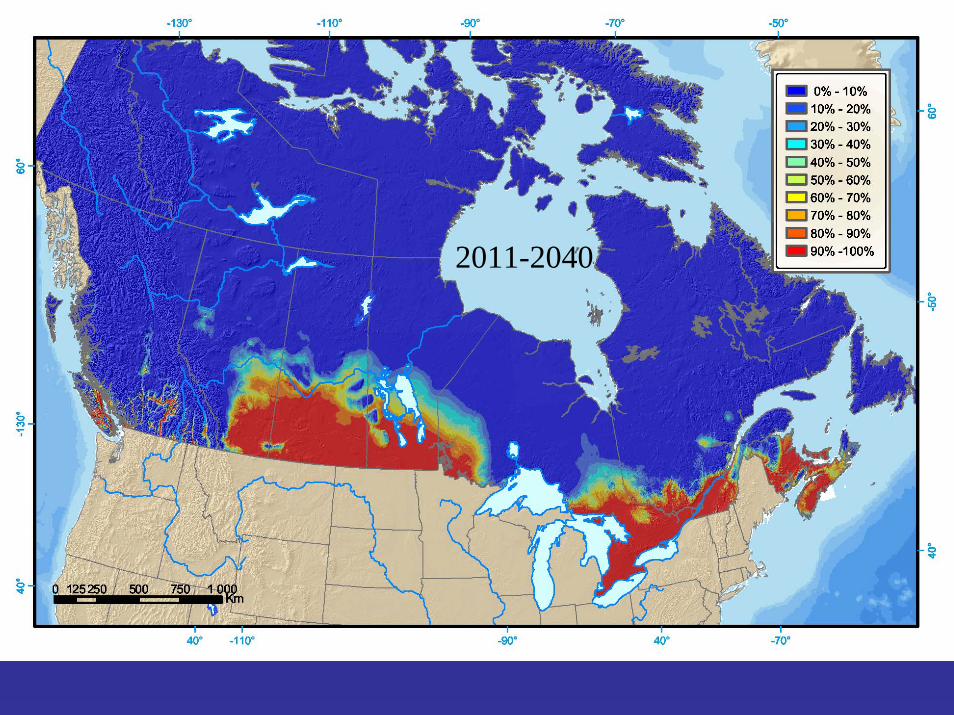
2011-2040
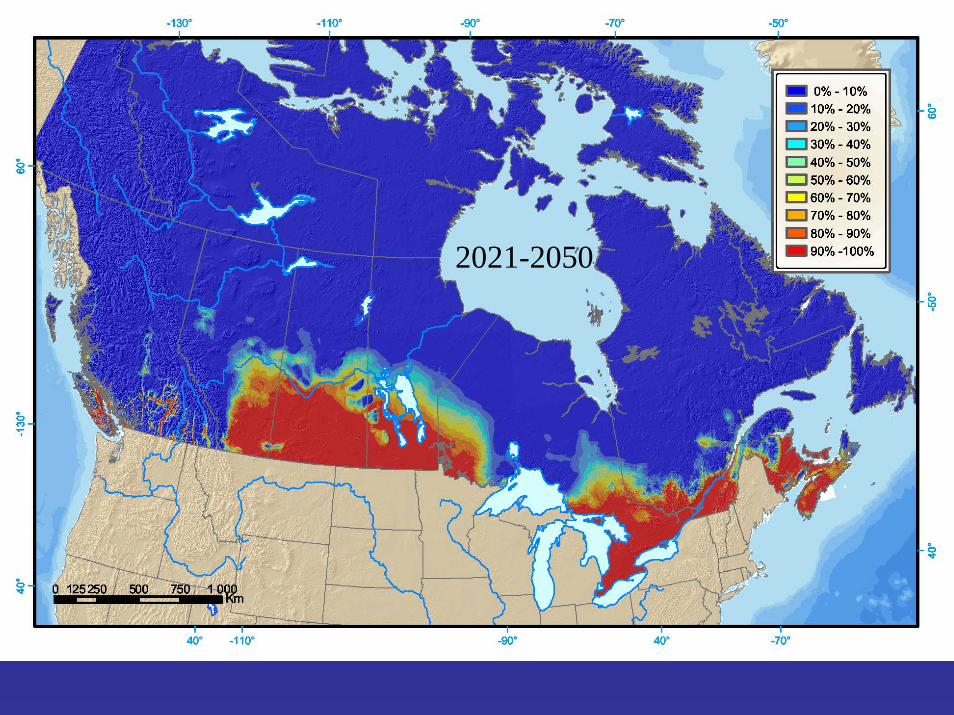
2021-2050
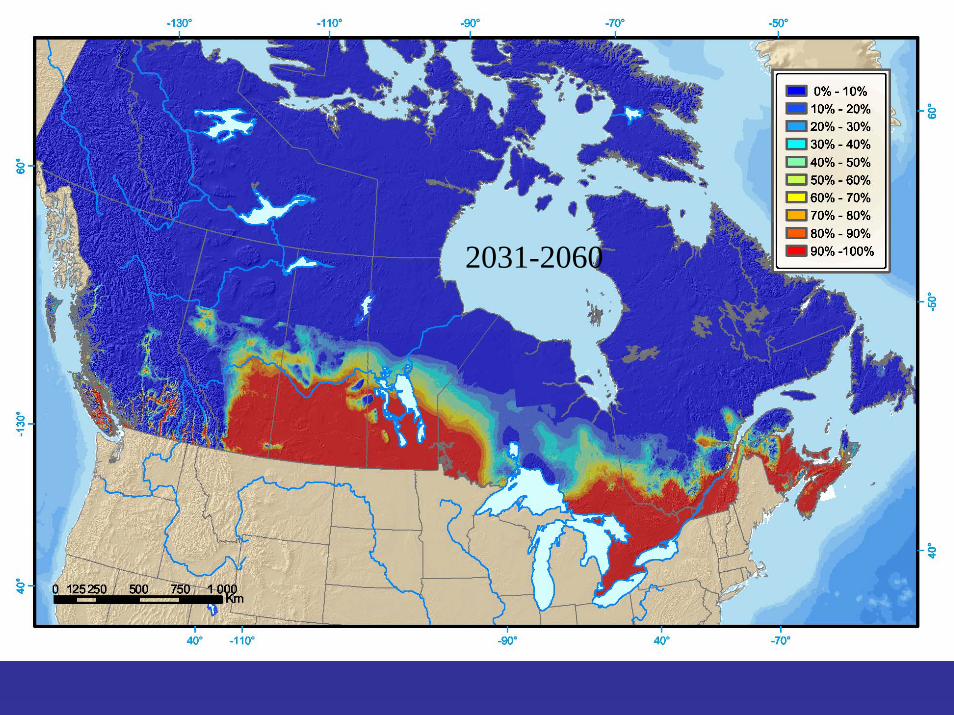
2031-2060
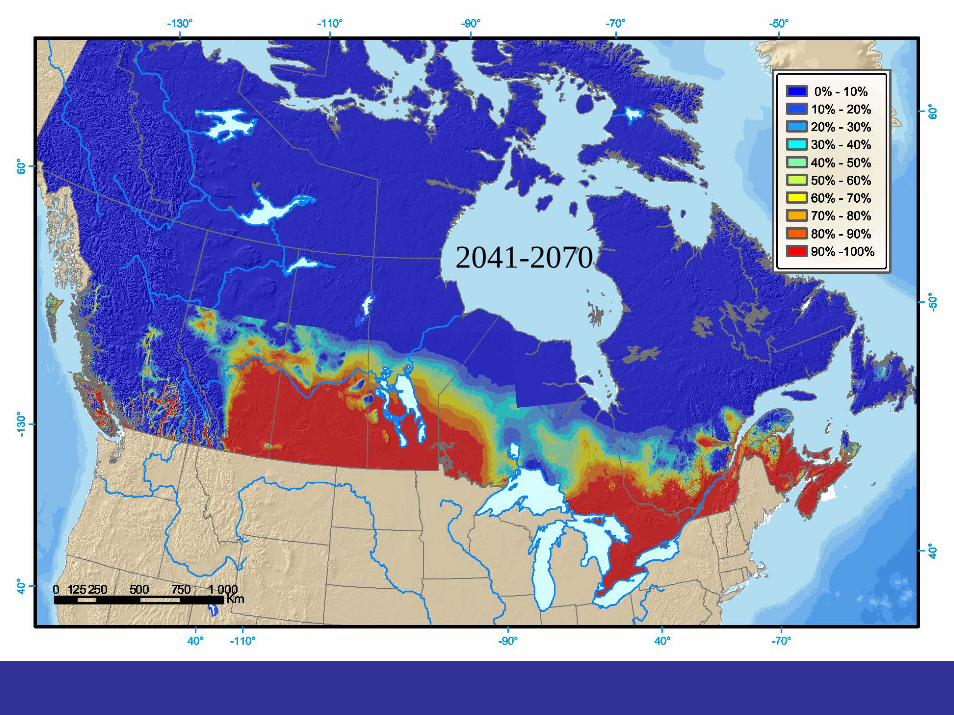
2041-2070

Modeling
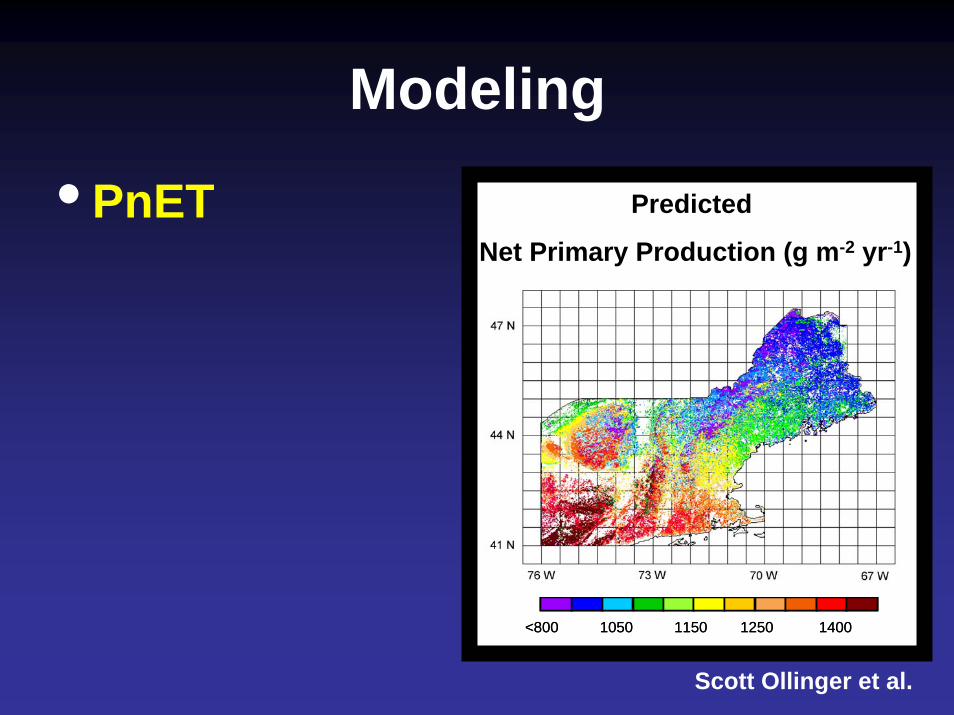
Modeling
• PnET
Scott Ollinger et al.
Predicted
Net Primary Production (g m-2 yr-1)
<800 1050 1150 1250 1400<800 1050 1150 1250 1400
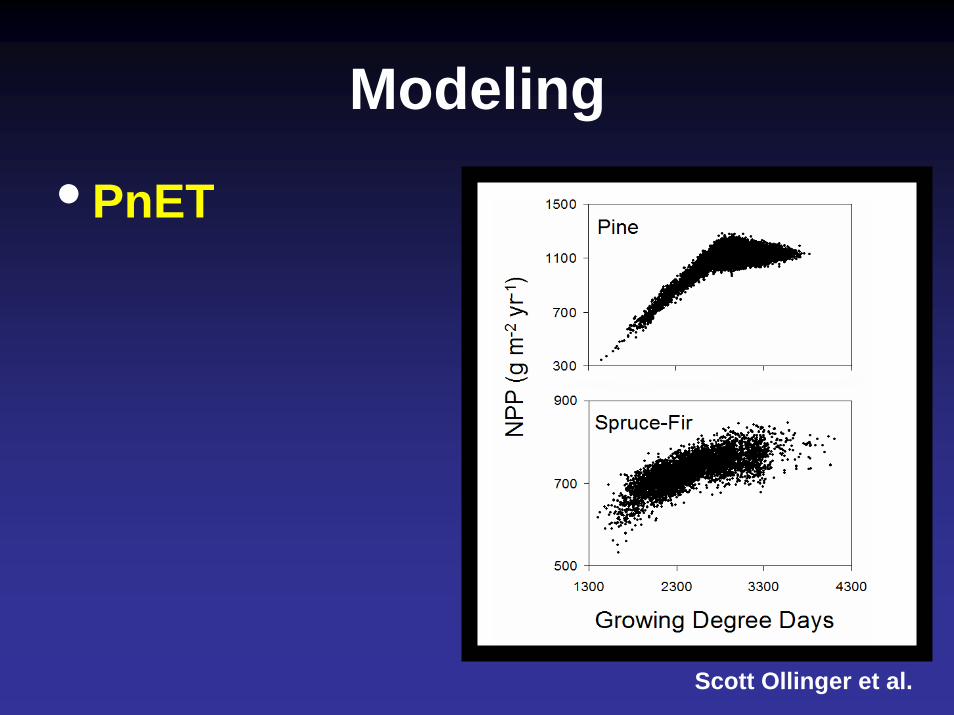
Modeling
• PnET
Scott Ollinger et al.
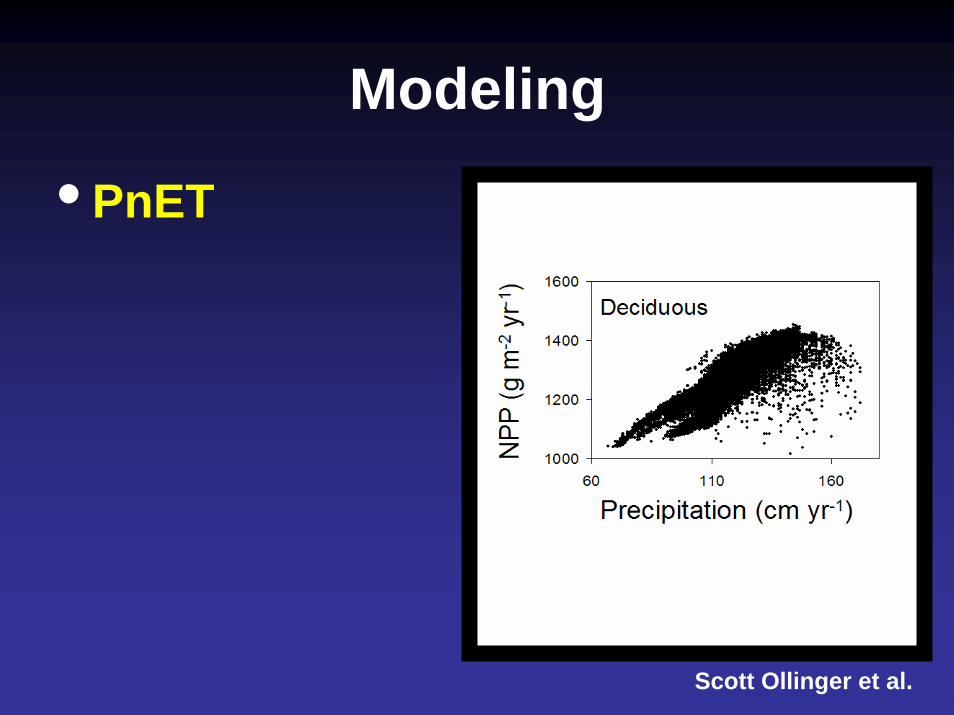
Modeling
• PnET
Scott Ollinger et al.
A New Program on:Synthesis of Climate Change
Researchin Northeastern US and
Eastern Canadian Forest Ecosystems
NERC CVC Working GroupFunded by NSRC and NSF RCN
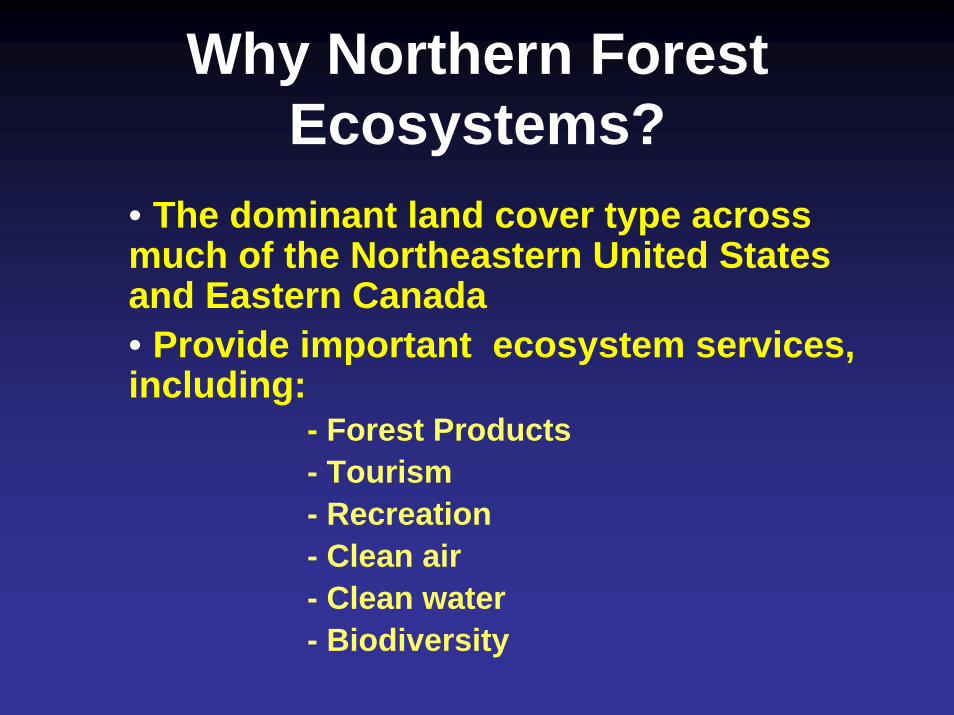
Why Northern Forest Ecosystems?
• The dominant land cover type across much of the Northeastern United States and Eastern Canada• Provide important ecosystem services, including:
- Forest Products- Tourism- Recreation- Clean air- Clean water- Biodiversity
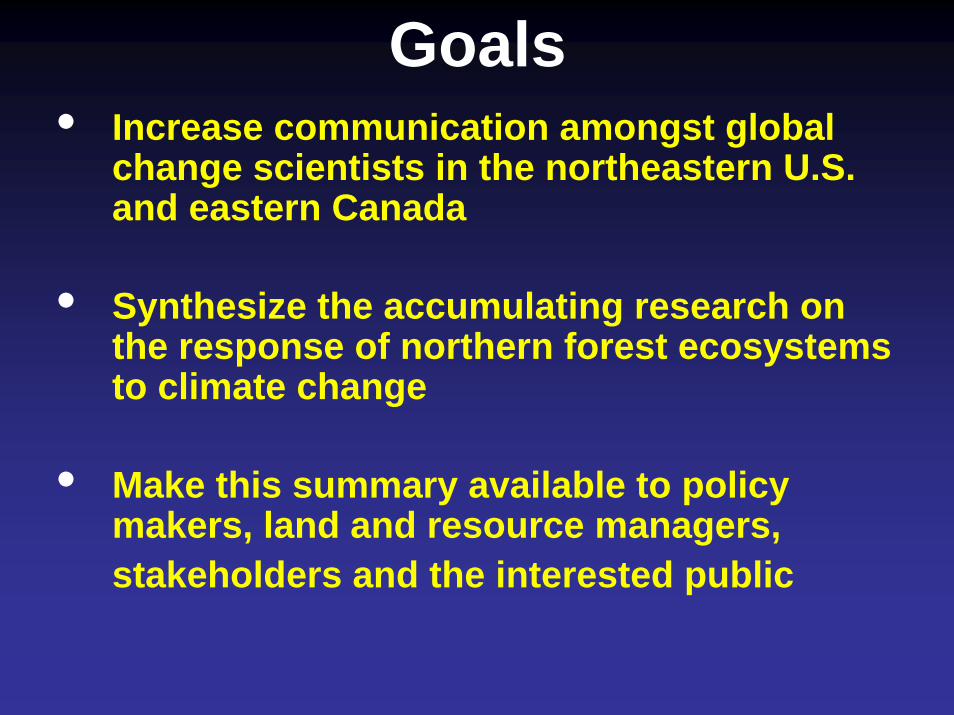
Goals• Increase communication amongst global
change scientists in the northeastern U.S. and eastern Canada
• Synthesize the accumulating research on the response of northern forest ecosystems to climate change
• Make this summary available to policy makers, land and resource managers, stakeholders and the interested public
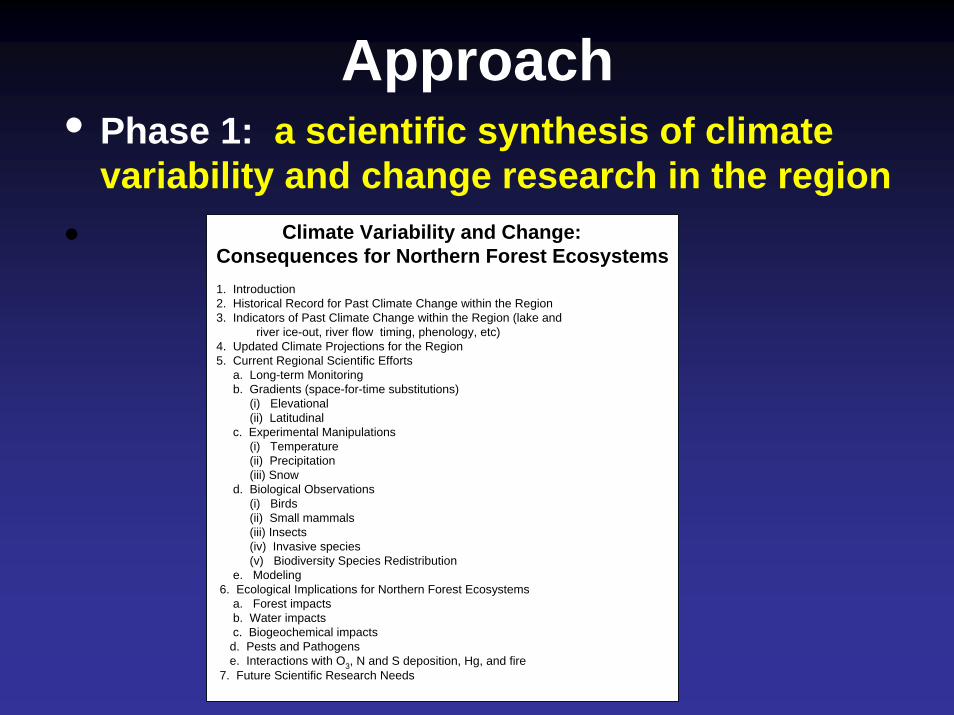
Approach• Phase 1: a scientific synthesis of climate
variability and change research in the region• Climate Variability and Change:
Consequences for Northern Forest Ecosystems1. Introduction 2. Historical Record for Past Climate Change within the Region 3. Indicators of Past Climate Change within the Region (lake and
river ice-out, river flow timing, phenology, etc)4. Updated Climate Projections for the Region 5. Current Regional Scientific Efforts
a. Long-term Monitoring b. Gradients (space-for-time substitutions)
(i) Elevational (ii) Latitudinal
c. Experimental Manipulations(i) Temperature(ii) Precipitation(iii) Snow
d. Biological Observations(i) Birds (ii) Small mammals (iii) Insects(iv) Invasive species (v) Biodiversity Species Redistribution
e. Modeling6. Ecological Implications for Northern Forest Ecosystems
a. Forest impactsb. Water impactsc. Biogeochemical impactsd. Pests and Pathogense. Interactions with O3, N and S deposition, Hg, and fire
7. Future Scientific Research Needs
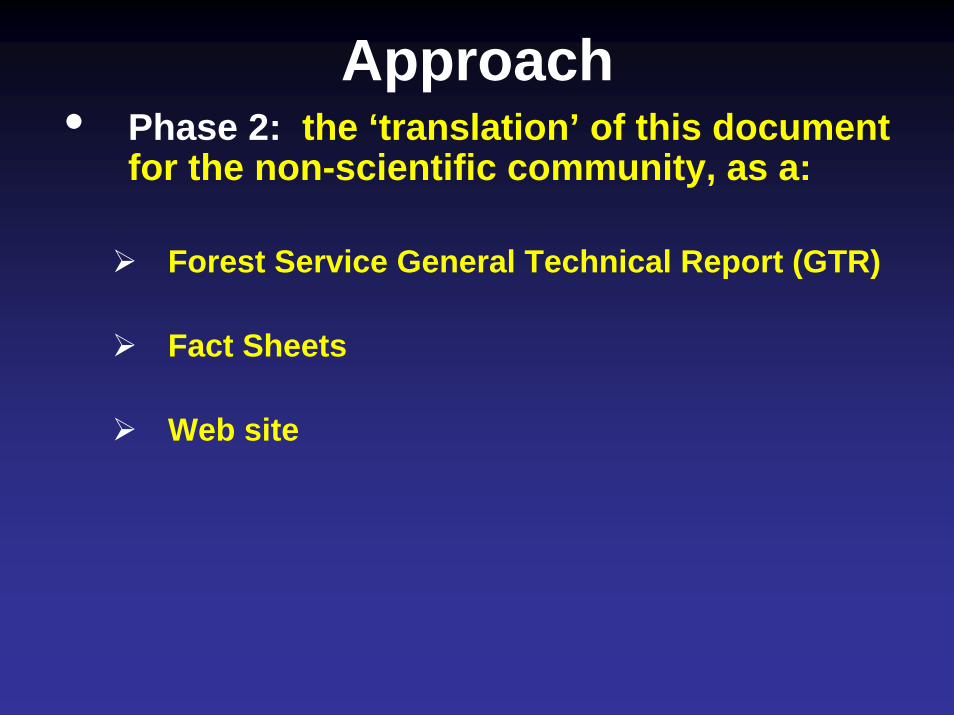
Approach• Phase 2: the ‘translation’ of this document
for the non-scientific community, as a:
Forest Service General Technical Report (GTR)
Fact Sheets
Web site
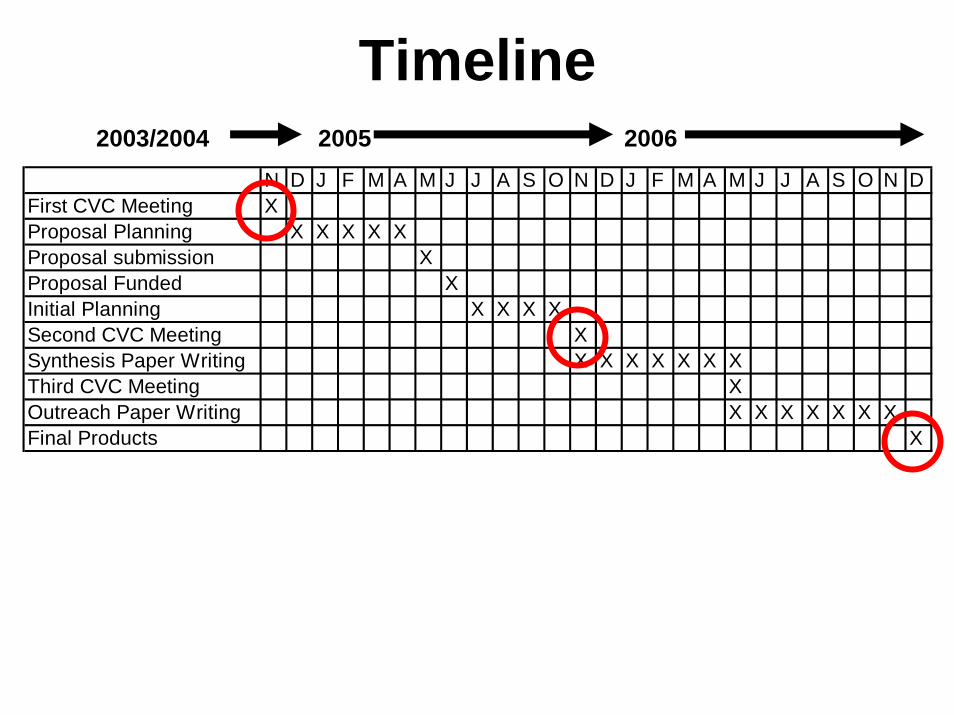
Timeline2003/2004 2005 2006
N D J F M A M J J A S O N D J F M A M J J A S O N DFirst CVC Meeting XProposal Planning X X X X XProposal submission XProposal Funded XInitial Planning X X X XSecond CVC Meeting XSynthesis Paper Writing X X X X X X XThird CVC Meeting XOutreach Paper Writing X X X X X X XFinal Products X
Final Thought….
It is hoped that these products will be used to provide an unbiased scientific
basis for forestry related policy and land management decisions within the
region.