Embed Size (px)
Citation preview

Climate Change:
What Does It Mean For Idaho?
Slides courtesy of
Dr. Jeffrey A. Hicke
Department of Geography
University of Idaho
with the assistance of slides and other materials from: Von Walden, University of Idaho
Karen Humes, University of Idaho Lara Whitely Binder, Climate Impacts Group, University of
Washington Steve Running, University of Montana
K. Wattenmaker, firepix.blm.gov
www.whrc.org
www.usbr.gov
IPCC AR4
IPCC AR4
Lecture by Arjan Meddens

Outline1. Basic science of global warming
2. Recent climate change
3. Future predictions
4. Impacts in Pacific Northwest
K. Wattenmaker, firepix.blm.gov www.usbr.gov

Who evaluates climate science results and produces
reports for governments and the public?
• International Panel of Climate Change (IPCC) – Set up by the World Meteorological Organization (WMO) and
by the United Nations Environment Programme (UNEP).
– Hundreds of scientists all over the world contribute to the work of the IPCC
– Issue “Assessment Reports” approx every 5-6 years (1996, 2001, 2007) http://www.ipcc.ch
• The 2001 report stated: – Influence of human activities now evident
– Rates of change too fast to be “just” natural cycles
• The 2007 report: – Warming of the climate system is certain as is now evident
from observations of increases in global temperatures, widespread melting of snow and ice

http://www.ipcc.ch

WEATHER: Meteorological conditions
of the next Day – Month
CLIMATE: Long term conditions of the
Meteorology over Years - Decades
Slide courtesy S. Running, U. MT
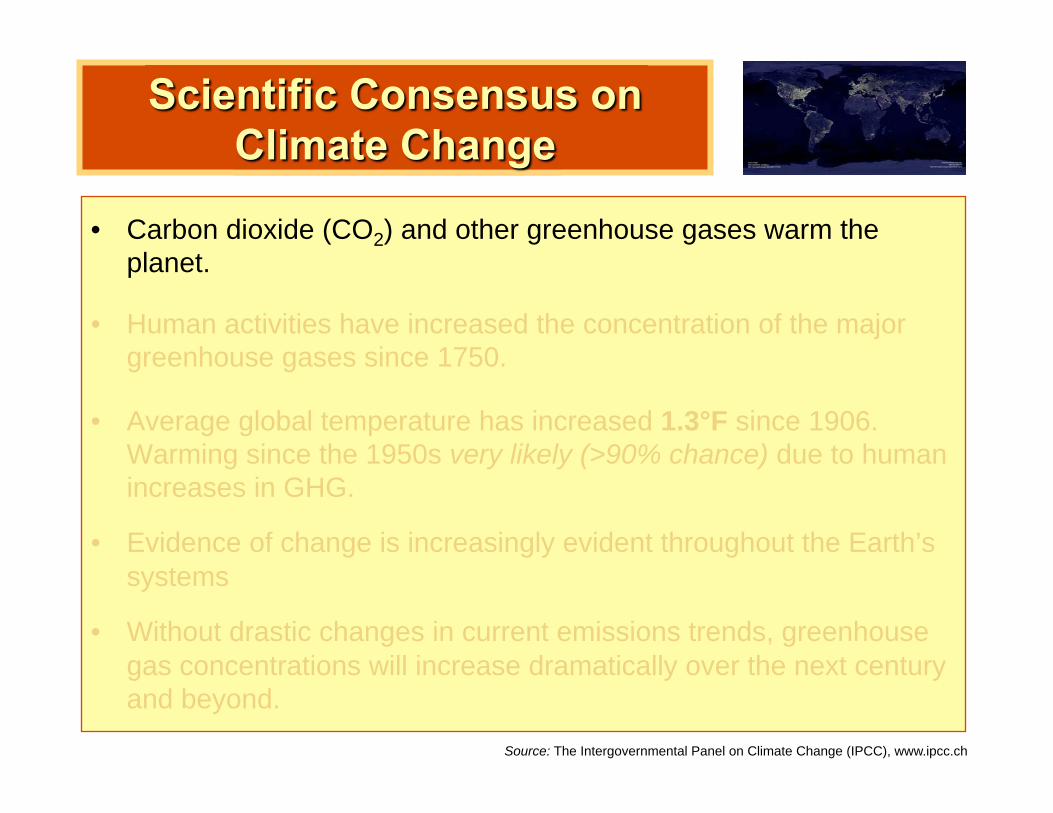
• Carbon dioxide (CO2) and other greenhouse gases warm the
planet.
• Human activities have increased the concentration of the major
greenhouse gases since 1750.
• Average global temperature has increased 1.3°F since 1906.
Warming since the 1950s very likely (>90% chance) due to human
increases in GHG.
• Evidence of change is increasingly evident throughout the Earth’s
systems
• Without drastic changes in current emissions trends, greenhouse
gas concentrations will increase dramatically over the next century
and beyond.
Source: The Intergovernmental Panel on Climate Change (IPCC), www.ipcc.ch

Greenhouse gases (water vapor, CO2, CH4, N2O) play a
critical role in determining global temperature
These special gases act like a “blanket”, trapping heat emitted by the
Earth, which is warmed by the Sun
This greenhouse effect makes the Earth a livable planet, BUT….

A positive radiative forcing tends to warm the surface of the Earth,
and negative forcing tends to cool the surface.
Radiative forcing (in W/m2) is the change in the balance between
radiation coming into the atmosphere and radiation going out
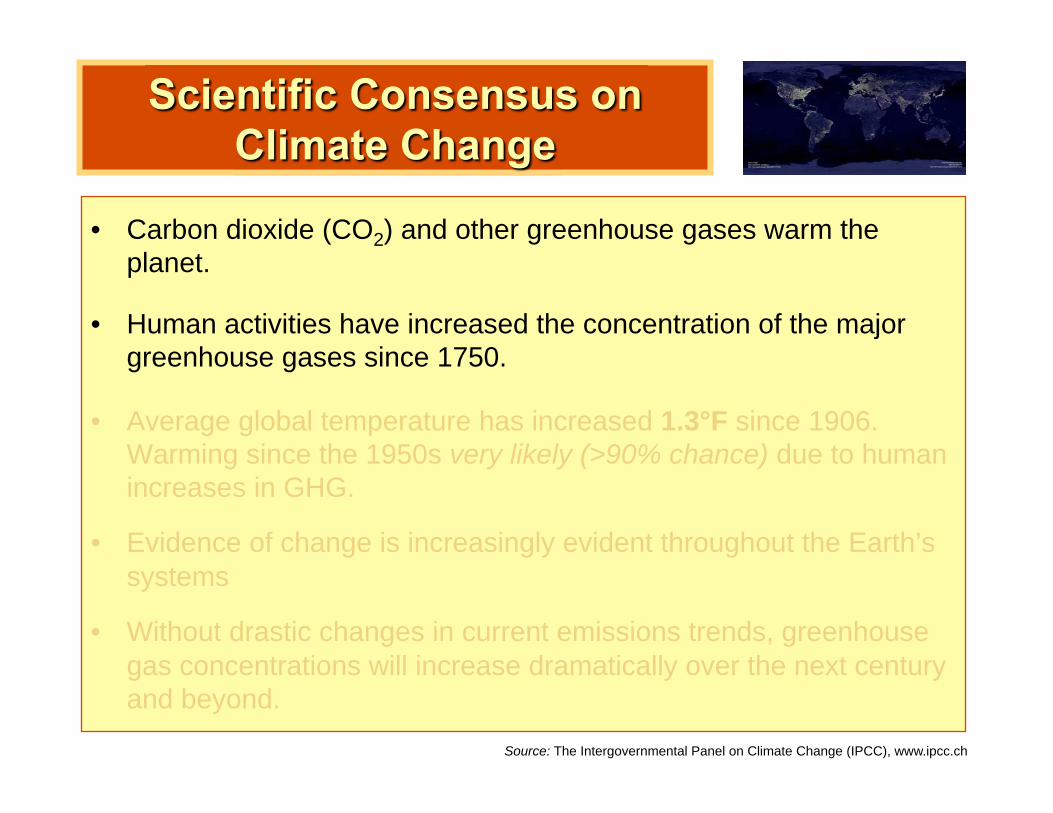
• Carbon dioxide (CO2) and other greenhouse gases warm the
planet.
• Human activities have increased the concentration of the major
greenhouse gases since 1750.
• Average global temperature has increased 1.3°F since 1906.
Warming since the 1950s very likely (>90% chance) due to human
increases in GHG.
• Evidence of change is increasingly evident throughout the Earth’s
systems
• Without drastic changes in current emissions trends, greenhouse
gas concentrations will increase dramatically over the next century
and beyond.
Source: The Intergovernmental Panel on Climate Change (IPCC), www.ipcc.ch
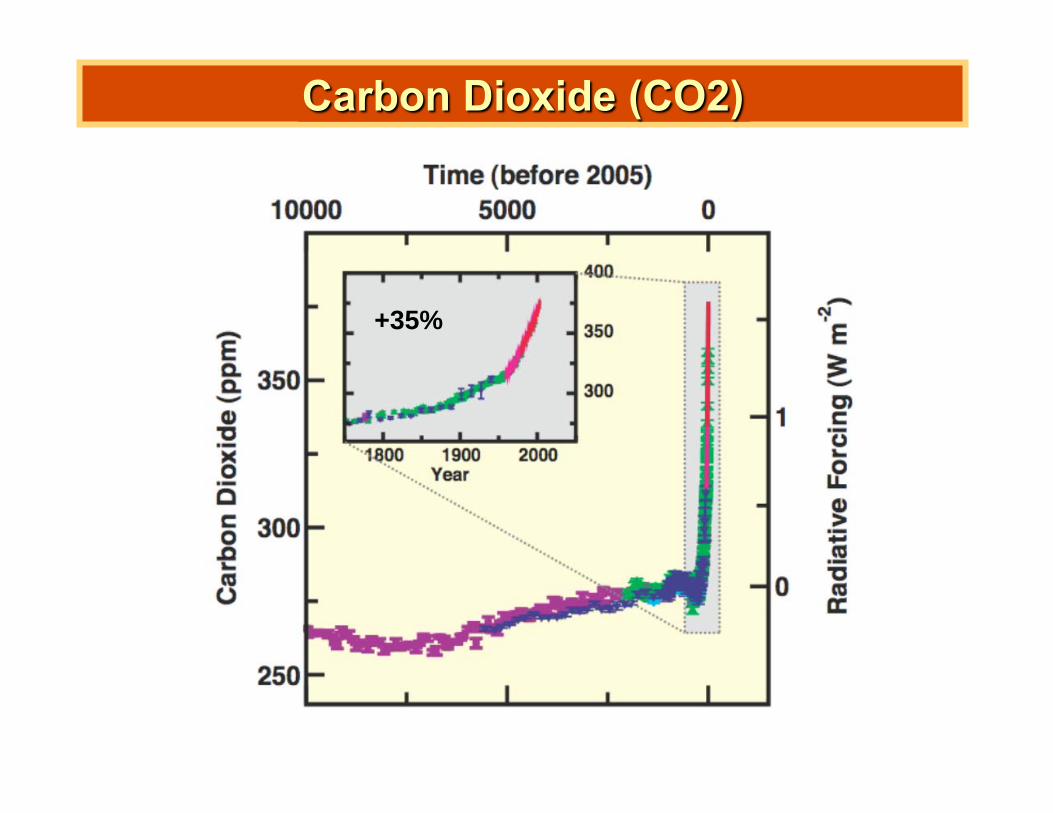
+35%
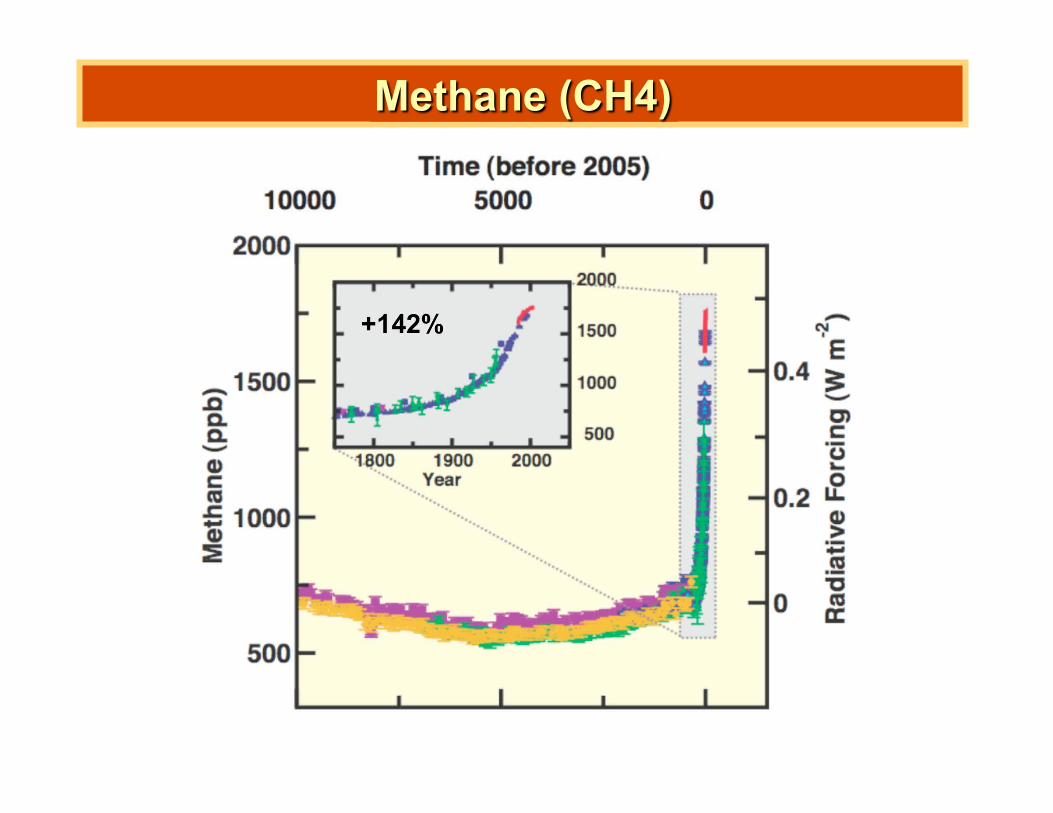
+142%

+18%

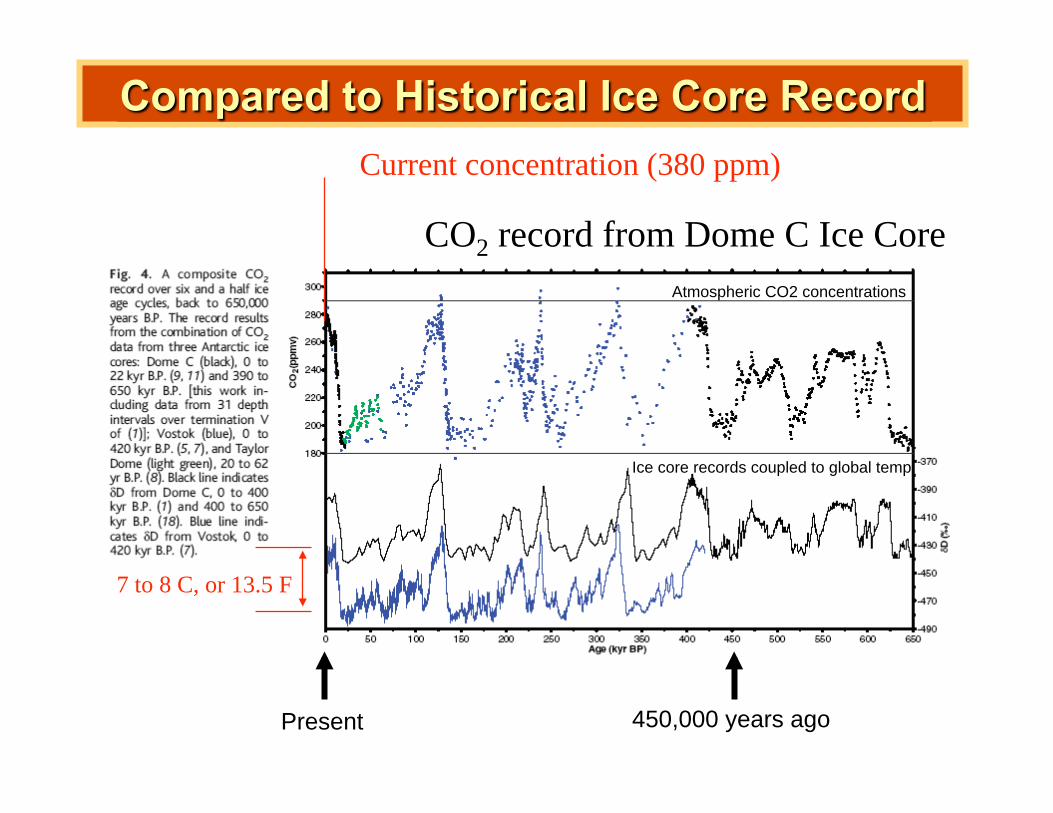
CO2 record from Dome C Ice Core
7 to 8 C, or 13.5 F
Present 450,000 years ago
Atmospheric CO2 concentrations
Ice core records coupled to global temp
CO2 record from Dome C Ice Core
7 to 8 C, or 13.5 F
Current concentration (380 ppm)
Present 450,000 years ago
Atmospheric CO2 concentrations
Ice core records coupled to global temp

• Human sources:
– Fossil fuel burning (oil, coal, natural gas) (CO2, CH4, N2O)
– Deforestation and land use change (CO2)
– Agricultural practices (CO2, CH4, N2O)
– Energy extraction (CO2, CH4)
– Ruminant (e.g., cows) (CH4)
– Cement production (CO2)
– Landfills (CH4)
• Natural sources
– Wetlands (CH4)
– Oceans, soils (CO2, N2O)
– Decomposition of organic matter (CO2, CH4)


www.globalwarmingart.com
Emissions principally from US, Canada, with
other regions becoming more important

Outline1. Basic science of global warming
2. Recent climate change
3. Future predictions
4. Impacts in Pacific Northwest
K. Wattenmaker, firepix.blm.gov www.usbr.gov

• Carbon dioxide (CO2) and other greenhouse gases warm the
planet.
• Human activities have increased the concentration of the major
greenhouse gases since 1750.
• Average global temperature has increased 1.3°F since 1906.
Warming since the 1950s very likely (>90% chance) due to human
increases in GHG.
• Evidence of change is increasingly evident throughout the Earth’s
systems
• Without drastic changes in current emissions trends, greenhouse
gas concentrations will increase dramatically over the next century
and beyond.
Source: The Intergovernmental Panel on Climate Change (IPCC), www.ipcc.ch

Change in temperature over last 150 years

Source: IPCC 2001
Change in temperature over last 1000 years
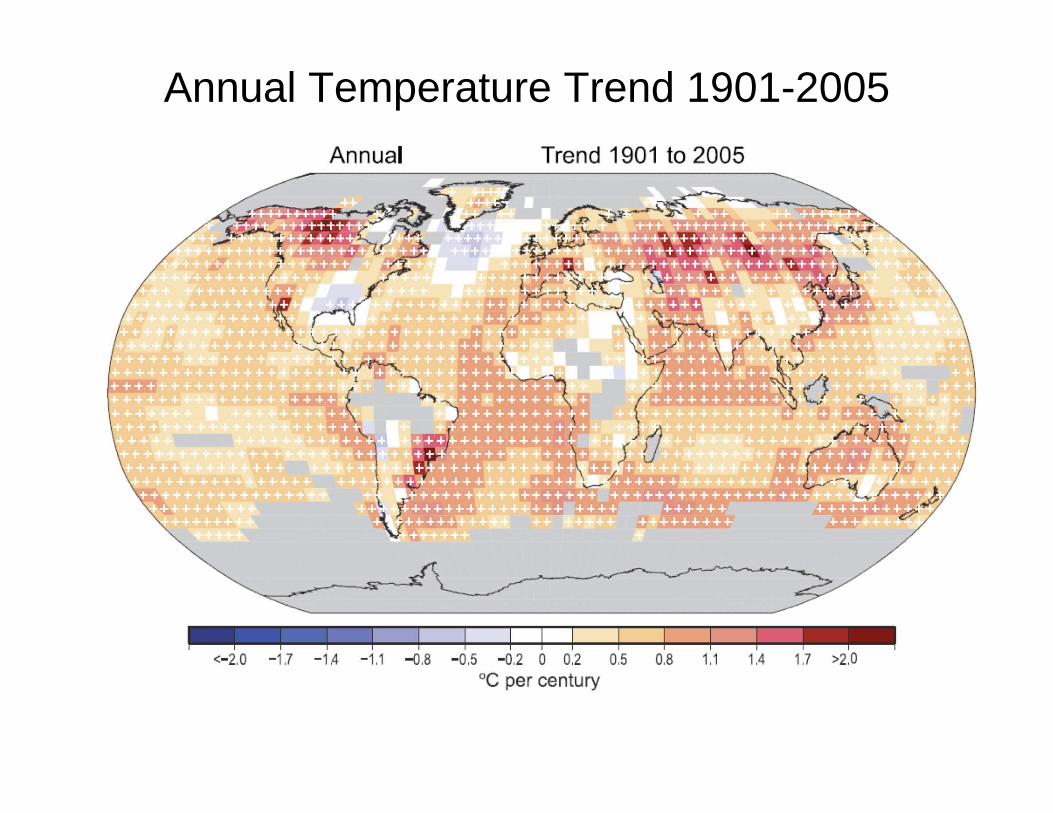
Annual Temperature Trend 1901-2005

IPCC Working Group I Summary for Policy Makers, 2007
Line: Observations
Band: Models w
/natural forcing
Band: Models w
/natural forcings, human forcings
Models require both natural and anthropogenic forcings to simulate observations

Average annual
temperature increased
+1.5°F in the PNW
during the 20th century
• Almost every station
shows warming
• Extreme cold
conditions have
become rarer
• Low temperatures
rose faster than high
temperatures
Annual variability
present throughout
the warming trend
3.6 °F
2.7 °F
1.8 °F
0.9 °F
Cooler Warmer
Mote 2003(a)
• Carbon dioxide (CO2) and other greenhouse gases warm the
planet.
• Human activities have increased the concentration of the major
greenhouse gases since 1750.
• Average global temperature has increased 1.3°F since 1906.
Warming since the 1950s very likely (>90% chance) due to human
increases in GHG.
• Evidence of change is increasingly evident throughout the Earth’s
systems
• Without drastic changes in current emissions trends, greenhouse
gas concentrations will increase dramatically over the next century
and beyond.
Source: The Intergovernmental Panel on Climate Change (IPCC), www.ipcc.ch


North pole – Summer sea ice extent in 1979 and 2000
Sea ice e
xte
nt
(mill
ion s
q m
iles)
Source: NASA
Source: NASA In 2007 a record low


The frequency of coral bleaching is increasing,
particularly during El Niño events

Outline1. Basic science of global warming
2. Recent climate change
3. Future predictions
4. Impacts in Pacific Northwest
K. Wattenmaker, firepix.blm.gov www.usbr.gov
• Carbon dioxide (CO2) and other greenhouse gases warm the
planet.
• Human activities have increased the concentration of the major
greenhouse gases since 1750.
• Average global temperature has increased 1.3°F since 1906.
Warming since the 1950s very likely (>90% chance) due to human
increases in GHG.
• Evidence of change is increasingly evident throughout the Earth’s
systems
• Without drastic changes in current emissions trends, greenhouse
gas concentrations will increase dramatically over the next century
and beyond.
Source: The Intergovernmental Panel on Climate Change (IPCC), www.ipcc.ch

IPCC Emission scenarios based on economical and
technological assumptions about global society

Green Scenario (550 ppm)

Green Scenario (550 ppm)
Business-as-usual Scenario (750 ppm)

Green Scenario (550 ppm)
Business-as-usual Scenario (750 ppm)
A1Fl “Aggressive” Scenario (900 ppm)

“Business as usual” scenario; one model (HadCM3)

+1.9ºF
(1.1ºC)
+2.9ºF
(1.6ºC)
Projected rate of warming: ~ 0.5ºF average
(0.2-1.0°F) per decade through at least 2050
(compared to 0.15°F/decade over 20th century)
Warming is expected across all seasons with
the largest temperature increases likely in
summer (June-August)
More detail on the CIG scenarios is available at: http://www.cses.washington.edu/cig/fpt/ccscenarios.shtml

• “Downscaled”
temperature data
for a low-to-medium
climate change
scenario.

Outline1. Basic science of global warming
2. Recent climate change
3. Future predictions
4. Impacts in Pacific Northwest
K. Wattenmaker, firepix.blm.gov www.usbr.gov

IPCC 2007 report Examples of some projected regional impacts of
North America • Decreased snowpack, more winter flooding and reduced summer flows,
and competition for water resources.
• Moderate climate change is projected to increase yields of rain-fed
agriculture by 5 to 20%, but with variability among regions.
• Major challenges are projected for crops that are near the warm end of their suitable range or which depend on highly utilized water resources.
Columbia basin in WA

Glacier retreat in Rocky Mountains and North Cascades

• Similar trends seen
throughout the western
United States - 73% of
stations show a decline
in April 1 snow water
equivalent
Decrease Increase
The image cannot be displayed. Your computer may not have enou
Decrease Increase
• Most PNW stations show a decline in snow water
equivalent
• Numerous sites in the
Cascades with 30% to
60% declines

Spring snowpack is projected
to decline as more winter
precipitation falls as rain
rather than snow, especially
in warmer mid-elevation
basins
Snowpack will melt earlier
with warmer spring
temperatures
+4°F, +4.5%
winter precip
April 1
Snowpack

• Advances of 10-30 days
between 1948-2000
• Greatest trends in PNW,
Canada, and AK
• >30% of trends are
statistically significant at the
90% level, especially in the
PNW
Stewart, I., Cayan, D.R., and Dettinger, M.D., 2004, Changes in snowmelt runoff timing in western North America under a "Business as Usual" climate change scenario: Climatic Change 62, 217-232.
+ 20 days later
- 20 days earlier
Peak of spring runoff is
moving earlier into the spring
throughout western US and
Canada

Wildfires accelerate 1970 – 2003
with early snowmelt, longer, drier summers
Westerling et al Science 2006, Running, Science 2006

October 2004, Sylvan Pass, Yellowstone NP
© Parks Canada/Ross MacDonald/KNP/2004 Photo by Craig Allen - USGS
Tree mortality resulting from insect outbreaks
Southwestern US British Columbia

Conclusions
1. There is an increase in global temperatures due to human-caused increases in green house gasses
2. In the last century the average global temperature has risen with 1.3°F
3. Future predictions for the PNW say that temperature will increase around 5°F in the PNW by 2100
4. The impacts of the temperature increase in the PNW will affect agricultural and natural systems.
K. Wattenmaker, firepix.blm.gov www.usbr.gov
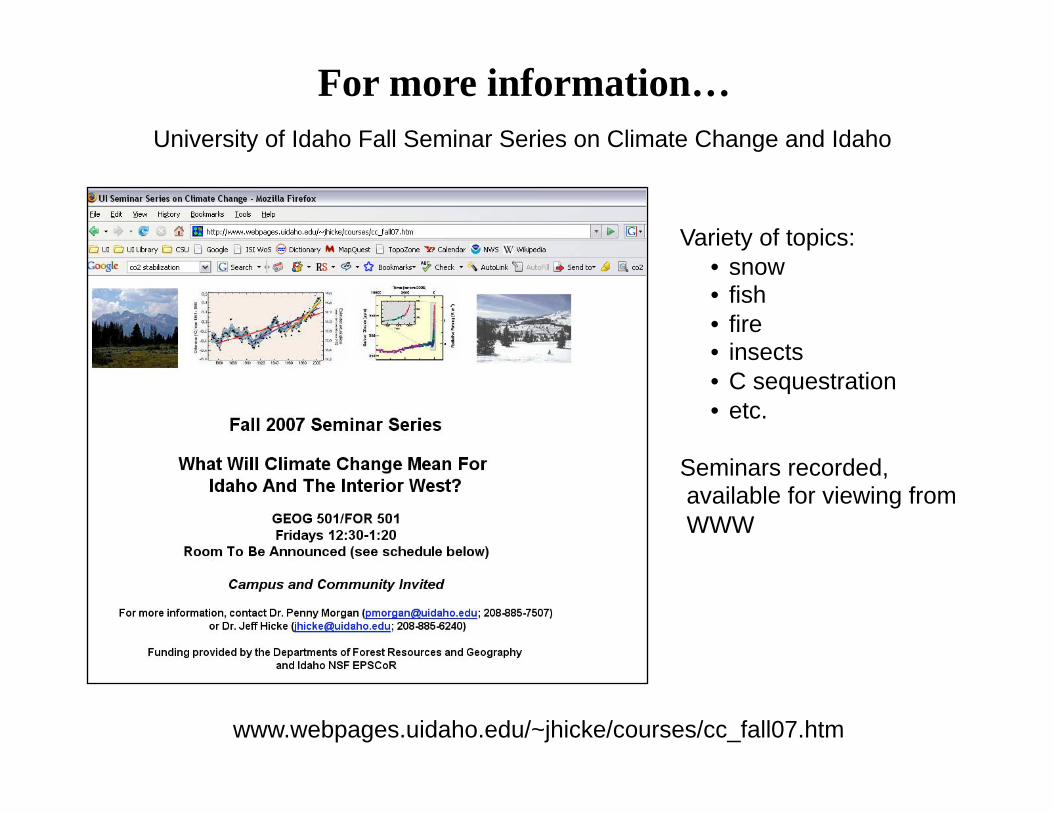
University of Idaho Fall Seminar Series on Climate Change and Idaho
For more information…
Variety of topics:
• snow • fish
• fire • insects
• C sequestration
• etc.
Seminars recorded, available for viewing from
WWW
www.webpages.uidaho.edu/~jhicke/courses/cc_fall07.htm

More information on PNW climate impacts and planning
for climate change is available from
The Climate Impacts Group
www.cses.washington.ed/cig
Lara Whitely Binder
Information on Idaho climate change is available at
http://groups.google.com/group/idahoclimatechange
Or contact Dr. Jeffrey A. Hicke ([email protected]),
Dr. Von P. Walden ([email protected]),
or Dr. Karen Humes ([email protected])
For more information…