Embed Size (px)
Citation preview
climateextremes
Explaining
Also: Lake Baikal, Pearl mussels, Valuing nature
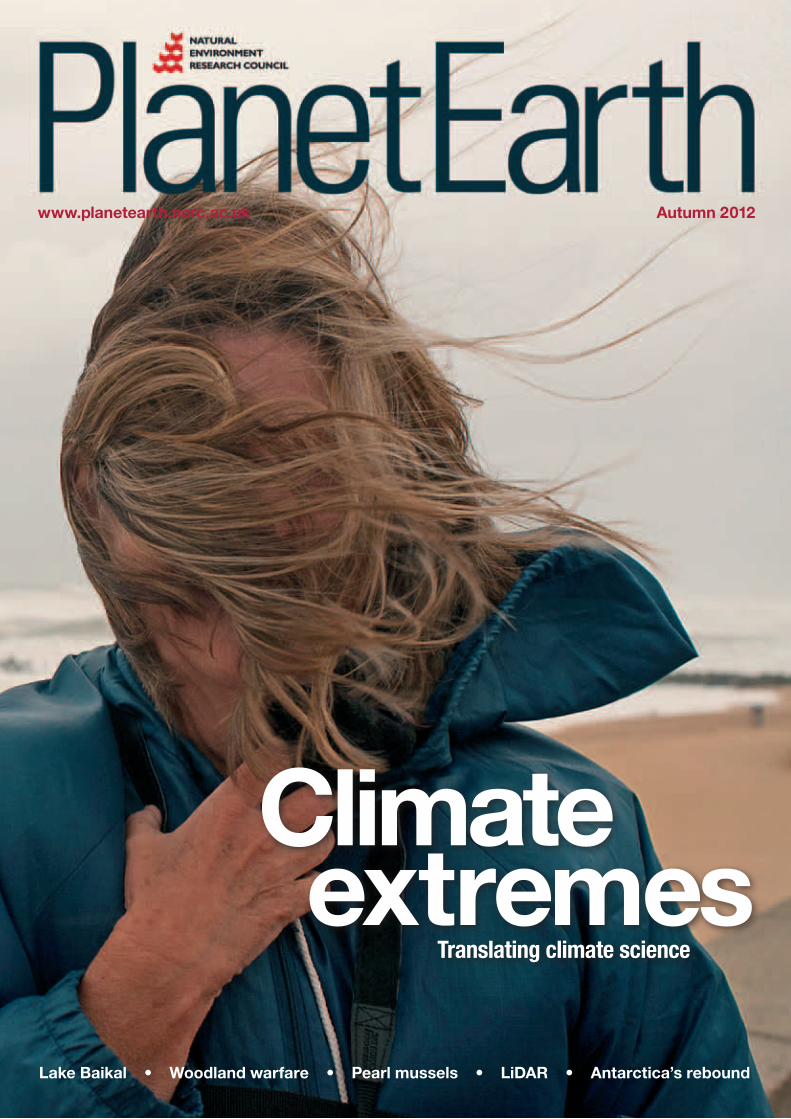
www.planetearth.nerc.ac.uk Autumn 2012
Climate extremes
Lake Baikal • Woodland warfare • Pearl mussels • LiDAR • Antarctica’s rebound
Translating climate science
Editors Adele Rackley, 01793 411604 [email protected] Marshall, 01793 442593 [email protected]
Science writerTamera Jones, 01793 411561 [email protected]
Design and productionCandy Sorrell, 01793 411518 [email protected]
ISSN: 1479-2605
Planet Earth is NERC’s quarterly magazine, aimed at anyone interested in environmental science. It covers all aspects of NERC-funded work and most of the features are written by the researchers themselves.
Front cover: Peter Skinner/Science Photo Library
About usThe Natural Environment Research Council (NERC) is the UK’s main agency for funding research, training and knowledge exchange in environmental science. Our work tackles some of the most urgent and fascinating environmental issues we face, including climate change, natural hazards and sustainability.
NERC research covers the globe, from the deepest ocean trenches to the outer atmosphere, and our scientists work on everything from plankton to glaciers, volcanoes and air pollution – often alongside other UK and international researchers, policy-makers and businesses.
NERC is a non-departmental public body. Much of our funding comes from the Department for Business, Innovation and Skills but we work independently of government. Our projects range from ‘blue-skies’ research to long-term, multi-million-pound strategic programmes, coordinated by universities and our own research centres:
British Antarctic SurveyBritish Geological SurveyCentre for Ecology & HydrologyNational Oceanography CentreNational Centre for Atmospheric ScienceNational Centre for Earth Observation
For the latest environmental science news, features, blogs and the fortnightly Planet Earth Podcast, visit our website Planet Earth Online at www.planetearth.nerc.ac.uk.
Not all of the work described in Planet Earth has been peer-reviewed. The views expressed are those of individual authors and not necessarily shared by NERC. We welcome readers’ feedback on any aspect of the magazine or website and are happy to hear from NERC-funded scientists who want to write for Planet Earth. Please bear in mind that we rarely accept unsolicited articles, so contact the editors first to discuss your ideas.
Contact usFor NERC-funded researchers contact:[email protected] give us your feedback email: [email protected] or write to us at Planet Earth Editors, NERC, Polaris House, North Star Avenue, Swindon SN2 1EU.
8 Lake Baikal – in deep water? A unique ecosystem under threat. 10 Woodland warfare in a warming world Could woodlice help control climate change?
13 Adjusting the atomic clock Correcting a flaw in a vital method for dating Earth’s past.
14 On the up How scientists are tracking Antarctica’s slow rebound – and why.
16 A breath of fresh air Environmental science in A+E.
18 Climate of change? Global warming or natural fluctuations – how to tell the difference.
20 The plight of the pearl mussel What’s killing our mussels, and why should we care?
22 Valuing nature What if the services we get from nature had to be paid for?
23 Prehistoric mummy puzzle One mummy, three people – an archaeological enigma.
24 Down to Earth How LiDAR is transforming environmental science.
26 Explaining climate extremes Making climate science accessible for all.
28 (Don’t) Blame it on Rio Getting science into policy.
In this issueAutumn 2012
Features
20
14
08
23
WWW.PLANETEARTH.NERC.AC.UK
News
2 PLANET EARTH Autumn 2012
We’ve tried to pack Autumn’s Planet Earth with enough variety to plug at least some of the gap left by this
summer’s sporting excitement.This edition’s gold-medal winner is Lake Baikal, the
oldest lake on the planet and the deepest. Described as the ‘Galapagos of Russia’, it is home to thousands of creatures that live nowhere else on Earth. From Baikal’s unique species we turn to perhaps one of UK’s least noticed, our freshwater mussels. These unassuming creatures can live to 120 and they have plenty to tell us about the health of our rivers.
Heading south, we discover what’s happening to the landmass of Antarctica as it slowly shrugs a vast glacial backpack off its shoulders. Small things can have a big effect too, of course, but you might be surprised to learn that woodlice and fungi in soils can influence the effects of climate change.
Elsewhere we learn how scientists are using models to work out if temperature change is down to global warming or might have happened anyway, while others are making the modellers’ language of graphs, trends and uncertainty accessible to policy-makers and others who need science to help people around the world cope with environmental change.
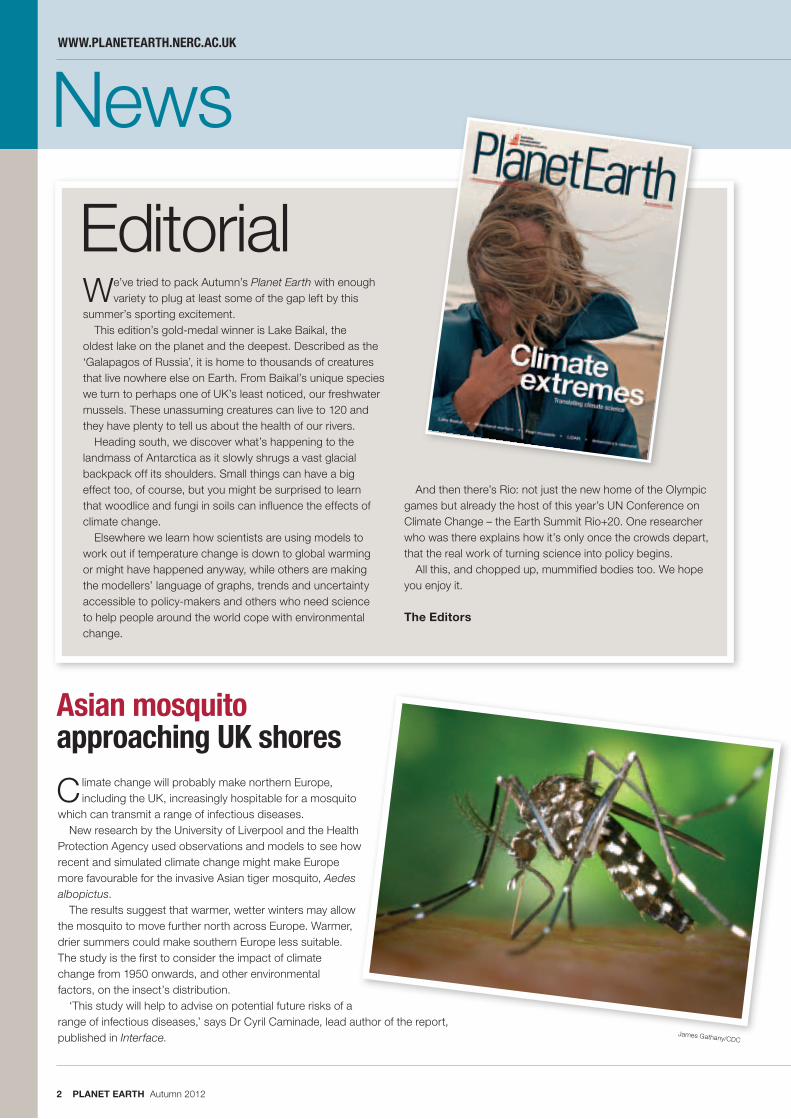
Climate change will probably make northern Europe, including the UK, increasingly hospitable for a mosquito
which can transmit a range of infectious diseases.New research by the University of Liverpool and the Health
Protection Agency used observations and models to see how recent and simulated climate change might make Europe more favourable for the invasive Asian tiger mosquito, Aedes albopictus.
The results suggest that warmer, wetter winters may allow the mosquito to move further north across Europe. Warmer, drier summers could make southern Europe less suitable. The study is the first to consider the impact of climate change from 1950 onwards, and other environmental factors, on the insect’s distribution.
‘This study will help to advise on potential future risks of a range of infectious diseases,’ says Dr Cyril Caminade, lead author of the report, published in Interface.
Asian mosquito approaching UK shores
James Gathany/CDC
Editorial
And then there’s Rio: not just the new home of the Olympic games but already the host of this year’s UN Conference on Climate Change – the Earth Summit Rio+20. One researcher who was there explains how it’s only once the crowds depart, that the real work of turning science into policy begins.
All this, and chopped up, mummified bodies too. We hope you enjoy it.
The Editors
Daily updated news @ www.planetearth.nerc.ac.uk
PLANET EARTH Autumn 2012 3
A new method of reconstructing past climates using water locked inside
crystals in seabed sediment has shed light on the history of the Antarctic. The first results suggest that recent climate fluctuations for which there’s never been much evidence outside the northern hemisphere may have affected more of the globe.
This implies the climatic anomalies known as the Medieval Warm Period and Little Ice Age stretched as far south as the Antarctic Peninsula. If so, views of how the global climate has changed in recent centuries may need revision.
Did the Medieval Warm Period make it to Antarctica?
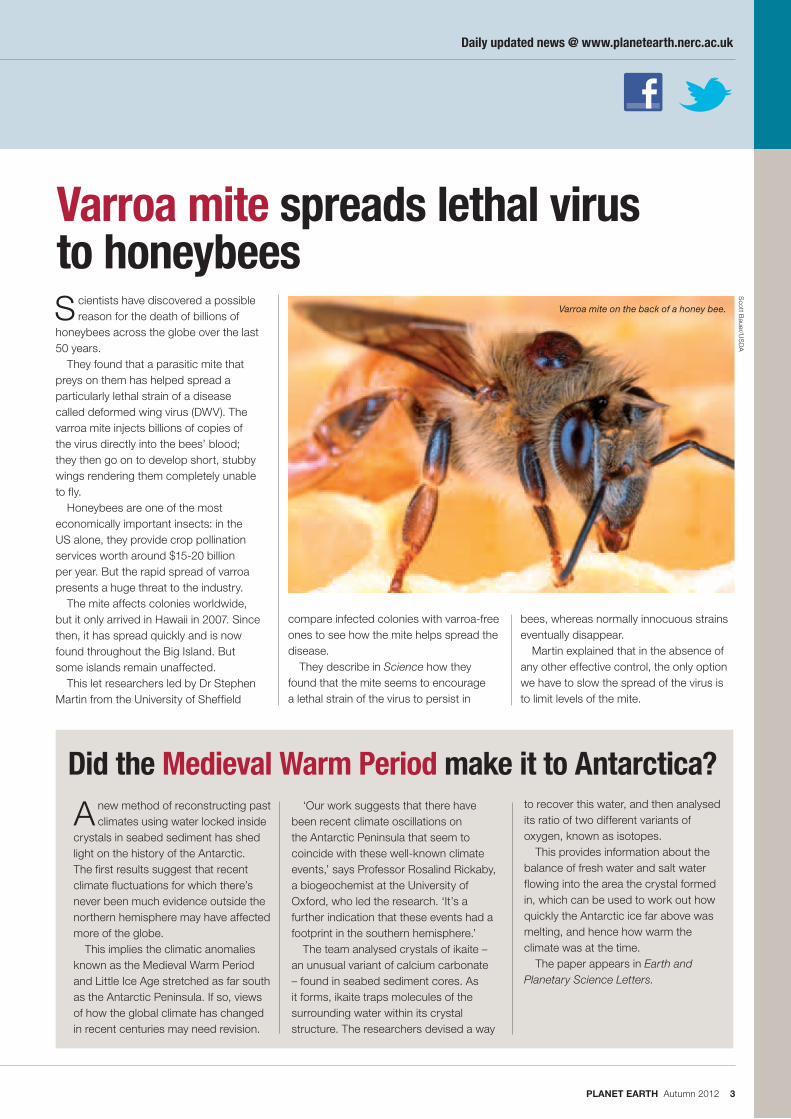
Scientists have discovered a possible reason for the death of billions of
honeybees across the globe over the last 50 years.
They found that a parasitic mite that preys on them has helped spread a particularly lethal strain of a disease called deformed wing virus (DWV). The varroa mite injects billions of copies of the virus directly into the bees’ blood; they then go on to develop short, stubby wings rendering them completely unable to fly.
Honeybees are one of the most economically important insects: in the US alone, they provide crop pollination services worth around $15-20 billion per year. But the rapid spread of varroa presents a huge threat to the industry.
The mite affects colonies worldwide, but it only arrived in Hawaii in 2007. Since then, it has spread quickly and is now found throughout the Big Island. But some islands remain unaffected.
This let researchers led by Dr Stephen Martin from the University of Sheffield
Varroa mite spreads lethal virus to honeybees
‘Our work suggests that there have been recent climate oscillations on the Antarctic Peninsula that seem to coincide with these well-known climate events,’ says Professor Rosalind Rickaby, a biogeochemist at the University of Oxford, who led the research. ‘It’s a further indication that these events had a footprint in the southern hemisphere.’
The team analysed crystals of ikaite – an unusual variant of calcium carbonate – found in seabed sediment cores. As it forms, ikaite traps molecules of the surrounding water within its crystal structure. The researchers devised a way
bees, whereas normally innocuous strains eventually disappear.
Martin explained that in the absence of any other effective control, the only option we have to slow the spread of the virus is to limit levels of the mite.
Scott B
auer/US
DA
compare infected colonies with varroa-free ones to see how the mite helps spread the disease.
They describe in Science how they found that the mite seems to encourage a lethal strain of the virus to persist in
Varroa mite on the back of a honey bee.
to recover this water, and then analysed its ratio of two different variants of oxygen, known as isotopes.
This provides information about the balance of fresh water and salt water flowing into the area the crystal formed in, which can be used to work out how quickly the Antarctic ice far above was melting, and hence how warm the climate was at the time.
The paper appears in Earth and Planetary Science Letters.
WWW.PLANETEARTH.NERC.AC.UK
News
4 PLANET EARTH Autumn 2012
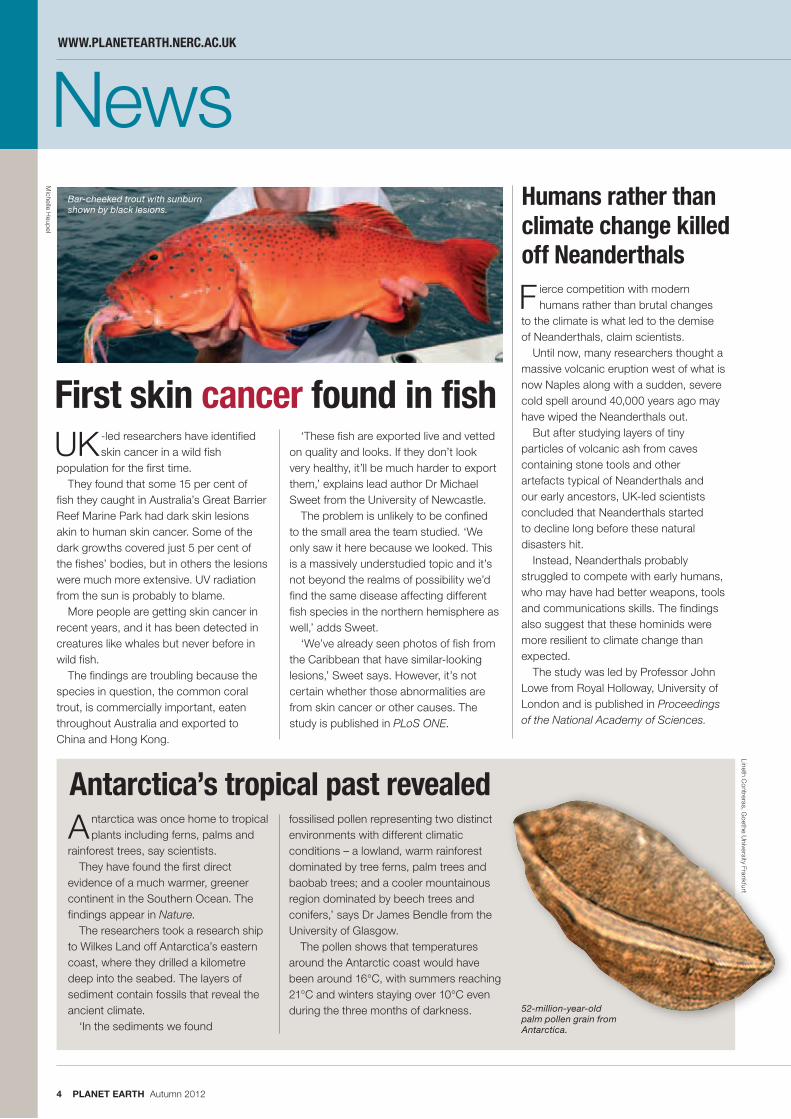
UK-led researchers have identified skin cancer in a wild fish
population for the first time.They found that some 15 per cent of
fish they caught in Australia’s Great Barrier Reef Marine Park had dark skin lesions akin to human skin cancer. Some of the dark growths covered just 5 per cent of the fishes’ bodies, but in others the lesions were much more extensive. UV radiation from the sun is probably to blame.
More people are getting skin cancer in recent years, and it has been detected in creatures like whales but never before in wild fish.
The findings are troubling because the species in question, the common coral trout, is commercially important, eaten throughout Australia and exported to China and Hong Kong.
First skin cancer found in fish‘These fish are exported live and vetted
on quality and looks. If they don’t look very healthy, it’ll be much harder to export them,’ explains lead author Dr Michael Sweet from the University of Newcastle.
The problem is unlikely to be confined to the small area the team studied. ‘We only saw it here because we looked. This is a massively understudied topic and it’s not beyond the realms of possibility we’d find the same disease affecting different fish species in the northern hemisphere as well,’ adds Sweet.
‘We’ve already seen photos of fish from the Caribbean that have similar-looking lesions,’ Sweet says. However, it’s not certain whether those abnormalities are from skin cancer or other causes. The study is published in PLoS ONE.
Bar-cheeked trout with sunburn shown by black lesions.
Michelle H
eupel
Antarctica was once home to tropical plants including ferns, palms and
rainforest trees, say scientists.They have found the first direct
evidence of a much warmer, greener continent in the Southern Ocean. The findings appear in Nature.
The researchers took a research ship to Wilkes Land off Antarctica’s eastern coast, where they drilled a kilometre deep into the seabed. The layers of sediment contain fossils that reveal the ancient climate.
‘In the sediments we found
Antarctica’s tropical past revealedfossilised pollen representing two distinct environments with different climatic conditions – a lowland, warm rainforest dominated by tree ferns, palm trees and baobab trees; and a cooler mountainous region dominated by beech trees and conifers,’ says Dr James Bendle from the University of Glasgow.
The pollen shows that temperatures around the Antarctic coast would have been around 16°C, with summers reaching 21°C and winters staying over 10°C even during the three months of darkness. 52-million-year-old
palm pollen grain from Antarctica.
Lineth Contreras, G
oethe University Frankfurt
F ierce competition with modern humans rather than brutal changes
to the climate is what led to the demise of Neanderthals, claim scientists.
Until now, many researchers thought a massive volcanic eruption west of what is now Naples along with a sudden, severe cold spell around 40,000 years ago may have wiped the Neanderthals out.
But after studying layers of tiny particles of volcanic ash from caves containing stone tools and other artefacts typical of Neanderthals and our early ancestors, UK-led scientists concluded that Neanderthals started to decline long before these natural disasters hit.
Instead, Neanderthals probably struggled to compete with early humans, who may have had better weapons, tools and communications skills. The findings also suggest that these hominids were more resilient to climate change than expected.
The study was led by Professor John Lowe from Royal Holloway, University of London and is published in Proceedings of the National Academy of Sciences.
Humans rather than climate change killed off Neanderthals
Daily updated news @ www.planetearth.nerc.ac.uk
PLANET EARTH Autumn 2012 5
in brief . . . Heating must be easily turn-off-and-on-ableA recent project by UKERC researchers at Cardiff University identified our reliance on gas heating as a major obstacle to efforts to move the UK towards a low-carbon economy.
The researchers surveyed people’s views of the energy system, finding that gas central heating is seen as the best kind due to its controllability and responsiveness. To redesign the energy system, it’s vital to take such views into account, perhaps engaging with people to change their expectations. As things stand, the researchers suggest, they’ll be reluctant to switch unless they’re offered an alternative that they see as controllable, efficient and good value.
How’s carbon stored in the Southern Ocean?A team of British and Australian scientists, including researchers from the British Antarctic Survey, has discovered how carbon is drawn down from the Southern Ocean’s surface to the deep waters beneath. The area is a vital carbon sink; the oceans absorb much of the CO2 emitted globally, and the Southern Ocean accounts for around 40 per cent of that.
The researchers found that the carbon isn’t drawn down evenly across large areas, instead being sucked down and locked away by plunging downward currents a thousand kilometres across, which create regional pathways for carbon storage.
New director for CEHProfessor Mark Bailey has been appointed director of NERC’s Centre for Ecology & Hydrology. A microbial ecologist who’s been closely involved with numerous major projects to survey and monitor the diversity of micro-organisms in the UK, he became director of CEH’s biodiversity programme in 2003, and was appointed CEH’s deputy director last year. Professor Bailey succeeds Professor Pat Nuttall, who takes up a new role in NERC’s senior management team in Swindon.
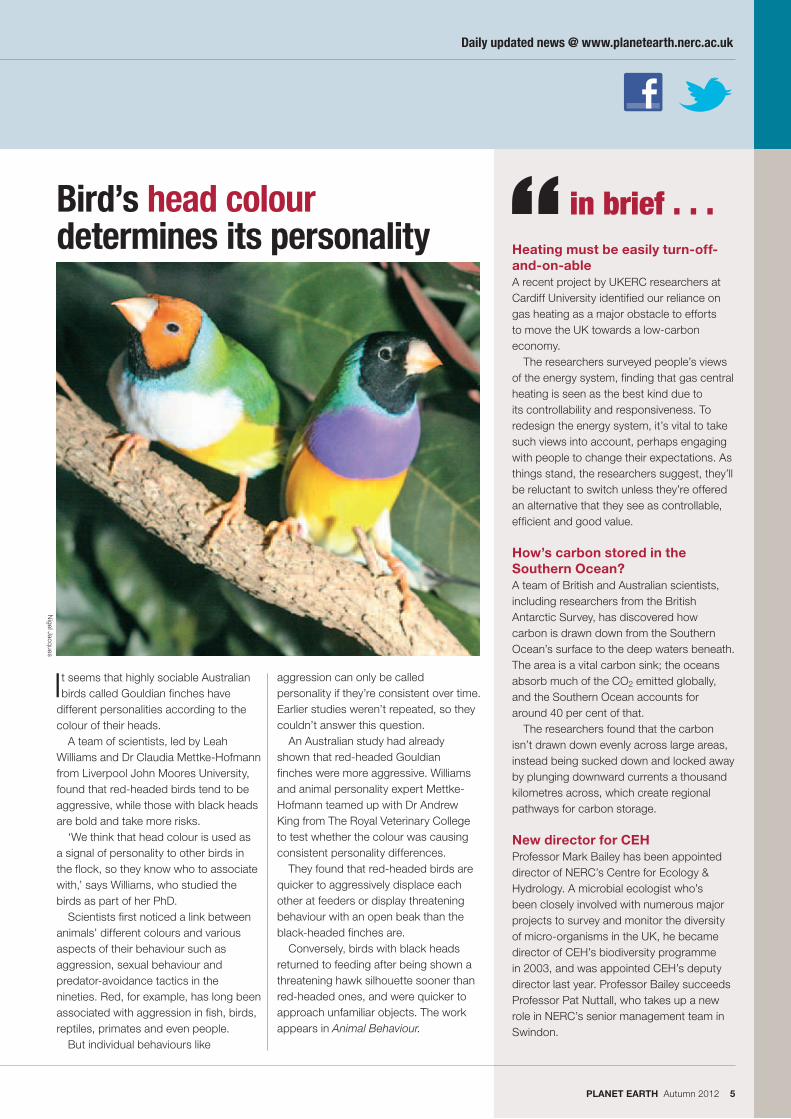
It seems that highly sociable Australian birds called Gouldian finches have
different personalities according to the colour of their heads.
A team of scientists, led by Leah Williams and Dr Claudia Mettke-Hofmann from Liverpool John Moores University, found that red-headed birds tend to be aggressive, while those with black heads are bold and take more risks.
‘We think that head colour is used as a signal of personality to other birds in the flock, so they know who to associate with,’ says Williams, who studied the birds as part of her PhD.
Scientists first noticed a link between animals’ different colours and various aspects of their behaviour such as aggression, sexual behaviour and predator-avoidance tactics in the nineties. Red, for example, has long been associated with aggression in fish, birds, reptiles, primates and even people.
But individual behaviours like
aggression can only be called personality if they’re consistent over time. Earlier studies weren’t repeated, so they couldn’t answer this question.
An Australian study had already shown that red-headed Gouldian finches were more aggressive. Williams and animal personality expert Mettke-Hofmann teamed up with Dr Andrew King from The Royal Veterinary College to test whether the colour was causing consistent personality differences.
They found that red-headed birds are quicker to aggressively displace each other at feeders or display threatening behaviour with an open beak than the black-headed finches are.
Conversely, birds with black heads returned to feeding after being shown a threatening hawk silhouette sooner than red-headed ones, and were quicker to approach unfamiliar objects. The work appears in Animal Behaviour.
Bird’s head colour determines its personality
Nigel Jacq
ues
WWW.PLANETEARTH.NERC.AC.UK
News
6 PLANET EARTH Autumn 2012
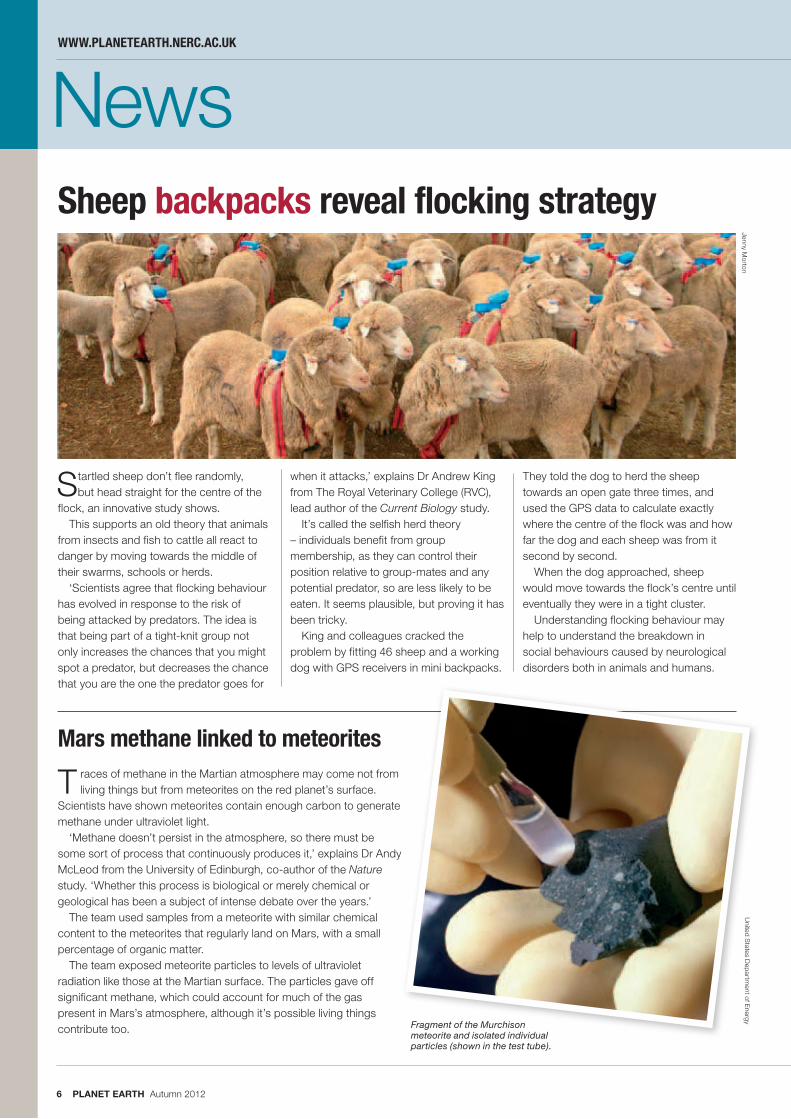
Startled sheep don’t flee randomly, but head straight for the centre of the
flock, an innovative study shows.This supports an old theory that animals
from insects and fish to cattle all react to danger by moving towards the middle of their swarms, schools or herds.
‘Scientists agree that flocking behaviour has evolved in response to the risk of being attacked by predators. The idea is that being part of a tight-knit group not only increases the chances that you might spot a predator, but decreases the chance that you are the one the predator goes for
when it attacks,’ explains Dr Andrew King from The Royal Veterinary College (RVC), lead author of the Current Biology study.
It’s called the selfish herd theory – individuals benefit from group membership, as they can control their position relative to group-mates and any potential predator, so are less likely to be eaten. It seems plausible, but proving it has been tricky.
King and colleagues cracked the problem by fitting 46 sheep and a working dog with GPS receivers in mini backpacks.
They told the dog to herd the sheep towards an open gate three times, and used the GPS data to calculate exactly where the centre of the flock was and how far the dog and each sheep was from it second by second.
When the dog approached, sheep would move towards the flock’s centre until eventually they were in a tight cluster.
Understanding flocking behaviour may help to understand the breakdown in social behaviours caused by neurological disorders both in animals and humans.
Jenny Morton
Mars methane linked to meteorites
T races of methane in the Martian atmosphere may come not from living things but from meteorites on the red planet’s surface.
Scientists have shown meteorites contain enough carbon to generate methane under ultraviolet light.
‘Methane doesn’t persist in the atmosphere, so there must be some sort of process that continuously produces it,’ explains Dr Andy McLeod from the University of Edinburgh, co-author of the Nature study. ‘Whether this process is biological or merely chemical or geological has been a subject of intense debate over the years.’
The team used samples from a meteorite with similar chemical content to the meteorites that regularly land on Mars, with a small percentage of organic matter.
The team exposed meteorite particles to levels of ultraviolet radiation like those at the Martian surface. The particles gave off significant methane, which could account for much of the gas present in Mars’s atmosphere, although it’s possible living things contribute too.
Sheep backpacks reveal flocking strategy
United S
tates Dep
artment of E
nergy
Fragment of the Murchison meteorite and isolated individual particles (shown in the test tube).
Daily updated news @ www.planetearth.nerc.ac.uk
PLANET EARTH Autumn 2012 7
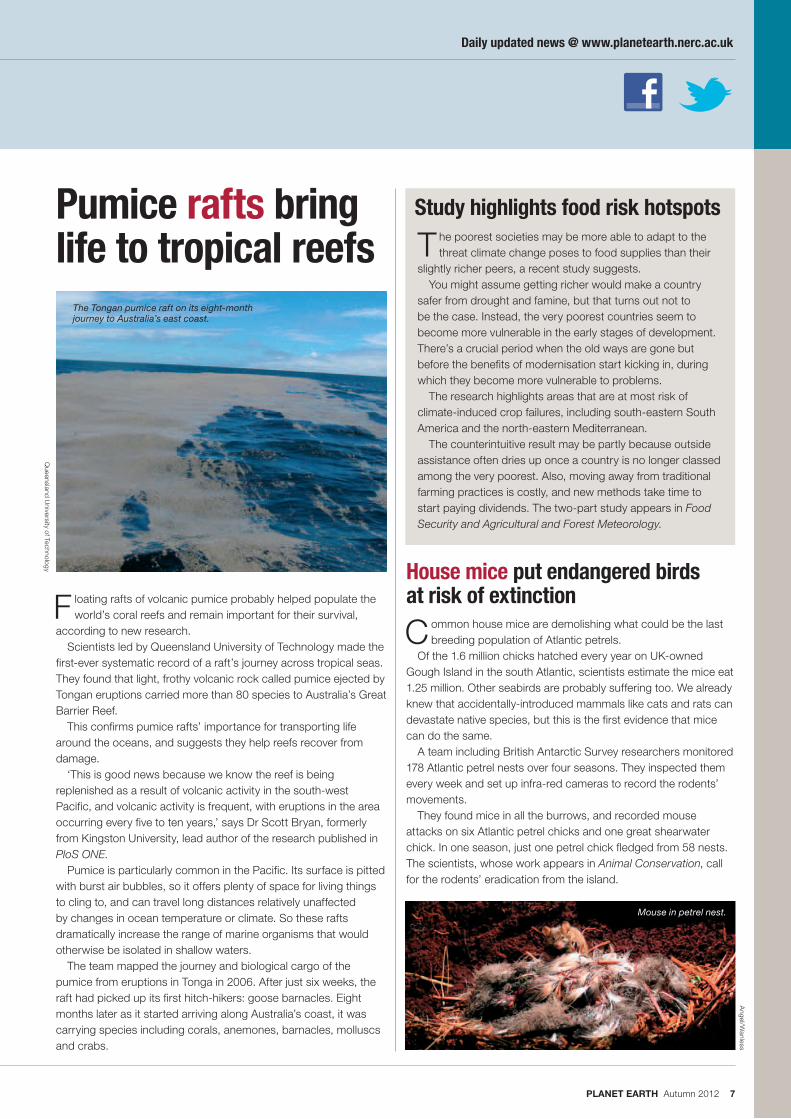
Pumice rafts bring life to tropical reefs
F loating rafts of volcanic pumice probably helped populate the world’s coral reefs and remain important for their survival,
according to new research.Scientists led by Queensland University of Technology made the
first-ever systematic record of a raft’s journey across tropical seas. They found that light, frothy volcanic rock called pumice ejected by Tongan eruptions carried more than 80 species to Australia’s Great Barrier Reef.
This confirms pumice rafts’ importance for transporting life around the oceans, and suggests they help reefs recover from damage.
‘This is good news because we know the reef is being replenished as a result of volcanic activity in the south-west Pacific, and volcanic activity is frequent, with eruptions in the area occurring every five to ten years,’ says Dr Scott Bryan, formerly from Kingston University, lead author of the research published in PloS ONE.
Pumice is particularly common in the Pacific. Its surface is pitted with burst air bubbles, so it offers plenty of space for living things to cling to, and can travel long distances relatively unaffected by changes in ocean temperature or climate. So these rafts dramatically increase the range of marine organisms that would otherwise be isolated in shallow waters.
The team mapped the journey and biological cargo of the pumice from eruptions in Tonga in 2006. After just six weeks, the raft had picked up its first hitch-hikers: goose barnacles. Eight months later as it started arriving along Australia’s coast, it was carrying species including corals, anemones, barnacles, molluscs and crabs.
T he poorest societies may be more able to adapt to the threat climate change poses to food supplies than their
slightly richer peers, a recent study suggests.You might assume getting richer would make a country
safer from drought and famine, but that turns out not to be the case. Instead, the very poorest countries seem to become more vulnerable in the early stages of development. There’s a crucial period when the old ways are gone but before the benefits of modernisation start kicking in, during which they become more vulnerable to problems.
The research highlights areas that are at most risk of climate-induced crop failures, including south-eastern South America and the north-eastern Mediterranean.
The counterintuitive result may be partly because outside assistance often dries up once a country is no longer classed among the very poorest. Also, moving away from traditional farming practices is costly, and new methods take time to start paying dividends. The two-part study appears in Food Security and Agricultural and Forest Meteorology.
Common house mice are demolishing what could be the last breeding population of Atlantic petrels.
Of the 1.6 million chicks hatched every year on UK-owned Gough Island in the south Atlantic, scientists estimate the mice eat 1.25 million. Other seabirds are probably suffering too. We already knew that accidentally-introduced mammals like cats and rats can devastate native species, but this is the first evidence that mice can do the same.
A team including British Antarctic Survey researchers monitored 178 Atlantic petrel nests over four seasons. They inspected them every week and set up infra-red cameras to record the rodents’ movements.
They found mice in all the burrows, and recorded mouse attacks on six Atlantic petrel chicks and one great shearwater chick. In one season, just one petrel chick fledged from 58 nests. The scientists, whose work appears in Animal Conservation, call for the rodents’ eradication from the island.
Study highlights food risk hotspots
House mice put endangered birds at risk of extinction
Mouse in petrel nest.
The Tongan pumice raft on its eight-month journey to Australia’s east coast.
Queensland U
niversity of Technology
Angel/W
anless
8 PLANET EARTH Autumn 20128 PLANET EARTH Autumn 2012
Lake Baikal – in deep water?
The unique life that’s evolved over millions of years in Earth’s deepest body of freshwater is under threat, says Anson Mackay.
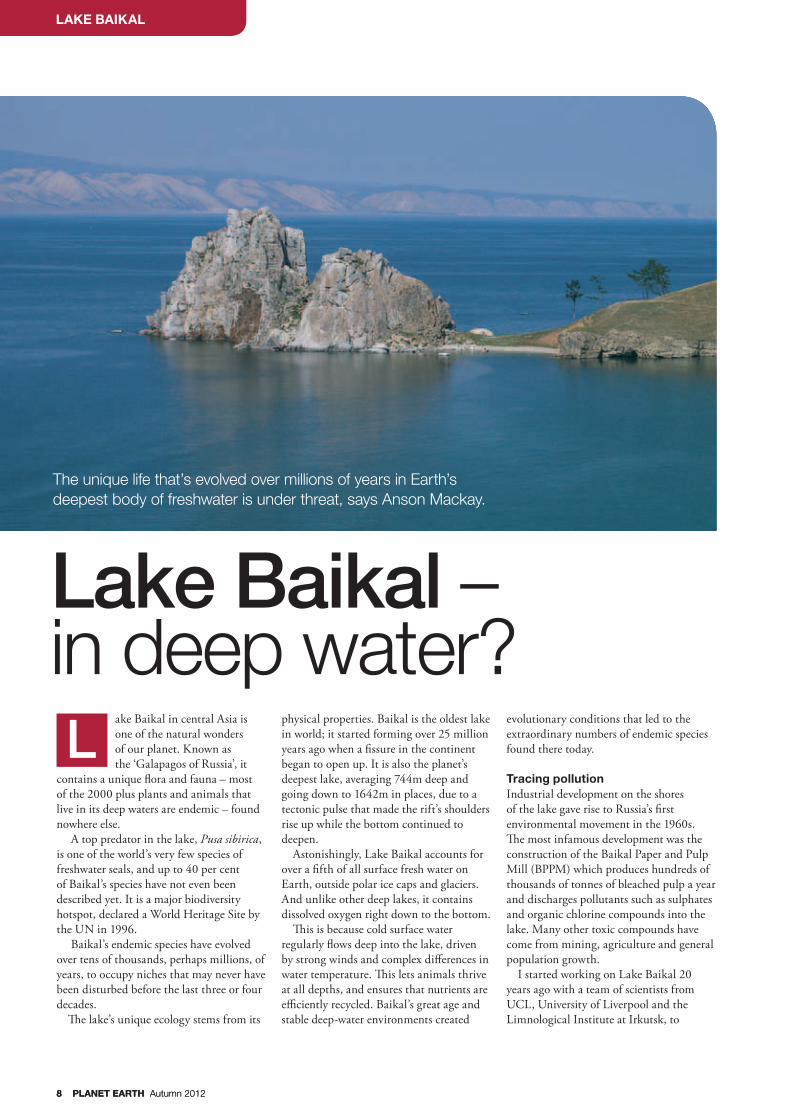
ake Baikal in central Asia is one of the natural wonders of our planet. Known as the ‘Galapagos of Russia’, it
contains a unique flora and fauna – most of the 2000 plus plants and animals that live in its deep waters are endemic – found nowhere else.
A top predator in the lake, Pusa sibirica, is one of the world’s very few species of freshwater seals, and up to 40 per cent of Baikal’s species have not even been described yet. It is a major biodiversity hotspot, declared a World Heritage Site by the UN in 1996.
Baikal’s endemic species have evolved over tens of thousands, perhaps millions, of years, to occupy niches that may never have been disturbed before the last three or four decades.
The lake’s unique ecology stems from its
physical properties. Baikal is the oldest lake in world; it started forming over 25 million years ago when a fissure in the continent began to open up. It is also the planet’s deepest lake, averaging 744m deep and going down to 1642m in places, due to a tectonic pulse that made the rift’s shoulders rise up while the bottom continued to deepen.
Astonishingly, Lake Baikal accounts for over a fifth of all surface fresh water on Earth, outside polar ice caps and glaciers. And unlike other deep lakes, it contains dissolved oxygen right down to the bottom.
This is because cold surface water regularly flows deep into the lake, driven by strong winds and complex differences in water temperature. This lets animals thrive at all depths, and ensures that nutrients are efficiently recycled. Baikal’s great age and stable deep-water environments created
Levolutionary conditions that led to the extraordinary numbers of endemic species found there today.
Tracing pollutionIndustrial development on the shores of the lake gave rise to Russia’s first environmental movement in the 1960s. The most infamous development was the construction of the Baikal Paper and Pulp Mill (BPPM) which produces hundreds of thousands of tonnes of bleached pulp a year and discharges pollutants such as sulphates and organic chlorine compounds into the lake. Many other toxic compounds have come from mining, agriculture and general population growth.
I started working on Lake Baikal 20 years ago with a team of scientists from UCL, University of Liverpool and the Limnological Institute at Irkutsk, to
LAKE BAIKAL
PLANET EARTH Autumn 2012 9
twice the size of the UK because of the Selenga River that extends into northern Mongolia. We also know that global warming is directly affecting ice cover and surface-water temperature in the lake.
In turn these changes have influenced small organisms living in the open water, including tiny plants and animals (respectively known as phytoplankton and zooplankton). Warmer temperatures are also melting frozen soils (permafrost) in the drainage basin, releasing further nutrients into the lake. Human activity from industry and agriculture raises nutrient input even more.
This rise in nutrients means more algae of more different kinds are found in the lake, which in turn influences other aquatic species. So it is essential to understand these changes now, before they become too great and irreversibly damage this unique ecosystem.
Looking into the lake’s futureWe have assembled a new team to investigate these threats by studying isotopes of silicon (Si), which controls the
PLANET EARTH Autumn 2012 9
MORE INFORMATIONAnson Mackay is a reader in environmental change in the Department of Geography at UCL. E-mail: [email protected]
Twitter: @ansonmackay
www.baikalscience.org
growth of diatoms at the base of the food chain, and can tell us about nutrient levels in the lake.
Because Baikal is so enormous, we will spend a lot of time on a research ship next summer, taking samples of water and algae at many locations along a line running from north to south, and from the surface water right down to the depths. We will also do fieldwork in March, when the lake is covered by ice. Winter working conditions are extreme – temperatures can drop to below -30°C, and to access the water you have to dig through metre-thick ice.
An important goal is to place modern-day nutrient uptake in the lake into a much longer historical context, so we will extract new sediment archives especially for this project. Working on the ice will give us a very stable platform from which to drop special coring equipment attached to metal cables down through the water, into the mud, and then to pull them back up again with a motorised winch.
We know from previous experience that just 50cm of lake mud can give us a historical record going back over 1000 years.
Baikal is still relatively pristine. Yet real threats remain, including discharge of pollutants into the Selenga River, direct pollution of the lake from the BPPM, and global warming.
Because water stays in the lake for around 400 years, pollutants entering now could build up for centuries to come. Protective measures have already been taken, including the ‘Baikal Law’, designed to regulate environmental and economic activities in the drainage basin. However, these have had limited success – the BPPM closed down for a couple of years because of environmental concerns, but it reopened in 2010 to much controversy.
The lake’s future is still wide open, as economic activity continues to grow along its coastline and in its drainage basin. Global warming could also alter its delicate balance of species. Our research will help provide the knowledge that’s needed to understand this still-unspoiled jewel in Russia’s crown. n
Extracting a mud core from the lake.
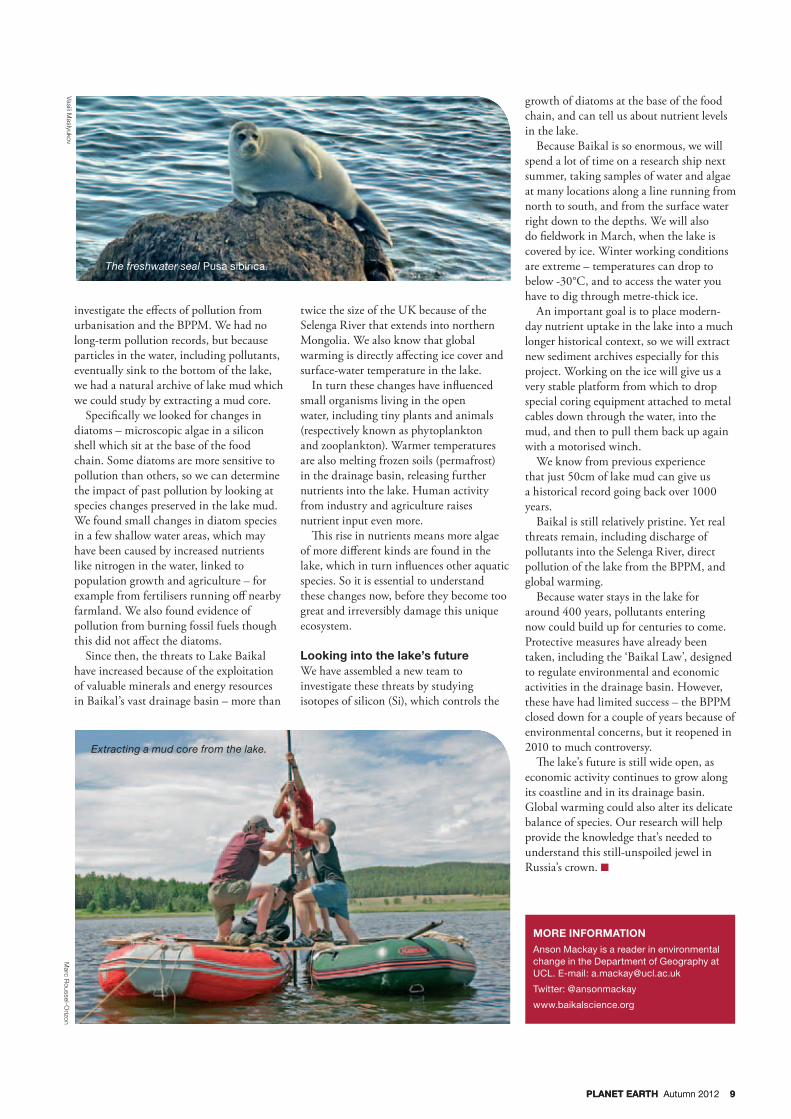
The freshwater seal Pusa sibirica.
investigate the effects of pollution from urbanisation and the BPPM. We had no long-term pollution records, but because particles in the water, including pollutants, eventually sink to the bottom of the lake, we had a natural archive of lake mud which we could study by extracting a mud core.
Specifically we looked for changes in diatoms – microscopic algae in a silicon shell which sit at the base of the food chain. Some diatoms are more sensitive to pollution than others, so we can determine the impact of past pollution by looking at species changes preserved in the lake mud. We found small changes in diatom species in a few shallow water areas, which may have been caused by increased nutrients like nitrogen in the water, linked to population growth and agriculture – for example from fertilisers running off nearby farmland. We also found evidence of pollution from burning fossil fuels though this did not affect the diatoms.
Since then, the threats to Lake Baikal have increased because of the exploitation of valuable minerals and energy resources in Baikal’s vast drainage basin – more than
Vasili Maslyukov
Marc R
oussel-Orizon
10 PLANET EARTH Autumn 2012
oodlands store almost half the world’s terrestrial carbon – 1240 petagrammes (Pg) of the 2860Pg total. Fungi
are the main agents of decomposition in these ecosystems so they are responsible for storing and producing this woodland-soil carbon.
Apart from the occasional mushroom, these fungi go largely unnoticed, as most of their growth occurs where the soil meets the leaf-litter layer. These fungi grow as networks of ‘mycelium’ – intricate webs of filaments, like the root systems of plants. Underground battles for supremacy between competing fungi, and interactions with grazing invertebrates, shape the world as we know it.
Studying interactions between these organisms is difficult, which is why soil has been traditionally seen as a ‘black box’. Soil communities are hidden, highly complex and more diverse than you’d ever imagine. Known as ‘the poor man’s tropical rainforest’, this unseen majority consists of thousands of animal and microbial species living side by side, in conflict or
W
Woodland warfare in a warming world
WOODLAND WARFARE
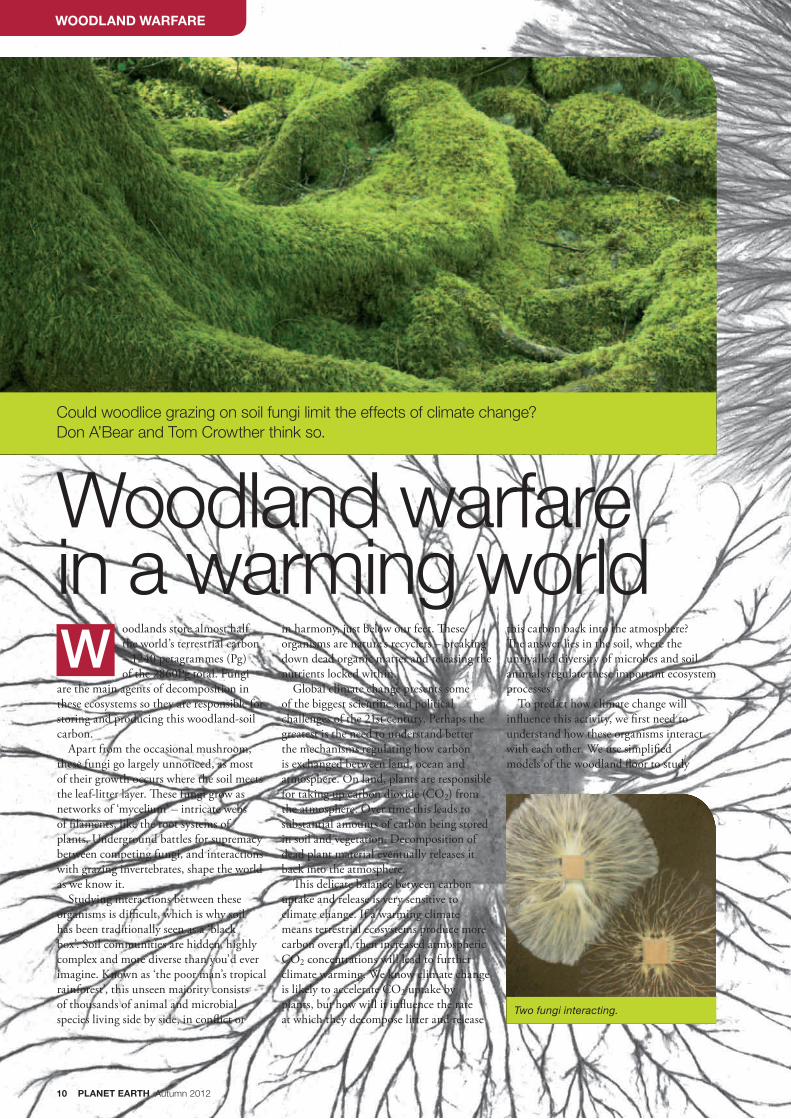
Could woodlice grazing on soil fungi limit the effects of climate change? Don A’Bear and Tom Crowther think so.
in harmony, just below our feet. These organisms are nature’s recyclers – breaking down dead organic matter and releasing the nutrients locked within.
Global climate change presents some of the biggest scientific and political challenges of the 21st century. Perhaps the greatest is the need to understand better the mechanisms regulating how carbon is exchanged between land, ocean and atmosphere. On land, plants are responsible for taking up carbon dioxide (CO2) from the atmosphere. Over time this leads to substantial amounts of carbon being stored in soil and vegetation. Decomposition of dead plant material eventually releases it back into the atmosphere.
This delicate balance between carbon uptake and release is very sensitive to climate change. If a warming climate means terrestrial ecosystems produce more carbon overall, then increased atmospheric CO2 concentrations will lead to further climate warming. We know climate change is likely to accelerate CO2 uptake by plants, but how will it influence the rate at which they decompose litter and release
this carbon back into the atmosphere? The answer lies in the soil, where the unrivalled diversity of microbes and soil animals regulate these important ecosystem processes.
To predict how climate change will influence this activity, we first need to understand how these organisms interact with each other. We use simplified models of the woodland floor to study
Two fungi interacting.
PLANET EARTH Autumn 2012 11
specific interactions within such complex systems. Soil is compacted and flattened in trays to ensure that fungi grow across the surface, where they can be seen. This lets us visualise and measure the effects of soil-dwelling invertebrates on decomposer fungi, as well as estimating individual species’ contribution to wood decomposition rates.
Our own work has shown that a wide range of soil animals – worms, springtails, mites, millipedes and woodlice – graze on these nutritious fungi, limiting their growth and decomposition. But the identity of these grazing species matters! Different grazers have different effects on the fungi they eat, depending on their energetic needs, feeding strategy and body size.
Tiny grazers, big effectLarger invertebrates, such as woodlice, have the strongest impacts. The ‘grazing pressure’ they exert can determine the outcome of battles for dominance between fungal species. When they eat more of the strongest fungal competitor, woodlice save important but less competitive species from being wiped out – maintaining microbial diversity and ensuring that forest floor nutrients are processed efficiently.
The different effects of soil invertebrates on fungal growth and decomposition are important because climate change is predicted to alter their communities. This will indirectly affect the composition of fungal communities, and how quickly they can break down organic matter. Now that we understand more about how these organisms interact, we can begin to consider the impacts of climate change.
Decomposition rates partly depend on the balance between how fast the fungus grows and how quickly invertebrates remove it. Global warming is likely to mean both faster fungal growth and more grazers – so what does this mean for decomposition? We investigated the impact of a 3°C temperature increase on this growth and grazing balance. In general, fungi grew and decomposed wood more rapidly in warmer conditions.
Yet grazing by growing soil invertebrate populations stopped fungi from expanding into new territory any faster. This may have restricted the increase in decomposition rates that would have happened if the invertebrates had been absent. The increased grazing also meant temperature didn’t change the fungal community composition. These interactions may, therefore, be particularly important in
the years to come – they may limit the effects of global warming on microbial communities and the rates of carbon production from soil.
Different invertebrates like to eat different fungi. So the identities of both fungus and grazer – and therefore the composition and diversity of the decomposer community – are important in determining how the whole system responds to warming. For example, springtails grazing on their favourite fungi showed the greatest increase in population size due to warming. This ended up halting the fungal colony’s expansion, as the larger grazer populations consumed more fungus.
The species-specific nature of these interactions could also shed light on an old question in soil ecology – why are soil communities so diverse? Scientists have traditionally assumed these ecosystems have a large degree of functional redundancy – lots of co-existing organisms all playing similar roles. But if this is the case why did such diversity evolve? The answer may lie in tiny differences in feeding strategy – invertebrates feeding on different fungal food sources – and tolerance for different environmental conditions.
MORE INFORMATIONDon A’Bear is a PhD student at Cardiff University funded by a NERC studentship. Tom Crowther recently completed his NERC-funded PhD in the same group, and is now continuing his research at Yale University on a Yale Climate & Energy Institute fellowship. Email:[email protected], [email protected]
We are now investigating whether our findings in these model systems reflect what is happening in nature, with all its variability and complexity. To do this, we took soil ‘turves’ from established woodland ecosystems, containing the full diversity of microbes and animals. We brought these small versions of real systems into the laboratory and are studying them under controlled climatic conditions.
This is an important step in bridging the gap between purely laboratory- and field-based studies. As in the microcosm models, larger soil fauna, such as woodlice, have the most important effects. The next step will be to conduct experiments in the field, using natural environmental gradients from colder to warmer places to simulate climate-change scenarios.
Ultimately we want to understand how climate and soil communities interact to regulate ecosystem function. So far, our results suggest that the impacts of global warming on decomposition and carbon feedback depend on the composition of the decomposer community. So maintaining soil biodiversity seems to be crucial if we’re to keep our woodland ecosystems working efficiently and maximise their resilience to climate change. n
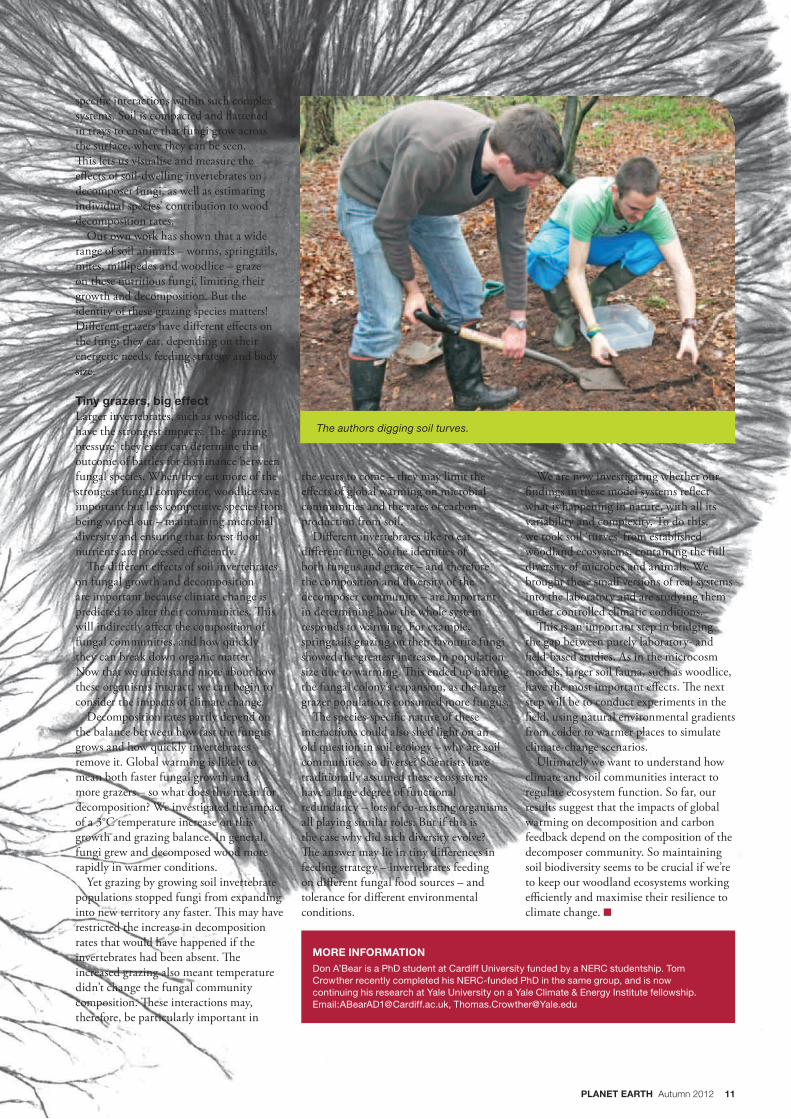
The authors digging soil turves.
12 PLANET EARTH Autumn 2012
SUNDEWS
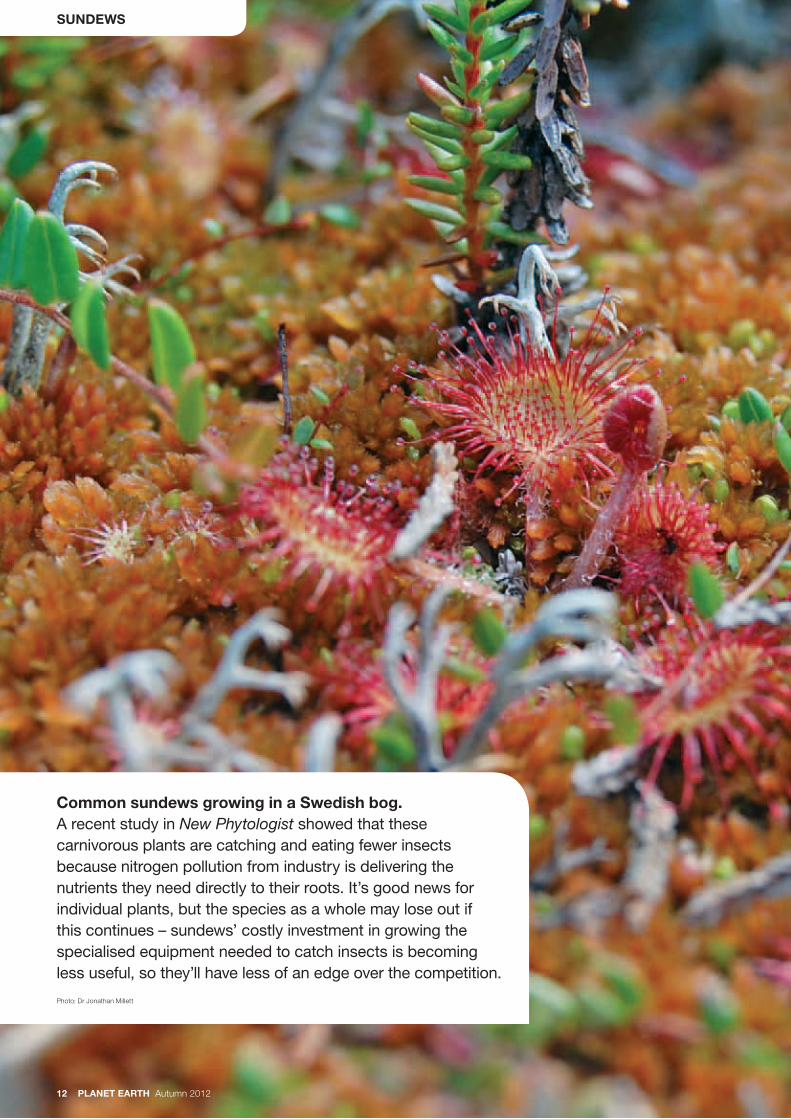
Common sundews growing in a Swedish bog. A recent study in New Phytologist showed that these carnivorous plants are catching and eating fewer insects because nitrogen pollution from industry is delivering the nutrients they need directly to their roots. It’s good news for individual plants, but the species as a whole may lose out if this continues – sundews’ costly investment in growing the specialised equipment needed to catch insects is becoming less useful, so they’ll have less of an edge over the competition. Photo: Dr Jonathan Millett
PLANET EARTH Autumn 2012 13
Adjusting the atomic clock
Unravelling the Earth’s 4.5-billion-year history is a mammoth task. Joe Hiess and Dan Condon describe how their work has uncovered a systematic flaw in the assumptions behind one of science's key dating methods – and how correcting it will move some accepted dates by nearly a million years.
MORE INFORMATIONDr Joe Hiess is a geochronologist and Dr Dan Condon is the leader of the Chronology theme, both at the NERC Isotope Geosciences Laboratory. Email: [email protected]
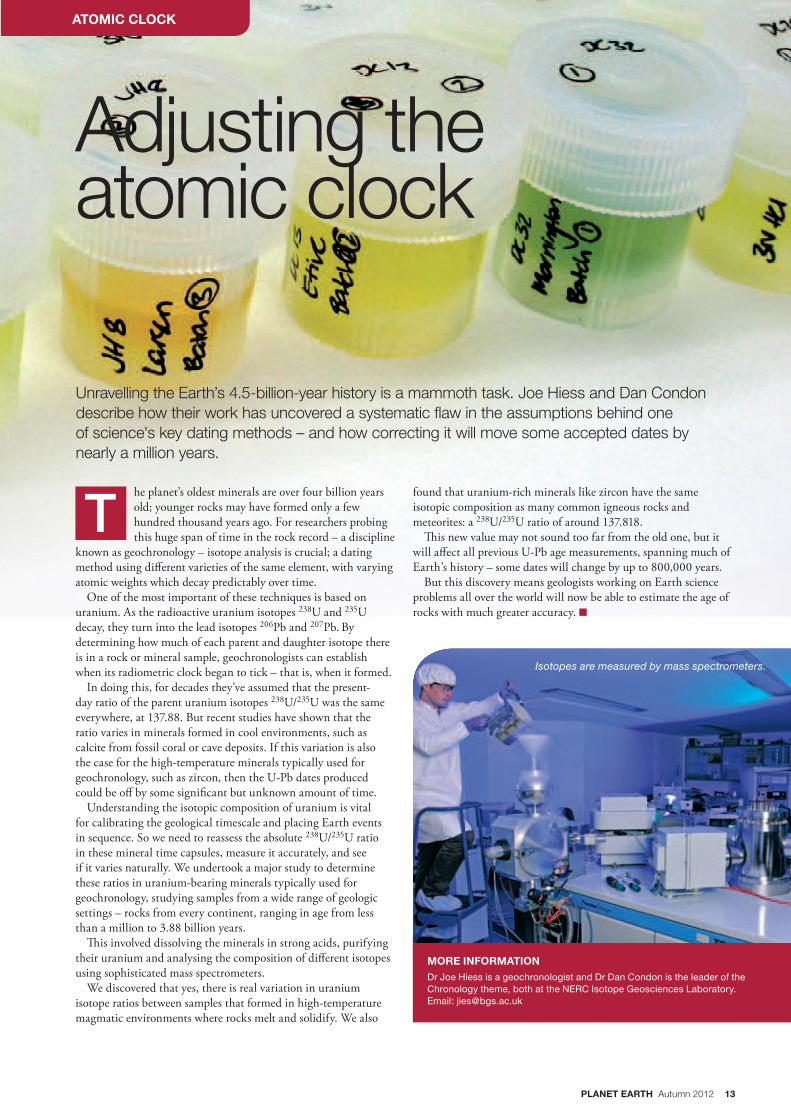
Isotopes are measured by mass spectrometers.
he planet’s oldest minerals are over four billion years old; younger rocks may have formed only a few hundred thousand years ago. For researchers probing this huge span of time in the rock record – a discipline
known as geochronology – isotope analysis is crucial; a dating method using different varieties of the same element, with varying atomic weights which decay predictably over time.
One of the most important of these techniques is based on uranium. As the radioactive uranium isotopes 238U and 235U decay, they turn into the lead isotopes 206Pb and 207Pb. By determining how much of each parent and daughter isotope there is in a rock or mineral sample, geochronologists can establish when its radiometric clock began to tick – that is, when it formed.
In doing this, for decades they’ve assumed that the present-day ratio of the parent uranium isotopes 238U/235U was the same everywhere, at 137.88. But recent studies have shown that the ratio varies in minerals formed in cool environments, such as calcite from fossil coral or cave deposits. If this variation is also the case for the high-temperature minerals typically used for geochronology, such as zircon, then the U-Pb dates produced could be off by some significant but unknown amount of time.
Understanding the isotopic composition of uranium is vital for calibrating the geological timescale and placing Earth events in sequence. So we need to reassess the absolute 238U/235U ratio in these mineral time capsules, measure it accurately, and see if it varies naturally. We undertook a major study to determine these ratios in uranium-bearing minerals typically used for geochronology, studying samples from a wide range of geologic settings – rocks from every continent, ranging in age from less than a million to 3.88 billion years.
This involved dissolving the minerals in strong acids, purifying their uranium and analysing the composition of different isotopes using sophisticated mass spectrometers.
We discovered that yes, there is real variation in uranium isotope ratios between samples that formed in high-temperature magmatic environments where rocks melt and solidify. We also
found that uranium-rich minerals like zircon have the same isotopic composition as many common igneous rocks and meteorites: a 238U/235U ratio of around 137.818.
This new value may not sound too far from the old one, but it will affect all previous U-Pb age measurements, spanning much of Earth’s history – some dates will change by up to 800,000 years.
But this discovery means geologists working on Earth science problems all over the world will now be able to estimate the age of rocks with much greater accuracy. n
T
ATOMIC CLOCK
14 PLANET EARTH Autumn 2012
f you’ve ever walked a long way with a heavy rucksack on your back, and then felt the enormous relief as that load
was lifted off, you know how Antarctica feels.
20,000 years ago, during the last ice age, Antarctica was weighed down by a much larger ice sheet, but since then it has generally been losing mass. Vast tracts of ice, hundreds of metres thick, have flowed into the ocean – and this has lifted a great weight from its surface. The Earth beneath responds to these changes; it is now rising, just as it once sank when the ice sheet grew.
This process, known as glacial isostatic adjustment (GIA), doesn’t happen instantaneously – the land can take thousands of years to fully rebound, and it’s still moving today. This presents both an opportunity and an obstacle to understanding the history of the Antarctic ice sheet.
The opportunity is that measuring this ongoing response can tell us how the thickness and extent of the ice sheet have changed over time in response to past climatic changes. This is important, since it sets the context for present-day changes, which will have major implications for how fast sea levels rise over the next century.
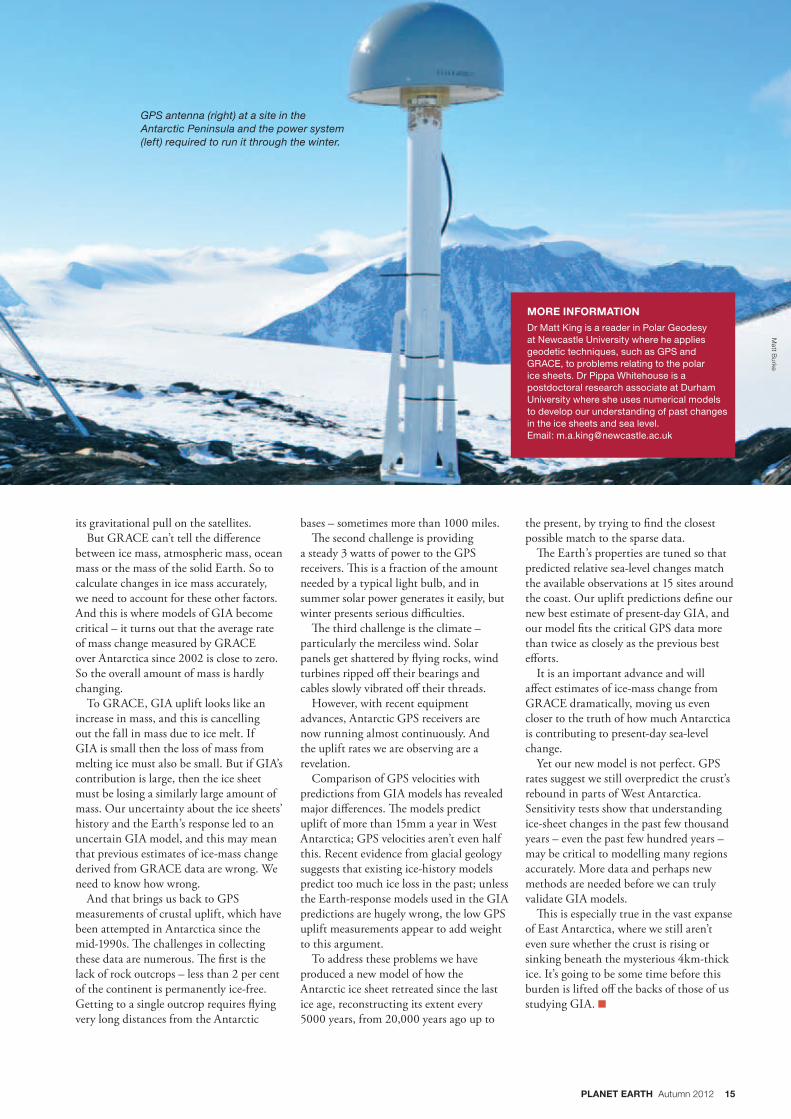
The crust’s vertical motion due to GIA is typically only a few millimetres a year, so to measure it we need a very accurate
On the upAntarctica is still on the rebound after shedding huge volumes of ice. Matt King and Pippa Whitehouse explain how they’re tracking its slow movement, and why.
and precise technique. Global positioning system (GPS) receivers attached to rock outcrops poking through the ice sheet are the answer.
The information these provide is important because conventional methods of determining past ice extent, such as looking for glacial trim lines (bathtub rings etched in the landscape by the ice), or dating boulders left behind as the ice retreated, give limited data for most regions and periods.
This dearth of information has led scientists to propose several very different reconstructions of Antarctica’s ice history.
If we can relate measurements of present-day crustal uplift to the history of the ice, we can test these competing ideas.
To link ice history to present-day crustal uplift we need to know how the solid Earth responds to ice being added to, and then removed from, its surface. The characteristics that matter for GIA relate to the strength of the top 100km or so of the solid Earth and the viscosity of the mantle beneath.
These control both when and where uplift happens. Unfortunately they are not well defined – not only is the ice-loading history poorly known, but the Earth’s response to that loading is uncertain.
To make matters worse, there are trade-offs between these two unknowns – a lack of uplift today could be because the ice didn’t change much in the past, or because the ice changed a lot but the solid Earth adjusted quickly and has already finished rebounding. The picture is complex, but every new measurement brings it into sharper focus.
Melting ice, rising rockThe obstacle presented by continuing GIA referred to earlier, is that it obscures the changes in gravity caused by present-day changes in ice mass.
Since 2002, the Gravity Recovery and Climate Experiment (GRACE) satellites have been mapping Earth’s gravity field every 30 days, letting us track mass as it moves on, or below, Earth’s surface – the more mass there is in an area, the stronger
SOLAR PANELS GET SHATTERED BY FLYING ROCKS, WIND TURBINES GET RIPPED OFF
THEIR BEARINGS AND CABLES SLOWLY VIBRATED OFF THEIR THREADS.
I
ON THE UP
PLANET EARTH Autumn 2012 15
its gravitational pull on the satellites.But GRACE can’t tell the difference
between ice mass, atmospheric mass, ocean mass or the mass of the solid Earth. So to calculate changes in ice mass accurately, we need to account for these other factors. And this is where models of GIA become critical – it turns out that the average rate of mass change measured by GRACE over Antarctica since 2002 is close to zero. So the overall amount of mass is hardly changing.
To GRACE, GIA uplift looks like an increase in mass, and this is cancelling out the fall in mass due to ice melt. If GIA is small then the loss of mass from melting ice must also be small. But if GIA’s contribution is large, then the ice sheet must be losing a similarly large amount of mass. Our uncertainty about the ice sheets’ history and the Earth’s response led to an uncertain GIA model, and this may mean that previous estimates of ice-mass change derived from GRACE data are wrong. We need to know how wrong.
And that brings us back to GPS measurements of crustal uplift, which have been attempted in Antarctica since the mid-1990s. The challenges in collecting these data are numerous. The first is the lack of rock outcrops – less than 2 per cent of the continent is permanently ice-free. Getting to a single outcrop requires flying very long distances from the Antarctic
bases – sometimes more than 1000 miles.The second challenge is providing
a steady 3 watts of power to the GPS receivers. This is a fraction of the amount needed by a typical light bulb, and in summer solar power generates it easily, but winter presents serious difficulties.
The third challenge is the climate – particularly the merciless wind. Solar panels get shattered by flying rocks, wind turbines ripped off their bearings and cables slowly vibrated off their threads.
However, with recent equipment advances, Antarctic GPS receivers are now running almost continuously. And the uplift rates we are observing are a revelation.
Comparison of GPS velocities with predictions from GIA models has revealed major differences. The models predict uplift of more than 15mm a year in West Antarctica; GPS velocities aren’t even half this. Recent evidence from glacial geology suggests that existing ice-history models predict too much ice loss in the past; unless the Earth-response models used in the GIA predictions are hugely wrong, the low GPS uplift measurements appear to add weight to this argument.
To address these problems we have produced a new model of how the Antarctic ice sheet retreated since the last ice age, reconstructing its extent every 5000 years, from 20,000 years ago up to
MORE INFORMATIONDr Matt King is a reader in Polar Geodesy at Newcastle University where he applies geodetic techniques, such as GPS and GRACE, to problems relating to the polar ice sheets. Dr Pippa Whitehouse is a postdoctoral research associate at Durham University where she uses numerical models to develop our understanding of past changes in the ice sheets and sea level.Email: [email protected]
the present, by trying to find the closest possible match to the sparse data.
The Earth’s properties are tuned so that predicted relative sea-level changes match the available observations at 15 sites around the coast. Our uplift predictions define our new best estimate of present-day GIA, and our model fits the critical GPS data more than twice as closely as the previous best efforts.
It is an important advance and will affect estimates of ice-mass change from GRACE dramatically, moving us even closer to the truth of how much Antarctica is contributing to present-day sea-level change.
Yet our new model is not perfect. GPS rates suggest we still overpredict the crust’s rebound in parts of West Antarctica. Sensitivity tests show that understanding ice-sheet changes in the past few thousand years – even the past few hundred years – may be critical to modelling many regions accurately. More data and perhaps new methods are needed before we can truly validate GIA models.
This is especially true in the vast expanse of East Antarctica, where we still aren’t even sure whether the crust is rising or sinking beneath the mysterious 4km-thick ice. It’s going to be some time before this burden is lifted off the backs of those of us studying GIA. n
GPS antenna (right) at a site in the Antarctic Peninsula and the power system (left) required to run it through the winter.
Matt B
urke

A breath offresh air?A constant challenge in a busy accident and emergency department is deciding exactly what type of care patients need.
Richard Hollingham talks to Paul Monks from the University of Leicester and Tim Coates from Leicester Royal Infirmary, to find out how environmental science could help doctors make that decision.
16 PLANET EARTH Autumn 2012
THE PODCAST
PLANET EARTH Autumn 2012 17
the space research centre who said ‘Actually we’ve been working on that.’ Then we found Tim and it kind of came together. The university gave us half a million pounds to buy the equipment and since then it’s mushroomed. It’s really a land of opportunity for doing cutting-edge science.
Richard: Do you anticipate actually being able to diagnose some diseases with this or is that a long-term goal?
Tim: That’s a medium-term goal. I think with a lot of science people tell you there’s a breakthrough and it’s going to do this, but they’re talking five or ten years away. With this technology we’re probably two years away from having something that can really be tested to see if it makes a difference for patients.
We see about 450 patients a day come through this department. The real trick in emergency care is to pick out which of those really need emergency intervention and which can go to their GP or outpatients. We often have difficulty making that decision and sometimes we get it wrong. If technology like this could help pick out patients that really do need our help, that’s going to be a benefit.
Richard: For a hospital environment this is a fairly fearsome bit of equipment. I imagine it is also very expensive. You really need to miniaturise this don’t you?
Paul: Yes, we’re at the discovery phase, so we need big instruments with a lot of functionality to explore human breath. The idea at the end of the day is to miniaturise these things and maybe even produce hand-held diagnostics, something the size of a glasses case that you would be able to breathe into. Maybe even, one day, your mobile phone.
MORE INFORMATIONThis Q&A is adapted from the Planet Earth Podcast, 6 June 2012. The full podcast and transcript are on Planet Earth Online: http://planetearth.nerc.ac.uk/multimedia/story.aspx?id=1243
For more information about the air sampling technique visit www2.le.ac.uk/departments/chemistry/facilities/raft/
For information about air pollution investigation during the Olympics see Planet Earth Spring pp10-11 and Podcast:http://planetearth.nerc.ac.uk/multimedia/story.aspx?id=1187
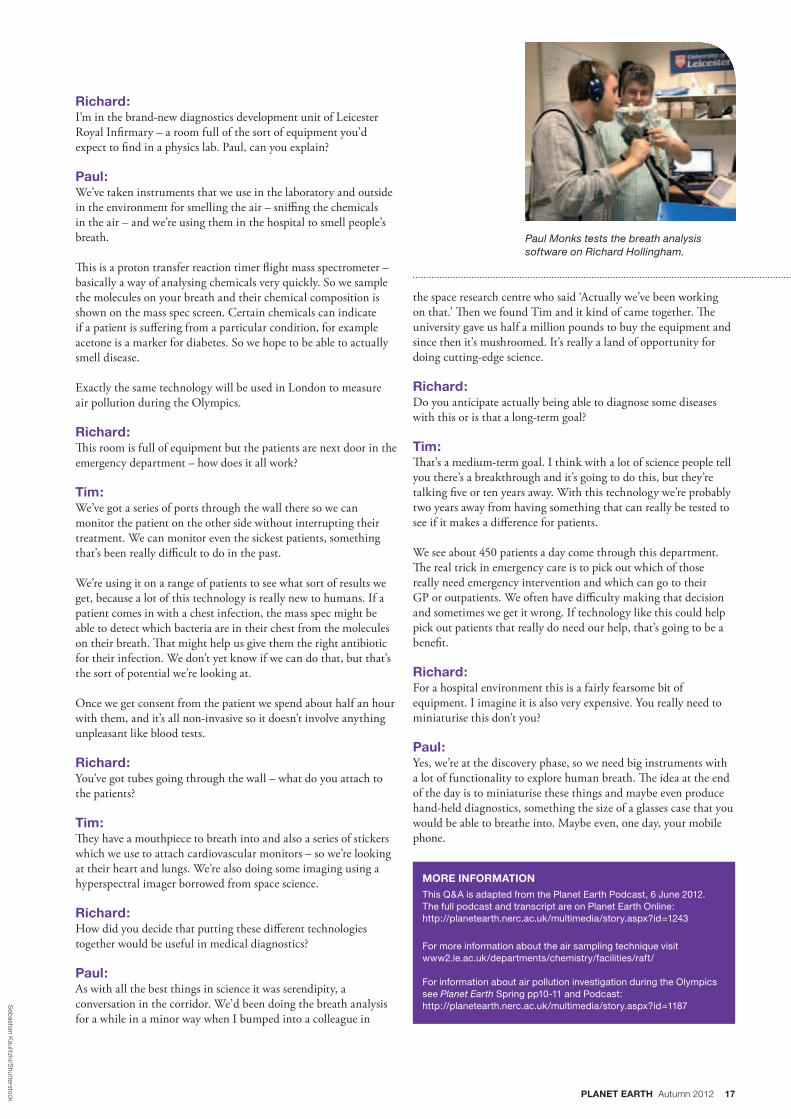
Richard: I’m in the brand-new diagnostics development unit of Leicester Royal Infirmary – a room full of the sort of equipment you’d expect to find in a physics lab. Paul, can you explain?
Paul: We’ve taken instruments that we use in the laboratory and outside in the environment for smelling the air – sniffing the chemicals in the air – and we’re using them in the hospital to smell people’s breath.
This is a proton transfer reaction timer flight mass spectrometer – basically a way of analysing chemicals very quickly. So we sample the molecules on your breath and their chemical composition is shown on the mass spec screen. Certain chemicals can indicate if a patient is suffering from a particular condition, for example acetone is a marker for diabetes. So we hope to be able to actually smell disease.
Exactly the same technology will be used in London to measure air pollution during the Olympics.
Richard:This room is full of equipment but the patients are next door in the emergency department – how does it all work?
Tim: We’ve got a series of ports through the wall there so we can monitor the patient on the other side without interrupting their treatment. We can monitor even the sickest patients, something that’s been really difficult to do in the past.
We’re using it on a range of patients to see what sort of results we get, because a lot of this technology is really new to humans. If a patient comes in with a chest infection, the mass spec might be able to detect which bacteria are in their chest from the molecules on their breath. That might help us give them the right antibiotic for their infection. We don’t yet know if we can do that, but that’s the sort of potential we’re looking at.
Once we get consent from the patient we spend about half an hour with them, and it’s all non-invasive so it doesn’t involve anything unpleasant like blood tests.
Richard: You’ve got tubes going through the wall – what do you attach to the patients?
Tim: They have a mouthpiece to breath into and also a series of stickers which we use to attach cardiovascular monitors – so we’re looking at their heart and lungs. We’re also doing some imaging using a hyperspectral imager borrowed from space science.
Richard: How did you decide that putting these different technologies together would be useful in medical diagnostics?
Paul: As with all the best things in science it was serendipity, a conversation in the corridor. We’d been doing the breath analysis for a while in a minor way when I bumped into a colleague in
Paul Monks tests the breath analysis software on Richard Hollingham.
Seb
astian Kaulitzki/S
hutterstock
18 PLANET EARTH Autumn 2012
Climate of change?Earth is getting warmer, and the Antarctic Peninsula is one of the most rapidly warming places on the planet. But how do we know if rising temperatures in one place are due to global warming or natural fluctuations? Christian Franzke is trying to figure it out.
CLIMATE OF CHANGE?
The Faraday/Vernadsky research station.
PLANET EARTH Autumn 2012 19
am interested in the mechanisms behind the weather we see every day. Why is one winter different
from the next? Can we predict what next summer will be like? Can we predict what winter will be like in ten years’ time? And I’m particularly interested in how we can distinguish between natural and man-made climate changes.
Most people would probably like to know if changes in weather where they live are due to global warming or are simply random, natural, fluctuations – but how can we be sure?
The fact is, it can take a long time to recognise the influence of climate change with any certainty. One of the difficulties we face is that natural climate fluctuations affect weather over long periods of time and can obscure the effects of global warming due to greenhouse-gas emissions. For instance, the natural oceanic El Niño phenomenon in the Pacific affects the weather and surface temperature over the whole planet over the course of a winter.
So even though the Earth is getting warmer on average, the temperature where you are can temporarily drop – as we’ve experienced during the last few cold winters here in the UK for example. This is because a global average is just that – the average of local measurements: the global picture of a warming world can and does include local, short-term cooling.
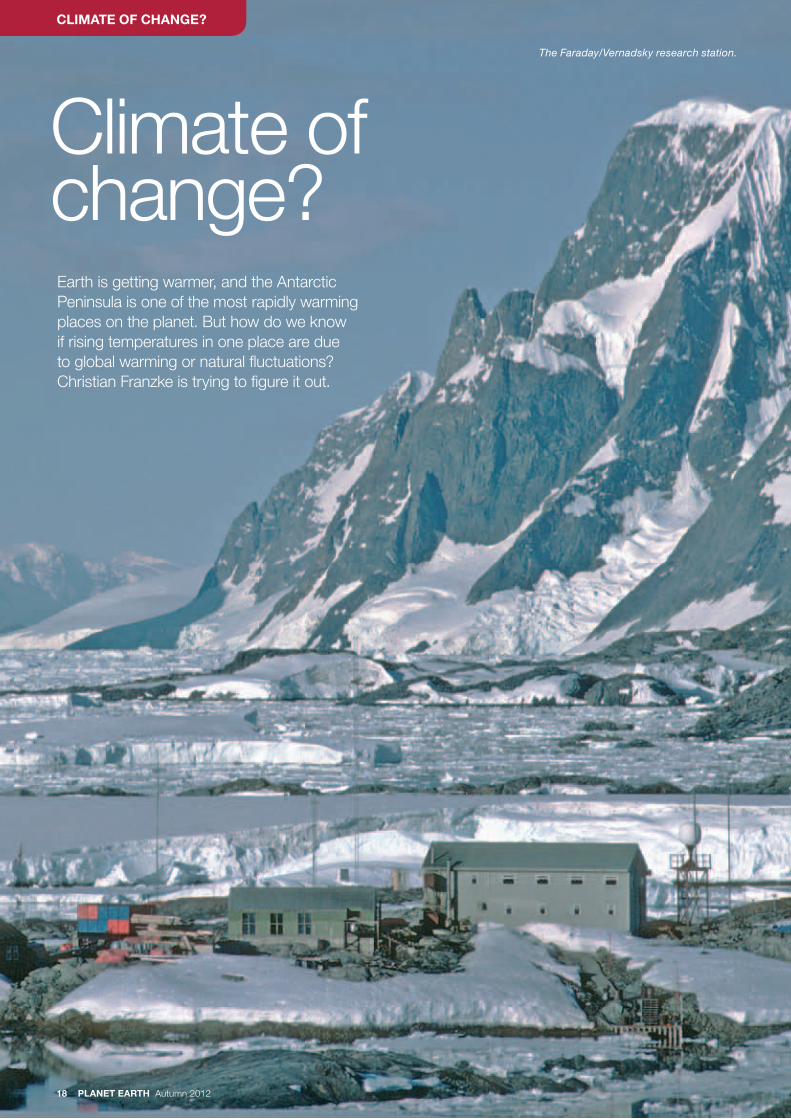
One of the fastest-warming places in the world is Marina Point, on Galindez Island just off the coast of the Antarctic Peninsula, where the research station Faraday/Vernadsky is located. Temperature measurements began here in February 1947 and continue today, so we have a very long temperature record in one of the most remote and hostile environments on the planet. The temperature there has increased by almost 4°C over the last six decades. But is this because of global warming?
To find out, the first step is to work out if the warming is statistically significant – and therefore likely to be due to global warming – or whether it’s more likely that the same conditions could have occurred just by chance. We do this by comparing actual observations of temperature change with models of natural climate variations produced using ‘time-series generators’. These use information about what’s happened in the past to generate random trends which could happen by chance in the future.
MORE INFORMATIONChristian Franzke is a senior research scientist at the British Antarctic Survey in Cambridge. Email: [email protected]
IWe then compare our real data with the
generated trends. If fewer than 5 out of 100 of the generated trends are larger than the observed trends then we meteorologists say that our observed trends are significant – they are very unlikely to have happened by chance.
Essentially there are two types of time-series generators: short- and long-range dependent. Short-range dependent systems predict tomorrow’s weather based only on information about today’s weather. In contrast, long-range dependent systems use information about the climate system a long way into the past, so these past events influence the generator’s results a long way into the future.
Until now, short-range dependent time-series generators have been most commonly used in climate studies, but there is increasing evidence that long-range systems are better at indicating whether observed climate fluctuations are random or are part of a real trend. This is because long-range dependent systems are better at capturing the persistence of the climate system – the fact that warm days are likely to be followed by many warm days rather than just a few. Short-range dependent generators underestimate this persistence, so when we use them to test our observed data they are more likely to mistake natural fluctuations for a real, statistically significant, trend. In practice, short-range dependent generators are good at capturing temperature fluctuations on a daily or monthly basis, while long-range dependent generators capture fluctuations best on annual and decadal time scales. Remember that these latter time scales are very important for trend estimation.
This might all sound very academic but it can have a big impact in practice, as I discovered when I analysed temperature
readings from three stations in Antarctica, including Faraday/Vernadsky. I could see that temperatures at all three stations had risen over the last few decades. I produced as many random temperature predictions as possible, with both short- and long-range dependent generators, then tested the observed warming trends against these to see if they were statistically significant.
Remember that if less than 5 out of 100 generated trends are larger than the observed trends (so in this case larger than 4°C at Faraday/Vernadsky), then we consider that the observed trends are significant and are very unlikely to have happened by chance. When I used the short-range dependent generator I
found this seemed to be the case: for all three stations, less than 5 out of 100 of the generated trends were larger than the observed trend, suggesting that the warming in this part of Antarctica is related to global warming. But when I used the long-term generator, only the readings from Faraday/Vernadsky had a significant warming trend.
Does this disprove global warming? No. It simply means we can’t yet be sure whether, or how, global warming is affecting temperature changes at some sites.
I am currently examining many other weather-station data worldwide and find many stations which show a significant temperature trend – central England for example – just like at Faraday/Vernadsky.
So we know we are already feeling the effects of global warming in some areas. But in many places local variability is still, for now, obscuring global warming trends. We will have to wait a bit longer before we know what’s behind all the local weather changes people are experiencing around the world. n
EVEN THOUGH THE EARTH IS GETTING WARMER ON AVERAGE, THE TEMPERATURE WHERE YOU
ARE CAN TEMPORARILY DROP.
20 PLANET EARTH Autumn 2012
PEARL MUSSELS
reshwater mussels may not have the obvious charm of pandas, but their future is just as uncertain, and their loss could
have serious implications for our rivers. Our team’s research carried out on the
River Esk in north-east England, as part of the Rural Economy and Land Use (Relu) Programme, could help reverse the decline of this species, which may include individuals up to 120 years old.
Although the freshwater pearl mussel (Margaritifera margaritifera) is found all
The plight of the pearl musselWhat’s killing our mussels, and what can we do about it? Louise Bracken and Liz Oughton are on the case.
Fover Europe, Scandinavia and north-eastern North America, it has suffered serious decline in recent years and is facing extinction throughout its former range. Furthermore, populations in different rivers seem to have their own distinctive features, and this appears to be supported by studies currently being carried out on their DNA. Many of these unique populations are under threat and in need of protection.
Along the Esk, we recorded just 727 pearl mussels, and the vast majority are large, adult shellfish with only a few
smaller specimens. The story is similar in many UK rivers. Scotland is the mussels’ last European stronghold, supporting functional populations in over 50 rivers. But even here, few juveniles are being found and pearl mussel beds are under severe pressure.
Many people will be quite unaware of the pearl mussel or its plight. So should we be concerned? Ecologists think we should because this aquatic bivalve mollusc isn’t just fascinating in its own right: it’s an indicator species for the overall health of a
Linda P
itkin / 2020VIS
ION
PLANET EARTH Autumn 2012 21
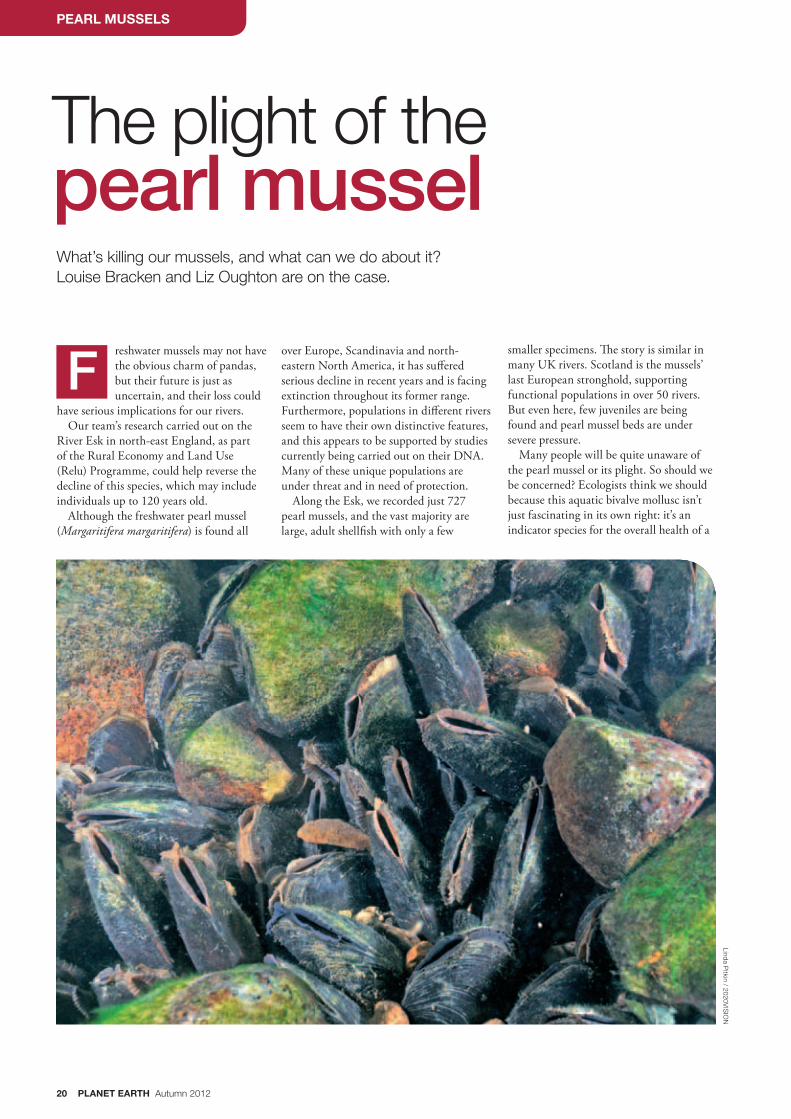
river, because its life cycle depends on very specific conditions. Individuals can grow to 140mm long, and burrow into the sandy beds of fast-flowing rivers and streams, often between boulders and pebbles. They reach reproductive maturity at around 12 years old.
To thrive they need cool, well-oxygenated, soft water that’s free of pollution. When the mussels spawn, in mid- to late summer, their larvae attach themselves to the gills of salmon and trout, then drop off the following spring to settle in the riverbed gravel. This helps to disperse the young mussels to new areas where they grow to adulthood. Fishing surveys on the Esk suggest that larvae are still found on these fish, but that they are failing to survive after leaving their hosts.
Mussels in the UK have been affected by many factors, including pearl fishing (now illegal), shifts in the populations of salmon and trout, and pollution. Diffuse pollution, where chemicals leach into watercourses from many different sources, is a particularly complex problem.
Changes in land use and farming practices are thought to have contributed to changes in water quality. Livestock bring problems of soil erosion from poaching – animals trampling the ground to mud – and contamination from waste. In areas
with a lot of arable farming, more intensive crop production has also played a part, with increased use of fertilizers and greater reliance on herbicides and pesticides. This results in nitrogen and phosphorus from the soil leaching into water courses.
Industrial activities also create diffuse pollution, and chemicals wash from roads into surface-water drains, and eventually into rivers. Septic tanks and sewage-treatment plants also can be sources of pollution. All these can harm the freshwater pearl mussel and the river environment, but the picture is complicated.
We do know that pearl mussels generally live in rivers with very low concentrations of nitrate, phosphate and fine sediment, and increases in any of these pollutants can cause their decline. Yet the Esk has generally been considered a clean river.
Increases in sediment have often been blamed for the decline in population, as the young mussels can become buried.
But when we monitored the Esk’s water quality and rate of sedimentation, we found that the highest sediment levels do not overlap with the main areas where the pearl mussels live, so this may be less of a problem than previously assumed.
But water quality varied at different monitoring sites and some of these did show levels of nitrates and phosphates that might be damaging the mussels. We also suspect that these monthly water-quality tests were not showing the worst levels, which would probably occur during flooding.
But the freshwater pearl mussel sits unseen on the riverbed. Why should we worry about its fate? The reality is that if we value our rivers and want them to be
healthy habitats and places that we enjoy for leisure, we should certainly worry, because a decline in the pearl mussel population can seriously harm the complex wider ecosystem. Mussels feed on small particles from the water, and adult mussels can filter up to 50 litres of water a day to extract these particles, creating within the mussel bed a suitable microhabitat for the tiny invertebrates that provide food for juvenile trout and salmon.
The Esk Pearl Mussel and Salmon Recovery project is taking on the considerable challenge of reversing the mussel’s long-term population decline. To achieve this, we are using an innovative partnership approach, involving several organisations and academic researchers, that aims to address the bigger picture.
Bringing together individuals with varied expertise, including scientific knowledge and practical understanding of farming, from Natural England, the Environment Agency and Durham University and led by
MORE INFORMATIONDr Louise Bracken is a reader in the Department of Geography at Durham University.
Email: [email protected].
Dr Liz Oughton is principal research associate at the Centre for Rural Economy at Newcastle University.
www.relu.ac.uk
THE MUSSEL SITS UNSEEN ON THE RIVER BED. WHY SHOULD WE WORRY ABOUT ITS FATE?
the North York Moors National Park, the project has secured funding for a dedicated project officer, and resources to carry out works to improve water quality.
We have set up a demonstration farm to encourage farmers to think about how they might change their working practices to reduce the diffuse pollution problem. By working with the people who manage the land, and engaging the expertise of officers from Catchment Sensitive Farming (an initiative aimed at helping farmers reduce water pollution from their land) they can balance the needs of food production and of the river ecology.
For example, changes that protect the pearl mussel, such as fencing to keep farm animals out of the river, can also protect livestock by reducing foot infections. Providing troughs gives livestock alternative access to clean drinking water, while careful, targeted use of chemicals has the additional benefit of saving the farmer money. This blend of skills and different kinds of knowledge, and the involvement of the local farming community as key partners, has brought about important changes in farming practices along the Esk.
It is too early to judge whether this will eventually lead to the recovery of the pearl mussel population, but the future already looks brighter for this ancient but seldom-seen creature. n
Wild W
onders of E
urope/R
oggo
22 PLANET EARTH Autumn 2012
e think of what nature gives us – clean water, fresh air, fertile soil to grow food – as free. But these things have a
value to us all, both financially and in ways that are harder to measure, like the value of our enjoyment of nature and our health.
What would happen if governments and businesses had to take these values into account when they made decisions? How might it affect the cost of the food in our shops, our access to recreation, or the quality of the natural environment?
These aren’t just hypothetical questions. The services our environment provides are under threat as our demand for food and consumer goods grows. Businesses, policy-makers and regulators alike need to find ways to understand the full implications of the decisions they take, and make those decisions truly sustainable.
Valuing natureWhat if the services we get from the environment had to be paid for?
WHAT KIND OF WORK IS THE NETWORK DOING?
n Uniting natural and social scientists to investigate how valuation can help avoid overexploitation and collapse of ecosystems.
n Working with businesses, including major international companies involved in crop production, to put a value on the social and environmental impacts of their operations.
n Helping farmers, tourism operators and local authorities to understand the full value of farmland, so it can be managed to support crop production, habitats for wildlife and recreation for the public.
MORE INFORMATIONDr Ruth Welters is communications manager for the Valuing Nature Network.
Email: [email protected]
www.valuing-nature.net
VALUING NATURE
WRecently, researchers have started to
work out better ways of valuing the natural environment. NERC set up the Valuing Nature Network to bring the public and private sectors together with researchers to investigate complex questions around how to take account of the value of the natural environment.
A few examples of activities so far are shown below, but you can find out more about the progress of the Network’s wide-ranging projects on its website.
The plan is that valuing nature’s services will lead to better decisions and ultimately to real environmental improvements. The network is already showing how the value of the environment can be used by government in their decisions, whilst helping business find ways to improve both their environment and financial sustainability. n
22 PLANET EARTH Autumn 2012
PLANET EARTH Autumn 2012 23
hen Professor Mike Parker Pearson from the University of Sheffield started excavating the Bronze Age
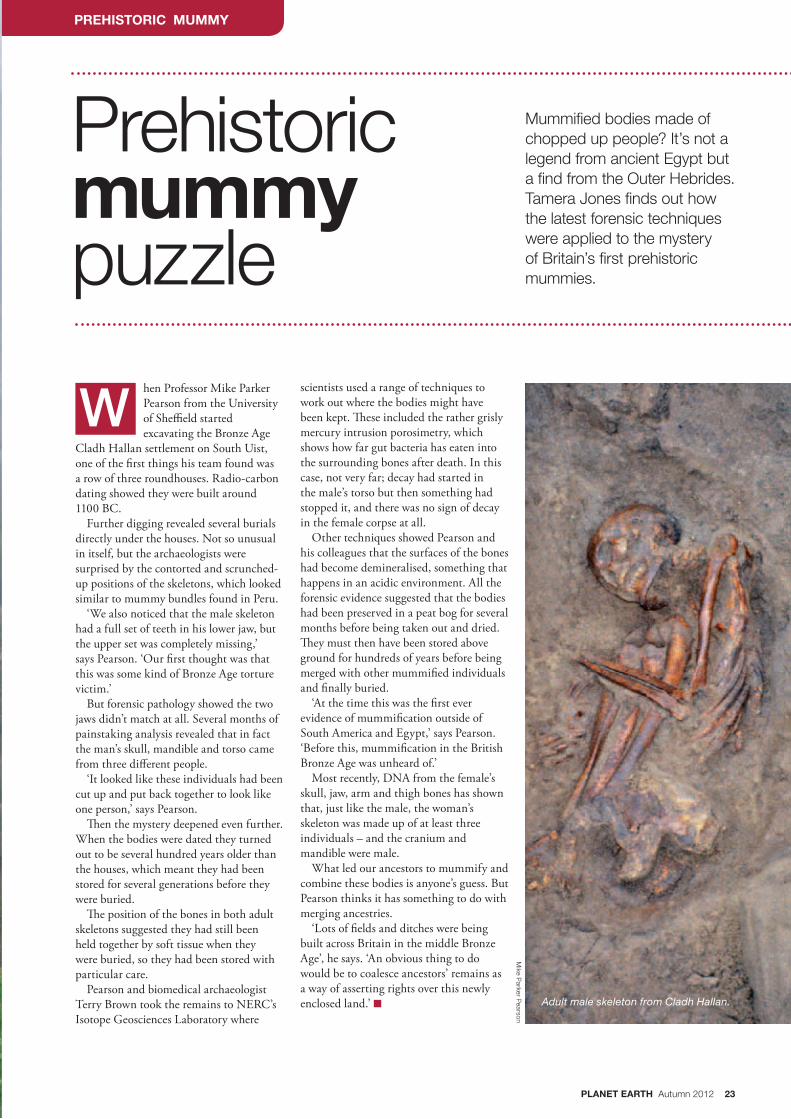
Cladh Hallan settlement on South Uist, one of the first things his team found was a row of three roundhouses. Radio-carbon dating showed they were built around 1100 BC.
Further digging revealed several burials directly under the houses. Not so unusual in itself, but the archaeologists were surprised by the contorted and scrunched-up positions of the skeletons, which looked similar to mummy bundles found in Peru.
‘We also noticed that the male skeleton had a full set of teeth in his lower jaw, but the upper set was completely missing,’ says Pearson. ‘Our first thought was that this was some kind of Bronze Age torture victim.’
But forensic pathology showed the two jaws didn’t match at all. Several months of painstaking analysis revealed that in fact the man’s skull, mandible and torso came from three different people.
‘It looked like these individuals had been cut up and put back together to look like one person,’ says Pearson.
Then the mystery deepened even further. When the bodies were dated they turned out to be several hundred years older than the houses, which meant they had been stored for several generations before they were buried.
The position of the bones in both adult skeletons suggested they had still been held together by soft tissue when they were buried, so they had been stored with particular care.
Pearson and biomedical archaeologist Terry Brown took the remains to NERC’s Isotope Geosciences Laboratory where
Prehistoric mummy puzzle
Mummified bodies made of chopped up people? It’s not a legend from ancient Egypt but a find from the Outer Hebrides. Tamera Jones finds out how the latest forensic techniques were applied to the mystery of Britain’s first prehistoric mummies.
scientists used a range of techniques to work out where the bodies might have been kept. These included the rather grisly mercury intrusion porosimetry, which shows how far gut bacteria has eaten into the surrounding bones after death. In this case, not very far; decay had started in the male’s torso but then something had stopped it, and there was no sign of decay in the female corpse at all.
Other techniques showed Pearson and his colleagues that the surfaces of the bones had become demineralised, something that happens in an acidic environment. All the forensic evidence suggested that the bodies had been preserved in a peat bog for several months before being taken out and dried. They must then have been stored above ground for hundreds of years before being merged with other mummified individuals and finally buried.
‘At the time this was the first ever evidence of mummification outside of South America and Egypt,’ says Pearson. ‘Before this, mummification in the British Bronze Age was unheard of.’
Most recently, DNA from the female’s skull, jaw, arm and thigh bones has shown that, just like the male, the woman’s skeleton was made up of at least three individuals – and the cranium and mandible were male.
What led our ancestors to mummify and combine these bodies is anyone’s guess. But Pearson thinks it has something to do with merging ancestries.
‘Lots of fields and ditches were being built across Britain in the middle Bronze Age’, he says. ‘An obvious thing to do would be to coalesce ancestors’ remains as a way of asserting rights over this newly enclosed land.’ n
PREHISTORIC MUMMY
W
Mike P
arker Pearson
Adult male skeleton from Cladh Hallan.
24 PLANET EARTH Autumn 2012
cience and technology have always been intimately linked – technology makes scientific observation and
experimentation possible. Environmental science in particular often uses technology that indirectly senses physical properties – often from afar – and Terrestrial Laser Scanning (TLS), also known as ground-based LiDAR, is the focus of this article.
LiDAR (which stands for Light Detection And Ranging) has been around in some form for several decades, but the size and cost of the equipment has put TLS out of reach of field-based scientists. Now things are different. The size and cost of the equipment have reduced dramatically and we’re seeing an explosion of applications and technological development.
The technology is similar in many ways to its better known cousin, RADAR. Both
Down to Earth
DOWN TO EARTH
S
Remote sensing of our environment used to happen – well – from a distance. Now it seems you can pop some kit on your car and off you go. Nick Tate tells us about some rapid developments in this important technology.
William
Tomp
kinson/Optech Incorp
orated
Predicting and monitoring rock falls at El Capitan, Yosemite National Park, California.
systems determine distance from the time it takes for an electromagnetic signal to reach, and be reflected back from, objects of interest; but while RADAR uses radio waves, LiDAR uses light waves from a low-energy laser.
LiDAR has historically been used on platforms like aircraft or satellites, to survey the landscape below. For example, NASA’s Geoscience Laser Altimeter System (GLAS), which operated from a satellite called ICESat, could measure surface elevations down to tens of centimetres. The measurements are used to produce surface models which can then be further processed to remove things like trees and buildings, depending on what the model is needed for.
It’s already very clever, but recent developments are making the whole process even smarter. LiDAR systems have been
getting smaller, lighter and faster. The latest models can be used on cars and helicopters, and TLS is light enough to be mounted on a tripod. Today’s TLS systems can be as light as 5kg and capture an amazing 1,000,000 measurements every second. The ability to obtain such fast and millimetre-accurate 3D surface models from these systems has produced an explosion of applications, from measuring landslides and cliff erosion to modelling forest canopy and tree geometries, and the characterisation of surfaces like river banks and beds. Often these features have characteristics which can only be captured from an oblique scanning viewpoint which isn’t possible from aircraft and satellites. For example, car-mounted LiDAR systems are increasingly used in cities to capture building frontages. This data can then be fused with roof information gathered from
PLANET EARTH Autumn 2012 25
MORE INFORMATIONThe Earth Observation Technology Cluster involves the Remote Sensing and Photogrammetry Society, the National Centre for Earth Observation, the British Association of Remote Sensing Companies, and the International Society for Photogrammetry and Remote Sensing.
www.eotechcluster.org.uk
Dr Nick Tate is a senior lecturer in geographic information at the University of Leicester. Email: [email protected]
airborne LiDAR to produce very accurate 3D models of cities.
The hardware is getting more specialised all the time, and one of the most exciting recent developments is full waveform TLS. Instead of building up a 3D model from a collection of points sampled from a signal, a full waveform scanner records the full waves of reflected laser energy. The great benefit of this technique is that the extra detail it provides can help us understand complex scenes, for example the mix of leaf, bark, sky and ground you are likely to encounter in a vegetation canopy.
TLS is not without its problems, mostly down to the amount of power the systems need and the large volumes of data they have to deal with. Terabytes of data make serious demands on data storage hardware and processing software.
Sharing knowledge and expertise is
crucial for solving these problems and getting the most out of technological advances. To that end, in 2010 we set up LiDARnet, to bring together the users, suppliers and developers of TLS technology. The network is part of a wider initiative called the Earth Observation Technology Cluster, which helps academics and industry work together to exploit remote sensing technology.
The network has really helped shape the
way forward, identifying training needs, software and data-storage developments, and highlighting the potential for both commercial and non-commercial applications.
Thanks to TLS, we have the best quality 3D data for modelling and testing scientific theories about our environment. And the technology develops apace – an exciting future beckons. n
IT’S ALREADY VERY CLEVER, BUT RECENT DEVELOPMENTS ARE MAKING THE WHOLE PROCESS EVEN SMARTER.
Preparing to survey a lava dome using ground-based LiDAR.
26 PLANET EARTH Autumn 2012
Explaining climate extremes
xtreme events like hurricanes, floods and drought seem to be hitting the headlines all the time. Scientists are often asked whether human influence on the Earth’s climate system is behind these events, and whether
it will affect the frequency or intensity of climate extremes in the future.
This question isn’t just doing the rounds in the media – it’s widely debated among climate researchers too. We know our climate varies with human-induced changes but the problem is it also varies naturally. We have to use complex computer models to work out whether the changes we can see are larger than we would expect from natural variability, and to make predictions about the future state of the climate (see pp18-19). We have to validate our models with long-term observations which are often taken several times a day from a land and ocean observing network around the world.
Scientists don’t just have to understand climate change and extreme weather events – they have to communicate their knowledge in ways non-scientists can use. Catherine Beswick and Nico Caltabiano explain one approach to making climate science accessible.
E
CLIMATE EXTREMES
Reuters/D
enis Sinyakov
Russia’s deadly summer heatwave in 2010 led indirectly to an increase in the price of our staple foods like pasta and bread.
PLANET EARTH Autumn 2012 27PLANET EARTH Autumn 2012 27
MORE INFORMATIONCLIVAR is a project of the World Climate Research Programme: www.clivar.org
Catherine Beswick is acting director and Nico Caltabiano is staff scientist at the ICPO. Email: [email protected].
...PEOPLE HAVE TO HAVE ACCESS TO SCIENCE INFORMATION THAT IS RELEVANT TO THEIR
NEEDS. THIS IS WHERE ORGANISATIONS LIKE CLIVAR ARE MAKING A DIFFERENCE.
Making this happen requires logistical preparation and coordination on an international scale. And communicating the results in a way that makes sense to non-scientists around the world is another skill entirely.
Drawing together climate research from around the world, the Climate Variability and Predictability (CLIVAR) project is coordinating activities that will provide relevant scientific results that people can use to help them adapt to and mitigate the effects of climate change. CLIVAR’s international project office (ICPO) has been hosted by the National Oceanography Centre in Southampton for the past 13 years.
This coordination work is crucial because understanding and predicting future extreme climatic events isn’t just a scientific pursuit; it’s an important economic, environmental and social investment for the whole planet. It’s easy to understand why when you look at the damage caused by recent extreme events.
The heatwave that swept across Europe in 2003 claimed over 30,000 lives, reportedly the highest death toll from a natural hazard in 50 years. And diverse effects were felt further afield: the agricultural sector suffered as the drought affected the quality and quantity of crops as diverse as potatoes, cereals and wine, and even animal fodder. This came hand in hand with an increase in production costs. Meanwhile, forest fires raged throughout several countries on the Continent, and glacial retreat in the Alps accelerated during the event.
The indirect impacts of these events are a big problem too. The energy sector suffered in 2003 because the heatwave caused river levels to drop, forcing nuclear plants to shut down because they didn’t have enough water to cool the reactors. The situation was made even worse because the demand for power increased as air conditioning units and extra refrigerators were turned on across the continent.
The UK felt the effects of the 2010 heatwave in Russia, which led indirectly to an increase in the price of our staple goods like pasta and bread. This was because Russia’s wheat crops failed, and with less available for export, countries like the UK had to look to China to bolster supplies, which pushed up the price of wheat and wheat-based products.
All this highlights how important it is for policy-makers, and others who rely on accurate climate predictions, to have access to clear information at the right time. In
the same way that you and I might rely on the weather forecast to decide whether to have a barbecue or put the washing out, others need climate information to make strategic decisions on slightly longer timescales.
For example, farmers need to know how much rain will come during the following growing season. If drier conditions are predicted, they may decide to invest in irrigation, or plant crops more tolerant to drought conditions. Looking even further ahead, a national health service in a tropical country needs to know when wet and hot weather is coming so they can plan for the increased outbreaks of malaria these conditions typically cause. Similarly, water companies need to plan ahead to make sure supplies do not run dry. Governments and local authorities need even longer forecasts, so they can use climate information to plan adaptation strategies, from national water-supply strategies to strengthening sea defences against rising sea levels and more intense storms.
The difficulty is in translating the language of graphs, trends and uncertainty into something that can be applied to real-world circumstances, as well as the more traditional language barriers we encounter when providing guidance to international communities. But even more importantly, people have to have access to science
information that is relevant to their needs. This is where organisations like CLIVAR are making a difference.
Some key organisations can play a vital role by providing a link in the chain of communication, working with local communities to help interpret scientific information. For example, CLIVAR is working with the UK Met Office, to coordinate the transfer of expertise, including state-of-the-art climate research, so that national meteorological services in developing countries are better equipped to provide information to their own user communities.
These climate services are increasingly the focus for CLIVAR, helping people turn science into action. The international project office in particular is acting as a conduit between scientists and science-users, and building on existing local and regional activities to help people around the world prepare for future climate changes. n
Karsten Schneider/Science Photo Library
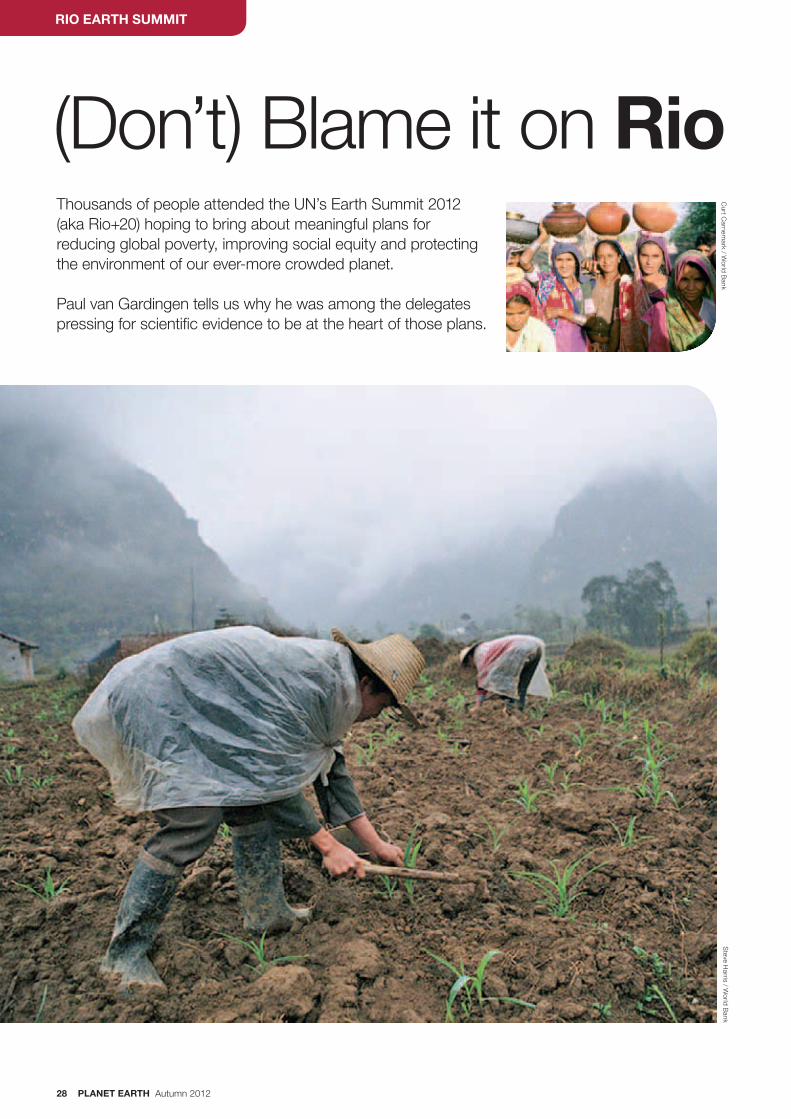
28 PLANET EARTH Autumn 2012
(Don’t) Blame it on RioThousands of people attended the UN’s Earth Summit 2012 (aka Rio+20) hoping to bring about meaningful plans for reducing global poverty, improving social equity and protecting the environment of our ever-more crowded planet.
Paul van Gardingen tells us why he was among the delegates pressing for scientific evidence to be at the heart of those plans.
RIO EARTH SUMMIT
Steve H
arris / World B
ankC
urt Carnem
ark / World B
ank
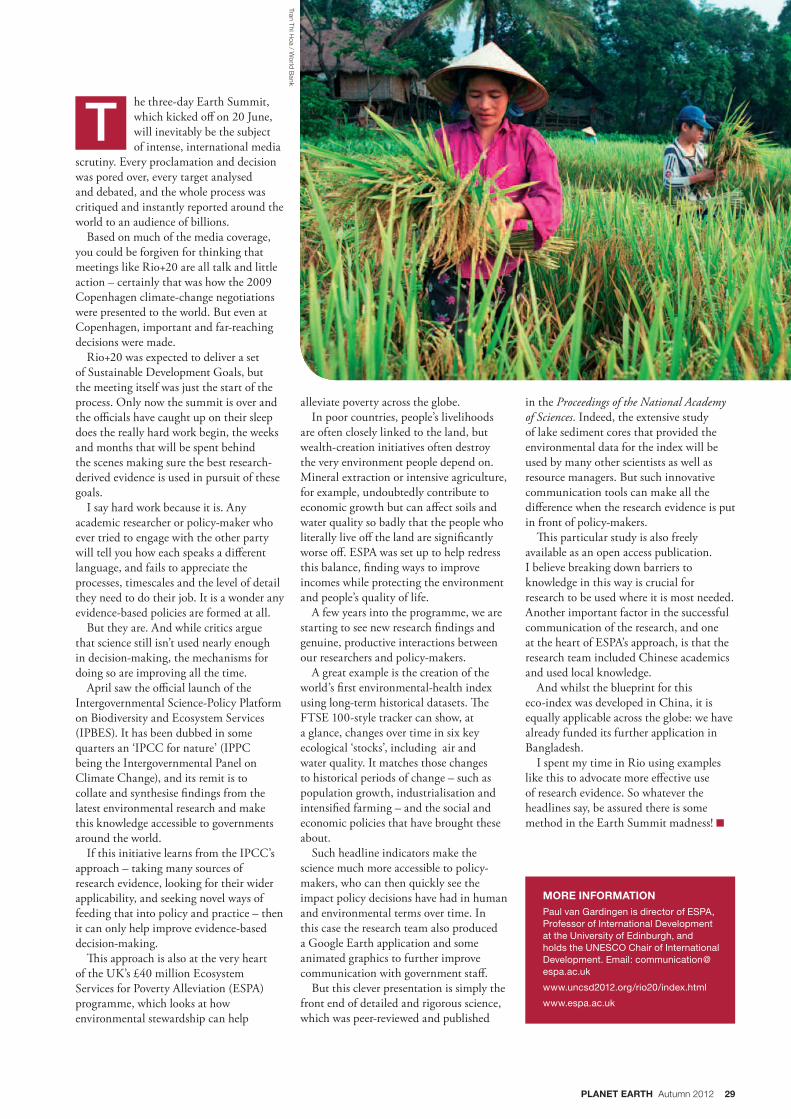
PLANET EARTH Autumn 2012 29
he three-day Earth Summit, which kicked off on 20 June, will inevitably be the subject of intense, international media
scrutiny. Every proclamation and decision was pored over, every target analysed and debated, and the whole process was critiqued and instantly reported around the world to an audience of billions.
Based on much of the media coverage, you could be forgiven for thinking that meetings like Rio+20 are all talk and little action – certainly that was how the 2009 Copenhagen climate-change negotiations were presented to the world. But even at Copenhagen, important and far-reaching decisions were made.
Rio+20 was expected to deliver a set of Sustainable Development Goals, but the meeting itself was just the start of the process. Only now the summit is over and the officials have caught up on their sleep does the really hard work begin, the weeks and months that will be spent behind the scenes making sure the best research-derived evidence is used in pursuit of these goals.
I say hard work because it is. Any academic researcher or policy-maker who ever tried to engage with the other party will tell you how each speaks a different language, and fails to appreciate the processes, timescales and the level of detail they need to do their job. It is a wonder any evidence-based policies are formed at all.
But they are. And while critics argue that science still isn’t used nearly enough in decision-making, the mechanisms for doing so are improving all the time.
April saw the official launch of the Intergovernmental Science-Policy Platform on Biodiversity and Ecosystem Services (IPBES). It has been dubbed in some quarters an ‘IPCC for nature’ (IPPC being the Intergovernmental Panel on Climate Change), and its remit is to collate and synthesise findings from the latest environmental research and make this knowledge accessible to governments around the world.
If this initiative learns from the IPCC’s approach – taking many sources of research evidence, looking for their wider applicability, and seeking novel ways of feeding that into policy and practice – then it can only help improve evidence-based decision-making.
This approach is also at the very heart of the UK’s £40 million Ecosystem Services for Poverty Alleviation (ESPA) programme, which looks at how environmental stewardship can help
(Don’t) Blame it on Rio
alleviate poverty across the globe.In poor countries, people’s livelihoods
are often closely linked to the land, but wealth-creation initiatives often destroy the very environment people depend on. Mineral extraction or intensive agriculture, for example, undoubtedly contribute to economic growth but can affect soils and water quality so badly that the people who literally live off the land are significantly worse off. ESPA was set up to help redress this balance, finding ways to improve incomes while protecting the environment and people’s quality of life.
A few years into the programme, we are starting to see new research findings and genuine, productive interactions between our researchers and policy-makers.
A great example is the creation of the world’s first environmental-health index using long-term historical datasets. The FTSE 100-style tracker can show, at a glance, changes over time in six key ecological ‘stocks’, including air and water quality. It matches those changes to historical periods of change – such as population growth, industrialisation and intensified farming – and the social and economic policies that have brought these about.
Such headline indicators make the science much more accessible to policy-makers, who can then quickly see the impact policy decisions have had in human and environmental terms over time. In this case the research team also produced a Google Earth application and some animated graphics to further improve communication with government staff.
But this clever presentation is simply the front end of detailed and rigorous science, which was peer-reviewed and published
in the Proceedings of the National Academy of Sciences. Indeed, the extensive study of lake sediment cores that provided the environmental data for the index will be used by many other scientists as well as resource managers. But such innovative communication tools can make all the difference when the research evidence is put in front of policy-makers.
This particular study is also freely available as an open access publication. I believe breaking down barriers to knowledge in this way is crucial for research to be used where it is most needed. Another important factor in the successful communication of the research, and one at the heart of ESPA’s approach, is that the research team included Chinese academics and used local knowledge.
And whilst the blueprint for this eco-index was developed in China, it is equally applicable across the globe: we have already funded its further application in Bangladesh.
I spent my time in Rio using examples like this to advocate more effective use of research evidence. So whatever the headlines say, be assured there is some method in the Earth Summit madness! n
MORE INFORMATIONPaul van Gardingen is director of ESPA, Professor of International Development at the University of Edinburgh, and holds the UNESCO Chair of International Development. Email: [email protected]
www.uncsd2012.org/rio20/index.html
www.espa.ac.uk
T
Tran Thi Hoa / W
orld Bank
Natural Environment Research Council, Polaris House, North Star Avenue, Swindon, SN2 1EU, UK.
Tel: 01793 411500
www.nerc.ac.uk
Back issues
Available as downloads from http://planetearth.nerc.ac.uk