Embed Size (px)
Citation preview

CDR Program ATBD-FCDR-SSMIS-v1.docx
Climate Data Record (CDR) Program
Climate Algorithm Theoretical Basis Document (C-ATBD)
Fundamental Climate Data Record (FCDR) for the Special Sensor Microwave Imager/Sounder
(SSMIS)
CDR Program Document Number: CDRP-TMP-0006 Originator Document Number: TBD Version 1.0 / July 12, 2013

CDR Program FCDR for SSMIS C-ATBD CDR Doc. No. CDRP-TMP-0006
Page 1
RESPONSIBILITY
Prepared By: Wesley Berg Project Lead Colorado State Univ. Signature Date
Reviewed By: Christian Kummerow Principal Investigator Colorado State Univ. Signature Date
Reviewed By: <Name> <Title> <Organization> Signature Date
Approved By: <Name> <Title> <Organization> Signature Date
Approved By: <Name> <Title> <Organization> Signature Date
REVISION HISTORY
Version/ Revision
Author Description Revised Sections
Date
V01R00 Wesley Berg Colorado State Univ.
Initial submission to CDR Program
New Document
07/12/2013

CDR Program FCDR for SSMIS C-ATBD CDR Doc. No. CDRP-TMP-0006
Page 2
TABLE of CONTENTS
1. INTRODUCTION ....................................................................................................... 6 1.1 Purpose .............................................................................................................................................. 6 1.2 Definitions ........................................................................................................................................... 6 1.3 Document Maintenance ...................................................................................................................... 6
2. OBSERVING SYSTEMS OVERVIEW ....................................................................... 6 2.1 Products Generated ........................................................................................................................... 6 2.2 Instrument Characteristics .................................................................................................................. 7
3. ALGORITHM DESCRIPTION .................................................................................... 9 3.1 Algorithm Overview ............................................................................................................................ 9 3.2 Processing Outline ............................................................................................................................. 9 3.2.1 Read Input ..................................................................................................................................... 11 3.2.2 Calculate Ephemeris ..................................................................................................................... 11 3.2.3 Calculate Geolocation ................................................................................................................... 11 3.2.4 Quality Control ............................................................................................................................... 13 3.2.5 Solar and Lunar Intrusion Correction ............................................................................................. 14 3.2.6 Cross-track Bias Correction ........................................................................................................... 14 3.2.7 Ta to Tb Conversion ...................................................................................................................... 15 3.2.8 Sun-Angle Correction .................................................................................................................... 15 3.2.9 Intercalibration ............................................................................................................................... 18 3.2.10 Write Output ................................................................................................................................ 20 3.3 Algorithm Input ................................................................................................................................. 20 3.3.1 Primary Sensor Data ..................................................................................................................... 20 3.3.2 Ancillary Data ................................................................................................................................ 20 3.3.3 Derived Data .................................................................................................................................. 20 3.3.4 Forward Models ............................................................................................................................. 21 3.4 Theoretical Description ..................................................................................................................... 21 3.4.1 Physical and Mathematical Description ......................................................................................... 21 3.4.2 Data Merging Strategy ................................................................................................................... 22 3.4.3 Numerical Strategy ........................................................................................................................ 22 3.4.4 Calculations ................................................................................................................................... 22 3.4.5 Look-Up Table Description ............................................................................................................ 23 3.4.6 Parameterization ........................................................................................................................... 24 3.4.7 Algorithm Output ............................................................................................................................ 24
4. TEST DATASETS AND OUTPUTS ........................................................................ 25 4.1 Test Input Datasets .......................................................................................................................... 25 4.2 Test Output Analysis ........................................................................................................................ 25 4.2.1 Reproducibility ............................................................................................................................... 25 4.2.2 Precision and Accuracy ................................................................................................................. 25 4.2.3 Error Budget .................................................................................................................................. 25
5. PRACTICAL CONSIDERATIONS ........................................................................... 26 5.1 Numerical Computation Considerations ........................................................................................... 26 5.2 Programming and Procedural Considerations .................................................................................. 26

CDR Program FCDR for SSMIS C-ATBD CDR Doc. No. CDRP-TMP-0006
Page 3
5.3 Quality Assessment and Diagnostics ............................................................................................... 26 5.4 Exception Handling ........................................................................................................................... 27 5.4.1 Conditions Checked ...................................................................................................................... 27 5.4.2 Conditions Not Checked ................................................................................................................ 27 5.4.3 Conditions Not Considered Exceptions ......................................................................................... 27 5.5 Algorithm Validation .......................................................................................................................... 28 5.5.1 Validation during Development ...................................................................................................... 28 5.6 Processing Environment and Resources ......................................................................................... 30
6. ASSUMPTIONS AND LIMITATIONS ...................................................................... 31 6.1 Algorithm Performance ..................................................................................................................... 31 6.2 Sensor Performance ......................................................................................................................... 31
7. FUTURE ENHANCEMENTS ................................................................................... 31 7.1.1 Cross-track bias corrections .......................................................................................................... 31 7.1.2 Warm scene intercalibration .......................................................................................................... 32 7.1.3 Further investigation into sun-angle dependent errors .................................................................. 32
8. REFERENCES ........................................................................................................ 32

CDR Program FCDR for SSMIS C-ATBD CDR Doc. No. CDRP-TMP-0006
Page 4
LIST of FIGURES
Search Word online help for “Add or delete captions” for assistance with this table
Figure 1: SSMIS Scan Configuration. ....................................................................................... 7
Figure 2: FCDR for SSMIS Outline Processing Flowchart. ................................................... 10
Figure 3: Diagram showing (a) the local zenith (up), east and west vectors on Earth’s surface relative to the GCI frame; and (b) the zenith and azimuth angles relative to the pointing vector D. ..................................................................................................................... 12
Figure 4: Diagram of angles associated with the solar beta angle. ..................................... 13
Figure 5: Delta Tb differences based on double differences with TMI as a function of scene temperature for ascending (red) and descending (blue) scans. The original values are shown by the dashed lines, while the final results after the application of the sun-angle correction are shown by the solid lines. ...................................................................... 17
Figure 6: Plots of intercalibration estimates from each implementation by channel for F13-F16. ..................................................................................................................................... 19
Figure 7: Time series of a) total precipitable water, b) ocean surface wind speed, and c) cloud liquid water path based on the nine DMSP sensors comprising the SSM/I and SSMIS FCDR. ............................................................................................................................. 29
LIST of TABLES
Search Word online help for “Add or delete captions” for assistance with this table
Table 1: SSMIS channel characteristics ................................................................................... 8
Table 2: Mean Tb differences for ascending minus descending scans .............................. 18
Table 3: Mean Tb differences for ascending minus descending scans after sun-angle correction. ................................................................................................................................. 18
Table 4: Error Budget ............................................................................................................... 26
Table 5: Processing Environment ........................................................................................... 30

CDR Program FCDR for SSMIS C-ATBD CDR Doc. No. CDRP-TMP-0006
Page 5
ACRONYMS AND ABBREVIATIONS
Acronym or Abbreviation
Meaning
APC Antenna Pattern Correction CATBD Climate Algorithm Theoretical Basis Document CDR Climate Data Record DMSP Defense Meteorological Satellite Program FCDR Fundamental Climate Data Record FNMOC Fleet Numerical Meteorology and Oceanography Center GPSr9 SSMIS Ground Processing Software revision 9 LAS Lower Atmospheric Sounding NCDC National Climatic Data Center NOAA National Oceanic and Atmospheric Administration NRL Naval Research Laboratory SDR Sensor Data Record (contains Tb data) SGP4 Simplified General Perturbations orbital model SSM/I Special Sensor Microwave/Imager SSMIS Special Sensor Microwave Imager/Sounder TA Antenna Temperature TB Brightness Temperature TDR Temperature Data Record (contains Ta data) TLE Two Line Element UAS Upper Atmospheric Sounding

CDR Program FCDR for SSMIS C-ATBD CDR Doc. No. CDRP-TMP-0006
Page 6
1. Introduction 1.1 Purpose The purpose of this document is to describe the algorithm used to create the Colorado State University (CSU) Fundamental Climate Data Record (FCDR) of brightness temperature data from the Special Sensor Microwave Imager Sounder (SSMIS) instruments currently operating on board the Defense Meteorological Satellite Program (DMSP) spacecraft F16, F17, and F18. The actual algorithm is defined by the computer program (code) that accompanies this document, and thus the intent here is to provide a guide to understanding that algorithm, from both a scientific perspective and in order to assist a software engineer performing an evaluation of the code.
1.2 Definitions None Currently
1.3 Document Maintenance Synchronization between this document and the algorithm is achieved through version and revision numbers. The version and revision numbers found on the front cover of this document can be compared with the values of VERSION and REVISION in the source file params.h and in the FCDR filenames and metadata. If the document applies to the algorithm, then these numbers will match. If they don’t match and it is found that the document needs to be updated, then the header comment in the file ssmis_fcdr.c should be consulted – under its HISTORY section is a description of the changes for each version and revision from which the necessary updates to this document can be made.
2. Observing Systems Overview 2.1 Products Generated The data product generated by this algorithm is the Fundamental Climate Data Record (FCDR) of brightness temperature (Tb) data from the SSMIS sensors, including five low-resolution channels (Tb19v, Tb19h, Tb22v, Tb37v, Tb37h) and two high-resolution channels (Tb91v, Tb91h), stored in netCDF version 4.0 files that include the necessary metadata and supplementary data fields. In addition to the seven intercalibrated SSM/I equivalent channels listed above, the output FCDR file also contains the Tb and geolocation information from the remaining imager (150 and 183 GHz channels), lower atmospheric sounder (50 – 60 GHz), and upper atmospheric sounder channels (60 – 63 GHz) with limited corrections and no intercalibrated applied. The data fields are described in detail section 3.4.7 below.

CDR Program FCDR for SSMIS C-ATBD CDR Doc. No. CDRP-TMP-0006
Page 7
2.2 Instrument Characteristics Data input to this algorithm in from the SSMIS instruments on board the DMSP satellites F16, F17 and F18. The DMSP series satellites are in sun-synchronous polar orbits at an altitude of approximately 833 km. The instrument is a conically scanning passive microwave radiometer sensing upwelling microwave radiation at 24 channels covering a wide range of frequencies from 19 – 183 GHz. Data is collected along an active scan of 143.2 degrees across track producing a swath width on the ground of approximately 1707 km with 12.5 km scene spacing. This configuration is shown in Figure 1. Detailed specifications for the spacecraft and instrument are found in Northrop Grumman (2002).
The channels consist of the following sets: Environmental sensor (ENV) – channels 12-16; Imager (IMG) – channels 8-11 and 17-18; Lower atmospheric sounding (LAS) – channels 1-7 and 24; Upper atmospheric sounding (UAS) – channels 19-23. Of these channels, the SSM/I equivalent channels include all of the environmental channels (12-16) and imager channels 17 and 18. Note that only the Tb from these seven window channels are intercalibrated with the other DMSP window-channel microwave radiometers (i.e. SSM/I and SSMIS). Detailed channel characteristics for all channels are shown in Table 1.
Figure 1: SSMIS Scan Configuration.

CDR Program FCDR for SSMIS C-ATBD CDR Doc. No. CDRP-TMP-0006
Page 8
Intercalibrated window channels (i.e. FCDR channels): Center Frequencies (GHz) 19.35 19.35 22.235 37.0 37.0 91.655 91.655 Channel Number 13 12 14 16 15 17 18 Polarization V H V V H V H Bandwidth (MHz) 400 400 450 1500 1500 1500 1500 Sensitivity (K) 0.7 0.7 0.7 0.5 0.5 0.9 0.9 EFOV (along track x across track in km)
74 x 45 74 x 45 74 x 45 45 x 28 45 x 28 16 x 13 16 x 13
Sampling Interval (along track x across track in km)
12.5 x 25 12.5 x 25 12.5 x 25 12.5 x 25 12.5 x 25 12.5 x 12.5
12.5 x 12.5
Moisture sounding channels (no intercalibration applied): Center Frequencies (GHz) 150.0 183.31±1 183.31±3 183.31±7 Channel Number 8 11 10 9 Polarization H H H H Bandwidth (MHz) 1500 500 1000 1500 Sensitivity (K) 0.88 1.25 1.0 1.2 EFOV (along track x across track in km) 16 x 13 16 x 13 16 x 13 16 x 13 Sampling Interval (along track x across track in km) 12.5 x 12.5 12.5 x 12.5 12.5 x 12.5 12.5 x 12.5
Lower atmospheric temperature sounding channels (no intercalibration applied): Center Frequencies (GHz) 50.3 52.8 53.596 54.40 55.50 57.29 59.4 Channel Number 1 2 3 4 5 6 7 Polarization H H H H H RC RC Bandwidth (MHz) 400 400 400 400 400 350 250 Sensitivity (K) 0.4 0.4 0.4 0.4 0.4 0.5 0.6 EFOV (along track x across track in km)
27 x 18 27 x 18 27 x 18 27 x 18 27 x 18 27 x 18 27 x 18
Sampling Interval (along track x across track in km)
12.5 x 37.5
12.5 x 37.5
12.5 x 37.5
12.5 x 37.5
12.5 x 37.5
12.5 x 37.5
12.5 x 37.5
Upper atmospheric temperature sounding channels (no intercalibration applied): Center Frequencies (GHz) 50.3 52.8 53.596 54.40 55.50 57.29 Channel Number 19 20 21 22 23 24 Polarization RC RC RC RC RC RC Bandwidth (MHz) 1.5 1.5 1.5 3.0 8.0 30.0 Sensitivity (K) 2.4 2.4 1.8 1.0 0.6 0.7 EFOV (along track x across track in km)
27 x 18 27 x 18 27 x 18 27 x 18 27 x 18 27 x 18
Sampling Interval (along track x across track in km)
12.5 x 75 12.5 x 75 12.5 x 75 12.5 x 75 12.5 x 75 12.5 x 75
Table 1: SSMIS channel characteristics
CDR Program FCDR for SSMIS C-ATBD CDR Doc. No. CDRP-TMP-0006
Page 9
Channel characteristics shown above are from:
• Northrop Grumman (2002), Table 1 (Bandwidth), Table 3 (EFOV, Sampling Interval).
• Kunkee et al. 2008, Table II (Sensitivity).
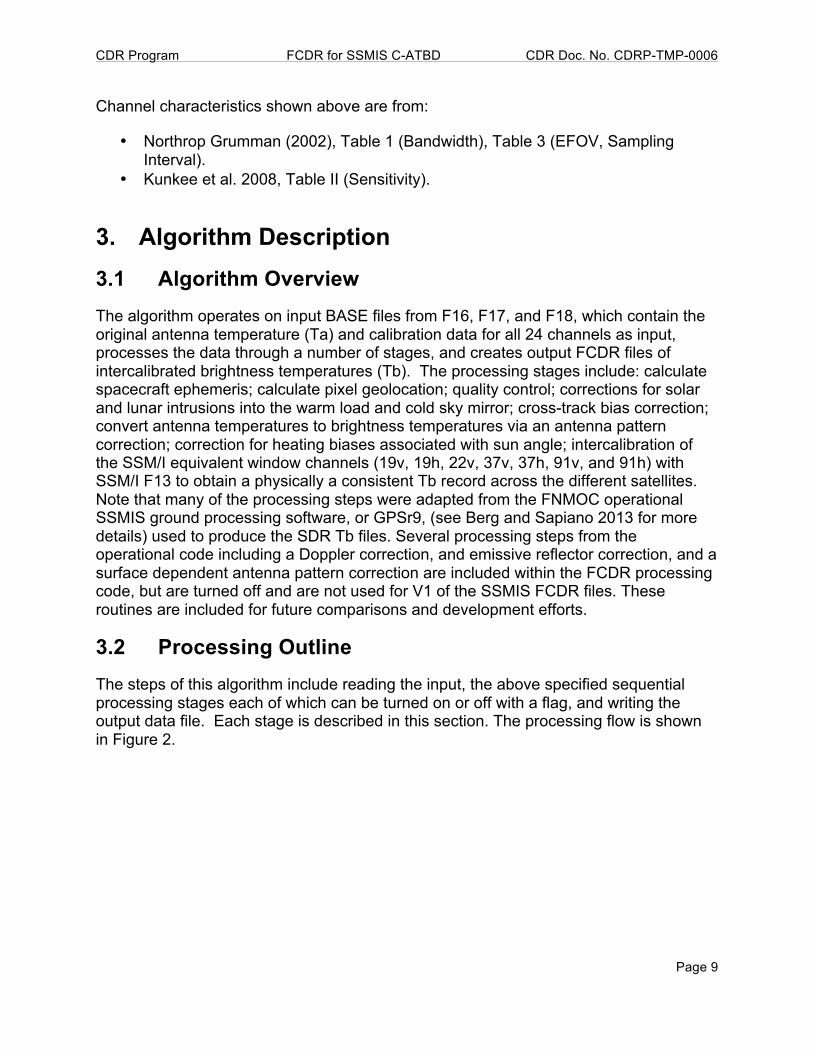
3. Algorithm Description 3.1 Algorithm Overview The algorithm operates on input BASE files from F16, F17, and F18, which contain the original antenna temperature (Ta) and calibration data for all 24 channels as input, processes the data through a number of stages, and creates output FCDR files of intercalibrated brightness temperatures (Tb). The processing stages include: calculate spacecraft ephemeris; calculate pixel geolocation; quality control; corrections for solar and lunar intrusions into the warm load and cold sky mirror; cross-track bias correction; convert antenna temperatures to brightness temperatures via an antenna pattern correction; correction for heating biases associated with sun angle; intercalibration of the SSM/I equivalent window channels (19v, 19h, 22v, 37v, 37h, 91v, and 91h) with SSM/I F13 to obtain a physically a consistent Tb record across the different satellites. Note that many of the processing steps were adapted from the FNMOC operational SSMIS ground processing software, or GPSr9, (see Berg and Sapiano 2013 for more details) used to produce the SDR Tb files. Several processing steps from the operational code including a Doppler correction, and emissive reflector correction, and a surface dependent antenna pattern correction are included within the FCDR processing code, but are turned off and are not used for V1 of the SSMIS FCDR files. These routines are included for future comparisons and development efforts.
3.2 Processing Outline The steps of this algorithm include reading the input, the above specified sequential processing stages each of which can be turned on or off with a flag, and writing the output data file. Each stage is described in this section. The processing flow is shown in Figure 2.

CDR Program FCDR for SSMIS C-ATBD CDR Doc. No. CDRP-TMP-0006
Page 10
Figure 2: FCDR for SSMIS Outline Processing Flowchart.

CDR Program FCDR for SSMIS C-ATBD CDR Doc. No. CDRP-TMP-0006
Page 11
3.2.1 Read Input
Data from the input BASE file (see section 3.3.3), optional two-line element (TLE) files (see section 3.3.2), and look-up tables (see section 3.4.5), is read and stored in global variables that are accessed by the subsequent steps. Space is allocated to store output data and certain fields are prepopulated from the input data.
3.2.2 Calculate Ephemeris
The spacecraft position and velocity have been precomputed from TLE orbital elements files and are stored in the input BASE files. Because the TLE files are not generally publicly available and cannot be publicly distributed at this time, the algorithm currently uses the precomputed spacecraft position and velocity data stored in the input BASE files. The Simplified General Perturbations (SGP4) code used to compute the spacecraft position and velocity from the TLE files, however, is included as part of the FCDR algorithm package. Given available TLE files the option to recompute the spacecraft ephemeris is available within the code. For the initial FCDR processing this option was turned off and the position and velocity information stored in the BASE files was used. When this processing stage is turned on, a flag additionally allows a choice between recomputing the ephemeris from the TLE when the time of the TLE is closer than that used in the BASE file or regardless of timing.
3.2.3 Calculate Geolocation
Taking as input the spacecraft position and velocity along with sensor mount angle data and spacecraft orientation data, the geolocation or latitude and longitude of each pixel is calculated and stored. Additional information related to the spacecraft view angles and associated sun angles are also computed. These include the satellite zenith and azimuth angles and solar zenith and azimuth angles, which provide the direction of the satellite and the sun from the normal to the Earth for each pixel. The satellite zenith angle is also referred to as the Earth incidence angle (EIA), which is extremely important for retrieval algorithms as it affects the resulting Tb. The sun glint angle is also computed and provided to identify potential specular reflection from the sun over water surfaces that may also impact retrieval algorithms. Additional information computed at this stage includes angles relating the position of the sun relative to the spacecraft direction of motion, whether or not the spacecraft is in the Earth’s shadow, and the time since the spacecraft entered into the Earth’s shadow or time since eclipse. Only the EIA and sun glint angles are written out in the FCDR files, but the other angles/fields are computed for analysis purposes. Monthly estimates of the spacecraft attitude, or roll, pitch, and yaw angles, were estimated based on a coastline analysis, which is described in detail by Berg et al. (2013). The geolocation calculation is described in detail in a CSU technical report by Sapiano et al. (2010). The following values are calculated:

CDR Program FCDR for SSMIS C-ATBD CDR Doc. No. CDRP-TMP-0006
Page 12
3.2.3.1 Pixel Geolocation (Geodetic Latitude and Longitude)
The process for calculating the pixel latitude and longitude starts with the calculation of the Instantaneous Field-Of-View (IFOV) matrix in sensor coordinates. Several rotations are required to obtain the IFOV in Geocentric Inertial (GCI) coordinates. First there is the sensor-to-spacecraft rotation that obtains the IFOV relative to the spacecraft. Next there is the spacecraft-to-orbital (geodetic nadir pointing) rotation that obtains the IFOV relative to the path of the spacecraft. Finally, there is the orbital-to-GCI rotation that obtains the IFOV in GCI coordinates. With the IFOV in GCI coordinates, the intersection of the IFOV with the oblate spheroid used to model Earth is calculated and this is then used to get geocentric, then geodetic latitude and longitude.
3.2.3.2 Satellite Zenith and Azimuth
In order to calculate the satellite zenith (aka Earth Incidence Angle) and azimuth angles, it is necessary to first determine the local zenith (up), north and east vectors. The satellite zenith angle is the angle between the local up vector and the pointing vector and the azimuth angle is the angle between the projection of the pointing vector on the surface and the local north vector where positive azimuth angle is clockwise when viewed from above.
Figure 3: Diagram showing (a) the local zenith (up), east and west vectors on Earth’s surface relative to the GCI frame; and (b) the zenith and azimuth angles relative to the pointing vector D.
3.2.3.3 Solar Angles
Various solar angles are calculated based on the Sun position vector in GCI coordinates determined as described in Appendix C, section C4 of Sapiano et al. (2010). Solar beta angle, sun glint angle, and solar zenith and azimuth angles are found using the Sun

CDR Program FCDR for SSMIS C-ATBD CDR Doc. No. CDRP-TMP-0006
Page 13
position vector. The time since eclipse is also calculated to provide information on solar heating of the spacecraft based on how long it has been in sunlight or shadow.
Figure 4: Diagram of angles associated with the solar beta angle.
3.2.4 Quality Control
The quality control processing stage (qual_control.c) consists of multiple procedures, which check for potentially erroneous data, correct it if possible, and set the corresponding quality flag. Note that the quality control is done on the input Ta prior to the application of the antenna pattern correction (APC). The quality flag values are specified in the file metadata and are defined in the include file quality_flags.h. There is a quality flag value for each scan and pixel, with one flag for each of the six feedhorns (env1, env2, img1, img2, las, and uas). The flag values consist of three categories with a value of zero indicating good data, values between 1 and 99 indicating a warning or caution, and values from 100 and above indicating an error. For pixels with flag values >= 100 the affected Tb are subsequently set to missing. The warning flags provide the user information on potential issues, which are often algorithm dependent. For example, a quality flag value of 1 indicates possible sun glint, which is only an issue over reflective surfaces like water and is not an issue at all for some retrievals. Note that many of the quality control checks are currently only applied to the seven FCDR channels, although basic geolocation and non-physical pixel checks are done for all of the channels. A short description of the various quality control procedures follows. Additional details on the quality control procedures are available in the CSU technical report by Berg and Rodriguez-Alvarez (2013).
3.2.4.1 Check BASE file
Some quality control checks were done during the creation of the BASE files including checks for scan time errors leading to erroneous pixel geolocation and/or large variance from climatology for multiple data scans. The pixel geolocation check is done for all channels, while the climatology check only applies to the FCDR or SSM/I equivalent

CDR Program FCDR for SSMIS C-ATBD CDR Doc. No. CDRP-TMP-0006
Page 14
channels. This routine sets the associated FCDR quality flag and sets the affected output Tb to missing.
3.2.4.2 Check Pixel
Ta values outside of specified minimum and maximum thresholds (i.e. nonphysical) have the appropriate quality flag set and the affected Ta are set to missing.
3.2.4.3 Check Environmental Sensor Channels
For each environmental channel, scans where the fraction of pixels with Ta that differ from the mean (determined as described in section 3.4.5.2) by more than 3 standard deviations exceeds a threshold, the data is flagged as having a climatology issue. Two levels of climatology issues are identified. A climatology warning occurs for scans near the threshold (within 5%) and the Ta data is retained. For scans exceeding the threshold, a climatology error occurs and the Ta data is set to missing. Anomalous jumps between adjacent scans are also flagged.
3.2.4.4 Check Imager Channels
The same check used for the environmental sensor channels (19, 22, and 37 GHz) are also applied to the 91 GHz imager channels.
3.2.5 Solar and Lunar Intrusion Correction
Corrections are applied to the Ta to account for solar and lunar intrusions into the warm load and the cold-sky mirror. The corrections are based on those applied in the SSMIS Ground Processing Software revision 9 (GPSr9) of July 2010. The solar intrusions are corrected by calculating a corrected (FFT smoothed) gain that is used during periods with solar intrusions (note that this gain includes the corrections for lunar intrusions). A single channel is used to detect solar intrusions (91V for F16 and F18; 91H for F17) and the gain for this channel is smoothed using FFT smoothing. A solar intrusion is identified when peaks in the smoothed gain exceed set thresholds and the gain is replaced during these times with a smoothed, interpolated gain. Additional details are available in the CSU technical report on corrections and APC for SSMIS Ta to Tb (Berg and Sapiano 2013).
3.2.6 Cross-track Bias Correction
A falloff in the Ta occurs near the edge of the scan due to obstructions affecting the side lobes of the antenna pattern. The most pronounced decrease is on the right side of the scan, which results in a decrease in the mean observed Ta of several percent or more relative to the center of the scan. An analysis of clear-sky ocean scenes was done for each sensor to determine the magnitude of this falloff. Based on this analysis a scale factor was computed for each pixel position with the center pixel defined as having a multiplier of 1.0. These scale factors are stored in the files F**_ctb_may12.dat. The cross-track biases are subsequently removed from the Ta by dividing each value by the
CDR Program FCDR for SSMIS C-ATBD CDR Doc. No. CDRP-TMP-0006
Page 15
scale factor correction derived for the given satellite, channel, and pixel position along the scan. These correction coefficients are obtained from the look-up table described in section 3.4.5.3.
3.2.7 Ta to Tb Conversion
The SSM/I equivalent channels have both a cross-polarization and spillover correction applied. For the remaining channels only the spillover corrections is applied. Note that in the ground processing software (GPSr9) a surface-dependent antenna pattern correction (APC) is applied for the SSM/I equivalent channels. For climate applications, however, it was determined that tying the APC to the surface type could lead to regional biases and thus the decision was made to use the original cross-pol and spillover corrections and to separately apply a scene-dependent temperature intercalibration. . Additional details are available in the CSU technical report on corrections and APC for SSMIS Ta to Tb (Berg and Sapiano 2013).
3.2.8 Sun-Angle Correction
A number of issues related to the heating and/or position of the sun were found to impact the observed SSMIS Tb on the original F16 spacecraft (Kunkee et al. 2008a, Bell et al. 2008). These included both direct and indirect intrusions into the warm load and an emissive reflector. As noted by Kunkee et al. (2008b), “recent laboratory measurements of other SSMIS flight-unit reflectors have indicated the possibility of extremely low surface electrical conductivities of F-16 (S/N 02) and F-17 (S/N 04) reflectors (e.g., 0.14–0.23 MS/m for S/N 03 and 0.54–1.2 MS/m for S/N 05) compared with pure aluminum (36 MS/m). Further analysis suggests that the low conductivities may be due to excessive surface roughness in combination with insufficient VDA thickness as the likely source of the large reflector emissivity. As part of the Cal/Val team recommendations, procedures to measure the electrical conductivity and emissivity of the reflectors are now part of the preflight readiness analysis for future SSMIS instruments. The main reflector of the third SSMIS instrument (F-18) scheduled for launch in mid-2008 has been replaced with a spare reflector having significantly higher conductivity (17–18.5 MS/m).” Analysis of the emissive reflector issue by Berg and Sapiano (2013) indicates that it is much less of a factor with F18, with the 91 GHz channels on F17 showing the largest impact. With regard to the issue of solar intrusions into the warm load, prior to the launch of F17 a fence was installed to eliminate direct solar intrusions into the warm load and the temperature sensor on the reflector arm was relocated to the back of the reflector to better characterize the impact of the emissive reflector (Bell et al. 2008). These changes were also made to the SSMIS on board F18, however, in addition a change was made to the reflective cover on the canister top to further reduce solar reflections into the warm load, but subsequently causing the instrument to run hotter and changing the characteristics of the calibration errors (Dave Kunkee, email communication).
As described by Berg and Sapiano (2013), anomalous jumps in the radiometer gain were identified and removed using a fourier smoothing technique in the operational

CDR Program FCDR for SSMIS C-ATBD CDR Doc. No. CDRP-TMP-0006
Page 16
GPSr9 software. While this correction was implemented in the FCDR code to minimize the effect of these intrusions, it appears there may be residual biases associated with these intrusion events in the Tb data. According to Bell et al. (2008) “Despite the progress made in correcting the data, significant local biases remain in the data: leakage of intrusion affected observations due to inadequacies in the intrusion map, in the region of emergence from the Earth shadow, and an ascending/descending node bias”. Using observed minus background residuals from data assimilation of the SSMIS Tb, Kunkee et al. (2008b) and Bell et al. (2008) solved for the apparent emissivity of the reflector for each of the channels. While Bell et al. (2008) found effective emissivities close to zero for the SSM/I-like channels, they acknowledged larger uncertainties due to greater errors in the background fields for these channels. A correction for the emissive reflector was developed for the Universal Preprocessor (UPP) code used for the data assimilation efforts. The emissivity values used in the UPP code are largest for the F17 91 GHz channels with values of 4%, but only 0.5% for the lower frequency window channels. Using double differences with TMI based on the intercalibration approach described by Sapiano and Berg (2013), Berg and Sapiano (2013) attempted to independently solve for the emissivity of the SSM/I equivalent channels. While similar results were found to the UPP values with ~2% for F16 91 GHz, ~2-4% for F17 91 GHz depending on polarization, and lower values for the lower frequency channels, the resulting signal is clearly contaminated by other factors such as the solar intrusions. As a result, it was determined that it is not reasonable to independently solve for the reflector emission. Instead, Berg and Sapiano (2013) chose to use the double difference approach to solve for Tb biases as a function of the sun angle relative to the direction of motion of the spacecraft. Correction maps, or Tb offsets, as a function of sun azimuth and elevation angles were computed based on matchups with TRMM TMI over the entire available time series for each sensor. The resulting maps show very coherent structures, with Tb differences varying as much as 10K for certain sensor/channels depending on the sun position. Figures of the resulting correction maps for each SSMIS sensor and additional details are provided in Berg and Sapiano (2013). Figure 5 shows differences between the delta Tb values computed using the double difference approach with TMI described by Sapiano and Berg (2013) for the ascending versus descending scans. The original Tb differences are indicated by the dashed lines while the final results after the sun-angle dependent correction is applied are shown by the solid lines. Tables 2 and 3 give the mean differences between the ascending and descending delta Tb values before and after the sun-angle correction described above. As Table 2 shows, several of the channels have differences greater than 1K between the ascending and descending scan means and there is a great deal of variability between channels and between the sensors. After the sun-angle correction the differences are reduced to effectively zero for F16 and F18, although some residual differences remain for some of the F17 channels. As shown in Figure 5 this correction also serves to remove intercalibration differences.

CDR Program FCDR for SSMIS C-ATBD CDR Doc. No. CDRP-TMP-0006
Page 17
Figure 5: Delta Tb differences based on double differences with TMI as a function of scene temperature for ascending (red) and descending (blue) scans. The original values are shown by the dashed lines, while the final results after the application of the sun-angle correction are shown by the solid lines.

CDR Program FCDR for SSMIS C-ATBD CDR Doc. No. CDRP-TMP-0006
Page 18
Satellite 19v 19h 22v 37v 37h 91v 91h
F16 -0.53 -0.36 -0.57 -0.27 -1.11 -0.10 0.12
F17 -0.25 -0.36 -0.29 -0.37 -1.51 -0.85 -1.43
F18 -1.02 -0.79 -1.28 -0.79 -2.33 -1.07 -1.01
Table 2: Mean Tb differences for ascending minus descending scans
Satellite 19v 19h 22v 37v 37h 91v 91h
F16 -0.01 -0.04 -0.01 0.02 -0.03 -0.02 -0.01
F17 -0.01 -0.08 -0.02 -0.04 -0.24 -0.09 -0.12
F18 -0.01 -0.01 -0.01 -0.02 0.00 -0.03 -0.02
Table 3: Mean Tb differences for ascending minus descending scans after sun-angle correction.
3.2.9 Intercalibration
An important aspect in creating an FCDR is to remove discontinuities between sensors so as to remove the potential for erroneous trends. In the case of the SSM/I and SSMIS FCDR, the goal was to intercalibrate all sensors to a common standard using multiple approaches. F13 was chosen as a calibration standard due to its longevity and stable orbit and the remaining sensors were calibrated to it using multiple approaches. Five distinct techniques were applied including direct polar matchups, double differencing against model simulations from reanalysis profile data, double differencing against matchups with the TRMM Microwave Imager, vicarious cold calibration and an Amazon warm calibration. Multiple realizations of three of the five techniques were applied using different reanalysis data and retrieval techniques to account for Earth Incidence Angle (EIA) dependent differences between sensors. It is important to note that intercalibration does not imply that the derived correction will completely homogenize observations from the sensor. Instead, the intercalibration procedure must ensure that measurements between the sensors are “physically” consistent. In addition to calibration errors, observations from the sensors can differ due to several physical mechanisms including diurnal sampling differences, channel differences and view angle or EIA differences. Although the SSMIS has 24 channels, the focus of this work was the SSM/I equivalent channels (19, 22, 37 and 91 GHz) and intercalibration of the other channels is neglected in the FCDR.
The derivation of the calibration offsets for each channel of each senor is described in the Sapiano et al. (2013) with further details in Sapiano and Berg (2013). Unlike the SSM/I sensors, the resulting calibration differences versus the F13 SSM/I were found to vary significantly as a function of the scene temperature. Thus the SSMIS intercalibration offsets are applied as a function of scene temperature. The

CDR Program FCDR for SSMIS C-ATBD CDR Doc. No. CDRP-TMP-0006
Page 19
intercalibration tables for each sensor are stored in the look-up table described in section 3.4.5.5. The final calibration values are also based on the TMI double difference results using the ERA-I geophysical parameters with the other techniques used only for verification and estimation of the residual calibration errors. For the three current SSMIS sensors, there is coincident TMI data available for the entire data record and this double difference approach significantly reduces the impact of the errors in the geophysical data products used for computing the simulated differences. Appendix B in Sapiano and Berg (2013) shows summary plots of the intercalibration results for pairwise comparison between the SSMIS instruments on board DMSP F16, F17, and F18 versus the SSM/I F13 reference standard. The F13-F16 comparison is shown in Figure 6 below.
Figure 6: Plots of intercalibration estimates from each implementation by channel for F13-F16.

CDR Program FCDR for SSMIS C-ATBD CDR Doc. No. CDRP-TMP-0006
Page 20
3.2.10 Write Output
The output FCDR files (described in section 3.4.7) containing the final Tb values with corrections and intercalibration applied are written out in NetCDF4. Note that there is an option in the software to write out an XBASE file, which contains all of the data fields in the input BASE file along with the output FCDR variables and the various satellite/sun angles which are computed but not output in the FCDR file. This option is provided for expert users wanting to further investigate calibration issues etc.
3.3 Algorithm Input
3.3.1 Primary Sensor Data
The raw sensor data is sensor counts from SSMIS instruments. The sensor counts are converted to antenna temperatures (Ta) and stored in the Temperature Data Record (TDR) files created by the Shared Processing Network Data Exchange Format (SPN DEF). These TDR files are subsequently converted into BASE files, which are used as input for the algorithm and are described in section 3.3.3 below. The original TDR data were obtained and are publicly available from the NOAA CLASS archive.
3.3.2 Ancillary Data
The Two Line Element (TLE) data created by NORAD containing the satellite orbital elements are used to determine the satellite’s position and velocity. The TLE files are in the NORAD TLE format consisting of a title line, which is the satellite name, followed by two lines of formatted text. The use of these files in the FCDR processing is optional, however, as by default the algorithm uses the precomputed spacecraft position and velocity information stored in the input BASE files.
3.3.3 Derived Data
The input data files used for the FCDR processing are referred to as BASE files. These files contain all of the information from the original source TDR files with the following changes/additions. The BASE files have been reorbitized into single orbit granules with duplicate scans removed and spacecraft position and velocity based on the TLE data added (for later use to calculate geolocation). The BASE files are written in NetCDF4 format with metadata added. With the exception of duplicate scans, none of data from the original TDR files is modified or removed. The idea of the BASE files is to preserve the original data in an easy to read self-describing format and to simplify the subsequent FCDR processing. The format of the BASE files is described in detail in the SSMIS BASE file Format Specification (http://rain.atmos.colostate.edu/FCDR/Archive_Docs/formatspecs/ssmis_base_format_spec_v1.pdf). Summary statistics of the completeness of the BASE file data record as well as duplicate scans and aggregate error statistics are available in the CSU technical report on quality control (Berg and Rodriguez-Alvarez, 2013).

CDR Program FCDR for SSMIS C-ATBD CDR Doc. No. CDRP-TMP-0006
Page 21
3.3.4 Forward Models
No forward models are used in the FCDR processing, however, the development of the intercalibration offsets required radiative transfer calculations to account for differences in EIA between sensors. The models used included the atmospheric absorption model of Rosenkranz (1998), and for ocean surface emissivity, the specular emissivity model based on Deblonde and English (2001) and a rough sea surface model based on Kohn (1995) and Wilheit (1979a,b). More details regarding the implementation of these models are provided in Elsaesser and Kummerow (2008). Only the derived offsets and other coefficients used in the intercalibration and some of the corrections are used in the algorithm. 3.4 Theoretical Description The software developed for the SSMIS FCDR processing is a stepwise approach described in Section 3.2. This involves reading the input BASE file along with the necessary data coefficient files etc., quality control procedures, calculation of the spacecraft position and velocity (optional) and pixel geolocation, correction for solar and lunar intrusions, application of cross-track bias corrections, APC correction to compute Tb from Ta, correction for sun-angle dependent biases, and application of scene-dependent temperature intercalibration offsets.
3.4.1 Physical and Mathematical Description
3.4.1.1 Physical Background
Passive microwave sensors, such as the SSMIS, measure the microwave radiation emitted by Earth’s surface and atmosphere and interacting with the atmosphere through absorption, scattering, and transmission before reaching the sensor. The amount of absorption and scattering of radiation as it travels through the atmosphere depends on the wavelength (or equivalently, frequency) of the radiation and on the state of the atmosphere (e.g. amount of water vapor, rain, cloud, etc.).
The emission of radiation from Earth’s surface and atmosphere is described by Planck’s blackbody radiation law with the deviation of real materials from ideal blackbodies accounted for by the emissivity (ε) of the material. The brightness temperature (TB) of a scene retrieved by SSMIS at a frequency depends on the scene’s actual temperature:
TB = ε Tactual (1)
How the emitted radiation is modified by the atmosphere before reaching the sensor provides information on the state of the atmosphere. Information about carbon dioxide, oxygen, water vapor, liquid water and ice is inferred from SSMIS data by exploiting known changes in the thermal spectrum due to selective absorption, emission, and scattering of radiation. The SSM/I User’s Interpretation Guide (Raytheon 2000), section

CDR Program FCDR for SSMIS C-ATBD CDR Doc. No. CDRP-TMP-0006
Page 22
2, provides theory of remotely sensed electromagnetic radiation – especially microwave radiation – and how it is used to retrieve brightness temperature and other parameters.
3.4.1.2 Astronomical and Geographical Calculations
The Simplified General Perturbations (SGP4) orbital model (Vallado et al., 2006) is used to calculate perturbations of the satellite orbit due to effects of the sun, moon, Earth’s oblateness, etc. The orbital position and velocity of the spacecraft calculated using this model are used along with other satellite and sensor parameters (as described in sections 3.2.3 and 3.4.5.1) to compute the corresponding geolocation or latitude and longitude of each individual pixel or Earth scene.
3.4.1.3 Sensor Characteristics
The physical sensor characteristics and configuration are described in Section 2.2.
3.4.1.4 Simplifications and Approximations
In the quality control processing stage (see section 3.2.4.3), the distance between two pixel locations is approximated by using a sphere to model the Earth.
3.4.2 Data Merging Strategy
The original sampling provided by the SSMIS sensors is preserved in the output FCDR data with no merging of the resulting data in either space or time. The resulting FCDR Tb from each of the sensors are intercalibrated to be physically consistent with the observed Tb from the SSM/I sensor on board DMSP F13. Differences between the various sensor Tb due to the local observing time and/or variations in the view angle or EIA remain. Accounting for these differences and merging the data from the various sensors is left to the TCDR developers.
3.4.3 Numerical Strategy
The subroutines to compute the spacecraft position and velocity from the TLE files were implemented based on the North American Aerospace Defense Command (NORAD) SDGP4 code (Vallado et al., 2006). Additional details are provided in the header of the subroutine sdgp4.c. Details on the numerical calculations of the pixel geolocation and associated angles are provided in CSU technical report by Sapiano et al. (2010).
3.4.4 Calculations
Details on the processing steps involved in the algorithm are provided in Section 3.2. Additional details are provided in a series of CSU technical reports (Sapiano et al. 2010; Sapiano and Berg 2012; Sapiano and Berg 2013; Berg and Sapiano 2013)

CDR Program FCDR for SSMIS C-ATBD CDR Doc. No. CDRP-TMP-0006
Page 23
3.4.5 Look-Up Table Description
Several stages of the algorithm use data that has been calculated and is stored in static look-up tables. The look-up tables used in each stage are described in this section.
3.4.5.1 Calculate Geolocation
The geolocation calculation makes use of the look-up tables contained in the three text files listed below where F* is the satellite designation F16 through F18:
1. geo_SSMIS_F*.dat – This file contains data lines which are pairs of a variable name and its value for a variety of time, geometry, sensor alignment, and spacecraft attitude variables.
2. geo_SSMIS_F*_rpy.dat – This file contains a line for each month that the satellite was in operation giving values for roll, pitch and yaw.
3. geo_LeapSecs.dat – This file contains a line for each leap second adjustment since 1972 giving values for the Julian day, number of seconds, and sign of adjustment. This data is needed to convert between International Atomic Time (TAI) seconds and Universal Time (UT) seconds.
The geolocation code requires values for satellite and sensor parameters (satellite attitude, sensor alignment, elevation offset and scan angle offset) which are stored in the files geo_SSMIS_F*.dat. Elevation angle is known for all satellites and so the published values are used (Poe et al. 2008). For scan angle offset, sensor alignment, and satellite attitude, values are determined from the data by the method described in Sapiano and Berg (2012) to correctly locate the boresight.
3.4.5.2 Climatological Quality Check
The mean and standard deviation of the antenna temperatures for each latitude/longitude grid position, each channel, and each month are stored in binary data files named CLIM01.grd for January up to CLIM12.grd for December. The climatological quality check subroutine flags where the fraction of pixels in a scan differing from the mean by more than 3 standard deviations exceeds a threshold.
3.4.5.3 Solar and Lunar Intrusion Correction
Corrections to the gain are made for solar and lunar intrusions into the warm load and the cold-sky mirror. The Ta values are recomputed based on the adjusted gain values and the quality flag is set indicating that the data have been corrected for an intrusion. Additional details are provided by Berg and Sapiano (2013).
CDR Program FCDR for SSMIS C-ATBD CDR Doc. No. CDRP-TMP-0006
Page 24
3.4.5.4 Cross-track Bias Correction
The cross-track bias correction coefficients for each satellite are stored in the binary files F*_cbt_may12.dat where F* is the satellite designation such as F16. These files contain the correction coefficients for each scan position for each channel. Cross-track biases are removed from the Ta by dividing each value by the correction coefficient for the satellite, channel, and scan position.
3.4.5.5 Ta to Tb Conversion
The spillover and cross-pol coefficients used to compute the Tb values are stored in the files CorCoefs_SSMIS_F*.dat. 3.4.5.6 Intercalibration
The Tb calibration offsets used for intercalibration between the different satellites are stored in the text file F*cal_may2013.tbl, where F* is the satellite designation such as F16. The intercal table consists of a number of tie points for each channel with two lines corresponding to each of the 24 channels. The first line for each channel contains a number of temperature values, which correspond to a series of tie points. The second line for each channel contains the calibration difference corresponding to each scene temperature tie point. The calibration delta is interpolated between adjacent tie points with scene temperatures below the lowest tie point temperature or above the highest tie point temperature assigned the corresponding calibration value for those tie points. As a result, there is no extrapolation for low or high scene temperatures beyond the range of available intercalibration information. Only the FCDR channels currently have tie points specified, with zero tie points indicating no intercalibration applied. The SSM/I on board DMSP F13 is used as the reference to which all of the SSM/I and SSMIS sensors are calibrated.
3.4.6 Parameterization
The antenna pattern correction or APC is a parameterization of the measured antenna pattern. Details are provided by Berg and Sapiano (2013).
3.4.7 Algorithm Output
For each input BASE file, the algorithm produces an output FCDR file in NetCDF4 format. There are approximately 15 files per sensor per day and each files is approximately 26 Mbytes. Empty files containing only global metadata fields are produced for orbits with no available input TDR data. The FCDR file contains the final intercalibrated Tb for each SSM/I equivalent channel along with pixel latitude and longitude, time for each scan, spacecraft position, quality flags, sun-glint angle, and fractional orbit number with the necessary metadata and supplementary data fields. A total of six sets of variables are provided, each corresponding to a separate feed horn on the instrument. These include env1 (19v, 19h, and 22v), env2 (37v and 37h), img1 (150h, 183+/-1, 183+/-3, and 183+/-7), img2 (91v, and 91h), las (lower atmospheric

CDR Program FCDR for SSMIS C-ATBD CDR Doc. No. CDRP-TMP-0006
Page 25
sounding channels), and uas (upper atmospheric sounding channels).. The data are truncated to the nearest 0.001 degree for the lat/lon values and to the nearest 0.01 K for the Tb and view angles. Internal NetCDF data compression is used to compress the files. A detailed specification of the format of the FCDR files is provided in the SSMIS FCDR File Format Specification. (http://rain.atmos.colostate.edu/FCDR/Archive_Docs/formatspecs/ssmis_fcdr_format_spec_v1.pdf)
4. Test Datasets and Outputs 4.1 Test Input Datasets No test datasets were used to characterize the algorithm performance. Validation of the resulting FCDR data is described in Section 5.5.
4.2 Test Output Analysis
4.2.1 Reproducibility
As described in Section 3.2.7 multiple intercalibration approaches were used to check for consistency. Additional details are provided by Sapiano and Berg (2013).
4.2.2 Precision and Accuracy
Since the FCDR are intercalibrated to match the F13 Tb, the accuracy of the values is defined by the accuracy of the F13 Tb. Given the lack of an absolute calibration standard at these frequencies, determination of the absolute accuracy is difficult to determine. Comparison with the CM-SAF and RSS FCDRs as well as comparisons with other independently calibrated sensors including TMI, AMSR-E, WindSat etc. indicate absolute differences less than 2-3 Kelvin. Precision of the results is determined based on consistency between intercalibration approaches (Sapiano and Berg 2013; Sapiano et al. 2013) and is generally within 0.5 K for most sensors/channels.
4.2.3 Error Budget
The intercalibration offsets applied in the processing stage described in section 3.2.7 were found as the means over five different techniques, and the standard deviations of the same values provide a measure of the error in the intercalibration. Additionally, uncertainty in the sun-angle correction was calculated, which accounts for residual errors due to solar intrusions, emissive reflector, and other instrument heating errors.

CDR Program FCDR for SSMIS C-ATBD CDR Doc. No. CDRP-TMP-0006
Page 26
Error Source Error Magnitude Sensor Noise 0.5 – 0.9 K Solar Correction 0.5 – 1.3 K Intercalibration 0.5 K
Table 4: Error Budget
5. Practical Considerations 5.1 Numerical Computation Considerations This algorithm doesn’t use parallelization. No problems with matrix inversions are expected. Failure of the geolocation algorithm to produce a valid latitude and longitude can lead to missing pixel geolocation in rare instances. There are round-off errors in computations and conversions between different data types, which are expected and within the tolerance of the algorithm.
5.2 Programming and Procedural Considerations The code implementing this algorithm uses standard procedural programming constructs such as: user-defined data structures to manage input and output data fields; control structures; functions; etc. No unusual programming techniques or optimizations are used as ease of maintainability was an important design criterion. Specific features of the code include:
• A pattern used throughout much of the code is to loop through all the scans of an orbit granule and for each scan to loop through the environmental sensor channels, the imager channels, the LAS channels, and the UAS channels and for each of these sets of channels, to loop through all pixels and all channels.
• Each of the eight sequential processing stages of the algorithm can be turned on or off with a flag (these stages are described in section 3.2). This is useful for comparison and validation of individual processing stages.
• Error and exception conditions are handled by direct checking of conditions/return codes in the main control flow, not by a language-supported exception construct.
• For efficiency (both execution speed and working storage space), extensive use of global variables is made.
• The source code is expected to build, and the resulting program to run, on a considerable range of different platforms. For more information on this, see section 5.6.
5.3 Quality Assessment and Diagnostics See discussion on Section 5.5 on Validation. This includes application of geophysical retrievals and comparisons with other SSM/I FCDR datasets.

CDR Program FCDR for SSMIS C-ATBD CDR Doc. No. CDRP-TMP-0006
Page 27
5.4 Exception Handling Error and exception conditions are handled by direct checking of conditions/return codes in the main control flow rather than by a language-supported exception construct.
5.4.1 Conditions Checked
The following conditions identify errors that necessitate that the program terminate. They are trapped and the program prints a suitable message, then exits gracefully with a non-zero status indicating the type of error.
• If an incorrect number of arguments are supplied to the program, a usage message is printed and it exits with status 1.
• If there is an error opening or reading an input file, the program prints an error message and exits with status 1.
• If there is an error creating or writing to an output file, the program prints an error message and exits with status 2.
• If there are unrecoverable errors in the SGP4 orbital model code, an error message is printed and the program exits with status 5.
The following exceptions are trapped and recovered from by skipping over the item that can’t be processed, setting codes to track this, and continuing processing with the next item:
• In the geolocation code, where a vector is expected to intersect the oblate spheroid that models the Earth, the solutions of the equation are checked and if the expected intersection doesn’t exist, then the relevant data fields are set to missing and the geolocation is skipped over.
5.4.2 Conditions Not Checked
The following possible error condition is not checked for:
• In the unlikely event that the program would run out of memory, it would crash. 5.4.3 Conditions Not Considered Exceptions
Where data fields are missing or do not satisfy quality control checks (described in section 3.2.4), quality flags are set and for those quality issues classified as serious the corresponding data fields are set to indicate missing data. All corrections/conversions are applied only to non-missing data and if any processing stage identifies certain data as missing, it remains missing for all future processing stages. This is considered normal processing and not an exception condition.

CDR Program FCDR for SSMIS C-ATBD CDR Doc. No. CDRP-TMP-0006
Page 28
5.5 Algorithm Validation
5.5.1 Validation during Development
The following methods were employed to validate the resulting FCDR data.
1) Visual inspections and verification of the various corrections applied to the data. As detailed by Berg et al. 2013, to verify the pixel geolocation, monthly images of gridded ascending minus descending Tb maps were checked using the final roll, pitch, and yaw values for each sensor and compared to maps based on the original TDR data. The results showed consistent improvement.
2) Implementation of multiple intercalibration approaches, which was done in part to check for consistency between independent techniques. As shown in Figure 6, the resulting differences are generally within 0.5K for all channels. Differences tend to be larger for warm scenes, but are generally quite consistent. Calibration over warmer scenes such as land remains an issue to be addressed in the future.
3) Application to geophysical retrievals. We are working with several different thematic CDR or TCDR developers to use the CSU FCDR with their algorithms. That effort is ongoing, but since the ultimate measure the FCDR is the consistency of the TCDRs or geophysical retrievals, we will continue to work to solicit feedback from various communities. We have also run two different in house retrieval algorithms to test their consistency with the SSM/I and SSMIS FCDR. Figure 7 shows time series of TPW, ocean wind speed, and cloud liquid water over oceans from the complete FCDR data record. This retrieval over non-precipitating ocean scenes is based on an optimal estimation approach developed by Elsaesser and Kummerow (2008). While this algorithm is not independently validated as a TCDR, it is physical retrieval that accounts for changes in EIA between sensors and is very sensitive to calibration differences, making it a useful tool for analyzing the consistency of the FCDR data record. The latest operational GPROF precipitation retrieval algorithm (Kummerow et al. 2001, 2011) has also been applied to the FCDR. Although these results are not shown here, they are available from (http://rain.atmos.colostate.edu/RAINMAP). Both the non-raining and raining time series show differences, but it is important to remember that the nine DMSP spacecraft with SSM/I and SSMIS sensors have different local observing times that drift/decay over time leading to diurnal cycle differences. A comparison of GPROF rainfall estimates based on coincident overpasses with TRMM TMI indicates mean rainfall differences between the SSMIS sensors and with TMI of less than 3%. Agreement between the SSM/I sensors and TMI is slightly better with differences of less than 1%. The sun angle and associated heating issues are a significant issue for the SSMIS sensors and most problematic for F17 and best for F18.
4) Comparisons with independent FCDRs including the RSS V7 FCDR for F17 when it becomes available. We are also working with members of the GPM XCAL team and researchers at the CM-SAF in their development of an SSMIS FCDR to identify problems and improve upon existing corrections etc.

CDR Program FCDR for SSMIS C-ATBD CDR Doc. No. CDRP-TMP-0006
Page 29
Figure 7: Time series of a) total precipitable water, b) ocean surface wind speed, and c) cloud liquid water path based on the nine DMSP sensors comprising the SSM/I and SSMIS FCDR.

CDR Program FCDR for SSMIS C-ATBD CDR Doc. No. CDRP-TMP-0006
Page 30
5.6 Processing Environment and Resources The code was originally developed and run in a processing environment described by the features listed in Table 5.
Hardware Dell PowerEdge R410 Memory 24GB Processor Two quad core Intel Xeon CPU X5550 @
2.67GHz (Hyperthreading enabled so appears as 16 CPUs)
Operating system CentOS Linux release 5.7 (64-bit) Programming language C Compiler icc (64-bit) External libraries hdf5, netcdf, mfhdf, df, hdf5_hl, jpeg, z, imf
Table 5: Processing Environment
The code has been designed to facilitate running it on different platforms by means of the following methods:
1. The Makefile which controls the build process, including compiling and linking, contains options to build the system for either 32-bit or 64-bit environments.
2. The majority of the code is platform-independent.
3. The platform-dependent parts of the code are separated from the rest and found in the file sgdp4h.h. This file contains code to:
a. Detect the platform; b. For functions that will be used from platform-dependent built-in libraries,
load the relevant libraries; c. Handle the precision differences of data types on different platforms.
To build the code in a new environment, follow these steps:
1. Ensure that the required external libraries listed in 5 are installed (for hdf, netcdf, jpeg, z, imf).
2. Examine the Makefile and set the compiler command if different for the new environment. Also comment/uncomment lines if necessary to select 32-bit or 64-bit environments.
3. Run the make command to create the executable program ssmis_fcdr from the source code.

CDR Program FCDR for SSMIS C-ATBD CDR Doc. No. CDRP-TMP-0006
Page 31
Performance:
1. Using a single CPU on the system detailed above takes approximately 15 seconds wall clock time to run a single file.
2. Using approximately four processors the entire SSMIS FCDR data record can be reprocessed in less than a week.
6. Assumptions and Limitations 6.1 Algorithm Performance Near real-time monitoring of the input Ta and corresponding calibration data are provided on the web site (http://rain.atmos.colostate.edu/FCDR). Other than this, however, there is no near real-time assessment of the data and thus the quality of the output FCDR data is dependent on the quality of the input TDR data. As such, the near real-time data is labeled as an interim climate data record (ICDR) instead of an FCDR indicating that it has not been fully vetted for climate applications. We anticipate transitioning this to FCDR status once we have had a chance to run geophysical retrievals and look at the resulting data in more detail (expected time lag of 6 months to a year).
6.2 Sensor Performance The sensitivity of the SSMIS instruments is shown in Table 1 and varies from 0.5 to 0.9K for the SSM/I equivalent FCDR channels. As detailed in the report by Berg et al. 2013, Kunkee et al. 2008, and Bell et al. 2008, there are significant issues with the sensor performance due to a variety of issues including warm load intrusions and an emissive reflector. While we have attempted to correct for biases due to spacecraft/instrument heating and intrusion issues, significant transient errors remain along with larger uncertainties corresponding to warm scenes and very cold scenes.
7. Future Enhancements Several potential future enhancements have currently been identified. A generic issue for future enhancements is to address any issues identified by users.
7.1.1 Cross-track bias corrections
Revisit the cross-track bias corrections to investigate the potential impact of physical Tb variations across the scan due to roll and pitch variations in the spacecraft attitude.

CDR Program FCDR for SSMIS C-ATBD CDR Doc. No. CDRP-TMP-0006
Page 32
7.1.2 Warm scene intercalibration
Investigate scene-temperature dependent changes in sensor calibration differences by further developing/investigating warm-scene calibration over the Amazon and/or other warm targets.
7.1.3 Further investigation into sun-angle dependent errors
The sun-angle correction detailed in Berg and Sapiano (2013) is a catch-all approach to correct for mean errors due to a variety of factors including solar intrusions, emissive reflector, and potentially other calibration errors associated with heating of the hardware. As a result, we hope to further investigate the various issues and better characterize their impact on the calibration and associated channel errors.
8. References Bell, W., et al., 2008: The Assimilation of SSMIS Radiances in Numerical Weather
Prediction Models, IEEE Trans. Geosci. Rem. Sens., 46, 884-900.
Berg, W., C. Kummerow, M. Sapiano, N. Rodriguez-Alvarez, and F. Weng, A Fundamental Climate Data Record of Microwave Brightness Temperature data from 25 Years of SSM/I and SSMIS Observations, GEWEX Newsletter, August 2012.
Berg, W. K. and N. Rodriguez-Alvarez, 2013: SSM/I and SSMIS Quality Control, Technical Report, Colorado State University, http://rain.atmos.colostate.edu/FCDR/.
Berg, W., M. R. P. Sapiano, J. Horsman, and C. Kummerow, 2013: Improved geolocation and Earth incidence angle information for a fundamental climate data record of the SSM/I sensors, IEEE Trans. Geosci. Rem. Sens., 51, 1504-1513.
Berg, W. and M. R. P. Sapiano, 2013: Corrections and APC for SSMIS Ta to Tb, Technical report, Colorado State University, http://rain.atmos.colostate.edu/FCDR.
Deblonde, G., and S. J. English, 2001: Evaluation of the FASTEM-2 fast microwave ocean surface emissivity model. Tech. Proc. Int. TOVS Study Conf. XI, Budapest, Hungary, WMO, 67–78.
Elsaesser, G. S and C. D. Kummerow, 2008: Toward a fully parametric retrieval of the nonraining parameters over the global oceans, J. Appl. Meteor. Climatol., 47, 1599-1618.
Kohn, D. J., 1995: Refinement of a semi-empirical model for the microwave emissivity of the sea surface as a function of wind speed. M.S. thesis, Dept. of Meteorology, Texas A&M University, 44 pp.

CDR Program FCDR for SSMIS C-ATBD CDR Doc. No. CDRP-TMP-0006
Page 33
Kummerow, C. D., S. Ringerud, S. Crook, D. Randel, and W. Berg, 2011: An observationally generated a-priori database for microwave rainfall retrievals, J. Atmos. Oceanic Technol., 28, 113-130.
Kummerow, C. D. and Coauthors, 2001: The Evolution of the Goddard Profiling Algorithm (GPROF) for rainfall estimation from passive microwave sensors. J. Appl. Meteor., 40, 1801–1820.
Kunkee, D. B., Poe, G. A., Boucher, D. J., Swadley, S. D., Hong, Y., Wessel, J. E., and Uliana, E. A., 2008a: Design and Evaluation of the First Special Sensor Microwave Imager/Sounder. IEEE Trans. Geosci. Rem. Sens., 46, 863–883.
Kunkee, D. B., S. D. Swadley, G. A. Poe, Y. Hong, and M. F. Werner, 2008b: Special Sensor Microwave Imager Sounder (SSMIS) Radiometric Calibration Anomalies – Part I Identification and Characterization, IEEE Trans. Geosci. Rem. Sens., 46, 1017-1033.
Northrop Grumman, 2002: Algorithm and Data User Manual (ADUM) for the Special Sensor Microwave Imager/Sounder (SSMIS). Technical Report 12621, Northrop Grumman, Azusa, California, July 2002. Contract No: F04710-00-C-0001.
Poe, G. A., E. A. Uliana, B. A. Gardiner, T. E. vonRentzell, and D. B. Kunkee, 2008: Geolocation Error Analysis of the Special Sensor Microwwave Imager/Sounder, IEEE Trans. Geoscl. Rem. Sens., 46, 913-922.
Raytheon Company. Special Sensor Microwave/Imager (SSM/I) User’s Interpretation Guide, UG32268-900, Revision C, 29 Nov 2000.
Rosenkranz, P. W., 1998: Water vapor microwave continuum absorption: A comparison of measurements and models. Radio Sci., 33, 919–928.
Sapiano, M. R. P. and W. Berg, 2013: Intercalibration of SSM/I and SSMIS for the CSU FCDR, Technical Report, Colorado State University, http://rain.atmos.colostate.edu/FCDR.
Sapiano, M. R. P. and Berg, W. K., 2012: Estimation of Satellite Attitude for SSM/I and SSMIS Geolocation. Technical Report, Colorado State University, http://rain.atmos.colostate.edu/FCDR/.
Sapiano, M. R. P., Berg, W. K., McKague, D. S., and Kummerow, C. D., 2013: Towards an Intercalibrated Fundamental Climate Data Record of the SSM/I Sensors, IEEE Trans. Geosci. Remote Sens., 51, 1492-1503.
Sapiano, M. R. P., Bilanow, S., and Berg, W., 2010: SSM/I and SSMIS Stewardship Code Geolocation Algorithm Theoretical Basis. Technical Report, Colorado State University, http://rain.atmos.colostate.edu/FCDR/.

CDR Program FCDR for SSMIS C-ATBD CDR Doc. No. CDRP-TMP-0006
Page 34
Vallado, D. A., Crawford, P., Hujsak, R., and Kelso, T. S., "Revisiting Spacetrack Report #3," presented at the AIAA/AAS Astrodynamics Specialist Conference, Keystone, CO, 2006 August 21–24.
Wilheit, T. T., 1979a: A model for the microwave emissivity of the ocean’s surface as a function of wind speed. IEEE Trans. Geosci. Electron., 17, 244–249.
Wilheit, T. T., 1979b: The effect of wind on the microwave emission from the ocean’s surface at 37 GHz., J. Geophys. Res., 84, 4921-4926.