Embed Size (px)
Citation preview

Ice Core Paleoclimate Research Group
Henry BrecherMary DavisPaolo GabrielliDon KennyPing-Nan LinVictor Zagorodnov
Funding provided by:NSF: Paleoclimate and Polar ProgramsNASA: Earth Sciences (Glaciology)NOAA: PaleoclimatologyGary Comer Foundation
Postdoctoral Researchers:Emilie BeaudonStacy Porter Roxana Sierra
Graduate Student:Donaldi Permana
Global Climate Change:The Evidence, Challenges and Our Options
Ellen Mosley-Thompson, Distinguished University Professor, GeographyDirector, Byrd Polar Research Center, The Ohio State University
Dasuopu,Himalayas
Bruce Plateau, Antarctic Peninsula
Crawford Point,Greenland
Climate ExplorationsA Matter of Dollars and Sense:
Climate Change, Carbon Standards, and Public HealthColumbus Public Health, October 30, 2014
Key Points
Earth’s climate is changing - the world is warming – that debate is over!
Weather and climate are very different
Global Climate Change (GCC) involves many changes - not just temperature(precipitation, sea level, glaciers, ecosystems are changing)
Human activities that release carbon dioxide (CO2) & other Greenhouse Gases(GHGs), as well as aerosols (particles), into Earth’s atmosphere are thedominant cause of warming of our planet since the 1950s
Recent scientific assessments highlight the role of human activities
The world is challenged by its growing need for energy
Year A.D.
2005 & 2010 warmest years on record
0.75°C1.35°F
Relative to the 1951 – 1980 mean
http://data.giss.nasa.gov/gistemp/
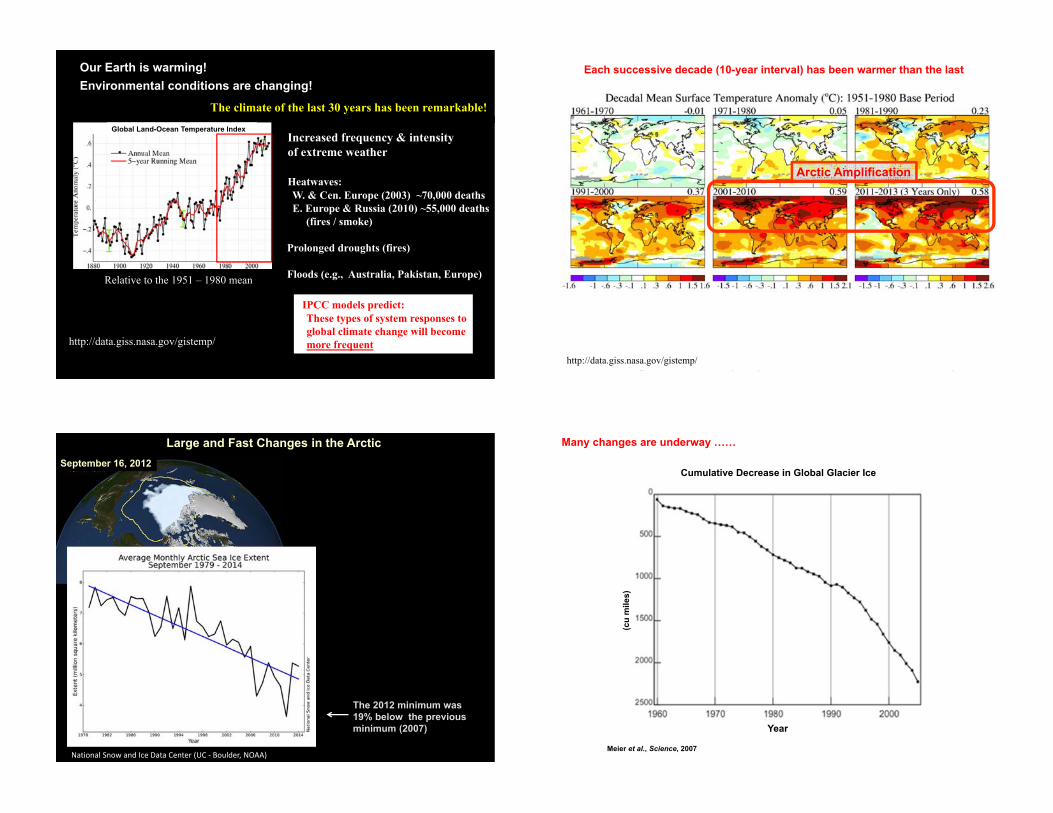
Our Earth is warming!Environmental conditions are changing!
Global Land-Ocean Temperature Index
Year A.D.
2005 & 2010 warmest years on record
0.75°C1.35°F
Relative to the 1951 – 1980 mean
http://data.giss.nasa.gov/gistemp/
Our Earth is warming!Environmental conditions are changing!
Global Land-Ocean Temperature Index
Year A.D.
Relative to the 1951 – 1980 mean
Our Earth is warming!Environmental conditions are changing!
Global Land-Ocean Temperature Index
The climate of the last 30 years has been remarkable!
Increased frequency & intensity of extreme weather
Heatwaves: W. & Cen. Europe (2003) ~70,000 deathsE. Europe & Russia (2010) ~55,000 deaths
(fires / smoke)
Prolonged droughts (fires)
Floods (e.g., Australia, Pakistan, Europe)
(IPCC models predict:These types of system responses toglobal climate change will becomemore frequenthttp://data.giss.nasa.gov/gistemp/
http://data.giss.nasa.gov/gistemp/
Each successive decade (10-year interval) has been warmer than the last
Arctic Amplification
Large and Fast Changes in the Arctic
The 2012 minimum was19% below the previousminimum (2007)
September 16, 2012
National�Snow�and�Ice�Data�Center�(UC�Ͳ Boulder,�NOAA)
Cumulative Decrease in Global Glacier Ice
(cu
mile
s)
Year
Meier et al., Science, 2007
Many changes are underway ……
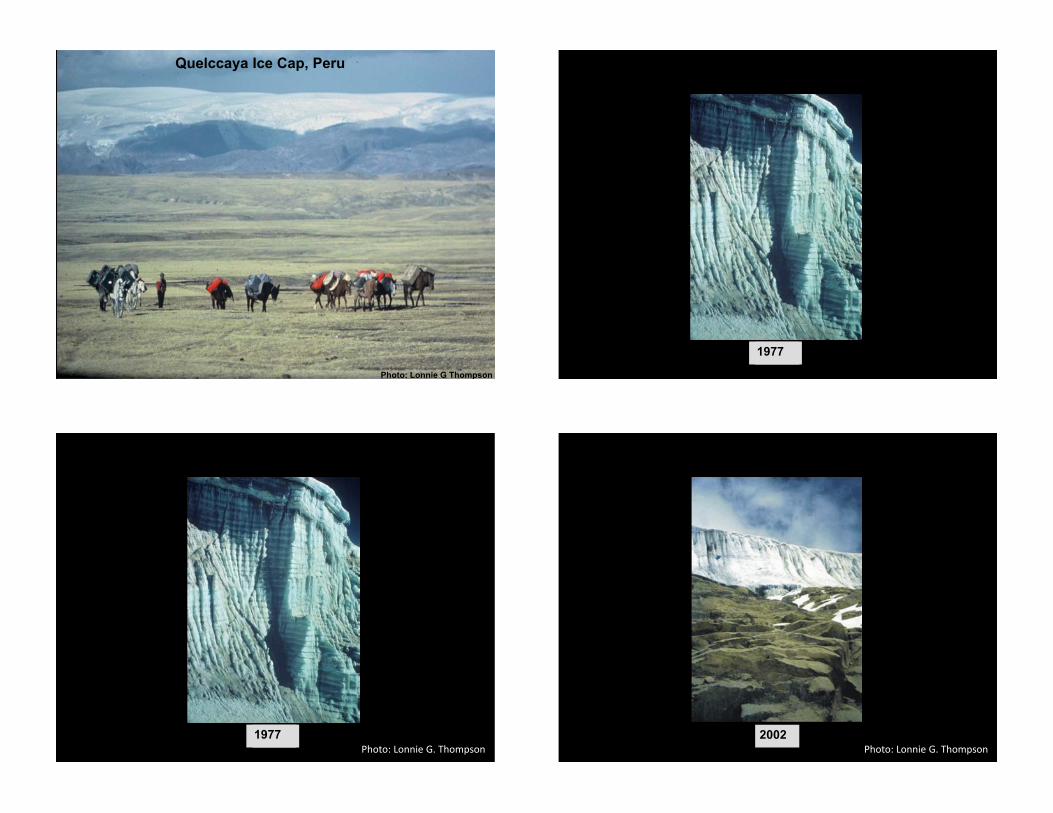
Quelccaya Ice Cap, Peru
Photo: Lonnie G Thompson
Quelccaya Ice Cap, Peru
2002Photo: Lonnie G Thompson
1977
Quelccaya Ice Cap, Peru
2002Photo: Lonnie G Thompson
1977Photo:�Lonnie�G.�Thompson
Quelccaya Ice Cap, Peru
2002Photo: Lonnie G Thompson Photo:�Lonnie�G.�Thompson

Qori�Kalis�Glacier,�Quelccaya�Ice�Cap,�Peru
Photo: Lonnie G. Thompson
Qori�Kalis�Glacier,�Quelccaya�Ice�Cap,�Peru
Photo: Lonnie G. Thompson
Muir Glacier, SE Alaska
August, 1941 (photo by William Field) August, 2004 (photo by Bruce Molnia)
88% of the ice present in 1912 has disappeared40% of the ice present in 2000 had disappeared by 2013
KilimanjaroAfrica

17
Total Area of Ice on Kilimanjaro
after Hastenrath and Greischar, J. Glaciology, 1997
1912
18
Total Area of Ice on Kilimanjaro
2007
Thompson et al., PNAS, 2009
October, 2013
Ice Fields near
Puncak Jaya, Papua,
Indonesia drilled in 2010
20
1936
2001
1991
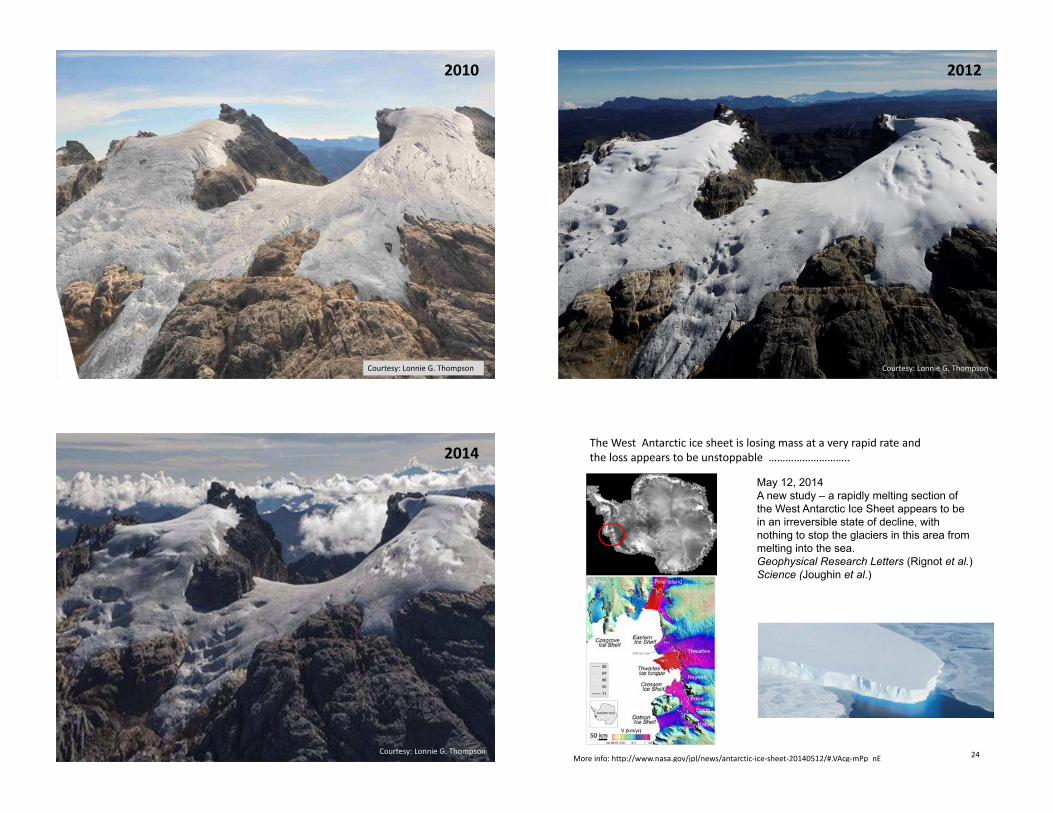
2010
Courtesy:�Lonnie�G.�Thompson
20102012
Courtesy:�Lonnie�G.�Thompson
201020122014
Courtesy:�Lonnie�G.�Thompson 24
The�West��Antarctic�ice�sheet�is�losing�mass�at�a�very�rapid�rate�andthe�loss�appears�to�be�unstoppable��………………………..
More�info:�http://www.nasa.gov/jpl/news/antarcticͲiceͲsheetͲ20140512/#.VAcgͲmPp nE
May 12, 2014A new study – a rapidly melting section of the West Antarctic Ice Sheet appears to be in an irreversible state of decline, with nothing to stop the glaciers in this area from melting into the sea. Geophysical Research Letters (Rignot et al.)Science (Joughin et al.)

Blue: Sea level change from tide-gauge data (Church J.A. and White N.J., Geophys. Res. Lett. 2006; 33: L01602)Red: Univ. Colorado sea level analyses in satellite era (http://www.columbia.edu/~mhs119/SeaLevel/).
Global Sea Level is Rising Faster
J. Hansen et al., Global Surface Temperature Change, Reviews of Geophysics, 2010.
Relative to the 1951 – 1980 mean
(2nd warmest winter)
We tend to forget that the impacts are global because we think locally
January�2014�– Earth’s�fourth�warmest�JanuaryLand�&�Ocean�temperature�departures�for�January�2014
Base�period:�1981�Ͳ 2010
http://www.ncdc.noaa.gov/sotc/global/2014/1
We tend to forget that the impacts are global because we think locally Climate and Weather are Quite Different!
Climate is what you expectWeather is what you get
The dog is the weather
The dog walker is the climate
Columbus: 29.7 oF for Jan (1985-2014) avgColumbus: 22.6 oF for Jan 2014
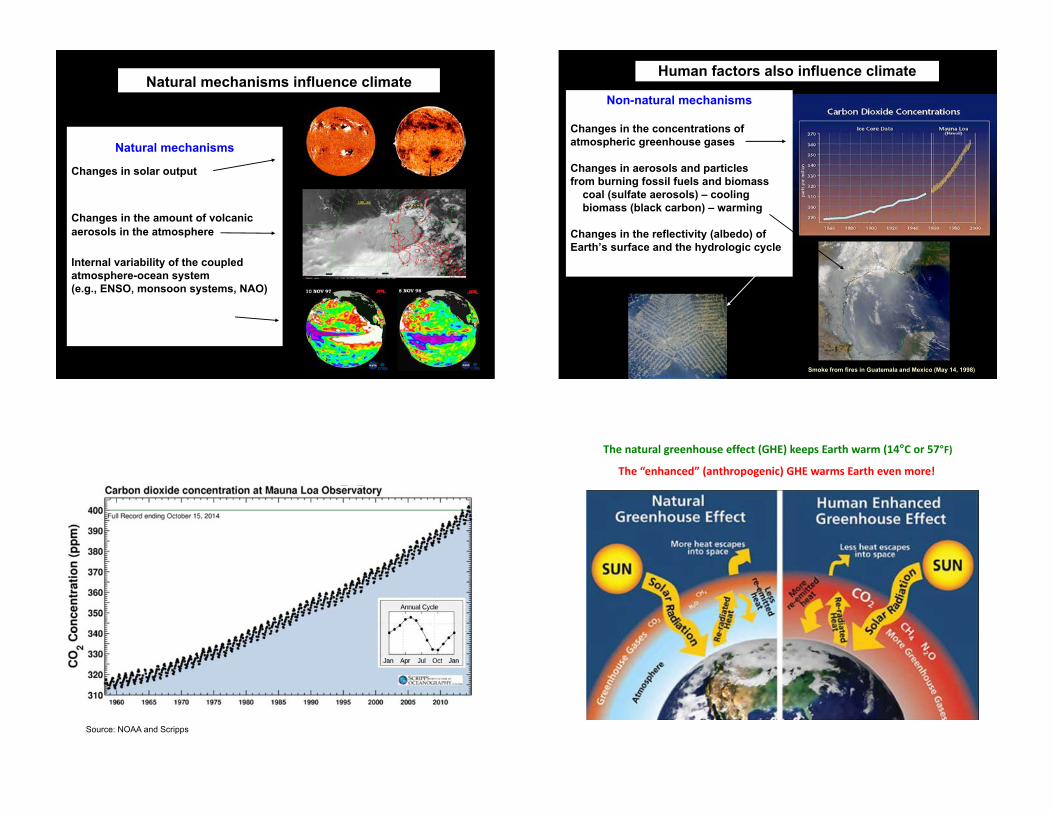
Natural mechanisms influence climate
Changes in solar output
Changes in the amount of volcanic aerosols in the atmosphere
Internal variability of the coupled atmosphere-ocean system(e.g., ENSO, monsoon systems, NAO)
Natural mechanisms
Human factors also influence climate
Non-natural mechanisms
Changes in the concentrations of atmospheric greenhouse gases
Changes in aerosols and particles from burning fossil fuels and biomass
coal (sulfate aerosols) – coolingbiomass (black carbon) – warming
Changes in the reflectivity (albedo) of Earth’s surface and the hydrologic cycle
Smoke from fires in Guatemala and Mexico (May 14, 1998)
Source: NOAA and Scripps
The�natural�greenhouse�effect�(GHE)�keeps�Earth�warm�(14°C�or�57°F)
The�“enhanced”�(anthropogenic)�GHE�warms�Earth�even�more!
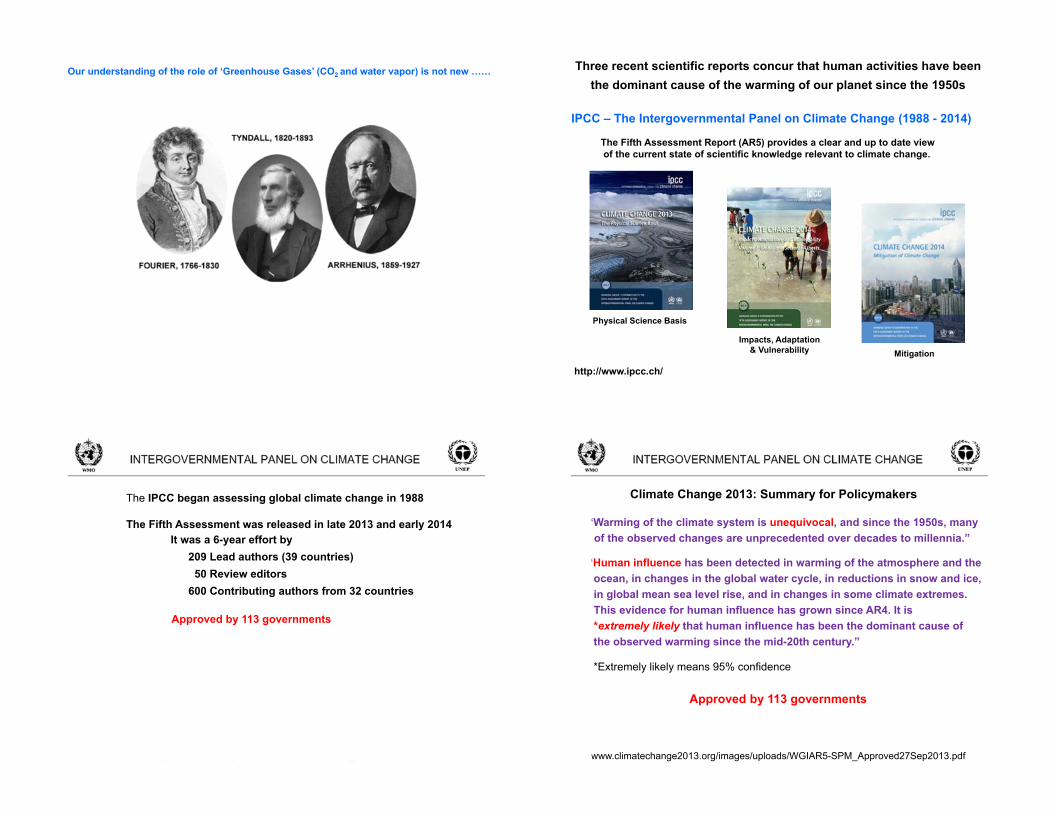
Our understanding of the role of ‘Greenhouse Gases’ (CO2 and water vapor) is not new …… Three recent scientific reports concur that human activities have beenthe dominant cause of the warming of our planet since the 1950s
IPCC – The Intergovernmental Panel on Climate Change (1988 - 2014)
The Fifth Assessment Report (AR5) provides a clear and up to date viewof the current state of scientific knowledge relevant to climate change.
http://www.ipcc.ch/
Impacts, Adaptation& Vulnerability
Physical Science Basis
Mitigation
“Warming of the climate system is unequivocal, and since the 1950s, manyof the observed changes are unprecedented over decades to millennia.”
“Human influence has been detected in warming of the atmosphere and the ocean, in changes in the global water cycle, in reductions in snow and ice, in global mean sea level rise, and in changes in some climate extremes. This evidence for human influence has grown since AR4. It is *extremely likely that human influence has been the dominant cause of the observed warming since the mid-20th century.”
*Extremely likely means 95% confidence
(1)
(2)
Climate Change 2013: Summary for Policymakers
http://www.climatechange2013.org/images/uploads/WGIAR5-SPM_Approved27Sep2013.pdf
Approved by 113 governments
The IPCC began assessing global climate change in 1988
The Fifth Assessment was released in late 2013 and early 2014It was a 6-year effort by
209 Lead authors (39 countries)50 Review editors
600 Contributing authors from 32 countries
Approved by 113 governments
“Warming of the climate system is unequivocal, and since the 1950s, manyof the observed changes are unprecedented over decades to millennia.”
“Human influence has been detected in warming of the atmosphere and the ocean, in changes in the global water cycle, in reductions in snow and ice, in global mean sea level rise, and in changes in some climate extremes. This evidence for human influence has grown since AR4. It is *extremely likely that human influence has been the dominant cause of the observed warming since the mid-20th century.”
*Extremely likely means 95% confidence
(1)
(2)
Climate Change 2013: Summary for Policymakers
http://www.climatechange2013.org/images/uploads/WGIAR5-SPM_Approved27Sep2013.pdf
Approved by 113 governments

Huber and Knutti, Nature Geoscience, 2012
Three major scientific assessments concur that human activities have been the dominant cause of warming of our planet since the 1950s
Climate Change: Evidence & Causes(U.S. National Academy of Sciences & Britain’s Royal Society)
CLIMATE CHANGE IS ONE OF THE DEFINING ISSUES OF OUR TIME.
It is now more certain than ever, based on many linesof evidence, that humans are changing Earth’sclimate.
- Atmosphere and oceans have warmed- Arctic sea ice is strongly declining in summer- Arctic sea ice is becoming thinner and younger- Sea level is rising - Climate variability is increasing (more extremes)
http://nas-sites.org/americasclimatechoices/events/a-discussion-on-climate-change-evidence-and-causes/
Three major scientific assessments concur that human activities have been the dominant cause of warming of our planet since the 1950s
Climate Change Impacts in the United StatesThird U.S. National Climate Assessment
(National Science and Technology Council & the U.S. Global Change Research Program)
http://nca2014.globalchange.gov/highlights
Ice Cores
Pollen
Corals
Ocean & Lake Sediments
Tree rings
Speleothems
Various archival systems provide paleoclimate records
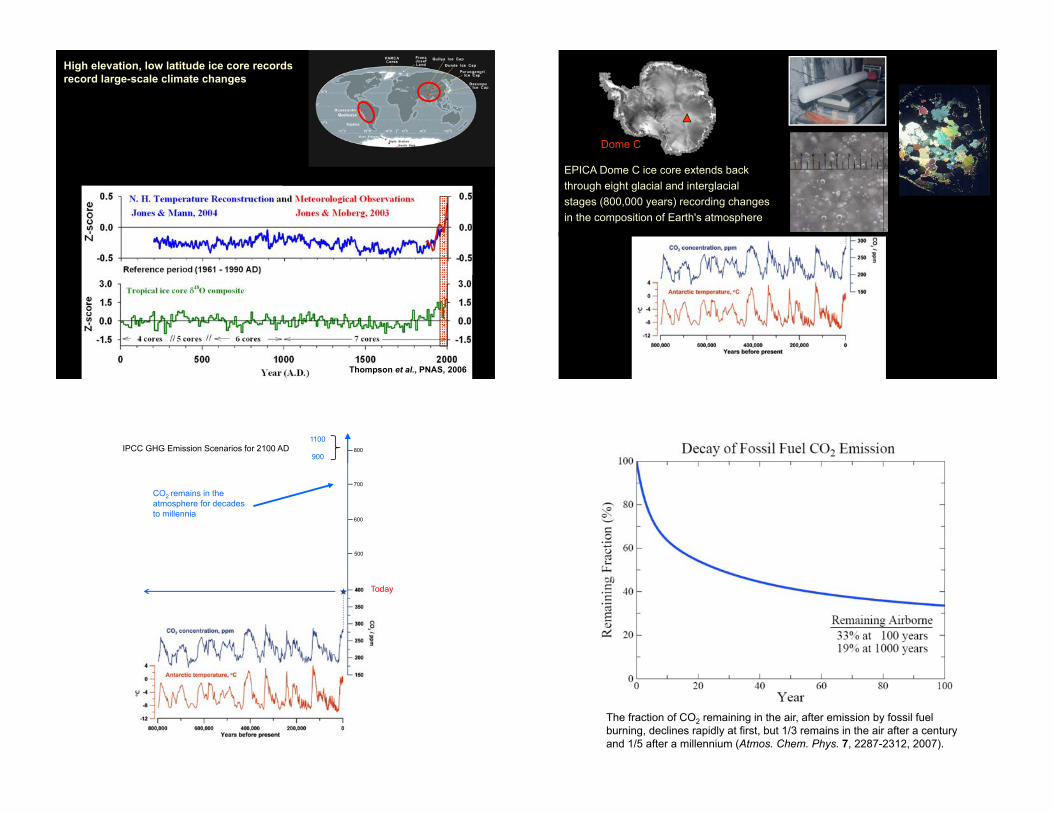
Thompson et al., PNAS, 2006
MWP
LIA
Reference period (1961 – 1990 A.D.)
77 new coresHigh elevation, low latitude ice core records
record large-scale climate changes
Thompson et al., PNAS, 2006
500
600
700
1100
900IPCC GHG Emission Scenarios for 2100 AD
Today
800
CO2 remains in theatmosphere for decadesto millennia
Dome C
EPICA Dome C ice core extends back through eight glacial and interglacial stages (800,000 years) recording changesin the composition of Earth's atmosphere
500
600
700
1100
900IPCC GHG Emission Scenarios for 2100 AD
Today
800
CO2 remains in theatmosphere for decadesto millennia
The fraction of CO2 remaining in the air, after emission by fossil fuel burning, declines rapidly at first, but 1/3 remains in the air after a century and 1/5 after a millennium (Atmos. Chem. Phys. 7, 2287-2312, 2007).
today
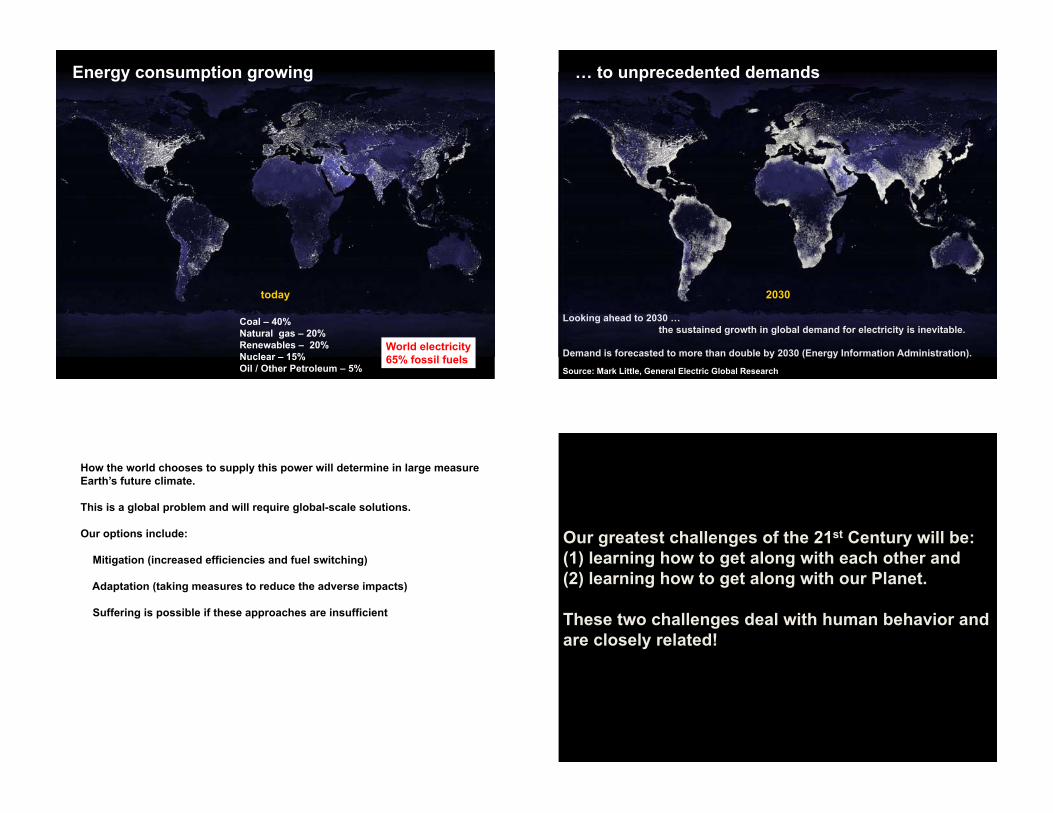
Energy consumption growing
Coal – 40% Natural gas – 20%Renewables – 20%Nuclear – 15%Oil / Other Petroleum – 5%
World electricity65% fossil fuels
… to unprecedented demands
Looking ahead to 2030 … the sustained growth in global demand for electricity is inevitable.
Demand is forecasted to more than double by 2030 (Energy Information Administration).
2030
Source: Mark Little, General Electric Global Research
How the world chooses to supply this power will determine in large measureEarth’s future climate.
This is a global problem and will require global-scale solutions.
Our options include:
Mitigation (increased efficiencies and fuel switching)
Adaptation (taking measures to reduce the adverse impacts)
Suffering is possible if these approaches are insufficient
Our greatest challenges of the 21st Century will be:(1) learning how to get along with each other and (2) learning how to get along with our Planet.
These two challenges deal with human behavior andare closely related!

Earth
For Global Climate Change --- Nature is the Time Keeper!