Embed Size (px)
Citation preview

Climate Risk, Real Estate, and the Bottom Line
All rights reserved. © 2018 Four Twenty Seven 1
• Climate change is already influencing real estate markets, with properties exposed to sea level rise in the United States selling at a 7 percent discount to those with less exposure.
• Market intelligence provider Four Twenty Seven and real estate technology company GeoPhy have partnered to assess the exposure to the physical impacts of climate change of 73,500 properties owned by 321 listed Real Estate Investment Trusts (REITs).
• 35 percent of REITs properties are exposed to climate hazards. Of these, 17 percent of properties are exposed to inland flood risk, 6 percent to sea level rise and coastal floods, and 12 percent exposed to hurricanes or typhoons
• U.S. markets most exposed to sea level rise include New York, San Francisco, Miami, Fort Lauderdale, and Boston. The high-value REITs most exposed to sea level rise in the U.S. are Vornado Realty Trust and Equity Residential.
• Globally, REITs concentrated in Hong Kong and Singapore display the highest exposure to rising seas. Sun Hung Kai Properties, worth $56 billion, has over a quarter of its properties exposed to coastal flooding.
• 37 Japanese REITs have their entire portfolio exposed to the highest risk for typhoon glob-ally, representing $264.5 billion at risk in properties in Tokyo and other Japanese cities.
KEY TAKEAWAYS
Four Twenty Seven and GeoPhy, October 2018
Climate Risk, Real Estate, and the Bottom Line

Climate Risk, Real Estate, and the Bottom Line
All rights reserved. © 2018 Four Twenty Seven 2
INTRODUCTION
DOES CLIMATE AFFECT REAL ESTATE PRICES? Evidence on the impact of climate risks on real es-tate returns is slowly starting to emerge. A high pro-file study by the University of Colorado at Boulder and Pennsylvania State University, published by the Journal of Financial Economics,4 found that proper-ties exposed to sea level rise are now selling at a 7
1Kok, N., and A. Ayoub. Storm Watch! REITS and CMBS Deals Most Exposed to Hurricane Florence. Medium. 12 September 2018. https://medium.com/geophy-hq/storm-watch-these-reits-and-cmbs-deals-are-most-exposed-to-hurricane-florence-aae2292d8e36 2Aon. Global Catastrophe Recap: September 2018. http://thoughtleadership.aonbenfield.com/Documents/20181009-ab-analytics-if-sept-global-recap.pdf 3Jergler, Don. Report Outlines Climate Change Risks Faced by Insurance Sector, Insurance Journal. August 23, 2018 https://www.insurancejournal.com/news/national/2018/08/23/499027.htm 4Bernstein, A., M. Gustafson, and R. Lewis. Disaster on the Horizon: The Price Effect of Sea Level Rise. 3 May 2018. Journal of Financial Eco-nomics (forthcoming). http://leeds-faculty.colorado.edu/AsafBernstein/DisasterOnTheHorizon_PriceOfSLR_BGL.pdf 5Kusisto, L. and A. Campo-Flores. Rising Sea Levels Reshape Miami’s Housing Market. The Wall Street Journal. 20 April 2018. https://www.wsj.com/articles/climate-fears-reshape-miamis-housing-market-1524225600 6Bernstein, A., M. Gustafson, and R. Lewis. Disaster on the Horizon: The Price Effect of Sea Level Rise. 3 May 2018. Journal of Financial Eco-nomics (forthcoming). http://leeds-faculty.colorado.edu/AsafBernstein/DisasterOnTheHorizon_PriceOfSLR_BGL.pdf
percent discount relative to comparable but less-exposed properties across the nation.5,6 Buyer be-havior reflects the expense of frequent flooding and the threat of lower resale values in the future due to sea level rise. The experience in Miami is an early example of the vulnerability of housing markets in
Climate events, including storms and floods, pose a significant risk to buildings, whether commercial or residential. The recent sequence of superstorms and subsequent flooding events in major U.S. cities serves as a tangible reminder. Hurricane Florence, which made landfall in North Carolina in September 2018, affected properties owned by 94 U.S. REITs, including 5,545 assets (545,000,000 sq.ft.), as well as 2,900 properties and loans in commercial mort-gage-backed securities (CMBS).1 Although only a portion of these properties experienced direct dam-age, the impacts from these types of events can be widespread and costly for many. Estimated econom-ic losses from Hurricane Florence are over $10 bil-lion. Due to low insurance penetration, the majority of flood damage is likely to be uninsured.2
Beyond storms and flooding, climate risks also in-clude cold spells, heat waves, drought, and periods of extended precipitation. These weather events affect properties that are dependent on water sup-ply, drainage and sewage infrastructure, along with
the functioning of temperature controls and wastewater treatment plants. Such adverse condi-tions, in turn, impact utility costs, operating expens-es, market values, and the protection of public health. Properties with high water and energy con-sumption such as manufacturing facilities, hospitals and data centers may suffer impacts to their operat-ing costs and revenues.
Research by the World Meteorological Organization has concluded that 80 percent of natural disasters between 2005 and 2015 were in some way climate-related. A recent analysis of 59 studies in English-language scientific journals published between 2016-2017 found that 70 percent of studies concluded that climate change has increased the risk of a given extreme event, such as heat, drought, rainfall, wild-fires, and storms.3 As climate change continues to affect buildings and markets globally, the value of real estate will increasingly reflect these risks.

Climate Risk, Real Estate, and the Bottom Line
All rights reserved. © 2018 Four Twenty Seven 3
ARE YOUR REIT INVESTMENTS AT RISK?
coastal cities. Zillow Research estimates that nation-ally, 1.9 million homes are projected to be literally underwater by the year 2100, causing losses of up to USD 1 trillion.7 Mortgage giant Freddie Mac is actively thinking about the implications of climate change for its book of business, and for loans extended to
homes in flood-prone areas. A paper by Piet Eich-holtz shows that commercial real estate values are affected strongly by fat-tail climate events such as Hurricane Sandy, although markets seem to return to “normal” after recent events fade from investors’ memory.
Four Twenty Seven and GeoPhy have partnered to bring together risk-driven analytics on physical cli-mate risk exposure with in-depth structured data on the global real estate market. The combination of cutting-edge datasets and models allows for highly granular observations of the impacts of climate change on the real estate investment market.
Four Twenty Seven, a market intelligence firm spe-cialized in the economic risk of climate change, has developed a model that leverages global climate data to provide asset-level risk assessments and score real assets, infrastructure assets and listed instruments on their exposure to climate change impacts. GeoPhy is a technology company in the real estate space, providing an automated valuation platform for the commercial real estate sector. Using data science and supervised machine learning to
7Bretz, Lauren. Climate Change and Homes: Who Would Lose the Most to a Rising Tide? Oct. 18, 2017 https://www.zillow.com/research/climate-change-underwater-homes-2-16928/
optimize the unprecedented volume of data now available to the sector, GeoPhy exposes decisive features that drive real estate values. See Methodol-ogy section (p.12) for more details on the underlying data and methodology.
Four Twenty Seven applied its data and models to GeoPhy’s data on listed real estate investment trusts’ holdings globally, creating the first in-kind global, scientific assessment of REITs’ exposure to climate risk. This white paper highlights key findings from the analysis of 73,694 properties owned by 321 listed REITs as of Q2 2018. The first section presents high level findings and key measures of exposure to risks. We then provide a detailed analysis on three major risks: extreme rainfall and inland floods, sea level rise and coastal floods, and cyclones, hurricanes and typhoons.
UNDERSTANDING EXPOSURE TO CLIMATE RISKS Four Twenty Seven uses two different thresholds to characterize the level of risk for a property:
Exposed Properties
“Exposed” sites are properties that have a high prob-ability of experiencing medium to high impact events – this typically translates as a score of 50 or more out of 100.
• For floods, properties that score 50 are sites that have experienced at least some flooding at a return interval of at least 1:500 (noting that Hur-ricanes Harvey, Florence and Irma were all 1:1000 events). Any score higher than 50 indi-
cates greater frequency and/or extent (depth) of flooding.
• For sea level rise, properties that score at 50 are generally coastal sites that are below <10m in elevation and that will experience disruptions due to floods to the surroundings. Any site with a score of 60 and up is already experiencing flooding or will likely be flooding by 2040.
• For cyclones, properties that score 50 or higher have experienced multiple Category 3 and up hurricanes (or recurring instances of tropical storms) in the past 35 years and are likely to

Climate Risk, Real Estate, and the Bottom Line
All rights reserved. © 2018 Four Twenty Seven 4
experience more intense cyclones (tropical storms, hurricanes or typhoons) in the future.
• Properties are considered exposed to water stress or heat stress if they fall in the 5 percent most exposed facilities in Four Twenty Sevens’ global universe of corporate facilities. We focus on the most extreme cases because extreme heat or drought do not inflict direct damages to a building, but in extreme cases could drive
down local real market prices and property valu-ations.
In our analysis of REITs assets globally, we found that 17 percent of properties were exposed to flood risk, 6 percent were exposed to sea level rise, and 12 percent were exposed to cyclones. Figure 1 provides a view of REITs’ exposure to floods globally, high-lighting urban areas with the greatest concentration of properties exposed to floods.
Figure 1. Percent of properties exposed to flood by urban area. This map represents the geographic repartition of the 73,694 sites scored by GeoPhy and Four Twenty Seven. The size of the dots represents the number of sites in a city or Metropolitan Area, and the color signals the percentage of these sites exposed to flood risk, with red representing the highest percentage and dark green representing the lowest. Note that cities with less than 25 sites are not represented on the map.
Red Flag Properties
We provide an additional measure of risk for facilities at high risk of high impact events: Red Flags. Facili-ties with a Red Flag fall in the 5 percent most ex-posed properties of all facilities scored by Four Twen-ty Seven’s global database of over 1,100,000 corpo-rate facilities. In our assessment of REITs, 4,355 properties were tagged with a Red Flag due to ex-treme flood risk, 4,409 due to extreme hurricane or typhoon risk, 1,413 due to extreme sea level rise risk, and 1,867 due to extreme water stress. A small sub-set of facilities, 1138 properties globally, received two or more Red Flags, for example due to compounded exposure to cyclones and sea level rise or floods.
REITs Climate Risk Scores
REITs are scored based on the average of the expo-sure of all the sites they hold in their portfolio, by climate hazard. We also provide an average Climate Risk Score, which is the weighted average of the scores for the different hazards,
To avoid averaging effects that might hide extreme risk (for example, a REIT might hold a mix of proper-ties with very high and very low exposure to a haz-ard), we also provide the percentage of “exposed” properties that REIT holds. Figure 2 illustrates our findings for the 321 REITs by value and risk exposure.

Climate Risk, Real Estate, and the Bottom Line
All rights reserved. © 2018 Four Twenty Seven 5
Figure 2. REITs Climate Risk by Value. Each dot represents a REIT. The x-axis shows a REIT’s Enterprise Value (Factset, September 2018) and the y-axis shows that REIT’s Climate Risk Score. The color of the dots denotes the percent of properties with red flags for any of the five climate hazards considered (sea level rise, hurricanes and ty-phoons, flood, water stress, heat stress. Red dots indicate REITs that hold sites where half or more of the sites are ex-posed to one of the climate hazards. The size of the dots represent the REITs’ value.
We find that the most exposed REITs are primarily geographically concentrated in Asia – Japan, Hong Kong and Singapore in particular. Champion REIT stands out due to the geographic concentration of its properties in Hong Kong, and the city’s high ex-posure to flood, sea level rise and typhoons. Sun Hung Kai Properties, Sumitomo Realty & Develop-ment and Mitsui Fudosan also rise to the top as the
most exposed large REITs with high exposure in their portfolio.
In the U.S., REITs with a large number of coastal properties such as Equity Residential also exhibit high risk portfolios, with a third of their portfolio ex-posed to climate risk.

Climate Risk, Real Estate, and the Bottom Line
All rights reserved. © 2018 Four Twenty Seven 6
Floods
Floods not associated with hurricanes caused 30 billion dollars damage globally in 2017.8 Climate change will increase flood risk by amplifying the intensity and variability of rain storms. As tempera-tures warm, the air can hold more moisture, which leads to the potential for more intense precipitation conditions.
Floods can have both direct and indirect impacts on buildings, as they can damage property and nearby infrastructure and disrupt operations. Impacts from both fluvial and pluvial floods can include higher costs associated with maintenance and repair of buildings, higher insurance premiums, and loss of revenue from business disruptions.
EXPOSURE BY CLIMATE HAZARD
The cost of floods was illustrated by the last-ing damage inflicted by Hurricane Harvey in Houston. Harvey brought over 20 inches of rain to the region, with some areas experienc-ing over 50 inches.9 With $125 billion in dam-age overall, 204,000 homes and apartment buildings were damaged, particularly affecting the residential market.10,11
One of the REITs included in this analysis, American Homes 4 Rent, a residential REIT, experienced $20 million hurricane-related
8Aon. Weather, Climate & Catastrophe Insight: 2017. http://thoughtleadership.aonbenfield.com/Documents/20180124-ab-if-annual-report-weather-climate-2017.pdf 9Di Liberto, Tom. Reviewing Hurricane Harvey’s Catastrophic Rain and Flooding. 18 September 2017. Climate.gov. https://www.climate.gov/news-features/event-tracker/reviewing-hurricane-harveys-catastrophic-rain-and-flooding 10DiNitto, M. How Harvey has Impacted the Industrial Real Estate Market. Houston Business Journal. 27 April 2018. https://www.bizjournals.com/houston/news/2018/04/27/how-harvey-has-impacted-the-industrial-real-estate.html 11Diduch, Mary. A Year Later, Assessing the Extent of Property Damage from the 2017 Hurricanes. National Real Estate Investor. 28 August 2018. https://www.nreionline.com/property-management/year-later-assessing-extent-property-damage-2017-hurricanes
Figure 4. American Homes 4 Rent Properties in Houston, Texas. Dots represent American Homes 4 Rent properties. The color represents the proper-ties’ flood risk score., with red representing the highest risk and dark green representing the lowest risk. Source: Four Twenty Seven, GeoPhy, and Fathom
Figure 3. Flooding from extreme rainfall . Flooding damag-es buildings and property and hinders access by blocking infrastructure. Source: FEMA Photo/Walt Jennings Photo by Walter Jennings
Climate Risk, Real Estate, and the Bottom Line
All rights reserved. © 2018 Four Twenty Seven 7
charges in 2017 as a result of Hurricanes Harvey and Irma. In all over 3,500 properties were affected across Houston, Texas, Florida and other Southeast-ern states.12 Figure 4 shows the American Homes 4 Rent’s properties in Houston, with a large number of sites scored as highly exposed to flood risk (orange and red dots).
After insurance payments worth $11 million, the company was still left with a tab of $10.1 million in repairs, upgrades and lost revenues. The company was still able to report strong third quarter results in 2017 despite these impacts, but recurring events across the company’s markets and potential chang-es in insurance coverage could have a negative ef-fect on the REIT’s financials over time.
Four Twenty Seven’s flood indicator displayed on Figure 4 measures the severity and frequency of historical pluvial and fluvial floods, the frequency of future heavy rainfall events, and the intensity of pro-longed periods of heavy rainfall, leveraging data from global climate models and modeling firm Fathom. Flood risk is assessed with a precision of 30x30m.
Sea Level Rise
Climate change is causing sea levels to rise because of rising temperature and ice melt. Over the long term, sea level rise threatens to reshape our coast-lines and presents a major threat to numerous coastal properties. Today, rising seas already affect real estate by contributing to increased “nuisance” flooding and king tide coastal flooding in low lying coastal areas such as Miami, Florida. Sea level rise also exacerbates the flood risk from storm surges, as experienced with Hurricane Sandy, Hurricane Flor-ence, and Typhoon Mangkhut.13 Rising seas threaten
to turn historically rare damaging flood events into more frequent occurrences, leading to higher maintenance and repair costs for infrastructure.
Sea levels will continue to rise globally, posing an increasing threat to coastal infrastructure in the coming years and decades. As noted earlier, antici-pation of these impacts already influences real es-tate markets, and will increasingly continue to do so.
Four Twenty Seven’s sea level rise indicator reflects the absolute and relative increase in the frequency of coastal floods, measured at the parcel level. It incor-porates local flood risk statistics, as well as local me-dian sea level rise projections under a business as usual carbon emissions scenario.
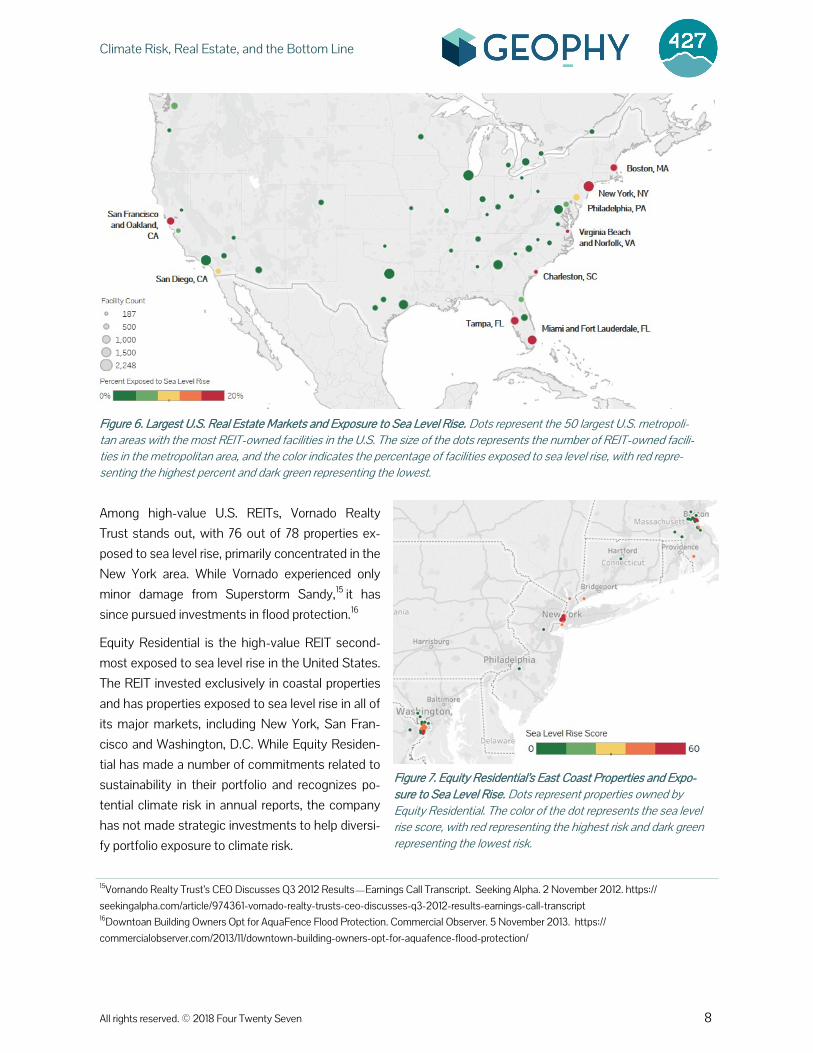
In the United States, key markets at risk include the San Francisco Bay Area, the New York City metro area, and Miami and Fort Lauderdale in Florida, as shown in Figure 6.14
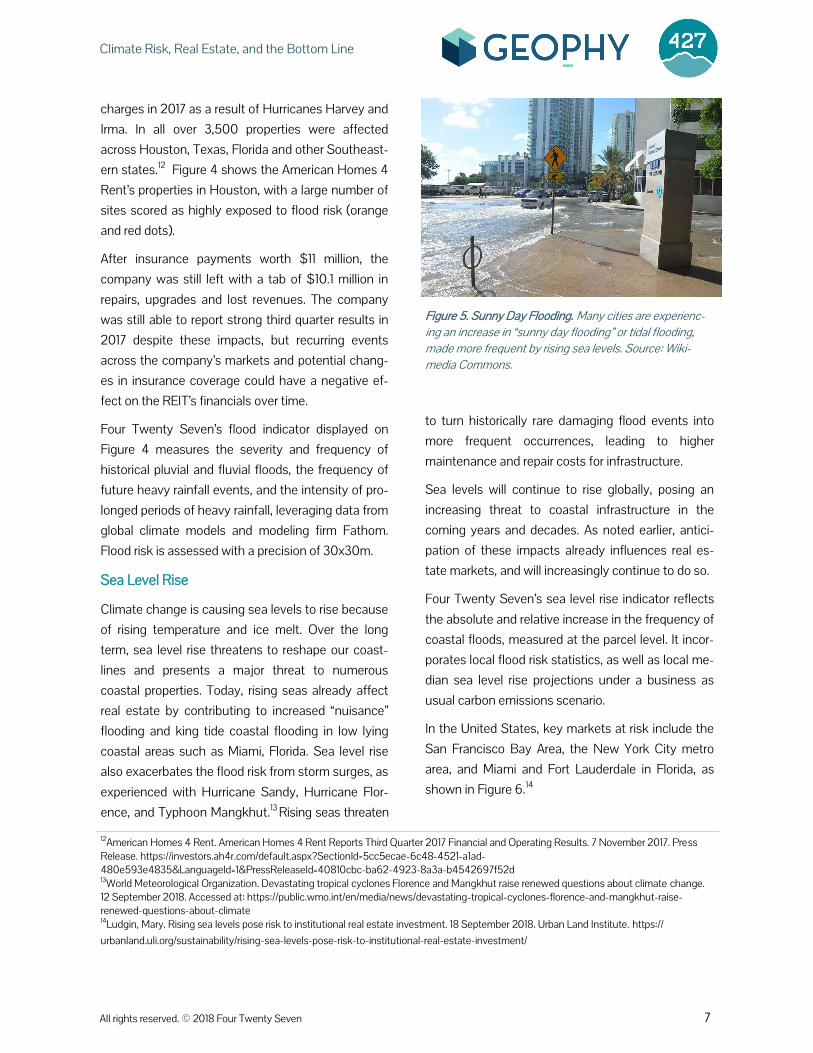
Figure 5. Sunny Day Flooding. Many cities are experienc-ing an increase in “sunny day flooding” or tidal flooding, made more frequent by rising sea levels. Source: Wiki-media Commons.
12American Homes 4 Rent. American Homes 4 Rent Reports Third Quarter 2017 Financial and Operating Results. 7 November 2017. Press Release. https://investors.ah4r.com/default.aspx?SectionId=5cc5ecae-6c48-4521-a1ad-480e593e4835&LanguageId=1&PressReleaseId=40810cbc-ba62-4923-8a3a-b4542697f52d 13World Meteorological Organization. Devastating tropical cyclones Florence and Mangkhut raise renewed questions about climate change. 12 September 2018. Accessed at: https://public.wmo.int/en/media/news/devastating-tropical-cyclones-florence-and-mangkhut-raise-renewed-questions-about-climate 14Ludgin, Mary. Rising sea levels pose risk to institutional real estate investment. 18 September 2018. Urban Land Institute. https://urbanland.uli.org/sustainability/rising-sea-levels-pose-risk-to-institutional-real-estate-investment/
Climate Risk, Real Estate, and the Bottom Line
All rights reserved. © 2018 Four Twenty Seven 8
Among high-value U.S. REITs, Vornado Realty Trust stands out, with 76 out of 78 properties ex-posed to sea level rise, primarily concentrated in the New York area. While Vornado experienced only minor damage from Superstorm Sandy,15 it has since pursued investments in flood protection.16
Equity Residential is the high-value REIT second-most exposed to sea level rise in the United States. The REIT invested exclusively in coastal properties and has properties exposed to sea level rise in all of its major markets, including New York, San Fran-cisco and Washington, D.C. While Equity Residen-tial has made a number of commitments related to sustainability in their portfolio and recognizes po-tential climate risk in annual reports, the company has not made strategic investments to help diversi-fy portfolio exposure to climate risk.
Figure 6. Largest U.S. Real Estate Markets and Exposure to Sea Level Rise. Dots represent the 50 largest U.S. metropoli-tan areas with the most REIT-owned facilities in the U.S. The size of the dots represents the number of REIT-owned facili-ties in the metropolitan area, and the color indicates the percentage of facilities exposed to sea level rise, with red repre-senting the highest percent and dark green representing the lowest.
15Vornando Realty Trust’s CEO Discusses Q3 2012 Results—Earnings Call Transcript. Seeking Alpha. 2 November 2012. https://seekingalpha.com/article/974361-vornado-realty-trusts-ceo-discusses-q3-2012-results-earnings-call-transcript 16Downtoan Building Owners Opt for AquaFence Flood Protection. Commercial Observer. 5 November 2013. https://commercialobserver.com/2013/11/downtown-building-owners-opt-for-aquafence-flood-protection/
Figure 7. Equity Residential’s East Coast Properties and Expo-sure to Sea Level Rise. Dots represent properties owned by Equity Residential. The color of the dot represents the sea level rise score, with red representing the highest risk and dark green representing the lowest risk.

Climate Risk, Real Estate, and the Bottom Line
All rights reserved. © 2018 Four Twenty Seven 9
REIT Enterprise Value (USD)
Average Sea Level Rise Risk Score
No. of Red Flags
No. of Prop-erties ex-posed
% Portfolio Exposed
Key Markets Ex-posed
New World Development $26.9B 49 5 10 38% Hong Kong
Sun Hung Kai Properties $56.6B 41 8 20 28% Hong Kong
Vornado Realty Trust $25.8B 41 1 12 15% New York Henderson Land Devel-opment $34.2B 35 3 9 19% Hong Kong
Swire Properties $23.7B 31 2 4 8% Hong Kong and Miami
Cheung Kong Property $36.9B 30 11 22 22% Hong Kong and Singapore
Sumitomo Realty & De-velopment $47.7B 29 7 28 14% Tokyo
Mitsui Fudosan $48.4B 27 16 54 21% Tokyo
Mitsubishi Estate $42.3B 25 11 24 12% Tokyo, New York
Equity Residential $32.9B 25 14 35 13% New York, San Francisco and
Washington D.C.
Table 1. Top Ten Most Exposed High-Value 17 REITs to Sea Level Rise
Figure 8. Sea Level Rise Exposure in Hong Kong. Dots represent properties and the color of each dot represents the sea level rise score, with red representing the highest risk and dark green representing the lowest risk.
17High value REITs are considered the top 25 REITS by Enterprise Value. For the dataset used in this analysis, these include REITs with over $22,400 million in Enterprise Value.

Climate Risk, Real Estate, and the Bottom Line
All rights reserved. © 2018 Four Twenty Seven 10
Internationally, Singapore, Hong Kong, and Malmö, Sweden are some of the key markets with high ex-posure to sea level rise. Numerous small to mid-sized cities, such as Morehead City, North Carolina or, Hull and Grimsby in the United Kingdom are also at high risk. Table 1 shows the Top Ten REITs Most Exposed to sea level rise (among REITs above $25 bn in Enterprise Value).
The REIT most exposed to sea level rise in our cover-age universe is Sun Hung Kai Properties, which has $56 billion18 worth of assets and is largely concen-trated in Hong Kong. Among smaller REITs, several have over 40 percent of their portfolios exposed to sea level rise, including Mapletree Commercial Trust, Japan Logistics Fund, Alexander’s, and The Wharf (Holdings).
Hurricanes and Typhoons
Cyclones are a major source of weather-related damage globally. Hurricanes Harvey, Irma, and Maria caused $220 billion economic damage in 2017.19 More recently, in September 2018, Hurricane Flor-ence caused an estimated $10 billion in forecast economic losses in the Carolinas, with the majority of the flood damage being uninsured. In the same month, Super Typhoon Mangkhut struck Japan and the Pearl River Delta, including Hong Kong, one of the largest real estate markets in the world.
Four Twenty Seven’s cyclone (the generic term for hurricanes, typhoons and tropical storms) indicator is derived from a measure of the cumulative wind velocity from recorded cyclones experienced in any given location between 1980 and 2016. This cumu-lative measure reflects both the severity of storms with the highest maximum winds, but also the fre-quency with which an area is subjected to severe storms.
The Japanese real estate market is particularly ex-posed to typhoons. Japan has experienced 9 major typhoons as of October 2018, including Typhoon Jebi hit which Japan with 100 mph winds, leading to widespread flooding and damages, billions of dollars in economic losses, and over 480,000 filed insur-ance claims.20 This high exposure is reflected in the risk assessment of Japanese real estate properties. Of the 4,409 properties with a red flag for hurri-canes and typhoons, 84 percent are located in Ja-pan.
Tokyo features the most property value at risk from typhoons in the world, with 911 Red Flag properties. Figure 10 highlights REITs with an average cyclone score of 80 or more, and 60% or more of their port-folio exposed to cyclones. Japanese REITs are over-represented in this sample, with 37 of them having a portfolio score of 90 or above or having 90% of their properties ranked as Red Flags, with a cumulative value at risk of $264.5 billion.
18FactSet: https://www.factset.com/ 19Aon. Weather, Climate & Catastrophe Insight: 2017. http://thoughtleadership.aonbenfield.com/Documents/20180124-ab-if-annual-report-weather-climate-2017.pdf 20Aon. Global Catastrophe Recap: September 2018. http://thoughtleadership.aonbenfield.com/Documents/20181009-ab-analytics-if-sept-global-recap.pdf
Figure 9. Damage from Typhoon Jebi in Japan. Hurri-cane-force winds during hurricanes, typhoons and tropical storms can damage buildings and infrastructure. Source: Wikimedia Commons

Climate Risk, Real Estate, and the Bottom Line
All rights reserved. © 2018 Four Twenty Seven 11
CONCLUSION
Figure 10. REITs most exposed to hurricanes and typhoons. Each dot represents a REIT. The x-axis shows a REIT’s Enter-prise Value (Factset, September 2018) and the y-axis shows the REIT’s Cyclone Risk Score. The color of the dots denotes the percent of properties with red flags for cyclone risk. Red dots indicate REITs that hold sites where half or more of the sites are exposed to cyclones. The size of the dots represent the REITs’ value.
The impacts of climate change are already affecting real estate markets, but the widespread, long-term consequences for economies, economic growth and equity are just starting to emerge. For institu-tional REIT investors, but also for investors in private equity real estate equity funds and direct investors in real estate, understanding exposure to any form of risk is paramount. The duty of investors towards clients and trustees is the foundation of the capital market. Stewards of capital should carefully assess current and future risks.
Four Twenty Seven’s local climate risk exposure risk scores and GeoPhy’s robust real estate investment data bring science-driven analytics to support efforts to understand REIT-level financial vulnerability to climate change and can be leveraged as a starting point for more robustly informed investing. By cou-pling an understanding of physical climate risk expo-sure with a knowledge of their investment interests, investors can play a key role in the development of more resilient and thriving real estate investment economy.

Climate Risk, Real Estate, and the Bottom Line
All rights reserved. © 2018 Four Twenty Seven 12
TECHNICAL APPENDIX: METHODOLOGY Mapping REITs Properties GeoPhy tracks the portfolio composition of every major listed property company in the world. At the REIT/portfolio level, GeoPhy has collected data on the individual assets in portfolios of listed property companies, using data sourced from tens of thou-sands of direct feeds from REITs, as well as feeds from LPs investing in REITs. The asset-portfolio match has a history of 5 years, is current as of Q2 2018, and is performed quarterly. By combining that dataset of over 600 companies with its unique en-richment layers, GeoPhy can create portfolio bench-marking on metrics such as sustainability, portfolio quality and portfolio risk.
GeoPhy maps three types of assets for each equity REIT:
• REITs typically own assets, either outright or partially. GeoPhy tracks ownership stakes in each of the assets that are on the REIT balance sheet;
• In some cases, REITs manage assets for whole-sale funds/separate accounts operated in-house. They may or may not have an equity stake in these assets. GeoPhy tracks the assets that REITs manage, even if they don’t fully own those assets;
• REITs can have equity stakes in other REITs. GeoPhy tracks ownership stakes in other REITs, and for those REITs map the assets underlying the portfolio.
For the Four Twenty Seven/GeoPhy REIT Climate Risk data collection effort, we consider all forms of ownership and management by REITs, thus includ-ing indirectly owned assets, as well as assets man-aged, but not owned by REITs. This scope aligns with the portfolio reporting of most REITs.
Modeling climate impacts at the property-level Four Twenty Seven’s models provide detailed, con-textualized projections of climate impacts for key climate risk hazards: floods from extreme precipita-tion, exposure to hurricane-force winds, sea level rise, water stress and heat stress for each site. For floods, sea level rise and cyclones, the analysis is site-specific (parcel level). For water scarcity, the analy-sis focuses on the most specific and relevant geo-graphic area, i.e. water basin. Each dimension of risk is scored on a scale of 0 to 100. Scores are normal-ized so companies’ or infrastructure sites’ climate risk can be compared across diverse portfolios.
Climate Hazard Description Potential Business Impacts Spatial scale
Heat Stress Increase in temperature Increased energy costs Heightened risk of brownouts/power outages Stress on human health/ labor force
25x25km
Water Stress Change in water supply and demand Reduced water supply Increased water costs Social license to operate/reputation
watershed
Floods Change in rainfall conditions and size and frequency of possible floods
Property and building damage Compromised infrastructure Business interruptions
30x30m
Cyclones, Hurricanes, Typhoons
Exposure to past cyclones Severe property damage Permanent loss of property value Relocation costs
90x90m
Sea level rise Heightened storm surge, augmented by sea level rise
Nuisance floods, property damage Permanent loss of property value Relocation costs
90x90m
Table 2. Four Twenty Seven’s Climate Risk Indicators. .

CONTACT INFORMATION
San Francisco Bay Area, CA 2000 Hearst Ave, Ste 304 Berkeley, CA 94709 Tel: +1.415.930.9090
Washington, D.C. 1875 K Street NW Washington, D.C. 20006 Tel: +1. 202.897.4020
Paris, France 2, rue du Helder 75009 Paris, France Tel: +33. 01.53.34.11.87
Four Twenty Seven (427mt.com) is the leading provider of mar-ket intelligence on the impacts of climate change for financial markets. We tackle physical risk head on by identifying the locations of corporate production and retail sites around the world and their vulnerability to climate change hazards such as sea level rise, droughts, floods and tropical storms, which pose an immediate threat to investment portfolios.
Four Twenty Seven’s ever-growing database now includes close to one million corporate sites and covers over 2000 publicly-traded companies. We offer subscription products and advisory
services to access this unique dataset. Options include data licenses, an interactive analytics platform, and company score-cards, as well as reporting services, scenario analysis, and real asset portfolio risk assessments.
Four Twenty Seven has won multiple awards for its innovative work on climate risk and resilience and our work has been fea-tured by Bloomberg, the Financial Times and the UNFCCC. Four Twenty Seven was founded in 2012 and is headquartered in Berkeley, California with offices in Washington, DC and Paris, France.
ABOUT FOUR TWENTY SEVEN
DISCLAIMER The information provided in this report was collated by Four Twenty Seven. Publications of Four Twenty Seven are for infor-mation purposes only. Other than disclosures relating to Four Twenty Seven, the information contained in this publication has been obtained from sources that Four Twenty Seven believes to be reliable, but no representation or warranty, express or implied, is made as to the accuracy, completeness, reliability or timeliness of any of the content or information contained herein. As such, the information is provided ‘as-is,’ ‘with all faults’ and ‘as availa-ble.’ The opinions and views expressed in this publication are those of Four Twenty Seven and are subject to change without notice, and Four Twenty Seven has no obligation to update the information contained in this publication. Further, neither Four Twenty Seven nor its directors, officers, employees or agents
shall be held liable for any improper or incorrect use of the infor-mation described and/or contained herein, nor does Four Twenty Seven assume responsibility for anyone’s use of the information. Under no circumstances shall Four Twenty Seven or any of its directors, officers, employees or agents be liable for any direct, indirect, incidental special, exemplary or consequential damages (including, but not limited to: procurement of substitute goods or services; loss of use, data or profits; or business interruption) related to the content and/or to the user’s subsequent use of the information contained herein, however caused and on any theory of liability. User agrees to defend, indemnify, and hold harmless Four Twenty Seven and its directors, officers, employees and agents from and against all claims and expenses, including attor-neys’ fees, arising out of the use of information herein provided.
AUTHORS Author: Kendall Starkman, Four Twenty Seven • [email protected]
Contributor: Nils Kok, PhD, Chief Economist, GeoPhy • [email protected]
Editor: Emilie Mazzacurati, Founder & CEO, Four Twenty Seven • [email protected]