Embed Size (px)
Citation preview
Climate-Science Communication and the Measurement Problem
Dan M. Kahan
Yale University
This article examines the science-of-science-communication measurement problem. In its simplest form, theproblem reflects the use of externally invalid measures of the dynamics that generate cultural conflict over riskand other policy-relevant facts. But at a more fundamental level, the science-of-science-communicationmeasurement problem inheres in the phenomena being measured themselves. The “beliefs” individuals formabout a societal risk such as climate change are not of a piece; rather they reflect the distinct clusters ofinferences that individuals draw as they engage information for two distinct ends: to gain access to thecollective knowledge furnished by science and to enjoy the sense of identity enabled by membership in acommunity defined by particular cultural commitments. The article shows how appropriately designed “sciencecomprehension” tests—one general and one specific to climate change—can be used to measure individuals’reasoning proficiency as collective-knowledge acquirers independently of their reasoning proficiency ascultural-identity protectors. Doing so reveals that there is in fact little disagreement among culturally diversecitizens on what science knows about climate change. The source of the climate-change controversy and likedisputes over societal risks is the contamination of the science-communication environment with forms ofcultural status competition that make it impossible for diverse citizens to express their reason as both
collective-knowledge acquirers and cultural-identity protectors at the same time.
KEY WORDS: identity-protective cognition, science literacy, climate-science literacy, evolution
What Is the Science-of-Science-Communication Measurement Problem?
The “double slit” experiment is the most bewitching illustration of the challenge that quantum
physics poses to its classical predecessor. When a light beam is trained on a barrier with two parallel slits,
the “wave like” character of light is shown to originate not in the interference of colliding streams of pho-
tons, but rather in the probabilistic interference of each individual photon with itself as it simultaneously
passes through “both slits at once.” More eerily still, the mere attempt to observe this phenomenon as it
occurs—by placing sensors, say, at the entry to the slits—“forces” each photon to pass through just one
of the slits and to travel an unmolested, “particle like” path to a screen, forming two parallel strips of light
instead of the wave’s signature interference pattern (Feynman, 1963, III: 1–4 to 1–6). Why collecting
information on the “dualistic” wave-particle quality of photons (or electrons or any other elementary par-
ticle) eviscerates every trace of this process is known in the study of physics as the “measurement prob-
lem,” and it emerges as the central feature of every distinctive element of quantum mechanics.
My focus in this article is on another “measurement problem”: one distinctive of the science of
science communication. The occasion for this bewitching difficulty is not the “dualistic” qualities of
1
PreprintAdvances in Political Psychologydoi: 10.1111/pops.12244
particles: it is the divided nature of people as reasoners. Every individual, I want to suggest, employs
her reasoning powers to apprehend what is known to science from two parallel perspectives simulta-
neously: a collective-knowledge-acquisition one, and a cultural-identity-protective one. Misapprehen-
sion of how these two forms of engaging information interact—variously reinforcing one another and
canceling each other out—is indeed the source of myriad difficulties in both the study and practice of
science communication. But much like the measurement problem of quantum physics, the measure-
ment problem of the science of science communication involves how observation perturbs this dual-
ism: the intrusion of cultural status competition into education, democratic politics, and other domains
in which we take stock of what we know forces individual reasoners to engage information from one
of these perspectives only. For the measurement problem distinctive of science communication, this is
the source of interference—one that disrupts the usual convergence of diverse citizens on empirical
evidence essential to their individual and collective decision making.
The idea that the science of science communication has this sort of measurement problem is, of
course, just a particular schematic representation of a much more complicated set of processes. As is
so for concepts like “collapsing wave functions,” “superposition,” “entanglement,” and the other ele-
ments of the Copenhagen Interpretation of what happens in the double slit experiment, the way to
assess the value of the “science-of-science-communication measurement problem” as a theoretical
construct is to show what can be done with it to explain, predict, and manage a set of consequential
but ultimately unobservable phenomena.
In this article, I will take a step toward demonstrating the utility of the science-of-science-
communication measurement problem by using it to address the communication of climate science.
The failure of widely accessible, compelling science to quiet persistent cultural controversy over the
basic facts of climate change is the most spectacular science-communication failure of our day. We
will neither understand nor remedy this failure, I want to suggest, unless we take account of its source
in the conflict that our own knowledge-assessment practices create between the use of reason to know
what is known and the use of reason to be who we are.
What Does “Belief in Evolution” Measure?
Forget climate change for a moment, though, and consider instead another controversial part of
science: the theory of evolution. Around once a year, Gallup or another major commercial survey
firm releases a poll showing that approximately 45% of the U.S. public rejects the proposition that
human beings evolved from another species of animal. The news is inevitably greeted by widespread
expressions of dismay from media commentators, who lament what this finding says about the state
of science education in our country.
Actually, it doesn’t say anything. There are many ways to assess the quality of instruction that U.S.
students receive in science. But what fraction of them say they “believe in” evolution is not one of them.1
1 As used in this article, “believe in” just means to “accept as true.” When I use the phrase to characterize a survey itemrelating to evolution or global warming, “belief in” conveys that the item certifies a respondent’s simple acceptance of,or assent to, the factual status of that process without assessing his or her comprehension of the evidence for, or mech-anisms behind, it. I do not use “belief in” to align myself with those who think they are making an important pointwhen they proclaim that evolution and climate change are not “mere” objects of “belief” but rather “scientificallyestablished facts.” While perhaps a fitting retort to the schoolyard brand of relativism that attempts to evade engagingevidence by characterizing an empirical assertion as “just” the “belief” or “opinion” of its proponent, the “fact”—“belief” distinction breeds only confusion when introduced into grownup discussion. Science neither dispenses with“belief” nor distinguishes “facts” from the considered beliefs of scientists. Rather, science treats as facts those proposi-tions worthy of being believed on the basis of evidence that meets science’s distinctive criteria of validity. From scien-ce’s point of view, moreover, it is well understood that what today is appropriately regarded as a “fact” might not beregarded as such tomorrow: people who use science’s way of knowing continuously revise their current beliefs abouthow the universe works to reflect the accumulation of new, valid evidence (Popper, 1959).
2 Kahan
Numerous studies have found that profession of “belief in” evolution has no correlation with an
understanding of basic evolutionary science. Individuals who say they “believe” are no more likely
than those who say they “don’t” to give the correct responses to questions pertaining to natural selec-
tion, random mutation, and genetic variance—the core elements of the modern synthesis (Bishop &
Anderson, 1990; Demastes, Settlage, & Good, 1995; Shtulman, 2006).
Nor can any valid inference be drawn about a U.S. survey respondent’s profession of “belief in”
human evolution and his or her comprehension of science generally. The former is not a measure of
the latter.
To demonstrate this point requires a measure of science comprehension. Since Dewey (1910),
general education has been understood to have the aim of imparting the capacity to recognize and use
pertinent scientific information in ordinary decision making—personal, professional, and civic (Baron,
1993). Someone who attains this form of “ordinary science intelligence” will no doubt have acquired
knowledge of a variety of important scientific findings. But to expand and use what she knows, she
will also have to possess certain qualities of mind: critical reasoning skills essential to drawing valid
inferences from evidence; a faculty of cognitive perception calibrated to discerning when a problem
demands such reasoning; and the intrinsic motivation to perform the effortful information processingsuch analytical tasks entail (Stanovich, 2011).
The aim of a valid science-comprehension instrument is to measure these attributes. Rather than
certifying familiarity with some canonical set of facts or abstract principles, we want satisfactory per-
formance on the instrument to vouch for an aptitude comprising the “ordinary science intelligence”
combination of knowledge, skills, and dispositions.
Such an instrument can be constructed by synthesizing items from standard “science literacy”
and critical reasoning measures (cf. Kahan, Peters, Wittlin, et al., 2012). These include the National
Science Foundation’s Science Indicators (2014) and Pew Research Center’s “Science and Tech-
nology” battery (2013), both of which emphasize knowledge of core scientific propositions from the
physical and biological sciences; the Lipkus/Peters Numeracy scale, which assesses quantitative rea-
soning proficiency (Lipkus, Samsa, & Rimer, 2001; Peters et al., 2006; Weller et al., 2013); and Fred-
erick’s Cognitive Reflection Test, which measures the disposition to consciously interrogate intuitive
or preexisting beliefs in light of available information (Frederick, 2005; Kahneman, 2003).
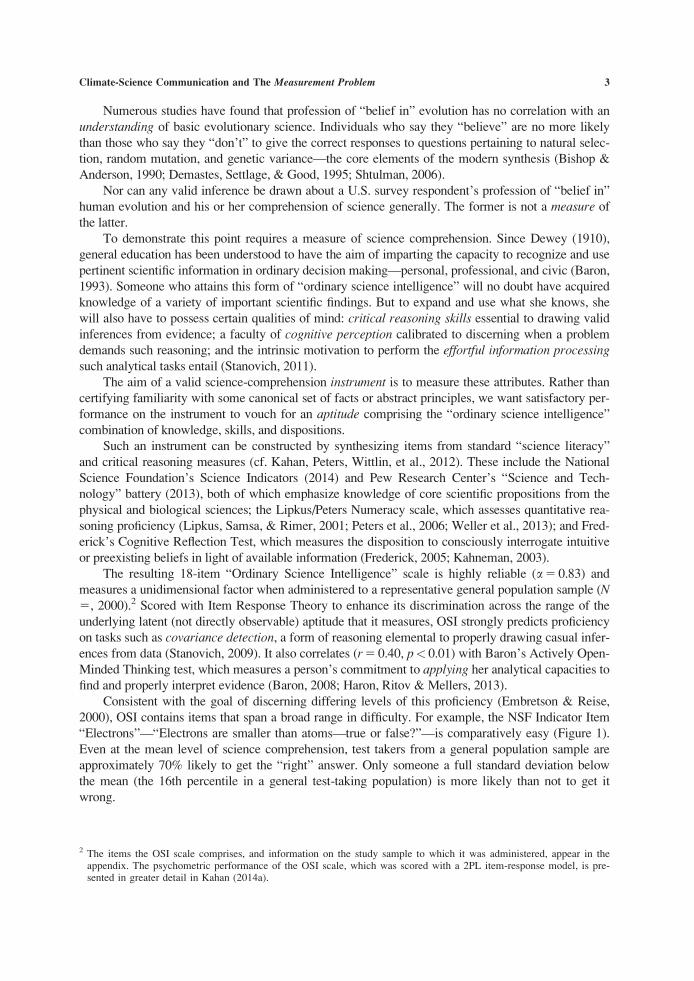
The resulting 18-item “Ordinary Science Intelligence” scale is highly reliable (a 5 0.83) and
measures a unidimensional factor when administered to a representative general population sample (N5, 2000).2 Scored with Item Response Theory to enhance its discrimination across the range of the
underlying latent (not directly observable) aptitude that it measures, OSI strongly predicts proficiency
on tasks such as covariance detection, a form of reasoning elemental to properly drawing casual infer-
ences from data (Stanovich, 2009). It also correlates (r 5 0.40, p< 0.01) with Baron’s Actively Open-
Minded Thinking test, which measures a person’s commitment to applying her analytical capacities to
find and properly interpret evidence (Baron, 2008; Haron, Ritov & Mellers, 2013).
Consistent with the goal of discerning differing levels of this proficiency (Embretson & Reise,
2000), OSI contains items that span a broad range in difficulty. For example, the NSF Indicator Item
“Electrons”—“Electrons are smaller than atoms—true or false?”—is comparatively easy (Figure 1).
Even at the mean level of science comprehension, test takers from a general population sample are
approximately 70% likely to get the “right” answer. Only someone a full standard deviation below
the mean (the 16th percentile in a general test-taking population) is more likely than not to get it
wrong.
2 The items the OSI scale comprises, and information on the study sample to which it was administered, appear in theappendix. The psychometric performance of the OSI scale, which was scored with a 2PL item-response model, is pre-sented in greater detail in Kahan (2014a).
Climate-Science Communication and The Measurement Problem 3
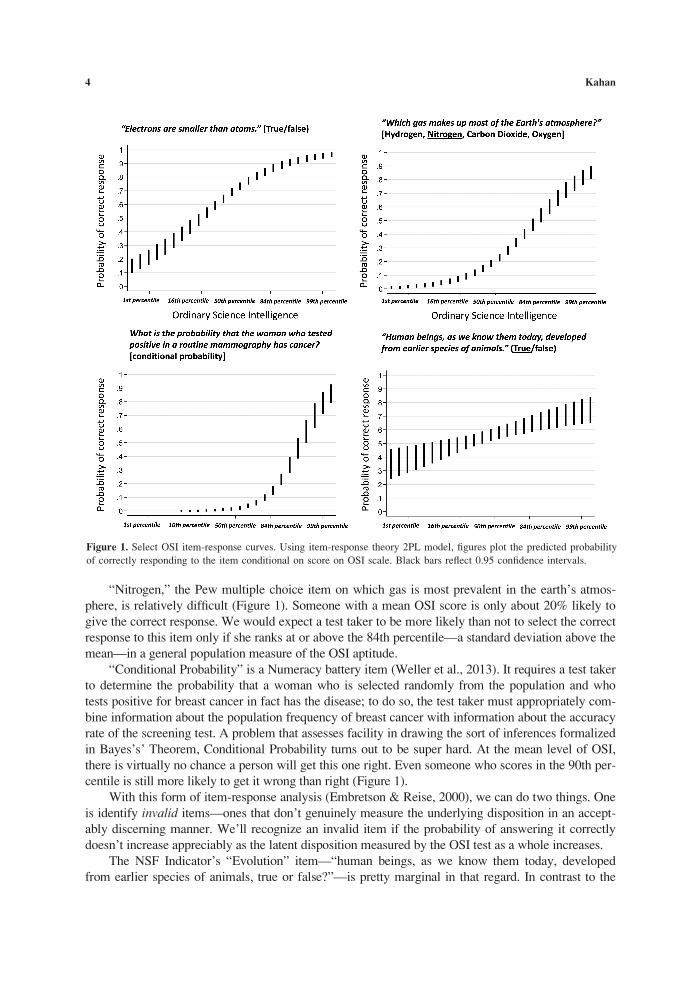
“Nitrogen,” the Pew multiple choice item on which gas is most prevalent in the earth’s atmos-
phere, is relatively difficult (Figure 1). Someone with a mean OSI score is only about 20% likely to
give the correct response. We would expect a test taker to be more likely than not to select the correct
response to this item only if she ranks at or above the 84th percentile—a standard deviation above the
mean—in a general population measure of the OSI aptitude.
“Conditional Probability” is a Numeracy battery item (Weller et al., 2013). It requires a test taker
to determine the probability that a woman who is selected randomly from the population and who
tests positive for breast cancer in fact has the disease; to do so, the test taker must appropriately com-
bine information about the population frequency of breast cancer with information about the accuracy
rate of the screening test. A problem that assesses facility in drawing the sort of inferences formalized
in Bayes’s’ Theorem, Conditional Probability turns out to be super hard. At the mean level of OSI,
there is virtually no chance a person will get this one right. Even someone who scores in the 90th per-
centile is still more likely to get it wrong than right (Figure 1).
With this form of item-response analysis (Embretson & Reise, 2000), we can do two things. One
is identify invalid items—ones that don’t genuinely measure the underlying disposition in an accept-
ably discerning manner. We’ll recognize an invalid item if the probability of answering it correctly
doesn’t increase appreciably as the latent disposition measured by the OSI test as a whole increases.
The NSF Indicator’s “Evolution” item—“human beings, as we know them today, developed
from earlier species of animals, true or false?”—is pretty marginal in that regard. In contrast to the
4 Kahan
Figure 1. Select OSI item-response curves. Using item-response theory 2PL model, figures plot the predicted probability
of correctly responding to the item conditional on score on OSI scale. Black bars reflect 0.95 confidence intervals.

items we’ve looked at so far, the probability of getting the answer “right” on “Evolution” varies rela-
tively little across the range of OSI: the probability of getting the right answer is relatively close to
50% for someone who scores in the 16th percentile, and not higher than that (55%) at either the 50th
percentile or the 84th (65%) (Figure 1). The relative unresponsiveness of the item to differences in the
OSI aptitude, then, is reason to infer that it is either not measuring anything or is measuring something
that is independent of science comprehension as measured by the OSI scale.
Second, item-response functions can be used to identify items that are “biased” in relation to a
subgroup of test takers. “Bias” in this context is used not in its everyday moral sense, in which it con-
notes animus, but rather in its measurement sense, where it signifies a systematic skew toward either
high or low readings in relation to the quantity being assessed. If an examination of an item’s response
profile shows that it tracks the underlying latent disposition in one group but not in another, then that
item is biased in relation to members of the latter group—and thus not a valid measure of the disposi-
tion for a test population that includes them (Osterlind & Everson, 2009).
That’s clearly true for the NSF’s Evolution item as applied to individuals who are relatively reli-
gious. Such individuals—who we can identify with a latent disposition scale (a 5 0.86) that combines
self-reported church attendance, frequency of prayer, and perceived importance of religion in one’s
life (Kahan, 2014a)—respond the same as relatively nonreligious ones with respect to Electron, Nitro-
gen, and Conditional Probability. That is, in both groups, the probability of giving the correct response
varies in the same manner with respect to the underlying science-comprehension disposition that OSI
measures (Figure 2).
Their performance on the Evolution item, however, is clearly discrepant. One might conclude
that Evolution is validly measuring science comprehension for nonreligious test takers, although in
that case it is a very easy question: the likelihood a nonreligious individual with a mean OSI score
will get the “right” answer is 80%—even higher than the likelihood that this person would respond
correctly to the relatively simple Electron item.
In contrast, for a relatively religious individual with a mean OSI score, the probability of giving
the correct response is around 30%. This 50 percentage-point differential tells us that Evolution does
not have the same relationship to the latent OSI disposition in these two groups.
Indeed, it is obvious that Evolution has no relation to OSI whatsoever in relatively religious
respondents. For such individuals, the predicted probability of giving the correct answer does not
increase as individuals display a higher degree of science comprehension. On the contrary, it trends
slightly downward, suggesting that religious individuals highest in OSI are even more likely to get the
question “wrong.”
It should be obvious but just to be clear: these patterns have nothing to do with any correlation
between OSI and religiosity. There is in fact a modest negative correlation between the two
(r 5 20.17, p< 0.01). But the “differential item function” test (Osterlind & Everson, 2009) I’m
applying identifies differences among religious and nonreligious individuals of the same OSI level.
The difference in performance on the item speaks to the adequacy of Evolution as a measure of
knowledge and reasoning capacity and not to the relative quality of those characteristics among mem-
bers of the two groups.
The bias with respect to religious individuals—and hence the invalidity of the item as a measure
of OSI for a general population sample—is most striking in relation to respondents’ performance on
Conditional Probability. There is about a 79% (66 percentage points, at the 0.95 level of confidence)
probability that someone who ranks in the 99th percentile in the OSI assessment will answer this
extremely difficult question correctly. Of course, there aren’t many people who score so highly, but
certainly they do exist, and they are not dramatically less likely to be above average in religiosity. Yet
if one of these exceptionally science-comprehending individuals is relatively religious, the probability
that he or she will give the right answer to the NSF Evolution item is about 23% (613 percentage
points, at the 0.95 level of confidence)—compared to 80% (65%) for the moderately nonreligious
Climate-Science Communication and The Measurement Problem 5
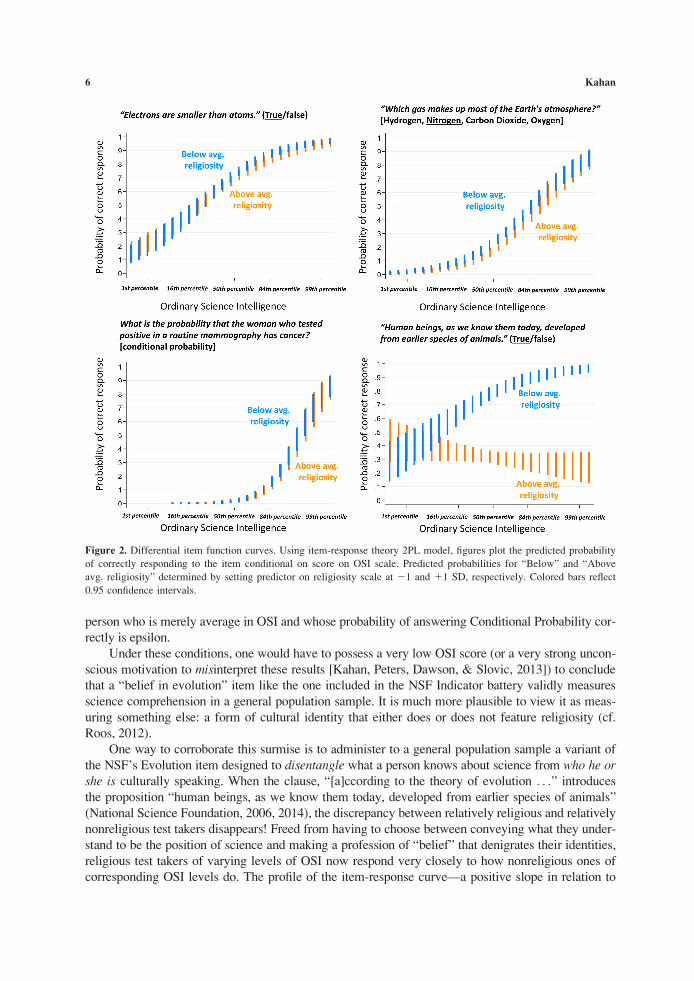
person who is merely average in OSI and whose probability of answering Conditional Probability cor-
rectly is epsilon.
Under these conditions, one would have to possess a very low OSI score (or a very strong uncon-
scious motivation to misinterpret these results [Kahan, Peters, Dawson, & Slovic, 2013]) to conclude
that a “belief in evolution” item like the one included in the NSF Indicator battery validly measures
science comprehension in a general population sample. It is much more plausible to view it as meas-
uring something else: a form of cultural identity that either does or does not feature religiosity (cf.
Roos, 2012).
One way to corroborate this surmise is to administer to a general population sample a variant of
the NSF’s Evolution item designed to disentangle what a person knows about science from who he orshe is culturally speaking. When the clause, “[a]ccording to the theory of evolution . . .” introduces
the proposition “human beings, as we know them today, developed from earlier species of animals”
(National Science Foundation, 2006, 2014), the discrepancy between relatively religious and relatively
nonreligious test takers disappears! Freed from having to choose between conveying what they under-
stand to be the position of science and making a profession of “belief” that denigrates their identities,
religious test takers of varying levels of OSI now respond very closely to how nonreligious ones of
corresponding OSI levels do. The profile of the item-response curve—a positive slope in relation to
Figure 2. Differential item function curves. Using item-response theory 2PL model, figures plot the predicted probability
of correctly responding to the item conditional on score on OSI scale. Predicted probabilities for “Below” and “Above
avg. religiosity” determined by setting predictor on religiosity scale at 21 and 11 SD, respectively. Colored bars reflect
0.95 confidence intervals.
6 Kahan
OSI for both groups—supports the inference that answering this variant of Evolution correctly occu-
pies the same relation to a test taker’s OSI aptitude as does answering the other OSI items correctly.
However, this particular member of the scale turns out to be even easier—even less diagnostic of any-
thing other than a dismally low comprehension level in those who get it wrong—than the simple NSF
Indicator Electron item.
As I mentioned, there is no correlation between saying one “believes” in evolution (that is, select-
ing “true” in response to the NSF Indicator item) and meaningful comprehension of natural selection
and the other elements of the modern synthesis. Sadly, the proportion of individuals who can give a
cogent and accurate account of these mechanisms is low among both “believers” and “nonbelievers,”
even in highly educated samples, including college biology students (Bishop & Anderson, 1990).
Increasing the share of the population that comprehends these important—indeed, astonishing and
awe-inspiring—scientific insights is very much a proper goal for those who want to improve the sci-
ence education that Americans receive.
The incidence of “disbelief” in evolution in the U.S. population, moreover, poses no barrier to
attaining it. This conclusion, too, has been demonstrated by outstanding empirical research in the field
of education science (Lawson & Worsnop, 2006). The most effective way to teach the modern synthe-
sis to high school and college students who “do not believe” in evolution, this research suggests, is to
focus on exactly the same thing one should focus on to teach evolutionary science to those who say
they do “believe” but very likely don’t understand it: the correction of various naive misconceptions
that concern the tendency of people to attribute evolution not to supernatural forces but to functionalist
mechanisms and to the hereditability of acquired traits (Bishop & Anderson, 1990; Demastes et al.,
1995).
Not surprisingly, the students most able to master the basic elements of evolutionary science are
those who demonstrate the highest proficiency in the sort of critical reasoning dispositions on which
science comprehension depends. Yet even among these students, learning the modern synthesis does
not make a student who started out professing “not to believe in” evolution any more likely to say she
now does “believe in” it (Lawson & Worsnop, 2006).
Indeed, treating profession of “belief” as one of the objectives of instruction is thought to make it
less likely that students will learn the modern synthesis. “[E]very teacher who has addressed the issue
of special creation and evolution in the classroom,” the authors of one study conclude,
already knows that highly religious students are not likely to change their belief in spe-
cial creation as a consequence of relative brief lessons on evolution. Our suggestion is
that it is best not to try to [change students’ beliefs], not directly at least. Rather, our
experience and results suggest to us that a more prudent plan would be to utilize
instruction time, much as we did, to explore the alternatives, their predicted consequen-
ces, and the evidence in a hypothetico-deductive way in an effort to provoke argumen-
tation and the use of reflective thought. Thus, the primary aims of the lesson should notbe to convince students of one belief or another, but, instead, to help students (a) gaina better understanding of how scientists compare alternative hypotheses, their predi-cated consequences, and the evidence to arrive at belief and (b) acquire skill in the useof this important reasoning pattern—a pattern that appears to be necessary for inde-pendent learning and critical thought. (Lawson & Worsnop, 2006, p. 165)
This research is to the measurement problem of the science of science communication what the
double-slit experiment is to that of quantum mechanics. All students, including the ones most readily
disposed to learn science, can be expected to protect their cultural identities from the threat that antag-
onistic cultural meanings pose. But all such students—all of them—can also be expected to use their
reasoning aptitudes to acquire understanding of what is known to science. They can and will do
Climate-Science Communication and The Measurement Problem 7

both—at the very same time. But only when the dualistic quality of their reason as collective-
knowledge acquirers and identity protectors is not interfered with by forms of assessment that stray
from science comprehension and intrude into the domain of cultural identity and expression. A simple
(and simple-minded) test can be expected to force disclosure of only one side of their reason.
What Does “Belief in” Global Warming Measure?
Just as we can use empirical methods to determine that a survey item eliciting “belief in” evolu-
tion measures “who one is” rather than “what one knows,” so too can we use these methods to assess
what an item eliciting “belief in” global warming measures.
An illuminating way to start is by seeing what a valid measure of “belief in” global warming
looks like. Figure 4 presents a scatter plot of the responses to a survey item that asked respondents
(2,000 members of a nationally representative sample, interviewed in April/May 2014; the same indi-
viduals whose OSI results were featured in the last section) to rate “how much risk . . . global warming
poses to human health, safety, or prosperity” in “our society.” The item, which I’ll call the “Industrial
Strength Measure” (ISM) (Kahan, 2011), used an 8-point response scale, running from “none at all”
Figure 3. Impact of disentangling identity from knowledge on Evolution item. Using item-response theory 2PL model,
figures plot the predicted probability of correctly responding to the item conditional on score on OSI scale. Predicted
probabilities for “Below” and “Above avg. religiosity” determined by setting predictor on religiosity scale at 21 and 11
SD, respectively. Colored bars reflect 0.95 confidence intervals.
8 Kahan
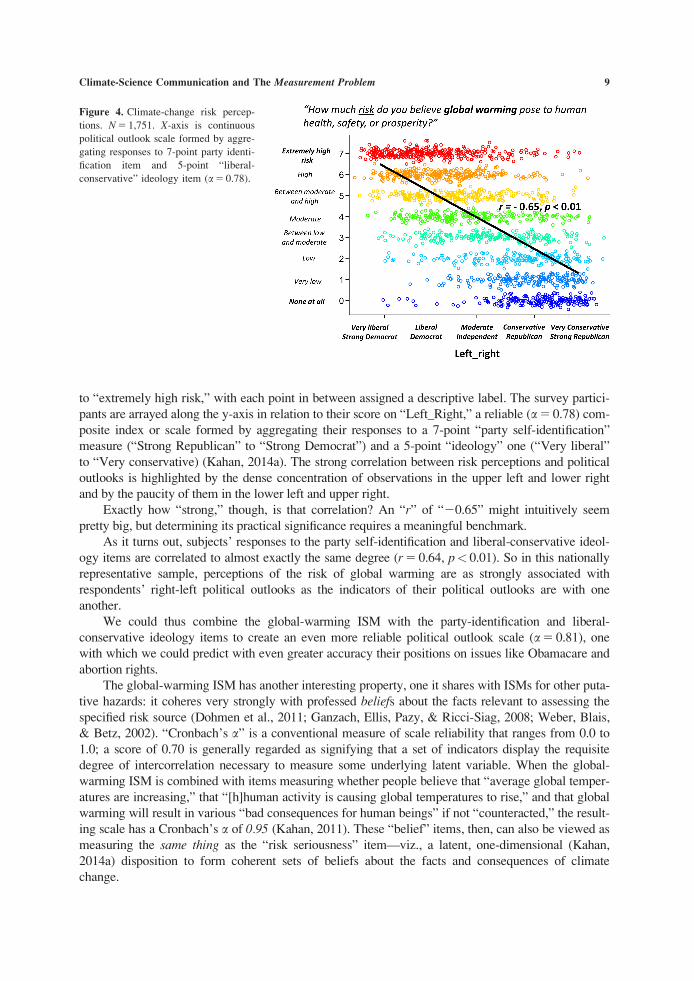
to “extremely high risk,” with each point in between assigned a descriptive label. The survey partici-
pants are arrayed along the y-axis in relation to their score on “Left_Right,” a reliable (a 5 0.78) com-
posite index or scale formed by aggregating their responses to a 7-point “party self-identification”
measure (“Strong Republican” to “Strong Democrat”) and a 5-point “ideology” one (“Very liberal”
to “Very conservative) (Kahan, 2014a). The strong correlation between risk perceptions and political
outlooks is highlighted by the dense concentration of observations in the upper left and lower right
and by the paucity of them in the lower left and upper right.
Exactly how “strong,” though, is that correlation? An “r” of “20.65” might intuitively seem
pretty big, but determining its practical significance requires a meaningful benchmark.
As it turns out, subjects’ responses to the party self-identification and liberal-conservative ideol-
ogy items are correlated to almost exactly the same degree (r 5 0.64, p< 0.01). So in this nationally
representative sample, perceptions of the risk of global warming are as strongly associated with
respondents’ right-left political outlooks as the indicators of their political outlooks are with one
another.
We could thus combine the global-warming ISM with the party-identification and liberal-
conservative ideology items to create an even more reliable political outlook scale (a 5 0.81), one
with which we could predict with even greater accuracy their positions on issues like Obamacare and
abortion rights.
The global-warming ISM has another interesting property, one it shares with ISMs for other puta-
tive hazards: it coheres very strongly with professed beliefs about the facts relevant to assessing the
specified risk source (Dohmen et al., 2011; Ganzach, Ellis, Pazy, & Ricci-Siag, 2008; Weber, Blais,
& Betz, 2002). “Cronbach’s a” is a conventional measure of scale reliability that ranges from 0.0 to
1.0; a score of 0.70 is generally regarded as signifying that a set of indicators display the requisite
degree of intercorrelation necessary to measure some underlying latent variable. When the global-
warming ISM is combined with items measuring whether people believe that “average global temper-
atures are increasing,” that “[h]human activity is causing global temperatures to rise,” and that global
warming will result in various “bad consequences for human beings” if not “counteracted,” the result-
ing scale has a Cronbach’s a of 0.95 (Kahan, 2011). These “belief” items, then, can also be viewed as
measuring the same thing as the “risk seriousness” item—viz., a latent, one-dimensional (Kahan,
2014a) disposition to form coherent sets of beliefs about the facts and consequences of climate
change.
Figure 4. Climate-change risk percep-
tions. N 5 1,751. X-axis is continuous
political outlook scale formed by aggre-
gating responses to 7-point party identi-
fication item and 5-point “liberal-
conservative” ideology item (a 5 0.78).
Climate-Science Communication and The Measurement Problem 9
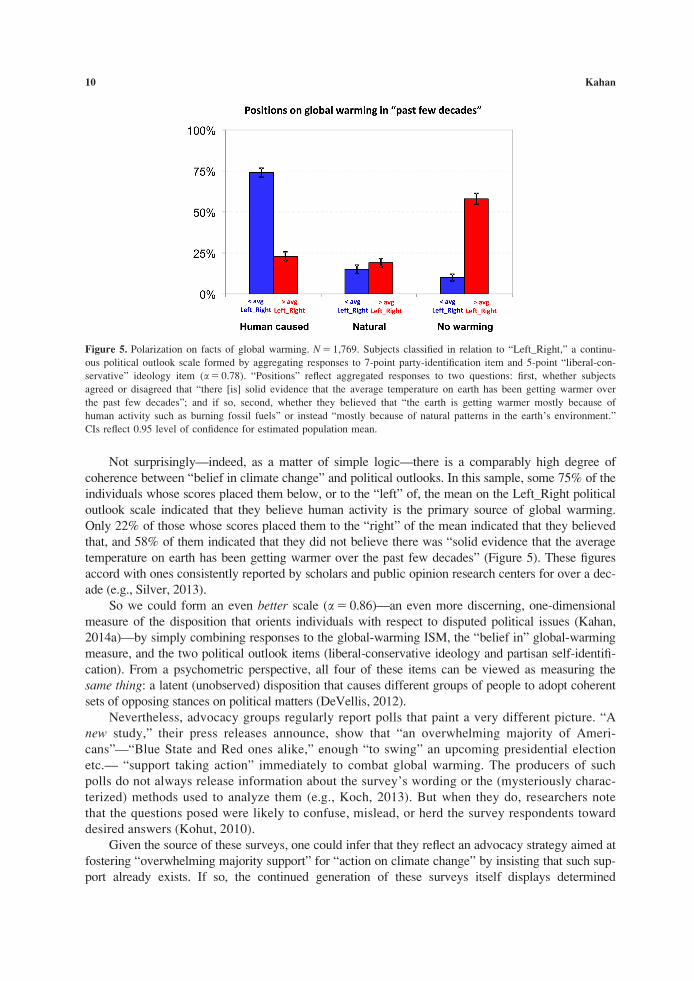
Not surprisingly—indeed, as a matter of simple logic—there is a comparably high degree of
coherence between “belief in climate change” and political outlooks. In this sample, some 75% of the
individuals whose scores placed them below, or to the “left” of, the mean on the Left_Right political
outlook scale indicated that they believe human activity is the primary source of global warming.
Only 22% of those whose scores placed them to the “right” of the mean indicated that they believed
that, and 58% of them indicated that they did not believe there was “solid evidence that the average
temperature on earth has been getting warmer over the past few decades” (Figure 5). These figures
accord with ones consistently reported by scholars and public opinion research centers for over a dec-
ade (e.g., Silver, 2013).
So we could form an even better scale (a 5 0.86)—an even more discerning, one-dimensional
measure of the disposition that orients individuals with respect to disputed political issues (Kahan,
2014a)—by simply combining responses to the global-warming ISM, the “belief in” global-warming
measure, and the two political outlook items (liberal-conservative ideology and partisan self-identifi-
cation). From a psychometric perspective, all four of these items can be viewed as measuring the
same thing: a latent (unobserved) disposition that causes different groups of people to adopt coherent
sets of opposing stances on political matters (DeVellis, 2012).
Nevertheless, advocacy groups regularly report polls that paint a very different picture. “A
new study,” their press releases announce, show that “an overwhelming majority of Ameri-
cans”—“Blue State and Red ones alike,” enough “to swing” an upcoming presidential election
etc.— “support taking action” immediately to combat global warming. The producers of such
polls do not always release information about the survey’s wording or the (mysteriously charac-
terized) methods used to analyze them (e.g., Koch, 2013). But when they do, researchers note
that the questions posed were likely to confuse, mislead, or herd the survey respondents toward
desired answers (Kohut, 2010).
Given the source of these surveys, one could infer that they reflect an advocacy strategy aimed at
fostering “overwhelming majority support” for “action on climate change” by insisting that such sup-
port already exists. If so, the continued generation of these surveys itself displays determined
Figure 5. Polarization on facts of global warming. N 5 1,769. Subjects classified in relation to “Left_Right,” a continu-
ous political outlook scale formed by aggregating responses to 7-point party-identification item and 5-point “liberal-con-
servative” ideology item (a 5 0.78). “Positions” reflect aggregated responses to two questions: first, whether subjects
agreed or disagreed that “there [is] solid evidence that the average temperature on earth has been getting warmer over
the past few decades”; and if so, second, whether they believed that “the earth is getting warmer mostly because of
human activity such as burning fossil fuels” or instead “mostly because of natural patterns in the earth’s environment.”
CIs reflect 0.95 level of confidence for estimated population mean.
10 Kahan
inattention to over a decade’s worth of real-world evidence showing that advocacy polls of this sort
have failed to dissipate the deep partisan conflict that various straightforward items relating to global-
warming measure.
Indeed, that is the key point: items that show “an overwhelming majority of Americans” believe
one or another thing, or support one or another policy, relating to climate change necessarily aren’t
measuring the same thing as are all the items that cohere with ISM. The question, then, is simply which
items—ones that cohere with one another and ISM and that attest to polarization over climate change or
ones that do not cohere with anything in particular and that report a deep bipartisan consensus in favor
of “taking action”—are more meaningfully tracking the real-world phenomena of interest. If one is try-
ing to genuinely make sense of the world and help others to do the same (of course, people can and do
conduct public opinion surveys for other purposes all the time), the question answers itself.
Serious opinion scholars know that when public-policy survey items are administered to a general
population sample, it is a mistake to treat the responses as valid and reliable measures of the particular
positions or arguments those items express (Krosnick, Malhotra, & Mittal, 2014). One can never be
sure that an item is being understood as one intended. In addition, if, as is so for most concrete policy
issues, the items relate to an issue that members of the general population have not heard of or formed
opinions on, then the responses are not modeling anything that people in the general population are
thinking in the real world; rather they are modeling what such people would say only in the strange,
artificial environment they are transported into when a pollster asks them to express positions not
meaningfully connected to their lives (Bishop, 2005; Schuman, 1998).
Of course many public policy issues are ones on which people have reflected and adopted stances
of meaning and consequence to them. But even in that case, responses to survey items relating to
those issues are not equivalent to statements or arguments being asserted by a participant in political
debate. The items were drafted by someone else and thrust in front of the survey participants; their
responses consist of manifestations of pro or con attitudes, registered on a coarse, contrived metric.
Because the response to any particular item is at best only a noisy indicator of that attitude, the princi-
pal way to confirm that an item is genuinely measuring anything, and to draw inferences about what
that is—is to show that responses to it cohere with other things (responses to other items, behavior,
performance on objective tests, and so forth), the meaning of which is already reasonably understood
(Berinsky & Druckman, 2007; Bishop, 2005; Gliem & Gliem, 2003; Zaller, 1992).
The striking convergence of items measuring perceptions of global-warming risk and like facts,
on the one hand, and ones measuring political outlooks, on the other, suggests they are all indicators
of a single latent variable. The established status of political outlooks as indicators of cultural identity
(Kahan, Peters, Wittlin, et al., 2012) supports the inference that that is exactly what that latent variable
is. Indeed, the inference can be made even stronger by substituting for, or fortifying political outlooks
with, even more discerning cultural identity indicators, such as cultural worldviews and their interac-
tion with demographic characteristics such as race and gender (Kahan, Braman, Gastil, Slovic, &
Mertz, 2007; McCright & Dunlap, 2012). In sum, whether people “believe in” climate change, like
whether they “believe in” evolution, expresses who they are.
As do surveys on the proportion of Americans who “disbelieve in” evolution, surveys on the pro-
portion who “disbelieve in” human-caused global warming (also about 50%) predictably generate
fretting in the media about the quality of U.S. science education. Here too the commentators betray
their own inattention to what has been shown by the scientific study of how belief in global warming
relates to science comprehension: the former is not a measure of the latter. Studies have shown that at
the general population level, there is no meaningful correlation between belief in human-caused cli-
mate change and various measures of science knowledge and reasoning dispositions (Kahan, Peters,
Wittlin, et al., 2012).
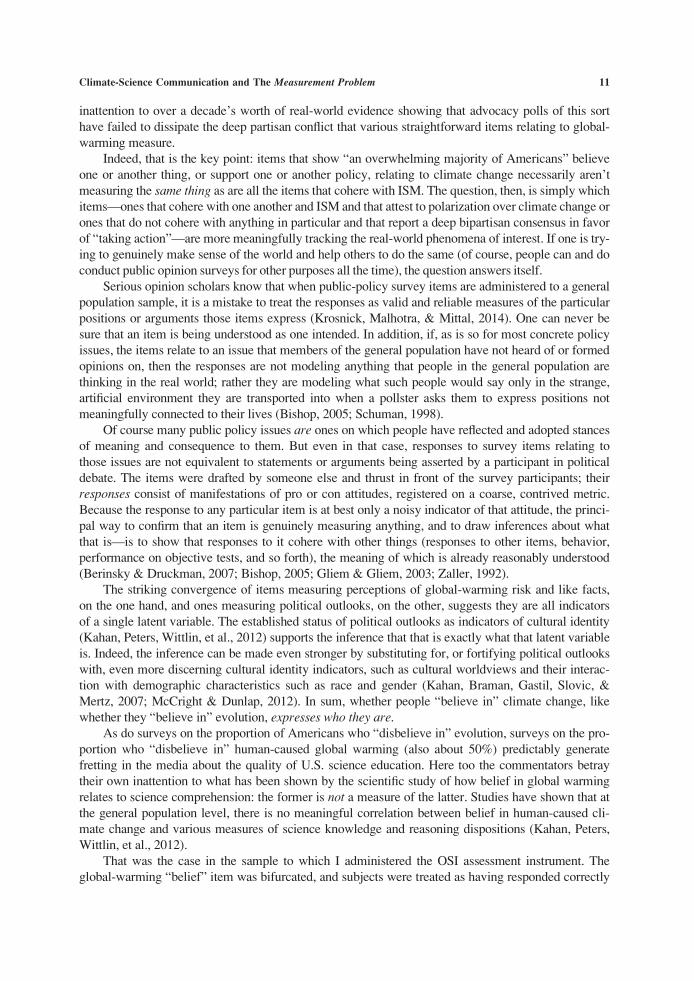
That was the case in the sample to which I administered the OSI assessment instrument. The
global-warming “belief” item was bifurcated, and subjects were treated as having responded correctly
Climate-Science Communication and The Measurement Problem 11
if they indicated both that “there [is] solid evidence that the average temperature on earth has been
getting warmer over the past few decades” and that “the earth is getting warmer mostly because of
human activity such as burning fossil fuels” as opposed to “mostly because of natural patterns in the
earth’s environment.” As was so for the NSF Indicator version of Evolution, the probability of a cor-
rect response was largely unresponsive to differences in the disposition measured by OSI. In addition,
the probability of a correct response varied dramatically in relation to political outlooks. At the OSI
mean, an individual who identified as “Liberal” and “Democrat” had close to an 80% likelihood of
answering the question correctly, whereas one who identified as “Conservative” and “Republican”
had under a 20% likelihood of doing so. Indeed, the likelihood of a correct response sloped downward
for individuals who were conservative Republicans: at a 11 SD OSI score, the predicted probability
of a correct answer was only 13% (6 3%, LC 5 0.95) for such individuals—as opposed to 90%
(6 3%) for liberal Democrats.
Thus, to say there is “no relationship” between science comprehension and belief in climate
change would definitely be incorrect. There is a very large one. But the nature of it depends on the
test takers’ identities. Those whose cultural commitments predispose them to be concerned about cli-
mate change become even more so as their level of science comprehension increases. Those whose
commitments predispose them to be less concerned become all the more skeptical (Figure 6). Far
from increasing the likelihood that individuals will agree that human activity is causing climate
change, higher science comprehension just makes the response that a person gives to a “global-
warming belief” item an even more reliable indicator of who he or she is.
Is Identity-Protective Cognition Irrational?
The idea that “disbelief” in global warming is attributable to low “science literacy” is not the
only explanation for public conflict over climate change that fails to survive an encounter with actual
evidence. The same is true for the proposition that such controversy is a consequence of “bounded
rationality.”
Indeed, the “bounded rationality thesis” (BRT) is probably the most popular explanation for pub-
lic controversy over climate change. Members of the public, BRT stresses, rely on “simplifying heu-
ristics” that reflect the emotional vividness or intensity of their reactions to putative risk sources
Figure 6. Differential item function: belief in climate change. Using item-response theory 2PL model, figures plot the
predicted probability of correctly responding to the item conditional on score on OSI scale. Predicted probabilities for
“Liberal Democrat” and “Conservative Republican” determined by setting predictor on Left_Right scale at 21 and 11
SD, respectively. Colored bars reflect 0.95 confidence intervals.
12 Kahan
(Marx et al., 2007) but that often have “little correspondence to more objective measures of risk”
(Weber, 2006, p. 104). Those more objective measures, which “quantify either the statistical unpre-
dictability of outcomes or the magnitude or likelihood of adverse consequences” (p. 104), are the ones
that scientists employ. Using them demands an alternative “analytical processing” style that is
acquired through scientific training and that “counteract[s] the emotionally comforting desire for con-
firmation of one’s beliefs” (Weber & Stern, 2011, p. 319).
BRT is very plausible because it reflects a genuine and genuinely important body of work on the
role that overreliance on heuristic (or “System 1”) reasoning as opposed to conscious, analytic
(“System 2”) reasoning plays in all manner of cognitive bias (Frederick, 2005; Kahneman, 2003). But
many more surmises about how the world works are plausible than are true (Watts, 2011). That is
why it makes sense to clearly identify accounts like BRT as “conjectures” in need of empirical testing
rather than as genuine “explanations” (Weber & Stern, 2011).
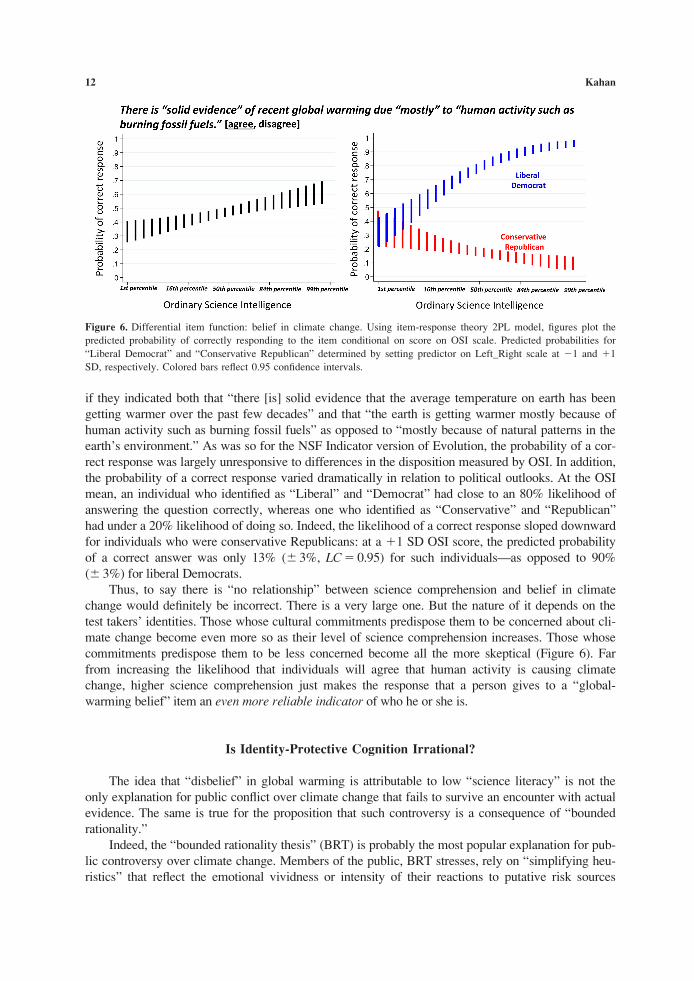
BRT generates a straightforward hypothesis about perception of climate change risks. If the rea-
son ordinary citizens are less concerned about climate change than they should be is that that they
overrely on heuristic, System 1 forms of reasoning, then one would expect climate concern to be
higher among the individuals most able and disposed to use analytical, System 2 forms of reasoning. Inaddition, because these conscious, effortful forms of analytical reasoning are posited to “counteract the emotionally comforting desire for confirmation of one’s beliefs” (Weber & Stern, 2011, p. 319), one
would also predict that polarization ought to dissipate among culturally diverse individuals whose
proficiency in System 2 reasoning is comparably high.
This manifestly does not occur. Multiple studies, using a variety of cognitive proficiency measures,
have shown that individuals disposed to be skeptical of climate change become more so as their profi-
ciency and disposition to use the forms of reasoning associated with System 2 increase (Hamilton,
2011; Hamilton, Cutler, & Schaefer, 2012; Kahan, Peters, Wittlin, et al., 2012). In part for this reason—
and in part because those who are culturally predisposed to be worried about climate change do become
more alarmed as they become more proficient in analytical reasoning—polarization is in fact higheramong individuals who are disposed to make use of System 2, analytic reasoning, than it is among those
disposed to rely on System 1, heuristic reasoning (Kahan, Peters, Wittlin, et al., 2012). This is the result
observed among individuals who are highest in OSI, which in fact includes Numeracy and Cognitive
Reflection Test items shown to predict resistance to System 1 cognitive biases (Figure 7).
Figure 7. Impact of science comprehension on climate change polarization. The right-hand panel (“Reality”) is based on
a reanalysis of the data in Kahan, Peters, Wittlin, et al. (2012). The “science comprehension” scale is the one used in
that article. The “Left_Right” scale was formed by aggregating the 5-point liberal-conservative ideology measure and 7-
point party self-identification measures (a 5 0.75). Separate regressions were fit for subjects defined in relation to their
score on the mean of Left_Right.
Climate-Science Communication and The Measurement Problem 13
The source of the public conflict over climate change is not too little rationality but in a sense toomuch. Ordinary members of the public are too good at extracting from information the significance it has
in their everyday lives. What an ordinary person does—as consumer, voter, or participant in public dis-
cussions—is too inconsequential to affect either the climate or climate-change policymaking. Accord-
ingly, if her actions in one of those capacities reflects a misunderstanding of the basic facts on global
warming, neither she nor anyone she cares about will face any greater risk. But because positions on cli-
mate change have become such a readily identifiable indicator of ones’ cultural commitments, adopting
a stance toward climate change that deviates from the one that prevails among her closest associates
could have devastating consequences, psychic and material. Thus, it is perfectly rational—perfectly in
line with using information appropriately to achieve an important personal end—for that individual to
attend to information in a manner that more reliably connects her beliefs about climate change to the
ones that predominate among her peers than to the best available scientific evidence (Kahan, 2012).
If that person happens to enjoy greater proficiency in the skills and dispositions necessary to
make sense of such evidence, then she can simply use those capacities to do an even better job at form-
ing identity-protective beliefs. That people high in numeracy, cognitive reflection and like dispositions
use these abilities to find and credit evidence supportive of the position that predominates in their cul-
tural group and to explain away the rest has been demonstrated experimentally (Kahan, 2013b; Kahan
et al., 2013). Proficiency in the sort of reasoning that is indeed indispensable for genuine science com-
prehension does not bring the beliefs of individuals on climate change into greater conformity with
those of scientists; it merely makes those individuals’ beliefs even more indicators or measures of the
relationship between those beliefs and the identities of those who share their defining commitments.
When “what do you believe” about a societal risk validly measures “who are you?” or “whose
side are you on?,” identity-protective cognition is not a breakdown in individual reason but a form of
it. Without question, this style of reasoning is collectively disastrous: the more proficiently it is exer-
cised by the citizens of a culturally diverse democratic society, the less likely they are to converge on
scientific evidence essential to protecting them from harm. But the predictable tragedy of this outcome
does not counteract the incentive individuals face to use their reason for identity protection. Only
changing what that question measures—and what answers to it express about people—can.
Provoking the Interference Pattern: “Messaging” Scientific Consensus
1. The “external validity” question. On May 16, 2013, the journal Environmental Research Letterspublished an article entitled “Quantifying the Consensus on Anthropogenic Global Warming in the
Scientific Literature.” In it, the authors reported that they had reviewed the abstracts of 12,000 articles
published in peer-reviewed science journals between 1991 and 2011 and found that “among abstracts
expressing a position on AGW, 97.1% endorsed the consensus position that humans are causing
global warming” (Cook et al., 2013).
“This is significant,” the lead author was quoted as saying in a press statement issued by his uni-
versity, “because when people understand that scientists agree on global warming, they’re more likely
to support policies that take action on it.” “Making the results of our paper more widely-known,” he
continued, “is an important step toward closing the consensus gap”—between scientists who agree
with one another about global warming and ordinary citizens who don’t—“and increasing public sup-
port for meaningful climate action” (University of Queensland, 2013).
The proposition that disseminating the results of ERL study would reduce public conflict over cli-
mate change was an empirical claim not itself tested by the authors of the ERL article. What sorts of
evidence might one use (or have used) to assess it?
Opinion surveys are certainly relevant. They show, to start, that members of the U.S. general pub-
lic—Republican and Democrat, religious and nonreligious, White and Black, rich and poor—express
14 Kahan

strongly pro-science attitudes and hold scientists in high regard (National Science Foundation 2014,
chap. 7; Pew Research Center, 2009). In addition, no recognizable cultural or political group of conse-
quence in American political life professes to disagree with, or otherwise dismiss the significance of,
what scientists have to say about policy-relevant facts. On the contrary, on myriad disputed policy
issues—from the safety of nuclear power to the effectiveness of gun control—members of the public
in the United States (and other liberal democratic nations, too) indicate that the position that predomi-
nates in their political or cultural group is the one consistent with scientific consensus (Kahan,
Jenkins-Smith, & Braman, 2011; Lewendowsky, Gignac, & Vaughn, 2012).
Same thing for climate change. As the ERL authors noted, surveys show a substantial proportion
of the U.S. general public rejects the proposition that there is “scientific consensus” on the existence
and causes of climate change. Indeed, the proportion that believes there is no such consensus consists
of exactly the same proportion that says it does not “believe in” human-caused global warming
(Kahan et al., 2011).
So, the logic goes, all one has to do is correct the misimpression of that portion of the public.
Members of the public very sensibly treat as the best available evidence what science understands to
be the best available evidence on facts of policy significance. Thus, “when people understand that sci-
entists agree on global warming, they’re more likely to support policies that take action on it” (Uni-
versity of Queensland, 2013).
But there is still more evidence of a type that any conscientious adviser to climate-science com-
municators would want them to consider carefully. That evidence bears directly on the public-opinion
impact of “[m]aking the results” of studies like the ERL one “more widely-known” (University of
Queensland, 2013).
The ERL study was not the first one to “[q]uantify[]the consensus on anthropogenic global
warming”; it was at least the sixth, the first one of which was published in Science in 2004 (Anderegg,
Prall, Harold, & Schneider, 2010; Doran & Zimmerman, 2009; Lichter, 2008; Oreskes, 2004; Powell,
2012). Appearing on average once every 18 months thereafter, these studies, using a variety of meth-
odologies, all reached conclusions equivalent to the one reported in ERL article. Like the ERL article,
moreover, each of these earlier studies was accompanied by a high degree of media attention.
Indeed, the “scientific consensus” message figured prominently in the $300 million social market-
ing campaign by Alliance for Climate Protection, the advocacy group headed by former Vice Presi-
dent Al Gore, whose “Inconvenient Truth” documentary film and book both prominently featured the
2004 “consensus” study published in Science, which Gore (2007) characterized as showing that “0%”
of the articles published in peer-reviewed journals dispute human-caused global warming. An elec-
tronic search of major news sources finds over 6,000 references to “scientific consensus” and “global
warming” or “climate change” in the period from 2005 to May 1, 2013.
There is thus a straightforward way to assess the ERL authors’ prediction that “[m]aking the
results” of their study “more widely-known” can be expected to influence public opinion. It is to exam-
ine how opinion varied in relation to efforts to publicize these earlier “scientific consensus” studies.
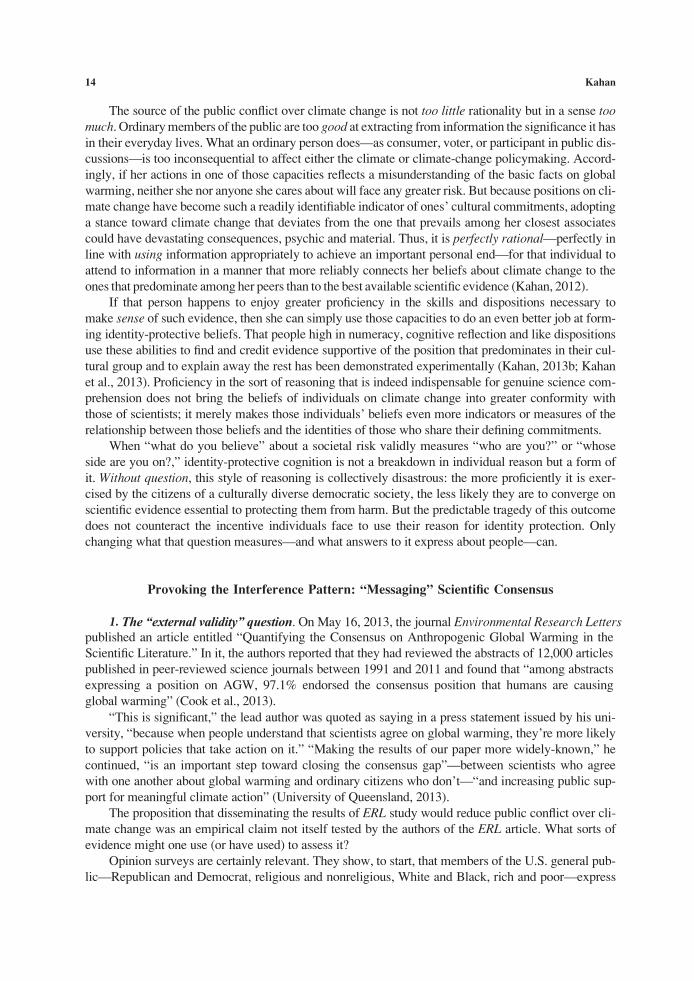
Figure 8 plots the proportion of the U.S. general public who selected “human activities” as
opposed to “natural changes in the environment” as the main cause of “increases in the Earth’s tem-
perature over the last century” in polls conducted from 2003 to 2013 (in this Gallup item [Saad,
2014]), there is no option to indicate rejection of the premise that the earth’s temperature hasincreased, a response a majority or near majority of Republicans tend to select when offered). The
year in which “scientific consensus” studies appeared is indicated on the x-axis, as is the year in which
“Inconvenient Truth” was released.
Nothing happened.
Or, in truth, a lot happened. Many additional important scientific studies corroborating human-
caused global warming were published during this time. Many syntheses of the data were issued by
high-profile institutions in the scientific community, including the U.S. National Academy of
Climate-Science Communication and The Measurement Problem 15
Sciences, the Royal Society, and the IPCC, all of which concluded that human activity is heating the
planet. High-profile and massively funded campaigns to dispute and discredit these sources were con-
ducted too. People endured devastating heat waves, wild fires, and hurricanes, punctuated by long
periods of weather normality. The Boston Red Sox won their first World Series title in over eight
decades.
It would surely be impossible to disentangle all of these and myriad other potential influences on
U.S. public opinion on global warming. But one doesn’t need to do that to see that whatever the ear-
lier scientific-consensus “messaging” campaigns added to the mix did not “clos[e] the consensus gap”
(University of Queensland, 2013).
Why, then, might a reflective, realistic person conclude otherwise—and indeed counsel commu-
nicators to spend millions of dollars to repeat exactly that sort of “messaging” campaign?
The answer could be laboratory studies. One (Lewendowsky et al., 2012), published in NatureClimate Change, reported that the mean level of agreement with the proposition “CO2 emissions
cause climate change” was higher among subjects exposed to a “97% scientific consensus” message
than among subjects in a control condition (4.4 vs. 4.0 on a 5-point Likert scale). Immediately after
being advised by the experimenter that “97% of scientists” accept CO2 emissions increase global tem-
peratures, those subjects also formed a higher estimate of the proportion of scientists who believe that
(88% vs. 67%).
Is it possible to reconcile this result with the real-world data on the failure of previous “scientific
consensus” messaging campaigns to influence U.S. public opinion? The most straightforward expla-
nation would be that the NCC experiment was not externally valid—i.e., it did not realistically model
the real-world dynamics of opinion-formation relevant to the climate change dispute.
The problem is not the sample (90 individuals interviewed face-to-face in Perth, Australia). If
researchers were to replicate this result using a U.S. general population sample, the inference of exter-
nal invalidity would be exactly the same.
For “97% consensus” messaging experiments to justify a social marketing campaign featuring
studies like the ERL one, it has to be reasonable to believe that what investigators are observing in lab-
oratory conditions—ones created specifically for the purpose of measuring opinion—tell us what is
likely to happen when communicators emphasize the “97% consensus” message in the real world.
Figure 8. Shift in public opinion in
relation to release and publicization of
studies quantifying extent of scientific
consensus on climate change. Icons on
x-axis represent dates of studies quanti-
fying scientific consensus, plus release
of the documentary Inconvenient Truthand the commencement of the associ-
ated social-marketing campaign.
16 Kahan
Such a strategy has already been tried in the real world. It didn’t work.
There are, to be sure, many more things going on in the world, including countermessaging, than
are going on in a “97% consensus” messaging experiment. But if those additional things account for
the difference in the results, then that is exactly why that form experiment must be regarded as exter-
nally invalid: it is omitting real-world dynamics that we have reason to believe, based on real-world
evidence, actually matter in the real world.
On this account, the question to be investigated is not whether a “97% consensus” messaging
campaign will influence public opinion but why it hasn’t done so over a 10-year trial. The answer, pre-
sumably, is not that members of the public are divided on whether they should give weight to the con-
clusions scientists have reached in studying risks and other policy relevant facts. Those on both sides
of the climate change debate believe that the other side’s position is the one inconsistent with scien-
tific consensus.
The ERL authors’ own recommendation to publicize their study results presupposes publicconsensus in the United States in support of using the best available scientific evidence in policymaking.
The advice of those who continue to champion “97% consensus” social marketing campaigns does, too.
So why have all the previous highly funded efforts to make “people understand that scientists
agree on global warming” so manifestly failed to “close the consensus gap” (University of Queens-
land, 2013)? There are studies that seek to answer exactly that question as well. They find that
culturally biased assimilation—the tendency of people to fit their perceptions of disputed facts to
ones that predominate in their cultural group (Kahan, Braman, Gastil, Slovic, & Cohen, 2009)—
applies to their assessment of evidence of scientific consensus just as it does to their assessment
of all other manner of evidence relating to climate change (Corner, Whitmarsh, & Xenias, 2012;
Kahan et al., 2011).
When people are shown evidence relating to what scientists believe about a culturally disputed
policy-relevant fact (e.g., is the earth heating up? is it safe to store nuclear wastes deep underground?
does allowing people to carry hand guns in public increase the risk of crime—or decrease it?), they
selectively credit or dismiss that evidence depending on whether it is consistent with or inconsistent
with their cultural group’s position. As a result, they form polarized perceptions of scientific consen-
sus even when they rely on the same sources of evidence.
These studies imply misinformation is not a decisive source of public controversy over climate
change. People in these studies are misinforming themselves by opportunistically adjusting the weight
they give to evidence based on what they are already committed to believing. This form of identity-
protective motivated reasoning (Cohen, 2003; Sherman & Cohen, 2006) occurs, this work suggests,
not just in the climate change debate but in numerous others in which these same cultural groups trade
places being out of line with the National Academy of Sciences’ assessments of what “expert con-
sensus” is (Kahan et al., 2011).
To accept that this dynamic explains persistent public disagreement over scientific consensus on
climate change, one has to be confident that these experimental studies are externally valid. Real-
world communicators should definitely think carefully about that. But because these experiments are
testing alternative explanations for something we clearly observe in the real world (deep public divi-
sion on climate change), they don’t suffer from the obvious defects of studies that predict we should
already live in world we don’t see.
2. What is the “message” of “97%”? “External invalidity” is not an incorrect explanation of why“scientific consensus” lab experiments produce results divorced from the observable impact of real-
world scientific-consensus “messaging” campaigns. But it is incomplete.
We can learn more by treating the lab experiments and the real-world campaigns as studies of
how people react to entirely different types of messages. If we do, there is no conflict in their results.
They both show individuals rationally extracting from “messages” the information that is being
communicated.
Climate-Science Communication and The Measurement Problem 17
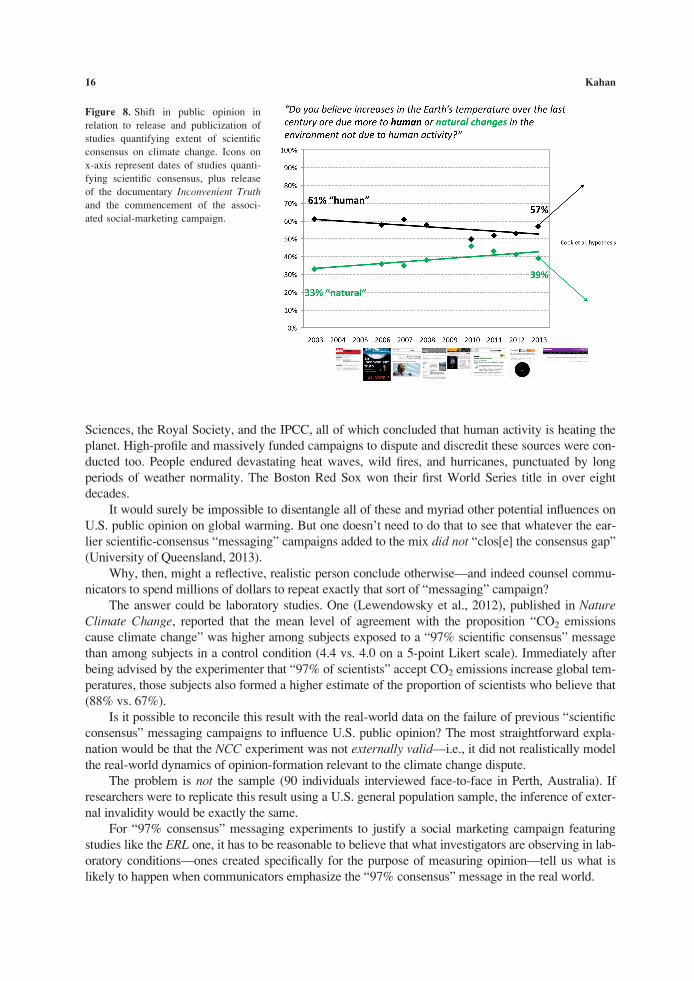
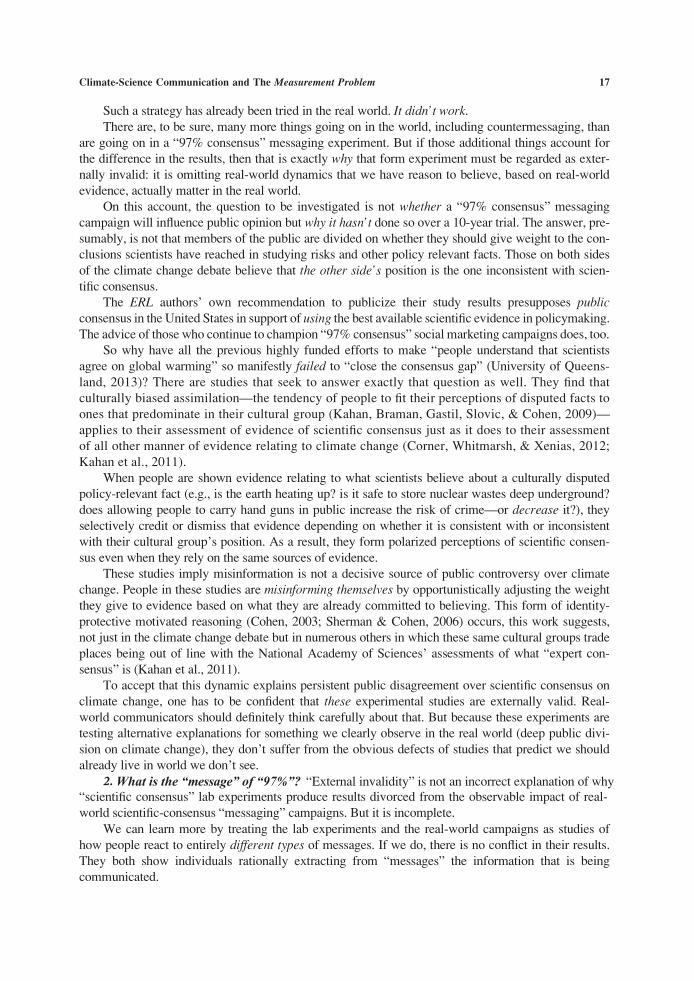
Consider what the “97% scientific consensus” message looks like outside the lab. There people
are likely to “receive” it in the form it takes in videos produced by the advocacy group Organizing for
Action. Entitled “X is a climate change denier,” the videos consist of a common template with a vari-
able montage of images and quotes from “X,” one of two dozen Republican members of Congress
(“Speaker Boehner,” “Senator Marco Rubio,” “Senator Ted Cruz”). Communicators are expected to
select “X” based on the location in which they plan to disseminate the video.
The video begins with an angry, perspiring, shirt-sleeved President Obama delivering a speech:
“Ninety-seven percent of scientists,” he intones, shaking his fist. After he completes his sentence, a
narrator continues, “There’s not a lot of debate left in this debate: NASA and 97% of the nation’s sci-
entists agree . . .,” a message reinforced by a cartoon image of a laboratory beaker and the printed
message “97% OF SCIENTISTS AGREE” (Figure 9).
After additional cartoon footage (e.g., a snowman climbing into a refrigerator) and a bar graph
(“Events with Damages Totaling $1 billion or More,” the tallest column of which is labeled
“Tornadoes . . .”), the video reveals that X is a “CLIMATE CHANGE DENIER.” X is then labeled
“RADICAL & DANGEROUS” because he or she disputes what “NASA” and the “NATIONAL
ACADEMY OF SCIENCES” and “ 97% of SCIENTISTS” (bloc letters against a background of car-
toon beakers) all “AGREE” is true (Figure 9).
What’s the lesson? Unless the viewer is a genuine idiot, the one thing she already knows is what
“belief” or “disbelief in” global warming means. The position someone adopts on that question con-
veys who she is—whose side she’s on, in a hate-filled, anxiety-stoked competition for status between
opposing cultural groups (Kahan, 2007).
If the viewer had not yet been informed that the message “97% of scientists agree” is one of the
stock phrases used to signal one cultural group’s contempt for the other, she has now been put on
notice. It is really pretty intuitive: who wouldn’t be insulted by someone screaming in her face that
she and everyone she identifies with “rejects science” (Gore, 2007)?
Figure 9. “97% consensus” message in OFA “X is a climate denier video.”
18 Kahan
The viewer can now incorporate the “97% consensus” trope into her own “arguments” if she
finds it useful or enjoyable to demonstrate convincingly that she belongs to the tribe that “believes in”
global warming. Or if she is part of the other one, she can now more readily discern who isn’t by their
use of this tagline to heap ridicule on the people she respects.
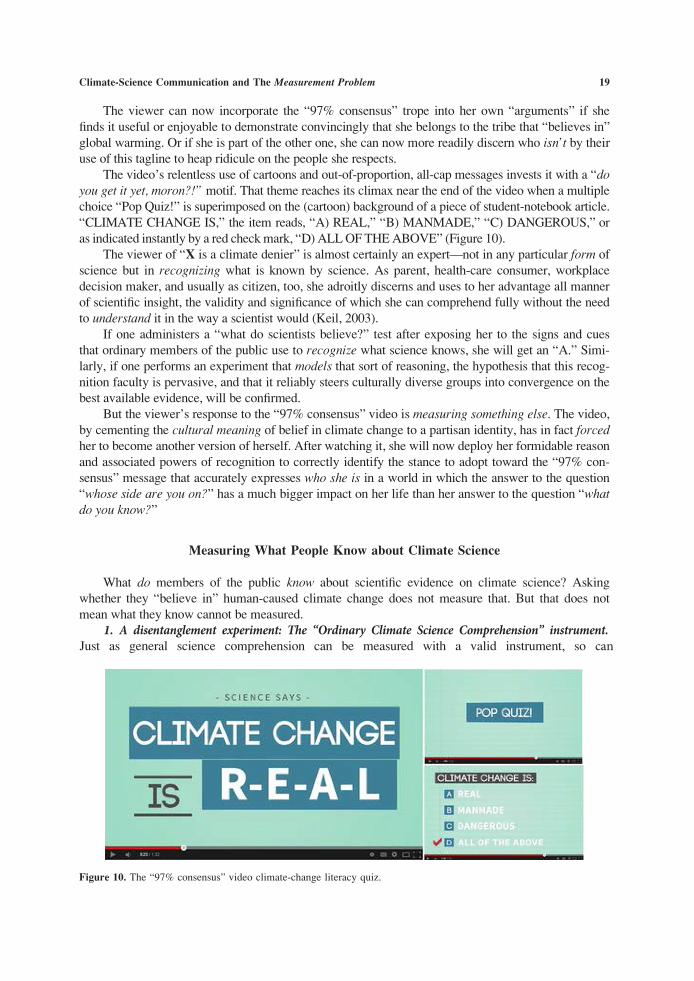
The video’s relentless use of cartoons and out-of-proportion, all-cap messages invests it with a “doyou get it yet, moron?!” motif. That theme reaches its climax near the end of the video when a multiple
choice “Pop Quiz!” is superimposed on the (cartoon) background of a piece of student-notebook article.
“CLIMATE CHANGE IS,” the item reads, “A) REAL,” “B) MANMADE,” “C) DANGEROUS,” or
as indicated instantly by a red check mark, “D) ALL OF THE ABOVE” (Figure 10).
The viewer of “X is a climate denier” is almost certainly an expert—not in any particular form of
science but in recognizing what is known by science. As parent, health-care consumer, workplace
decision maker, and usually as citizen, too, she adroitly discerns and uses to her advantage all manner
of scientific insight, the validity and significance of which she can comprehend fully without the need
to understand it in the way a scientist would (Keil, 2003).
If one administers a “what do scientists believe?” test after exposing her to the signs and cues
that ordinary members of the public use to recognize what science knows, she will get an “A.” Simi-
larly, if one performs an experiment that models that sort of reasoning, the hypothesis that this recog-
nition faculty is pervasive, and that it reliably steers culturally diverse groups into convergence on the
best available evidence, will be confirmed.
But the viewer’s response to the “97% consensus” video is measuring something else. The video,
by cementing the cultural meaning of belief in climate change to a partisan identity, has in fact forcedher to become another version of herself. After watching it, she will now deploy her formidable reason
and associated powers of recognition to correctly identify the stance to adopt toward the “97% con-
sensus” message that accurately expresses who she is in a world in which the answer to the question
“whose side are you on?” has a much bigger impact on her life than her answer to the question “whatdo you know?”
Measuring What People Know about Climate Science
What do members of the public know about scientific evidence on climate science? Asking
whether they “believe in” human-caused climate change does not measure that. But that does not
mean what they know cannot be measured.
1. A disentanglement experiment: The “Ordinary Climate Science Comprehension” instrument.Just as general science comprehension can be measured with a valid instrument, so can
Figure 10. The “97% consensus” video climate-change literacy quiz.
Climate-Science Communication and The Measurement Problem 19
comprehension of the science on climate change in particular. Doing so requires constructing items
the responses to which validly and reliably indicate test takers’ climate-science-comprehension level.
The idea of “climate-science comprehension” is hardly straightforward. If one means by it the
understanding of and facility with relevant bodies of knowledge essential to doing climate-science
research, then any valid instrument is certain to show that the level of climate-science comprehension
is effectively zero in all but a very tiny fraction of the population.
But there are many settings in which the quality of nonexperts’ comprehension of much more
basic elements of climate science will be of practical concern. A high school science teacher, for
example, might aim to impart an admittedly nonexpert level of comprehension in students for the
sake of equipping and motivating them to build on it in advanced studies. Likewise, without being
experts themselves, ordinary members of the public can be expected to benefit from a level of com-
prehension that enables them reliably to recognize and give proper effect to valid climate science that
bears on their decision making, whether as homeowners, businesspeople, or democratic citizens.
Assume, then, that our goal is to form an “ordinary climate science intelligence” (OCSI) instru-
ment. Its aim would certainly not be to certify possession of the knowledge and reasoning dispositions
that a climate scientist’s professional judgment comprises. It will come closer to the sort of instrument
a high school teacher might use, but even here no doubt fall short of delivering a sufficiently complete
and discerning measure of the elements of comprehension he or she is properly concerned to instill in
students. What the OCSI should adequately measure—at least this would be the aspiration of it—is a
form of competence in grasping and making use of climate science that an ordinary person would ben-
efit from in the course of participating in ordinary decision making, individual and collective.
There are two challenges in constructing such an instrument. The first and most obvious is the
relationship between climate change risk perceptions and individuals’ cultural identities. To be valid,
the items that the assessment comprises must be constructed to measure what people know about cli-
mate science and not who they are.
A second, related problem is the potential for confounding climate-science comprehension with
an affective orientation toward global-warming risk. Perceptions of societal risk generally are indica-
tors of a general affective orientation. The feelings that a putative risk source evokes are more likely
to shape than be shaped by individuals’ assessments of all manner of factual information pertaining to
it (Loewenstein, Weber, Hsee, & Welch, 2001; Slovic, Finucane, Peters, & MacGregor, 2004). There
is an ambiguity, then, as to whether items that elicit affirmation or rejection of factual propositions
relating to climate change are measuring genuine comprehension or instead only the correspondence
between the propositions in question and the valence of respondents’ affective orientations toward
global warming. Existing studies have found, for example, that individuals disposed to affirm accurate
propositions relating to climate change—that burning fossil fuels contributes to global warming, for
example—are highly likely to affirm many inaccurate ones—e.g., that atmospheric emissions of sulfur
do as well—if those statements evince concern over environmental risks generally (Reynolds, Bos-
trom, Read, & Morgan, 2010; Tobler, Visschers, & Siegrist, 2012).
Two steps were taken to address these challenges in constructing an OCSI instrument, which was
then administered to the same survey participants whose general science comprehension was meas-
ured with the OSI scale (Figure 11).3 The first was to rely on an array of items the correct responses
to which were reasonably balanced between opposing affective orientations toward the risk of global
warming. The multiple-choice item, “[w]hat gas do most scientists believe causes temperatures in the
atmosphere to rise” (“Carbon”), and the true-false one, “human-caused global warming will result in
flooding of many coastal regions” (“Floods”), evince concern over global warming and thus could be
expected to be answered correctly by respondents affectively predisposed to perceive climate change
risks as high. The same affective orientation, however, could be expected to incline respondents to
3 Additional information on the items included in the OCSI instrument appear in the appendix.
20 Kahan
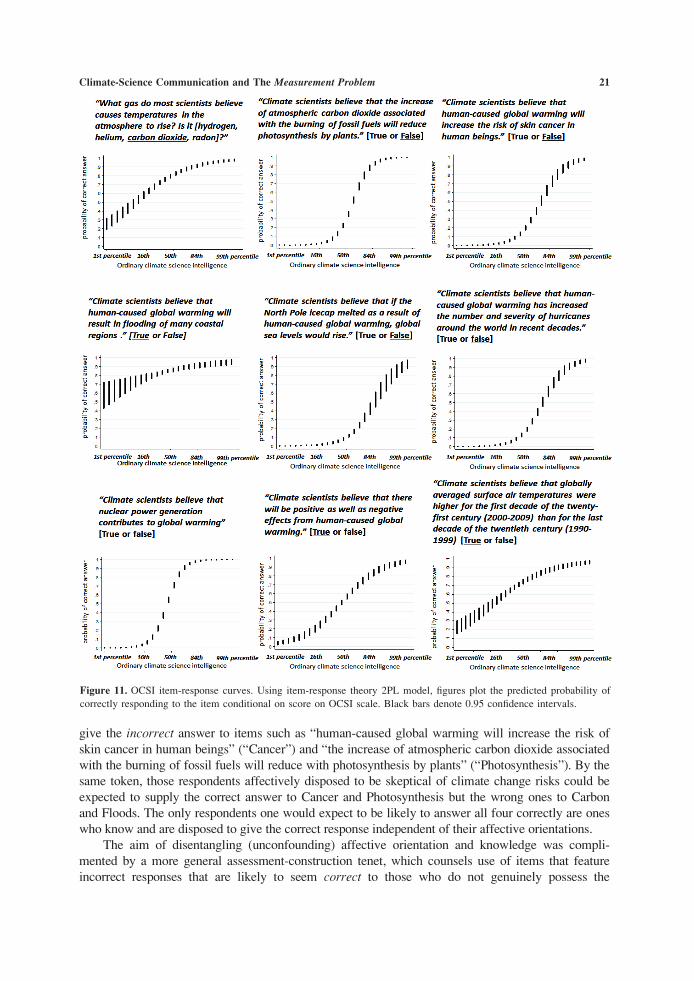
give the incorrect answer to items such as “human-caused global warming will increase the risk of
skin cancer in human beings” (“Cancer”) and “the increase of atmospheric carbon dioxide associated
with the burning of fossil fuels will reduce with photosynthesis by plants” (“Photosynthesis”). By the
same token, those respondents affectively disposed to be skeptical of climate change risks could be
expected to supply the correct answer to Cancer and Photosynthesis but the wrong ones to Carbon
and Floods. The only respondents one would expect to be likely to answer all four correctly are ones
who know and are disposed to give the correct response independent of their affective orientations.
The aim of disentangling (unconfounding) affective orientation and knowledge was compli-
mented by a more general assessment-construction tenet, which counsels use of items that feature
incorrect responses that are likely to seem correct to those who do not genuinely possess the
Figure 11. OCSI item-response curves. Using item-response theory 2PL model, figures plot the predicted probability of
correctly responding to the item conditional on score on OCSI scale. Black bars denote 0.95 confidence intervals.
Climate-Science Communication and The Measurement Problem 21
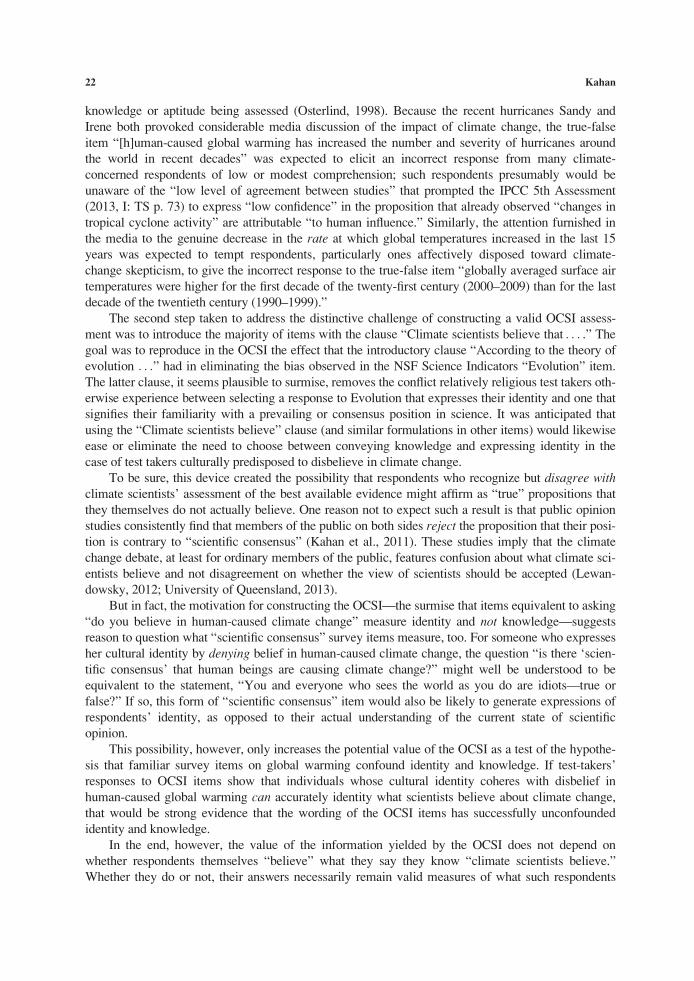
knowledge or aptitude being assessed (Osterlind, 1998). Because the recent hurricanes Sandy and
Irene both provoked considerable media discussion of the impact of climate change, the true-false
item “[h]uman-caused global warming has increased the number and severity of hurricanes around
the world in recent decades” was expected to elicit an incorrect response from many climate-
concerned respondents of low or modest comprehension; such respondents presumably would be
unaware of the “low level of agreement between studies” that prompted the IPCC 5th Assessment
(2013, I: TS p. 73) to express “low confidence” in the proposition that already observed “changes in
tropical cyclone activity” are attributable “to human influence.” Similarly, the attention furnished in
the media to the genuine decrease in the rate at which global temperatures increased in the last 15
years was expected to tempt respondents, particularly ones affectively disposed toward climate-
change skepticism, to give the incorrect response to the true-false item “globally averaged surface air
temperatures were higher for the first decade of the twenty-first century (2000–2009) than for the last
decade of the twentieth century (1990–1999).”
The second step taken to address the distinctive challenge of constructing a valid OCSI assess-
ment was to introduce the majority of items with the clause “Climate scientists believe that . . . .” The
goal was to reproduce in the OCSI the effect that the introductory clause “According to the theory of
evolution . . .” had in eliminating the bias observed in the NSF Science Indicators “Evolution” item.
The latter clause, it seems plausible to surmise, removes the conflict relatively religious test takers oth-
erwise experience between selecting a response to Evolution that expresses their identity and one that
signifies their familiarity with a prevailing or consensus position in science. It was anticipated that
using the “Climate scientists believe” clause (and similar formulations in other items) would likewise
ease or eliminate the need to choose between conveying knowledge and expressing identity in the
case of test takers culturally predisposed to disbelieve in climate change.
To be sure, this device created the possibility that respondents who recognize but disagree withclimate scientists’ assessment of the best available evidence might affirm as “true” propositions that
they themselves do not actually believe. One reason not to expect such a result is that public opinion
studies consistently find that members of the public on both sides reject the proposition that their posi-
tion is contrary to “scientific consensus” (Kahan et al., 2011). These studies imply that the climate
change debate, at least for ordinary members of the public, features confusion about what climate sci-
entists believe and not disagreement on whether the view of scientists should be accepted (Lewan-
dowsky, 2012; University of Queensland, 2013).
But in fact, the motivation for constructing the OCSI—the surmise that items equivalent to asking
“do you believe in human-caused climate change” measure identity and not knowledge—suggests
reason to question what “scientific consensus” survey items measure, too. For someone who expresses
her cultural identity by denying belief in human-caused climate change, the question “is there ‘scien-
tific consensus’ that human beings are causing climate change?” might well be understood to be
equivalent to the statement, “You and everyone who sees the world as you do are idiots—true or
false?” If so, this form of “scientific consensus” item would also be likely to generate expressions of
respondents’ identity, as opposed to their actual understanding of the current state of scientific
opinion.
This possibility, however, only increases the potential value of the OCSI as a test of the hypothe-
sis that familiar survey items on global warming confound identity and knowledge. If test-takers’
responses to OCSI items show that individuals whose cultural identity coheres with disbelief in
human-caused global warming can accurately identity what scientists believe about climate change,
that would be strong evidence that the wording of the OCSI items has successfully unconfounded
identity and knowledge.
In the end, however, the value of the information yielded by the OCSI does not depend on
whether respondents themselves “believe” what they say they know “climate scientists believe.”
Whether they do or not, their answers necessarily remain valid measures of what such respondents
22 Kahan
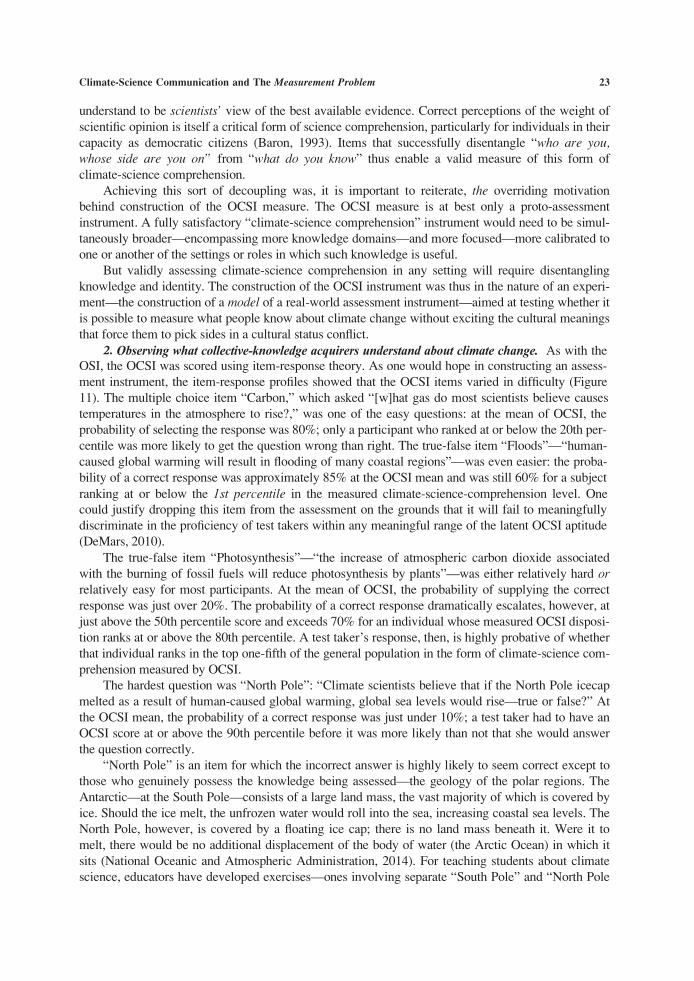
understand to be scientists’ view of the best available evidence. Correct perceptions of the weight of
scientific opinion is itself a critical form of science comprehension, particularly for individuals in their
capacity as democratic citizens (Baron, 1993). Items that successfully disentangle “who are you,whose side are you on” from “what do you know” thus enable a valid measure of this form of
climate-science comprehension.
Achieving this sort of decoupling was, it is important to reiterate, the overriding motivation
behind construction of the OCSI measure. The OCSI measure is at best only a proto-assessment
instrument. A fully satisfactory “climate-science comprehension” instrument would need to be simul-
taneously broader—encompassing more knowledge domains—and more focused—more calibrated to
one or another of the settings or roles in which such knowledge is useful.
But validly assessing climate-science comprehension in any setting will require disentangling
knowledge and identity. The construction of the OCSI instrument was thus in the nature of an experi-
ment—the construction of a model of a real-world assessment instrument—aimed at testing whether it
is possible to measure what people know about climate change without exciting the cultural meanings
that force them to pick sides in a cultural status conflict.
2. Observing what collective-knowledge acquirers understand about climate change. As with theOSI, the OCSI was scored using item-response theory. As one would hope in constructing an assess-
ment instrument, the item-response profiles showed that the OCSI items varied in difficulty (Figure
11). The multiple choice item “Carbon,” which asked “[w]hat gas do most scientists believe causes
temperatures in the atmosphere to rise?,” was one of the easy questions: at the mean of OCSI, the
probability of selecting the response was 80%; only a participant who ranked at or below the 20th per-
centile was more likely to get the question wrong than right. The true-false item “Floods”—“human-
caused global warming will result in flooding of many coastal regions”—was even easier: the proba-
bility of a correct response was approximately 85% at the OCSI mean and was still 60% for a subject
ranking at or below the 1st percentile in the measured climate-science-comprehension level. One
could justify dropping this item from the assessment on the grounds that it will fail to meaningfully
discriminate in the proficiency of test takers within any meaningful range of the latent OCSI aptitude
(DeMars, 2010).
The true-false item “Photosynthesis”—“the increase of atmospheric carbon dioxide associated
with the burning of fossil fuels will reduce photosynthesis by plants”—was either relatively hard orrelatively easy for most participants. At the mean of OCSI, the probability of supplying the correct
response was just over 20%. The probability of a correct response dramatically escalates, however, at
just above the 50th percentile score and exceeds 70% for an individual whose measured OCSI disposi-
tion ranks at or above the 80th percentile. A test taker’s response, then, is highly probative of whether
that individual ranks in the top one-fifth of the general population in the form of climate-science com-
prehension measured by OCSI.
The hardest question was “North Pole”: “Climate scientists believe that if the North Pole icecap
melted as a result of human-caused global warming, global sea levels would rise—true or false?” At
the OCSI mean, the probability of a correct response was just under 10%; a test taker had to have an
OCSI score at or above the 90th percentile before it was more likely than not that she would answer
the question correctly.
“North Pole” is an item for which the incorrect answer is highly likely to seem correct except to
those who genuinely possess the knowledge being assessed—the geology of the polar regions. The
Antarctic—at the South Pole—consists of a large land mass, the vast majority of which is covered by
ice. Should the ice melt, the unfrozen water would roll into the sea, increasing coastal sea levels. The
North Pole, however, is covered by a floating ice cap; there is no land mass beneath it. Were it to
melt, there would be no additional displacement of the body of water (the Arctic Ocean) in which it
sits (National Oceanic and Atmospheric Administration, 2014). For teaching students about climate
science, educators have developed exercises—ones involving separate “South Pole” and “North Pole
Climate-Science Communication and The Measurement Problem 23

models” in which students can observe the contrasting displacement effects of melting ice that is
added to and melting ice that sits in water—to teach students about both geology and physics (Califor-
nia Academy of Sciences, 2014; Strong, 2013). Attentive students, then, ought to answer the question
correctly. But unless they have been similarly tutored, ordinary citizens, hearing regularly in the
media about the effect of “melting glaciers, ice caps, and ice sheets” on sea level, could be expected
to find the wrong answer more compelling. Consistent with principles of test theory, the response pro-
file of the item suggests it can be viewed as a useful one for distinguishing highly informed from only
moderately informed test takers (Osterlind, 1998).
What is the relationship between OCSI and belief in human-caused climate change? The answer
is that there isn’t any (Figure 12). Those respondents who indicated that they believe the earth is
“getting warmer mostly because of human activity such as burning fossil fuels” scored no better on
the assessment than either ones who identified “natural patterns in the earth’s environment” as the
source of recent global warming or those who indicated they disbelieved the “average temperature on
earth has been getting warmer over the past few decades.”
This should not come as a surprise. As indicated, peoples’ answers to whether one “believes in”
human-caused global warming doesn’t measure what they know; it expresses who they are. The
“believe in” global-warming question was not prefaced by an “according to scientists” or like clause.
Indeed, the lack of any meaningful relationship between OCSI scores and responses to the “belief in”
human-caused global-warming item helps to corroborate that the OCSI scale does indeed succeed in
measuring a form of comprehension independent of test-takers’ cultural identities.
So too does the relationship between OCSI and the respondents’ general science comprehension.
Climate-science comprehension and general science comprehension are not the same; but presumably
those who possess the latter will be more likely than those who don’t to acquire the former. OCSI and
OSI were indeed positively correlated (r 5 0.30, p< 0.01).
Participants’ OCSI scores and their political outlooks, however, were not meaningfully related.
OCSI scores increased in tandem with general science comprehension to the same degree among par-
ticipants whose outlooks were left-leaning and those who were right-leaning (Figure 13). This result,
of course, furnishes a dramatic contrast to the impact of OSI (and all other conventional measures of
science literacy and critical reasoning) in magnifying polarization on “belief in” climate change and
other items that measure the latent disposition associated with the global-warming ISM risk-
perception item (Kahan, Peters, Wittlin, et al., 2012; see Figure 7). This result, too, adds weight to the
inference that the items OCSI comprises measure what people know about climate-change science as
opposed to who they are.
Figure 12. Relationship between OCSI
scores and beliefs in human-caused
global warming. CIs represent 0.95 con-
fidence interval for estimated popula-
tion mean.
24 Kahan
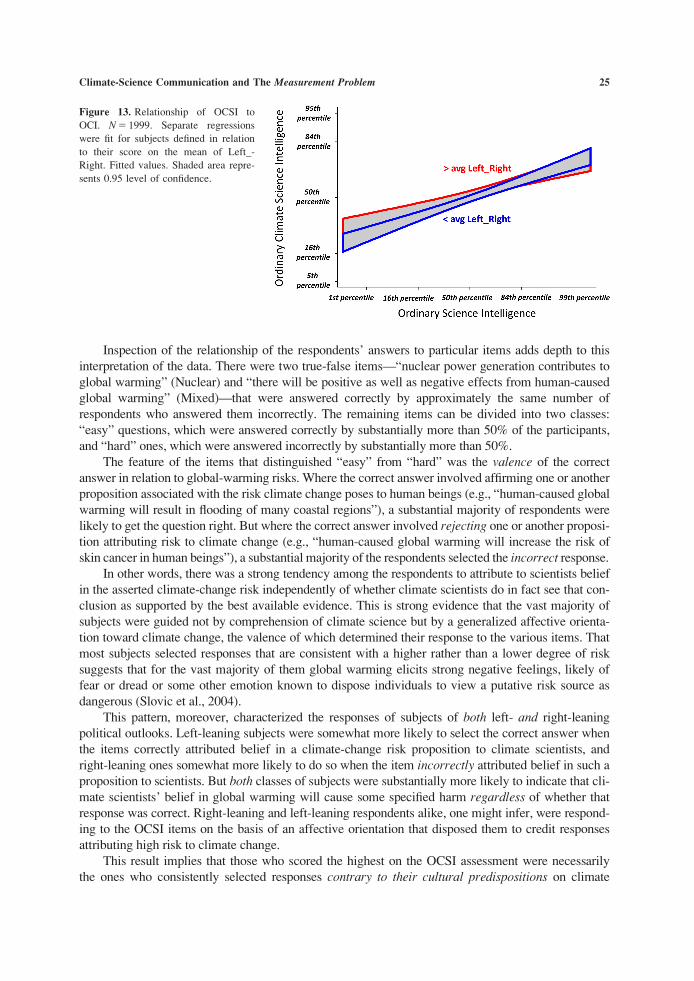
Inspection of the relationship of the respondents’ answers to particular items adds depth to this
interpretation of the data. There were two true-false items—“nuclear power generation contributes to
global warming” (Nuclear) and “there will be positive as well as negative effects from human-caused
global warming” (Mixed)—that were answered correctly by approximately the same number of
respondents who answered them incorrectly. The remaining items can be divided into two classes:
“easy” questions, which were answered correctly by substantially more than 50% of the participants,
and “hard” ones, which were answered incorrectly by substantially more than 50%.
The feature of the items that distinguished “easy” from “hard” was the valence of the correct
answer in relation to global-warming risks. Where the correct answer involved affirming one or another
proposition associated with the risk climate change poses to human beings (e.g., “human-caused global
warming will result in flooding of many coastal regions”), a substantial majority of respondents were
likely to get the question right. But where the correct answer involved rejecting one or another proposi-
tion attributing risk to climate change (e.g., “human-caused global warming will increase the risk of
skin cancer in human beings”), a substantial majority of the respondents selected the incorrect response.
In other words, there was a strong tendency among the respondents to attribute to scientists belief
in the asserted climate-change risk independently of whether climate scientists do in fact see that con-
clusion as supported by the best available evidence. This is strong evidence that the vast majority of
subjects were guided not by comprehension of climate science but by a generalized affective orienta-
tion toward climate change, the valence of which determined their response to the various items. That
most subjects selected responses that are consistent with a higher rather than a lower degree of risk
suggests that for the vast majority of them global warming elicits strong negative feelings, likely of
fear or dread or some other emotion known to dispose individuals to view a putative risk source as
dangerous (Slovic et al., 2004).
This pattern, moreover, characterized the responses of subjects of both left- and right-leaning
political outlooks. Left-leaning subjects were somewhat more likely to select the correct answer when
the items correctly attributed belief in a climate-change risk proposition to climate scientists, and
right-leaning ones somewhat more likely to do so when the item incorrectly attributed belief in such a
proposition to scientists. But both classes of subjects were substantially more likely to indicate that cli-
mate scientists’ belief in global warming will cause some specified harm regardless of whether that
response was correct. Right-leaning and left-leaning respondents alike, one might infer, were respond-
ing to the OCSI items on the basis of an affective orientation that disposed them to credit responses
attributing high risk to climate change.
This result implies that those who scored the highest on the OCSI assessment were necessarily
the ones who consistently selected responses contrary to their cultural predispositions on climate
Figure 13. Relationship of OCSI to
OCI. N 5 1999. Separate regressions
were fit for subjects defined in relation
to their score on the mean of Left_-
Right. Fitted values. Shaded area repre-
sents 0.95 level of confidence.
Climate-Science Communication and The Measurement Problem 25

change risks. Left-leaning subjects could score higher than average only by correctly identifying as
“false” those positions that individuals predisposed to see climate change as risky would incorrectly
attribute to climate scientists. Right-leaning subjects, to score higher than average, had to classify
those positions as “false,” too, but in addition had to credit as “true” the proposition that attributed to
climate scientists stances someone would reject if that individual were answering on the basis of a
climate-skeptical predisposition.
As indicated, the tendency of respondents to adopt these culturally uncongenial response patterns
was correlated with their OSI score. In a sense, this is not surprising: the OSI scale includes Numeracy
and Cognitive Reflection items, which measure a disposition to check intuitive or affective reactions
(System 1) and resort instead to analytical reasoning (System 2) when assessing information on risk.
Yet it is now well established that System 2 reasoning dispositions—contrary to expectations of
many conjectural accounts of “why people don’t fear climate change” (e.g., Marx et al., 2007; Weber,
2006)—do not check the form of identity-protective cognition that fuels cultural conflict over global
warming. On the contrary, the analytical skills and habits of mind associated with System 2 reasoning
amplify the tendency of individuals to fit all manner of evidence to the global-warming position that is
dominant in their identity-defining groups (Kahan, 2013b; Kahan, Peters, Wittlin, et al., 2012; Kahan,
Peters, et al., 2014).
But there is no contradiction. The settings in which people’s beliefs in, and assessments of infor-
mation relating to, global warming are characterized by “motivated System 2” reasoning are the ones
in which they are applying their reason to answer the question “who are you—whose side are youon?” In that setting, the answer that expresses and reinforces their cultural identity is the right one if,
as seems quite reasonable, they have acquired habits of mind that reliably protect their connection to
others with whom they have important material and emotional ties. It is thus the reasoning proficiency
of their identity-protective self that is being measured by such items.
But those same individuals are also collective-knowledge acquirers. When asked not “whose sideare you on?” but “what do we know from science?,” they apply their reason to that question, and if they
are fortunate enough to be superb reasoners, then regardless of their cultural identity they get the answer
right more often than other people regardless of theirs. If one wants to measure what people have used
their reason to discern about the science of climate change, then one has to be sure to use a form of
assessment that does not threaten their identities. The OCSI results show that this can indeed be done.
They also show that unless one engages citizens in a manner that avoids identity threat, no
amount of knowledge about climate science will forestall divisive cultural conflict on global warming.
Not only did the item-response profile for “belief in” human-caused climate change fail to display the
characteristics of a valid indicator of climate-science comprehension. Those respondents whose OCSI
scores indicated the highest level of such comprehension were also the most polarized in their “beliefs
in” human-caused global warming (Figure 14).
3. Citizens already know everything they need to know about global warming! In fact, mostpeo-ple—of all cultural outlooks—don’t know very much at all about “climate science.” But that
clearly is not the source of cultural polarization over climate change.
If one knows what to measure and how, then this conclusion becomes unmistakably clear. The
proposition that carbon dioxide causes the temperature of the atmosphere to increase might fairly be
regarded as the foundational piece of knowledge for “ordinary climate-science intelligence.” It turns
out that most Americans know that. And the likelihood that they won’t is not any lower if they are
“conservative Republicans” than if they are “liberal Democrats” (Figure 15).
That “human-caused global warming,” if not reversed, “will result in flooding of many coastal
regions” is an essential piece of information for someone with OCSI to have too. The probability that
someone will correctly identify that proposition as “true” is indeed somewhat higher if that person is
a “liberal Democrat” than if she is a “conservative Republican.” But the probability that a conserva-
tive Republican will not know that this is what “climate scientists believe” turns out to be very low—
26 Kahan
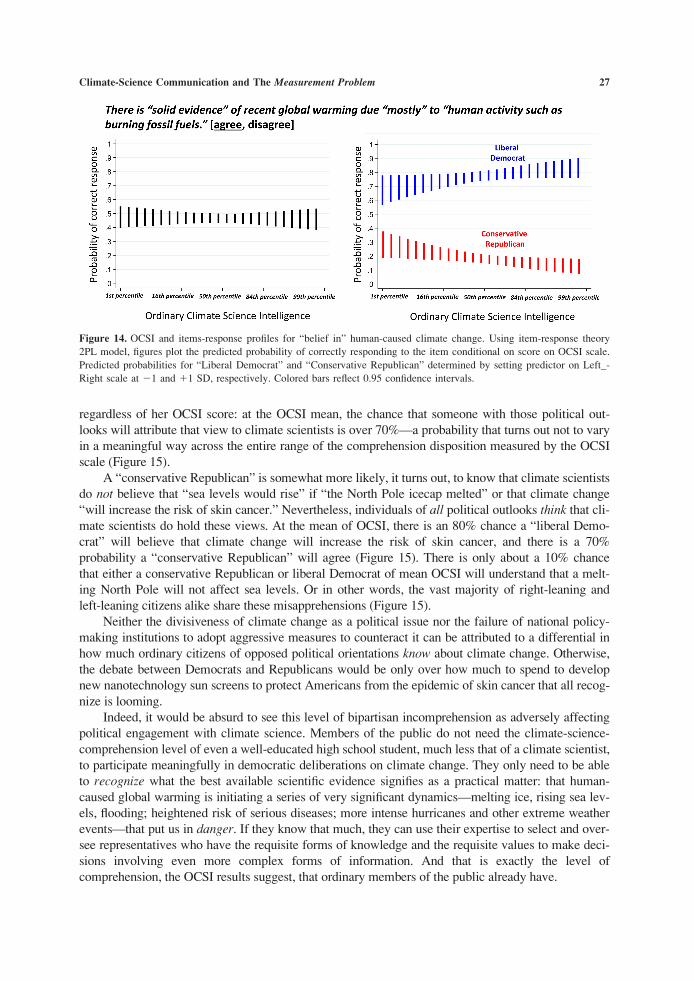
regardless of her OCSI score: at the OCSI mean, the chance that someone with those political out-
looks will attribute that view to climate scientists is over 70%—a probability that turns out not to vary
in a meaningful way across the entire range of the comprehension disposition measured by the OCSI
scale (Figure 15).
A “conservative Republican” is somewhat more likely, it turns out, to know that climate scientists
do not believe that “sea levels would rise” if “the North Pole icecap melted” or that climate change
“will increase the risk of skin cancer.” Nevertheless, individuals of all political outlooks think that cli-
mate scientists do hold these views. At the mean of OCSI, there is an 80% chance a “liberal Demo-
crat” will believe that climate change will increase the risk of skin cancer, and there is a 70%
probability a “conservative Republican” will agree (Figure 15). There is only about a 10% chance
that either a conservative Republican or liberal Democrat of mean OCSI will understand that a melt-
ing North Pole will not affect sea levels. Or in other words, the vast majority of right-leaning and
left-leaning citizens alike share these misapprehensions (Figure 15).
Neither the divisiveness of climate change as a political issue nor the failure of national policy-
making institutions to adopt aggressive measures to counteract it can be attributed to a differential in
how much ordinary citizens of opposed political orientations know about climate change. Otherwise,
the debate between Democrats and Republicans would be only over how much to spend to develop
new nanotechnology sun screens to protect Americans from the epidemic of skin cancer that all recog-
nize is looming.
Indeed, it would be absurd to see this level of bipartisan incomprehension as adversely affecting
political engagement with climate science. Members of the public do not need the climate-science-
comprehension level of even a well-educated high school student, much less that of a climate scientist,
to participate meaningfully in democratic deliberations on climate change. They only need to be able
to recognize what the best available scientific evidence signifies as a practical matter: that human-
caused global warming is initiating a series of very significant dynamics—melting ice, rising sea lev-
els, flooding; heightened risk of serious diseases; more intense hurricanes and other extreme weather
events—that put us in danger. If they know that much, they can use their expertise to select and over-
see representatives who have the requisite forms of knowledge and the requisite values to make deci-
sions involving even more complex forms of information. And that is exactly the level of
comprehension, the OCSI results suggest, that ordinary members of the public already have.
Figure 14. OCSI and items-response profiles for “belief in” human-caused climate change. Using item-response theory
2PL model, figures plot the predicted probability of correctly responding to the item conditional on score on OCSI scale.
Predicted probabilities for “Liberal Democrat” and “Conservative Republican” determined by setting predictor on Left_-
Right scale at 21 and 11 SD, respectively. Colored bars reflect 0.95 confidence intervals.
Climate-Science Communication and The Measurement Problem 27
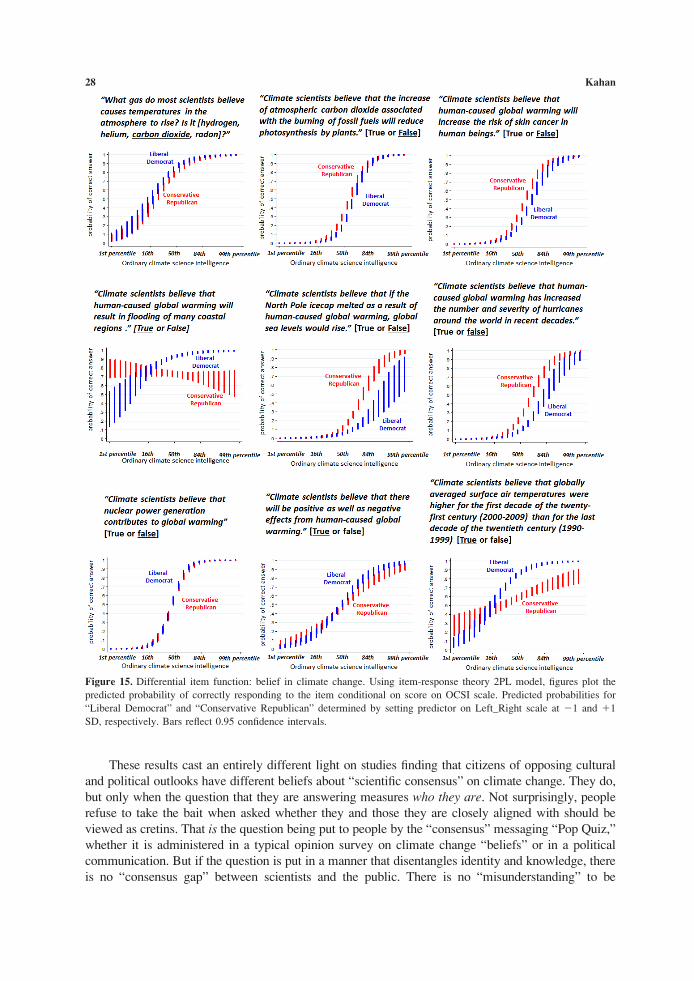
These results cast an entirely different light on studies finding that citizens of opposing cultural
and political outlooks have different beliefs about “scientific consensus” on climate change. They do,
but only when the question that they are answering measures who they are. Not surprisingly, people
refuse to take the bait when asked whether they and those they are closely aligned with should be
viewed as cretins. That is the question being put to people by the “consensus” messaging “Pop Quiz,”
whether it is administered in a typical opinion survey on climate change “beliefs” or in a political
communication. But if the question is put in a manner that disentangles identity and knowledge, there
is no “consensus gap” between scientists and the public. There is no “misunderstanding” to be
Figure 15. Differential item function: belief in climate change. Using item-response theory 2PL model, figures plot the
predicted probability of correctly responding to the item conditional on score on OCSI scale. Predicted probabilities for
“Liberal Democrat” and “Conservative Republican” determined by setting predictor on Left_Right scale at 21 and 11
SD, respectively. Bars reflect 0.95 confidence intervals.
28 Kahan
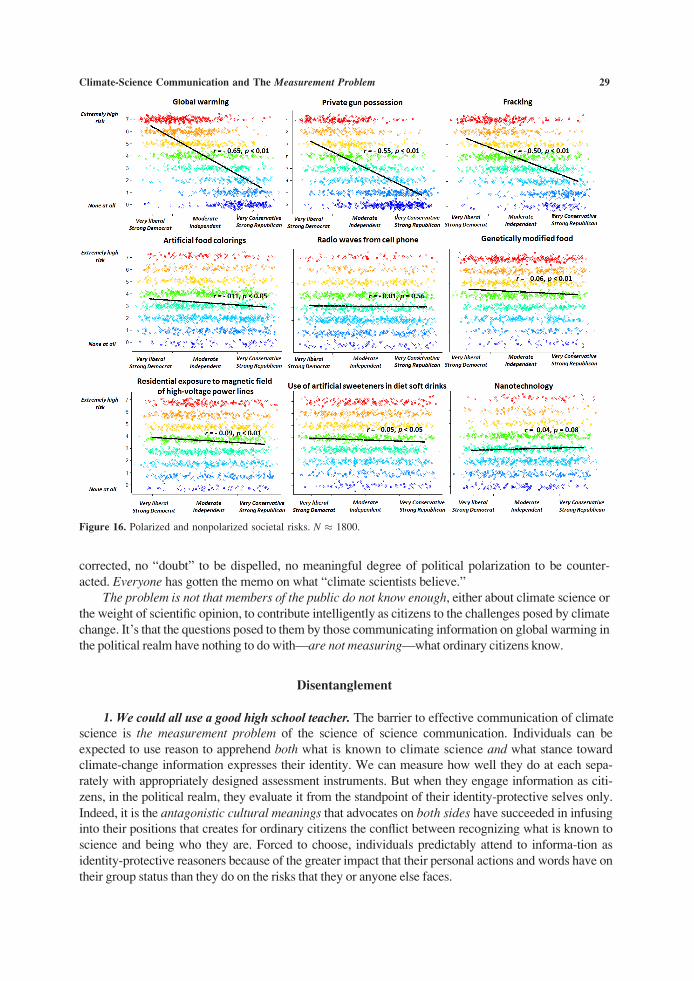
corrected, no “doubt” to be dispelled, no meaningful degree of political polarization to be counter-
acted. Everyone has gotten the memo on what “climate scientists believe.”
The problem is not that members of the public do not know enough, either about climate science or
the weight of scientific opinion, to contribute intelligently as citizens to the challenges posed by climate
change. It’s that the questions posed to them by those communicating information on global warming in
the political realm have nothing to do with—are not measuring—what ordinary citizens know.
Disentanglement
1. We could all use a good high school teacher. The barrier to effective communication of climatescience is the measurement problem of the science of science communication. Individuals can be
expected to use reason to apprehend both what is known to climate science and what stance toward
climate-change information expresses their identity. We can measure how well they do at each sepa-
rately with appropriately designed assessment instruments. But when they engage information as citi-
zens, in the political realm, they evaluate it from the standpoint of their identity-protective selves only.
Indeed, it is the antagonistic cultural meanings that advocates on both sides have succeeded in infusing
into their positions that creates for ordinary citizens the conflict between recognizing what is known toscience and being who they are. Forced to choose, individuals predictably attend to informa-tion as
identity-protective reasoners because of the greater impact that their personal actions and words have on
their group status than they do on the risks that they or anyone else faces.
Figure 16. Polarized and nonpolarized societal risks. N � 1800.
Climate-Science Communication and The Measurement Problem 29

Under these circumstances, bombarding citizens with more information (“97% of SCIENTISTS
AGREE”) doesn’t diminish polarization but instead aggravates it by amplifying the association
between competing identities and competing positions on climate change. What needs to be changed
are the circumstances that make recognizing valid scientific information hostile to the identities of rea-
soning citizens. We need a device that will perform in the world the disentanglement of identity and
knowledge that is achieved when the clause “according to the theory of evolution,” or “climate scien-
tists believe,” is appended to science-comprehension assessment items.
Is this possible? Sure: just ask a good high school teacher to show you how.
As discussed, the same tension between knowing what’s known to science and being who one is
attends the communication of evolutionary science. But that conflict does not prevent reasoning per-
sons from learning this wondrous body of knowledge. Empirical study shows that good instructors
can impart genuine comprehension of the modern synthesis in a high school classroom filled with cul-
turally diverse students. But doing so requires them to avoid making the profession of “belief in” evo-
lution the object of their lessons. Instead they must show “how scientists compare alternative
hypotheses, their predicated consequences, and the evidence to arrive at belief,” thereby stimulating
the same “important reasoning pattern”—the one essential to comprehending valid science—in stu-
dents (Lawson & Worsnop, 2006, p. 165).
It would be glib to say “that’s all communicators have to do” to dispel polarization over climate
science. It is what they have to do. But how to do this is far from obvious.
Indeed, it is far from obvious how high school teachers will succeed in disentangling knowledge
from identity in teaching climate science. But what they have themselves learned from teaching evo-
lution successfully makes them confident both that this is the end to be attained and that attaining it is
possible. Science educators also enjoy an evidence-based culture in which problems of this type are
empirically investigated and in which the results of such investigation are used appropriately and not
ignored.
Because science communication doesn’t yet have the benefit of such a culture (Kahan, 2014b),
science communicators are unlikely to figure out how to disentangle apprehension of climate science
from cultural identity as quickly in the realm of politics as educators are likely to do it the classroom.
But the success of science educators in teaching evolution furnishes science communicators the samereason to believe that such disentanglement is possible and shows them the target they should be aim-
ing at. Science communicators also have, in the very example of science educators, the benefit of an
inspiring model of how an allied knowledge-propagation profession uses science to pursue this critical
mission (cf. Buckland, 2014).
2. Don’t ignore the denominator. Using science to fix what’s broken in the communication of cli-mate science requires starting with a valid sample of science-communication observations. Global
warming is not the only societal risk on which Americans are culturally polarized. Others include the
safety of nuclear power, the impact of private gun ownership, and the hazards posed by fracking.
But such issues are exceedingly rare. The number of risks on which people of differing outlooks
disagree about the significance of the best available scientific evidence is miniscule in relation to the
number on which they don’t but easily could. Nuclear wastes scare people—so why not x-rays or the
radioactive wastes they generate? There once was ideological controversy about water fluoridation; no
longer. Some people believe it is unnecessary or even unhealthy to pasteurize milk—but they are
weird outliers in relation to any recognizable cultural or political group. European nations are frac-
tured over GM food risks; media chatter notwithstanding, the issue does not divide members of the
public in the United States (Figures 16 and 17).
It is certainly sensible to examine the class of issues that generate polarization if one wants to
understand a particular member of that class. But one will not be able to make sense of any culturally
contested risk if one simply ignores the multitudes of others characterized by cultural convergence. In
particular, it is impossible to draw or test inferences about the significance of the features that the
30 Kahan
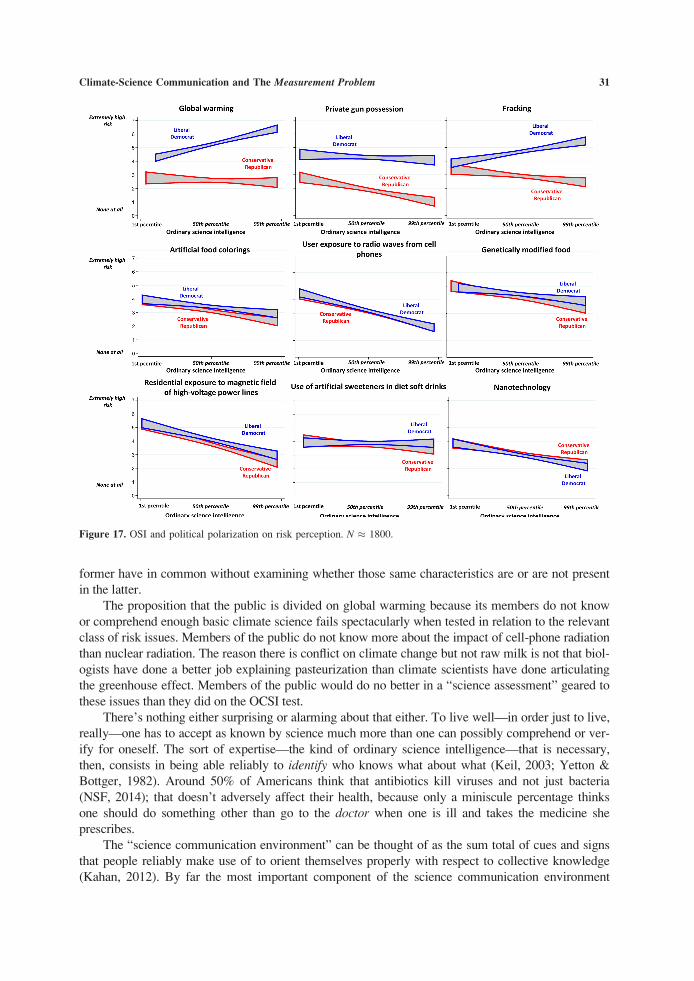
former have in common without examining whether those same characteristics are or are not present
in the latter.
The proposition that the public is divided on global warming because its members do not know
or comprehend enough basic climate science fails spectacularly when tested in relation to the relevant
class of risk issues. Members of the public do not know more about the impact of cell-phone radiation
than nuclear radiation. The reason there is conflict on climate change but not raw milk is not that biol-
ogists have done a better job explaining pasteurization than climate scientists have done articulating
the greenhouse effect. Members of the public would do no better in a “science assessment” geared to
these issues than they did on the OCSI test.
There’s nothing either surprising or alarming about that either. To live well—in order just to live,
really—one has to accept as known by science much more than one can possibly comprehend or ver-
ify for oneself. The sort of expertise—the kind of ordinary science intelligence—that is necessary,
then, consists in being able reliably to identify who knows what about what (Keil, 2003; Yetton &
Bottger, 1982). Around 50% of Americans think that antibiotics kill viruses and not just bacteria
(NSF, 2014); that doesn’t adversely affect their health, because only a miniscule percentage thinks
one should do something other than go to the doctor when one is ill and takes the medicine she
prescribes.
The “science communication environment” can be thought of as the sum total of cues and signs
that people reliably make use of to orient themselves properly with respect to collective knowledge
(Kahan, 2012). By far the most important component of the science communication environment
Figure 17. OSI and political polarization on risk perception. N � 1800.
Climate-Science Communication and The Measurement Problem 31
consists of the stances others judged to be socially competent are adopting toward such information,
particularly in making use of it or not in their own decisions.
The sample of socially competent people that members of the public will consult will be highly
skewed toward those who share their defining group commitments. Individuals naturally spend more
time with people who share their outlooks; they are less likely to be distracted by fights and squabbles
as they interact with them; and they are simply better at reading people like them—better at identify-
ing who genuinely possesses access to collective knowledge and who is “bull shitting.”
If one were in a position—as, say, a business manager might be with regard to a team of work-
ers—to oblige individuals to take the time necessary to become as discerning and as reliable in identi-
fying “who knows what about what” inside of a culturally heterogeneous group as those individuals
typically are in their own homogenous ones, there is every reason to believe that such individuals
would make even more effective use of what is collectively known. The stock of valid knowledge at
the disposal of a culturally diverse group is likely to be larger, precisely because its members will
likely have been exposed to (or absorbed the substance of) a more diverse range of information. But
when they are left to their own devices, individuals will understandably make use of their rational
ability to discern “who knows what about what” inside of more tightly knit affinity groups, because
that is the location in which that reasoning capacity can most efficiently operate (Watson, Kumar, &
Michelson, 1993).
The admitted insularity of this process, however, poses no serious detriment to the well-being of
people most of the time. All of the relevant affinity groups are amply stocked with individuals of
exceedingly high science comprehension. All have intact practices for transmitting this information to
their members. Indeed, were there a group that consistently misled its members on the nature of scien-
tific knowledge essential to their well-being, it would be unlikely to last very long (something anyone
who genuinely understands the mechanisms of evolution will recognize, regardless of whether she
“believes in” evolution). As a result, in making use of the guidance available to them as members of
discrete groups, culturally diverse citizens will—across the vast run of cases—converge on the best
available evidence.
Climate change and other issues that generate persistent states of polarization are pathological,both in the sense of being rare and in the sense of being inimical to collective well-being. Such condi-
tions occur when positions on risks and other policy-relevant facts become entangled with antagonis-
tic cultural meanings that transform them into badges of membership in, and loyalty to, opposing
affinity groups (Kahan, 2012).
Because ordinary individuals have a bigger stake in maintaining their status within their defining
groups than they do in forming correct understandings of science on societal risks, they will predictably
use their reasoning powers in such circumstances to give information the effect that protects their identi-
ties as members of these groups. Those with the most acute reasoning powers, moreover, will predict-
ably use them for this purpose. Because others within their groups quite understandably view the stances
these individuals take as an important cue on what is collectively known, their aggressive deployment of
their reason to protect their identities will radiate outward, amplifying cultural polarization.
Such antagonistic meanings, then, are a form of pollution in the science communication environ-
ment. They degrade the cues that individuals use, ordinarily with success, to recognize collective
knowledge essential to their decision making. When they apply their “who knows what about what”
sense in a polluted science-communication environment, individuals with different cultural identities
will form not convergent but wildly discrepant impressions (Kahan, 2013a).
Ridding their science communication of this form of pollution, then, is the key to overcoming
cultural polarization with regard to climate change and like issues. The information individuals havewith regard to myriad other forms of decision-relevant science but lack on culturally disputed ones
consists of the guidance they reliably derive by observing others like themselves using such science in
their practical decision making.
32 Kahan
People, of all cultural outlooks, trust scientists and are eager to make use of what science knows
to improve their lives (National Science Foundation, 2013; Pew Research Center, 2009). But the peo-
ple whose orienting influence they need to observe are not scientists. They are the people in their
everyday lives whose guiding example ordinary members of the public use to figure out what evi-
dence of scientific belief they should credit and which they should dismiss.
The communication of normal science, by scientists, is vital to practical decision makers—from
insurance agents to farmers, from investment brokers to military leaders. But what needs to be com-
municated to ordinary members of the public, in their capacity as citizens, is the normality of using
climate science. And they have to communicate that to themselves.Or so one might conjecture based on an assessment of the relevant sample of cases in which the
members of a highly pluralistic society do and don’t converge on what is known to science. It is one
that further investigation of which, moreover, is very much warranted by the evidence of its correct-
ness that we already have in hand.
3. The “normality” of climate science in Southeast Florida. Southeast Florida is not Berkeley,Cali-fornia, or Cambridge, Massachusetts. The political climate of Southeast Florida, for one thing,
differs at least as much from the political climate that Berkeley and Cambridge share as the natural
climate of Southeast Florida differs from the natural climate of either of these cities. Unlike these
homoge-nously left-leaning communities, Miami-Dade, Broward, Palm Beach, and Monroe counties
are politi-cally conventional and diverse, with federal congressional delegations, county commissions,
and city governments occupied by comparable proportions of Republicans and Democrats.
Indeed, by one measure of “who they are,” the residents of these four counties look a lot like the
United States as a whole. There is the same tight connection between how people identify themselves
politically and their “beliefs” about global warming—and hence the same deep polarization on that
issue. Just as in the rest of the United States, moreover, the degree of polarization is highest among
the residents who display the highest level of science literacy (Figure 18).
But like Berkeley and Cambridge—and unlike most other places in the United States—these four
counties have formally adopted climate action plans. Or more precisely, they have each ratified a joint
plan as members of the Southeast Florida Regional Climate Change Compact. Unlike the largely hor-
tatory declarations enacted by one or another university town, the Compact’s Regional Climate Action
Plan sets out 110 substantive “action items” to be implemented over a five-year period.4
Many of these, understandably, are geared to protecting the region from anticipated threats. The
Plan goals include construction of protective barriers for hospitals, power-generating facilities, and
other key elements of infrastructure threatened by rising sea levels and storm surges; the enactment of
building codes to assure that existing and new structures are fortified against severe weather; measures
to protect water sources essential both for residential use and for agriculture and other local
businesses.
But included too are a variety of measures designed to mitigate the contribution the four counties
make to climate change. The Plan thus calls for increased availability of public transportation, the
implementation of energy-efficiency standards, and the adoption of a “green rating” system to con-
strain carbon emissions associated with construction and other public works.
The effects of the member counties’ climate mitigation efforts will be admittedly modest—
indeed, wholly immaterial in relation to the dynamics at work in global climate change. But they
mean something; they are part of the package of collective initiatives identified as worthy of being
pursued by the city planners, business groups, and resident associations—by the conservation organi-
zations, civic associations, and religious groups—who all took part in the public and highly participa-
tory process that generated the Plan.
4 I am a member of the research team associated with the Southeast Florida Evidence-based Science Communication Ini-tiative, which supplies evidence-based science-communication support for the Compact.
Climate-Science Communication and The Measurement Problem 33
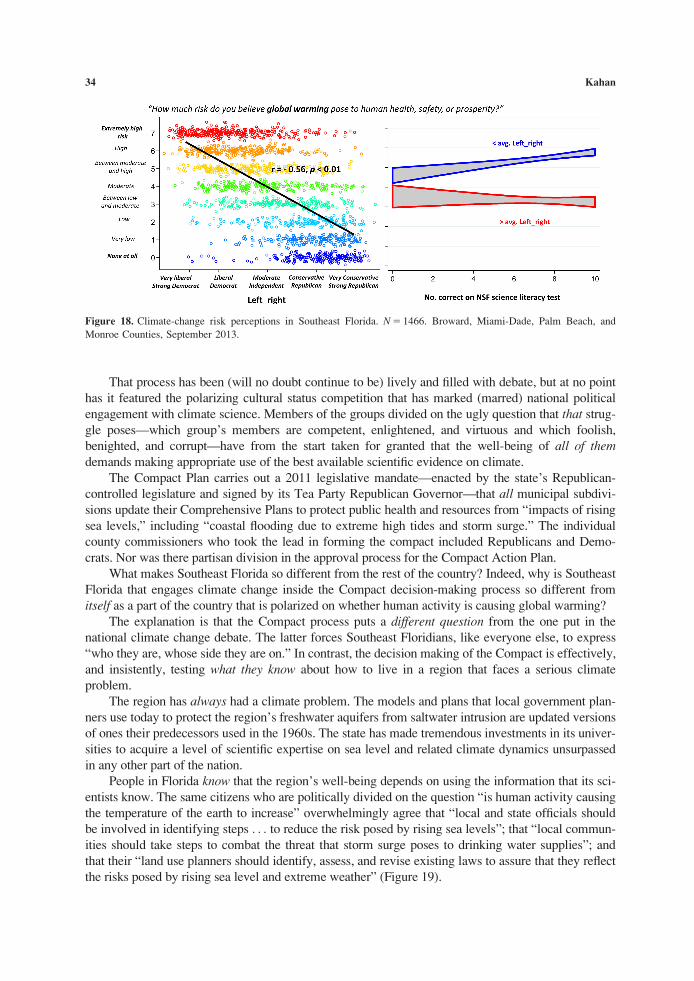
That process has been (will no doubt continue to be) lively and filled with debate, but at no point
has it featured the polarizing cultural status competition that has marked (marred) national political
engagement with climate science. Members of the groups divided on the ugly question that that strug-
gle poses—which group’s members are competent, enlightened, and virtuous and which foolish,
benighted, and corrupt—have from the start taken for granted that the well-being of all of themdemands making appropriate use of the best available scientific evidence on climate.
The Compact Plan carries out a 2011 legislative mandate—enacted by the state’s Republican-
controlled legislature and signed by its Tea Party Republican Governor—that all municipal subdivi-
sions update their Comprehensive Plans to protect public health and resources from “impacts of rising
sea levels,” including “coastal flooding due to extreme high tides and storm surge.” The individual
county commissioners who took the lead in forming the compact included Republicans and Demo-
crats. Nor was there partisan division in the approval process for the Compact Action Plan.
What makes Southeast Florida so different from the rest of the country? Indeed, why is Southeast
Florida that engages climate change inside the Compact decision-making process so different from
itself as a part of the country that is polarized on whether human activity is causing global warming?
The explanation is that the Compact process puts a different question from the one put in the
national climate change debate. The latter forces Southeast Floridians, like everyone else, to express
“who they are, whose side they are on.” In contrast, the decision making of the Compact is effectively,
and insistently, testing what they know about how to live in a region that faces a serious climate
problem.
The region has always had a climate problem. The models and plans that local government plan-
ners use today to protect the region’s freshwater aquifers from saltwater intrusion are updated versions
of ones their predecessors used in the 1960s. The state has made tremendous investments in its univer-
sities to acquire a level of scientific expertise on sea level and related climate dynamics unsurpassed
in any other part of the nation.
People in Florida know that the region’s well-being depends on using the information that its sci-
entists know. The same citizens who are politically divided on the question “is human activity causing
the temperature of the earth to increase” overwhelmingly agree that “local and state officials should
be involved in identifying steps . . . to reduce the risk posed by rising sea levels”; that “local commun-
ities should take steps to combat the threat that storm surge poses to drinking water supplies”; and
that their “land use planners should identify, assess, and revise existing laws to assure that they reflect
the risks posed by rising sea level and extreme weather” (Figure 19).
Figure 18. Climate-change risk perceptions in Southeast Florida. N 5 1466. Broward, Miami-Dade, Palm Beach, and
Monroe Counties, September 2013.
34 Kahan

That’s normal. It’s what government is supposed to do in Southeast Florida. And it better be sure
to pick up the garbage every Wednesday, too, their citizens (Republican and Democrat) would add.
The Compact effectively informed its citizens of the appropriateness of using the best available
science for these ends but not through a “messaging” campaign focused on “scientific consensus” or
anything else. The Compact’s “communication strategy” was its process. The dozens of open meet-
ings and forums, convened not just by the Compact governments but by business, residential, and
other groups in civil society filled the region’s science-communication environment with exactly the
information that ordinary people rationally rely on to discern what’s known to science: the conspicu-
ous example of people they trust and recognize as socially competent supporting the use of science in
decision making directly bearing on their lives.
Indeed, far from evoking the toxic aura of tribal contempt that pervades “messaging” campaigns
(“what? Are you stupid? What part of ‘97% AGREE!’ don’t you understand?!”), Compact officials
aggressively, instinctively repel it whenever it threatens to contaminate the region’s deliberations.
One of those occasions occurred during a heavily attended “town meeting,” conducted in connection
with the Compact’s 2013 “Regional Climate Leadership Summit,” a two-day series of presentations
and workshops involving both government officials and representatives of key public stakeholder
groups.
The moderator for the town meeting (a public radio personality who had just moved to Southeast
Florida from Chicago) persistently tried to inject the stock themes of the national climate-change
debate into the discussion as the public officials on stage took turns answering questions from the
audience. What do Republicans in Washington have against science, the moderated asked? And what
“about the level of evidence that’s being accepted by private industry”—how come it’s doing so little
to address climate change?
After an awkward pause, Broward County’s Democratic Mayor Kristin Jacobs replied. “I think
it’s important to note,” she said, gesturing to a banner adorned by a variety of corporate logos, “that
one of the sponsors of this Summit today is the Broward Workshop. The Broward Workshop repre-
sents 100 of the largest businesses in Broward County.” The owners of these businesses, she contin-
ued, were “not only sponsoring this Summit,” but actively participating in it and had organized their
own working groups “addressing the impacts of water and climate change.” “They know what’s hap-
pening here,” she said to the moderator, who at this point was averting his gaze and fumbling with his
notes.
“I would also point out,” Jacobs persisted, “when you look across this region at the Summit part-
ners, the Summit Counties, there are three Mayors that are Republican and one that’s Democrat, and
Figure 19. Bipartisan support for government action on climate. N 5 1478. Broward, Miami-Dade, Palm Beach, and
Monroe Counties. Data collected by the Southeast Florida Evidence-Based Science Communication Initiative, September
2013.
Climate-Science Communication and The Measurement Problem 35
we’re working on these issues across party lines.” Pause, silence. “So I don’t think it is about party,”
she concluded. “I think it is about understanding what the problems are and fixing them and address-
ing them.”
Five of the lead chapter authors of the 2014 National Climate Assessment were affiliated with
Florida universities or government institutions. As more regions of the country start to confront cli-
mate threats comparable to ones Florida has long dealt with, Florida will share the knowledge it has
acquired about how to do so and thrive while doing it.
But there is more Florida can teach. If we study how the Compact Counties created a political
process that enables its diverse citizens to respond to the question “so what should we do about cli-
mate change?” with an answer that reflects what they all know, we are likely to learn important les-
sons about how to protect enlightened self-government from the threat posed by the science-of-
science-communication measurement problem.
Solving the Science-of-Science-Communication Measurement Problem—by Annihilating It
My goal in this article has been to identify the science-of-science-communication measurement
problem. I’ve tried to demonstrate the value of understanding this problem by showing how it contrib-
utes to the failure of the communication of climate science in the United States.
At the most prosaic level, the measurement problem in that setting is that many data collectors do
not fully grasp what they are measuring when they investigate the sources of public polarization on
climate change. As a result, many of their conclusions are wrong. Those who rely on those conclu-
sions in formulating real-world communication strategies fail to make progress—and sometimes end
up acting in a self-defeating manner.
But more fundamentally, the science-of-science-communication measurement problem describes
a set of social and psychological dynamics. Like the measurement problem of quantum mechanics, it
describes a vexing feature of the phenomena that are being observed and not merely a limitation in
the precision of the methods available for studying them.
There is, in the science of science communication, an analog to the dual “wave-like” and
“particle-like” nature of light (or of elementary particles generally). It is the dual nature of human rea-soners as collective-knowledge acquirers and cultural-identity protectors. Just as individual photons in
the double-slit experiment pass through “both slits at once” when unobserved, so each individual per-
son uses her reason to simultaneously apprehend what is collectively known and to be a member of a
particular cultural community defined by a set of highly distinctive set of commitments.
Moreover, in the science of science communication as in quantum physics, assessment perturbs
this dualism. The antagonistic cultural meanings that pervade the social interactions in which we
engage citizens on contested science issues forces them to be only one of their reasoning selves. We
can through these interactions measure what they know or measure who they are, but we cannot do
both at once.
This is the difficulty that has persistently defeated effective communication of climate science.
By reinforcing the association of opposing positions with membership in competing cultural groups,
the antagonistic meanings relentlessly conveyed by high-profile “communicators” on both sides effec-
tively force individuals to use their reason to selectively construe all manner of evidence—from what
“most scientists believe” (Corner et al., 2012; Kahan et al., 2011) to what the weather has been like in
their community in recent years (Goebbert, Jenkins-Smith, Klockow, Nowlin, & Silva, 2012;
McCright, Dunlap, & Xiao, 2014)—in patterns that reflect the positions that prevail in their commun-
ities. We thus observe citizens only as identity-protective reasoners. We consistently fail to engage
their formidable capacity as collective-knowledge acquirers to recognize and give effect to the best
available scientific evidence on climate change.
36 Kahan
There is nothing inevitable or necessary about this outcome. In other domains, most noticeably
the teaching of evolutionary science, the use of valid empirical methods has identified means of disen-
tangling the question of “what do you know?” from the question “who are you; whose side are youon?,” thereby making it possible for individuals of diverse cultural identities to use their reason to par-
ticipate in the insights of science. Climate-science communicators need to learn how to do this too,
not only in the classroom but in the public spaces in which we engage climate science as citizens.
Indeed, the results of the “climate-science comprehension” study I’ve described supports the con-
clusion that ordinary citizens of all political outlooks already know the core insights of climate sci-
ence. If they can be freed of the ugly, illiberal dynamics that force them to choose between exploiting
what they know and expressing who they are, there is every reason to believe that they will demand
that democratically accountable representatives use the best available evidence to promote their col-
lective well-being. Indeed, this is happening, although on a regrettably tiny scale, in regions like
Southeast Florida.
Though I’ve used the “measurement problem” framework to extract insight from empirical evi-
dence—of both real-world and laboratory varieties—nothing in fact depends on accepting the frame-
work. Like “collapsing wave functions,” “superposition,” and similar devices in one particular
rendering of quantum physics, the various elements of the science-of-science-communication mea-
surement problem (“dualistic reasoners,” “communicative interference,” “disentanglement,” etc.) are
not being held forth as “real things” that are “happening” somewhere.
They are a set of pictures intended to help us visualize processes that cannot be observed and
likely do not even admit of being truly seen. The value of the pictures lies in whether they are useful
to us, at least for a time, in forming a reliable mental apprehension of how those dynamics affect our
world, in predicting what is likely to happen to us as we interact with them, and in empowering us to
do things that make our world better.
I think the science-of-science-communication measurement problem can serve that function, and
do so much better than myriad other theories (“bounded rationality,” “terror management,” “system
justification,” etc.) that also can be appraised only for their explanatory, predictive, and prescriptive
utility. But what is imperative is to make sense of —and stop ignoring—observable, consequential
features of our experience. If there are better frameworks, or simply equivalent but different ones, that
help to achieve this goal, then they should be embraced instead.
But there is one final important element of the theoretical framework I have proposed that would
need to be represented by an appropriate counterpart within any alternative. It is a component of the
framework that emphasizes not a parallel in the measurement problems of the science of science
communication and quantum physics but a critical difference between them.
The insolubility of quantum mechanics’ measurement problem is fundamental to the work that
this construct and all the ones related to it (“the uncertainty principle,” “quantum entanglement,” and
the like) do in that theory. To dispel quantum mechanic’s measurement problem (by, say, identifying
the “hidden variables” that determine which of the two slits through which the photon must pass,
whether we are watching or not) would demonstrate the inadequacy (or “incompleteness”) of quantum
mechanics.
But the measurement problem that confronts the science of science communication, while con-
nected to real-world dynamics of consequence and not merely the imperfect methods used to study
them, can be overcome. The dynamics that this measurement problem comprises are ones generated
by the behavior of conscious, reasoning, acting human beings. They can choose to act differently, if
they can figure out how.
The value of a theory of physics is measured by its power to discern laws of nature that are per-
manent and immutable. The utility of recognizing the “science-of-science-communication measure-
ment problem,” in contrast, will depend on the contribution that using that theory can ultimately make
to its own destruction.
Climate-Science Communication and The Measurement Problem 37
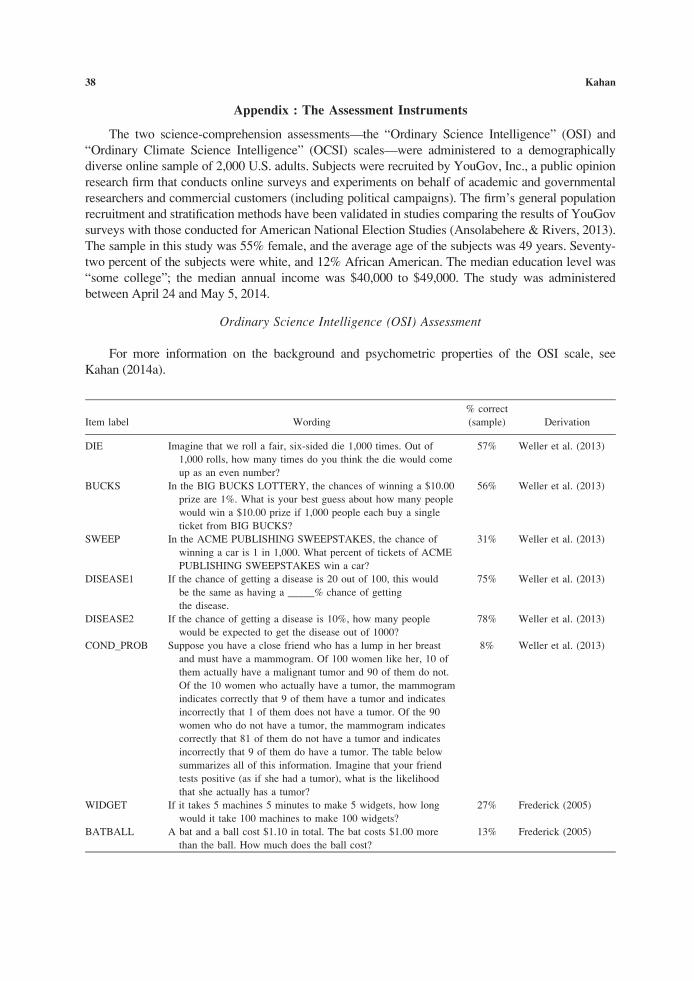
Appendix : The Assessment Instruments
The two science-comprehension assessments—the “Ordinary Science Intelligence” (OSI) and
“Ordinary Climate Science Intelligence” (OCSI) scales—were administered to a demographically
diverse online sample of 2,000 U.S. adults. Subjects were recruited by YouGov, Inc., a public opinion
research firm that conducts online surveys and experiments on behalf of academic and governmental
researchers and commercial customers (including political campaigns). The firm’s general population
recruitment and stratification methods have been validated in studies comparing the results of YouGov
surveys with those conducted for American National Election Studies (Ansolabehere & Rivers, 2013).
The sample in this study was 55% female, and the average age of the subjects was 49 years. Seventy-
two percent of the subjects were white, and 12% African American. The median education level was
“some college”; the median annual income was $40,000 to $49,000. The study was administered
between April 24 and May 5, 2014.
Ordinary Science Intelligence (OSI) Assessment
For more information on the background and psychometric properties of the OSI scale, see
Kahan (2014a).
Item label Wording
% correct
(sample) Derivation
DIE Imagine that we roll a fair, six-sided die 1,000 times. Out of
1,000 rolls, how many times do you think the die would come
up as an even number?
57% Weller et al. (2013)
BUCKS In the BIG BUCKS LOTTERY, the chances of winning a $10.00
prize are 1%. What is your best guess about how many people
would win a $10.00 prize if 1,000 people each buy a single
ticket from BIG BUCKS?
56% Weller et al. (2013)
SWEEP In the ACME PUBLISHING SWEEPSTAKES, the chance of
winning a car is 1 in 1,000. What percent of tickets of ACME
PUBLISHING SWEEPSTAKES win a car?
31% Weller et al. (2013)
DISEASE1 If the chance of getting a disease is 20 out of 100, this would
be the same as having a _____% chance of getting
the disease.
75% Weller et al. (2013)
DISEASE2 If the chance of getting a disease is 10%, how many people
would be expected to get the disease out of 1000?
78% Weller et al. (2013)
COND_PROB Suppose you have a close friend who has a lump in her breast
and must have a mammogram. Of 100 women like her, 10 of
them actually have a malignant tumor and 90 of them do not.
Of the 10 women who actually have a tumor, the mammogram
indicates correctly that 9 of them have a tumor and indicates
incorrectly that 1 of them does not have a tumor. Of the 90
women who do not have a tumor, the mammogram indicates
correctly that 81 of them do not have a tumor and indicates
incorrectly that 9 of them do have a tumor. The table below
summarizes all of this information. Imagine that your friend
tests positive (as if she had a tumor), what is the likelihood
that she actually has a tumor?
8% Weller et al. (2013)
WIDGET If it takes 5 machines 5 minutes to make 5 widgets, how long
would it take 100 machines to make 100 widgets?
27% Frederick (2005)
BATBALL A bat and a ball cost $1.10 in total. The bat costs $1.00 more
than the ball. How much does the ball cost?
13% Frederick (2005)
(Continued)
38 Kahan
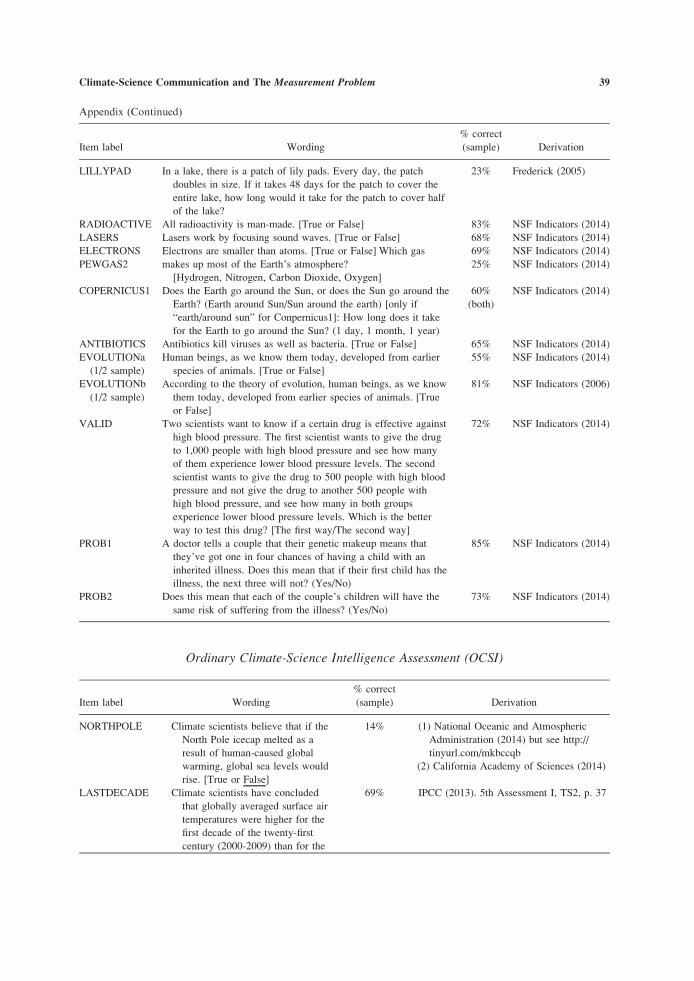
Appendix (Continued)
Item label Wording
% correct
(sample) Derivation
LILLYPAD In a lake, there is a patch of lily pads. Every day, the patch
doubles in size. If it takes 48 days for the patch to cover the
entire lake, how long would it take for the patch to cover half
of the lake?
23% Frederick (2005)
RADIOACTIVE All radioactivity is man-made. [True or False] 83% NSF Indicators (2014)
LASERS 68% NSF Indicators (2014)
ELECTRONS 69% NSF Indicators (2014)
PEWGAS2
Lasers work by focusing sound waves. [True or False]
Electrons are smaller than atoms. [True or False] Which gas
makes up most of the Earth’s atmosphere?
[Hydrogen, Nitrogen, Carbon Dioxide, Oxygen]
25% NSF Indicators (2014)
COPERNICUS1 Does the Earth go around the Sun, or does the Sun go around the
Earth? (Earth around Sun/Sun around the earth) [only if
“earth/around sun” for Conpernicus1]: How long does it take
for the Earth to go around the Sun? (1 day, 1 month, 1 year)
60%
(both)
NSF Indicators (2014)
ANTIBIOTICS Antibiotics kill viruses as well as bacteria. [True or False] 65% NSF Indicators (2014)
EVOLUTIONa
(1/2 sample)
Human beings, as we know them today, developed from earlier
species of animals. [True or False]
55% NSF Indicators (2014)
EVOLUTIONb
(1/2 sample)
According to the theory of evolution, human beings, as we know
them today, developed from earlier species of animals. [True
or False]
81% NSF Indicators (2006)
VALID Two scientists want to know if a certain drug is effective against
high blood pressure. The first scientist wants to give the drug
to 1,000 people with high blood pressure and see how many
of them experience lower blood pressure levels. The second
scientist wants to give the drug to 500 people with high blood
pressure and not give the drug to another 500 people with
high blood pressure, and see how many in both groups
experience lower blood pressure levels. Which is the better
way to test this drug? [The first way/The second way]
72% NSF Indicators (2014)
PROB1 A doctor tells a couple that their genetic makeup means that
they’ve got one in four chances of having a child with an
inherited illness. Does this mean that if their first child has the
illness, the next three will not? (Yes/No)
85% NSF Indicators (2014)
PROB2 Does this mean that each of the couple’s children will have the
same risk of suffering from the illness? (Yes/No)
73% NSF Indicators (2014)
Ordinary Climate-Science Intelligence Assessment (OCSI)
Item label Wording
% correct
(sample) Derivation
NORTHPOLE Climate scientists believe that if the
North Pole icecap melted as a
result of human-caused global
warming, global sea levels would
rise. [True or False]
14% (1) National Oceanic and Atmospheric
Administration (2014) but see http://
tinyurl.com/mkbccqb
(2) California Academy of Sciences (2014)
LASTDECADE Climate scientists have concluded
that globally averaged surface air
temperatures were higher for the
first decade of the twenty-first
century (2000-2009) than for the
69% IPCC (2013). 5th Assessment I, TS2, p. 37
(Continued)
Climate-Science Communication and The Measurement Problem 39
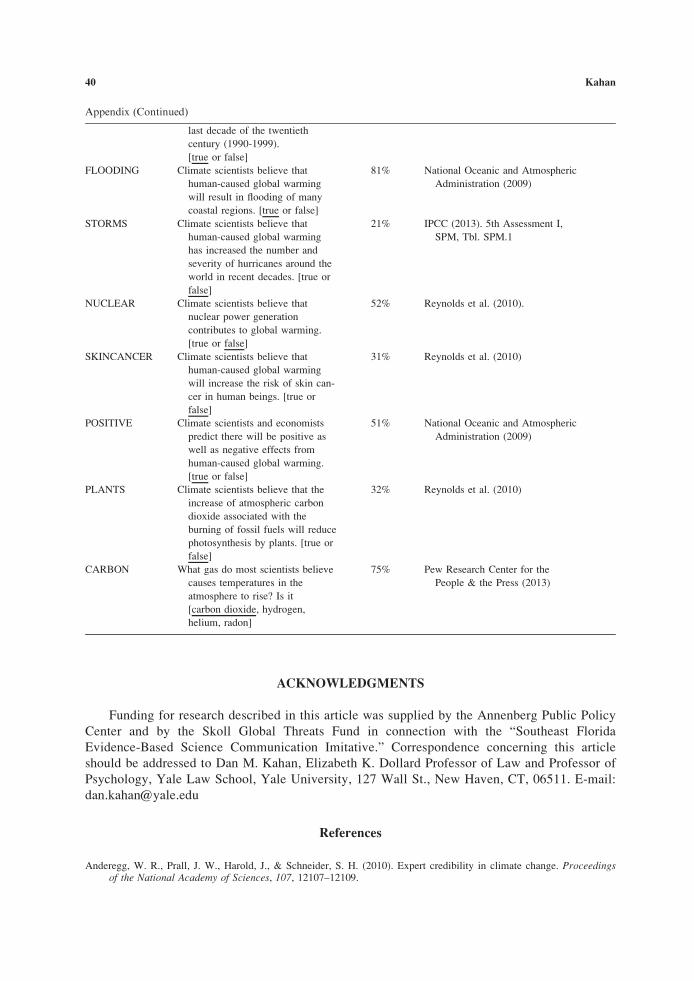
Appendix (Continued)
last decade of the twentieth
century (1990-1999).
[true or false]
FLOODING Climate scientists believe that
human-caused global warming
will result in flooding of many
coastal regions. [true or false]
81% National Oceanic and Atmospheric
Administration (2009)
STORMS Climate scientists believe that
human-caused global warming
has increased the number and
severity of hurricanes around the
world in recent decades. [true or
false]
21% IPCC (2013). 5th Assessment I,
SPM, Tbl. SPM.1
NUCLEAR Climate scientists believe that
nuclear power generation
contributes to global warming.
[true or false]
52% Reynolds et al. (2010).
SKINCANCER Climate scientists believe that
human-caused global warming
will increase the risk of skin can-
cer in human beings. [true or
false]
31% Reynolds et al. (2010)
POSITIVE Climate scientists and economists
predict there will be positive as
well as negative effects from
human-caused global warming.
[true or false]
51% National Oceanic and Atmospheric
Administration (2009)
PLANTS Climate scientists believe that the
increase of atmospheric carbon
dioxide associated with the
burning of fossil fuels will reduce
photosynthesis by plants. [true or
false]
32% Reynolds et al. (2010)
CARBON What gas do most scientists believe
causes temperatures in the
atmosphere to rise? Is it
[carbon dioxide, hydrogen,
helium, radon]
75% Pew Research Center for the
People & the Press (2013)
ACKNOWLEDGMENTS
Funding for research described in this article was supplied by the Annenberg Public Policy
Center and by the Skoll Global Threats Fund in connection with the “Southeast Florida
Evidence-Based Science Communication Imitative.” Correspondence concerning this article
should be addressed to Dan M. Kahan, Elizabeth K. Dollard Professor of Law and Professor of
Psychology, Yale Law School, Yale University, 127 Wall St., New Haven, CT, 06511. E-mail:
References
Anderegg, W. R., Prall, J. W., Harold, J., & Schneider, S. H. (2010). Expert credibility in climate change. Proceedingsof the National Academy of Sciences, 107, 12107–12109.
40 Kahan
Ansolabehere, S., & Rivers, D. (2013). Cooperative survey research. Annual Review of Political Science, 16(1), 307–329. doi:10.1146/annurev-polisci-022811-160625
Baron, J. (1993). Why teach thinking? An essay. Applied Psychology, 42, 191–214.
Baron, J. (2008). Thinking and deciding. New York, NY: Cambridge University Press.
Berinsky, A. J., & Druckman, J. N. (2007). The polls—Review: Public opinion research and support for the Iraq War.Public Opinion Quarterly, 71, 126–141.
Bishop, B. A., & Anderson, C. W. (1990). Student conceptions of natural selection and its role in evolution. Journal ofResearch in Science Teaching, 27, 415–427.
Bishop, G. F. (2005). The illusion of public opinion: Fact and artifact in American public opinion polls. Lanham, MD:Rowman & Littlefield.
Buckland, P. (2014). “Resolved: Climate change is not a ‘crisis’”: Using cultural cognition research in high school ecol-ogy class. CCP Blog. Retrieved from http://www.culturalcognition.net/blog/2014/6/11/resolved-climate-change-is-not-a-crisis-using-cultural-cogni.html
California Academy of Sciences. (2014). Anytime lesson plan: Global climate change and sea level rise. Retrieved fromhttp://www.calacademy.org/teachers/resources/lessons/global-climate-change-and-sea-level-rise/
Cohen, G. L. (2003). Party over Policy: The Dominating Impact of Group Influence on Political Beliefs. Journal ofPersonality & Social Psychology, 85(5), 808–822.
Cook, J., Nuccitelli, D., Green, S. A., Richardson, M., Winkler, B., Painting, R., Way, R., Jacobs, P., & Skuce, A.(2013). Quantifying the consensus on anthropogenic global warming in the scientific literature. EnvironmentalResearch Letters, 8(2), 1–7.
Corner, A., Whitmarsh, L., & Xenias, D. (2012). Uncertainty, skepticism and attitudes towards climate change: biasedassimilation and attitude polarization. Climatic Change, 114, 463–478.
DeMars, C. (2010). Item response theory. Oxford, UK: Oxford University Press.
Demastes, S. S., Settlage, J., & Good, R. (1995). Students’ conceptions of natural selection and its role in evolution:Cases of replication and comparison. Journal of Research in Science Teaching, 32, 535–550.
DeVellis, R. F. (2012). Scale development: Theory and applications. Thousand Oaks, CA: Sage.
Dewey, J. (1910). Science as subject-matter and as method. Science, 31, 121–127.
Dohmen, T., et al. (2011). Individual risk attitudes: Measurement, determinants, and behavioral consequences. Journal ofthe European Economic Association, 9, 522–550.
Doran, P. T., & Zimmerman, M. K. (2009). Examining the scientific consensus on climate change. Eos, TransactionsAmerican Geophysical Union, 90, 22–23.
Embretson, S. E., & Reise, S. P. (2000). Item response theory for psychologists. Mahwah, NJ: Erlbaum.
Feynman, R. P., Leighton, R. B., & Sands, M. L. (1963). The Feynman lectures on physics. Reading, MA: Addison-Wesley.
Frederick, S. (2005). Cognitive reflection and decision making. Journal of Economic Perspectives, 19, 25–42.
Ganzach, Y., Ellis, S., Pazy, A., & Ricci-Siag, T. (2008). On the perception and operationalization of risk perception.Judgment and Decision Making, 3, 317–324.
Gliem, J. A., & Gliem, R. R. (2003). Calculating, interpreting, and reporting Cronbach’s alpha reliability coefficient forLikert-type scales. Presented at the Midwest Research-to-Practice Conference in Adult, Continuing, and CommunityEducation, The Ohio State University. Retrieved from https://scholarworks.iupui.edu/bitstream/handle/1805/344/Gliem+&+Gliem.pdf?sequence=1
Goebbert, K., Jenkins-Smith, H. C., Klockow, K., Nowlin, M. C., & Silva, C. L. (2012). Weather, climate and world-views: The sources and consequences of public perceptions of changes in local weather patterns. Weather, Climate,and Society, 4, 132–144.
Gore, A. (2007). An inconvenient truth: The crisis of global warming. Rev. ed. New York, NY: Viking.
Hamilton, L. C. (2011). Education, politics and opinions about climate change evidence for interaction effects. ClimaticChange, 104, 231–242.
Hamilton, L. C., Cutler, M. J., & Schaefer, A. (2012). Public knowledge and concern about polar-region warming. PolarGeography, 35, 155–168.
Haran, U., Ritov, I., & Mellers, B. A. (2013). The role of actively open-minded thinking in information acquisition,accuracy and calibration. Judgment and Decision Making, 8, 188–201.
IPCC. (2013). Climate Change 2013: The physical science basis, working group in contribution to the fifth assessmentreport of the intergovernmental panel on climate change. Cambridge, UK: Cambridge University Press.
Kahan, D. M. (2007). The cognitively illiberal state. Stanford Law Review, 60, 115–154.
Kahan, D. (2011). Industrial strength risk perception measure. CCP Blog. December 31. Retrieved from http://www.cul-turalcognition.net/blog/2011/12/31/industrial-strength-risk-perception-measure.html
Climate-Science Communication and The Measurement Problem 41
Kahan, D. (2012). Why we are poles apart on climate change. Nature, 488, 255.
Kahan, D. M. (2013a). A risky science communication environment for vaccines. Science, 342, 53–54.
Kahan, D. M. (2013b). Ideology, motivated reasoning, and cognitive reflection. Judgment and Decision Making, 8, 407–424.
Kahan, D. M. (2014a). “Ordinary science intelligence”: A science comprehension measure for use in the study of riskperception and science communication. Cultural Cognition Project Working Paper No. 112.
Kahan, D. M. (2014b). Making climate-science communication evidence-based—all the way down. In M. Boykoff & D.Crow (Eds.), Culture, politics and climate change (pp. 203–220). New York, NY: Routledge Press.
Kahan, D. M., Braman, D., Gastil, J., Slovic, P., & Mertz, C. K. (2007). Culture and identity-protective cognition:Explaining the White-male effect in risk perception. Journal of Empirical Legal Studies, 4, 465–505. Retrievedfrom http://papers.ssrn.com/sol3/papers.cfm?abstract_id=995634
Kahan, D. M., Braman, D., Slovic, P., Gastil, J., & Cohen, G. (2009). Cultural cognition of the risks and benefits ofnanotechnology. Nature Nanotechnology, 4, 87–91.
Kahan, D. M., Jenkins-Smith, H., & Braman, D. (2011). Cultural cognition of scientific consensus. Journal of RiskResearch, 14, 147–174.
Kahan, D. M., Peters, E., Dawson, E., & Slovic, P. (2013). Motivated numeracy and enlightened self-government. Cul-tural Cognition Project Working Paper No. 116.
Kahan, D. M., Peters, E., Wittlin, M., Slovic, P., Ouellette, L. L., Braman, D., & Mandel, G. (2012). The polarizingimpact of science literacy and numeracy on perceived climate change risks. Nature Climate Change, 2, 732–735.
Kahneman, D. (2003). Maps of bounded rationality: Psychology for behavioral economics. American Economic Review,93, 1449–1475.
Keil, F. C. (2003). Folkscience: Coarse interpretations of a complex reality. Trends in Cognitive Sciences, 7(8), 368–373.
Koch, W. (2013, November 13). Americans back greenhouse gas cuts from power plants. USA Today. Retrieved fromhttp://www.usatoday.com/story/news/nation/2013/11/13/americans-greenhouse-gas-cuts-power-plants/3508001/
Kohut, A. (2010, June 13). Views on climate change: What the polls show. New York Times, p. A22. Retrieved fromhttp://www.nytimes.com/2010/06/14/opinion/l14climate.html?_r=0
Krosnick, J. A., Malhotra, N., & Mittal, U. (2014). Public misunderstanding of political facts: How question wordingaffected estimates of partisan differences in birtherism. Public Opinion Quarterly, 78, 147–165.
Lawson, A. E., & Worsnop, W. A. (2006). Learning about evolution and rejecting a belief in special creation: Effects ofreflective reasoning skill, prior knowledge, prior belief and religious commitment. Journal of Research in ScienceTeaching, 29, 143–166.
Lewandowsky, S., Gignac, G. E., & Vaughan, S. (2012). The pivotal role of perceived scientific consensus in acceptanceof science. Nature Climate Change, 3, 399–404.
Lichter, S. R. (2008). Climate scientists agree on warming, disagree on dangers, and don’t trust the media’s coverage ofclimate change. Statistical Assessment Service, George Mason University.
Lipkus, I. M., Samsa, G., & Rimer, B. K. (2001). General performance on a numeracy scale among highly educatedsamples. Medical Decision Making, 21, 37–44.
Loewenstein, G. F., Weber, E. U., Hsee, C. K., & Welch, N. (2001). Risk as feelings. Psychological Bulletin, 127, 267–287.
Marx, S. M., Weber, E. U., Orlove, B. S., Leiserowitz, A., Krantz, D. H., Roncoli, C., & Phillips, J. (2007). Communica-tion and mental processes: Experiential and analytic processing of uncertain climate information. Global Environ-mental Change, 17, 47–58.
McCright, A. M., & Dunlap, R. E. (2012). Bringing ideology in: The conservative white male effect on worry aboutenvironmental problems in the USA. Journal of Risk Research, 16(2), 1–16.
McCright, A. M., Dunlap, R. E., & Xiao, C. (2014). The impacts of temperature anomalies and political orientation onperceived winter warming. Nature Climate Change, 4, 1077–1081.
National Oceanic and Atmospheric Administration. (2009). Climate literacy: The essential principles of climate science.Retrieved from http://cpo.noaa.gov/OutreachandEducation/ClimateLiteracy.aspx
National Oceanic and Atmospheric Administration. (2014). Frequently asked questions about the arctic. Retrieved fromhttp://www.arctic.noaa.gov/faq.html
National Science Foundation. (2006). Science and engineering indicators 2006. Washington, DC.
National Science Foundation. (2014). Science and engineering indicators. Washington, DC.
Oreskes, N. (2004). The scientific consensus on climate change. Science, 306, 1686.
Osterlind, S. J. (1998). Constructing test items: Multiple-choice, constructed-response, performance, and other formats.Boston, MA: Kluwer Academic.
Osterlind, S. J., & Everson, H. T. (2009). Differential item functioning. Thousand Oaks, CA: Sage.
42 Kahan
Peters, E., V€astfj€all, D., Slovic, P., Mertz, C. K., Mazzocco, K., & Dickert, S. (2006). Numeracy and decision making.Psychological Science, 17, 407–413.
Pew Research Center for the People & the Press. (2009). Public praises science; scientists fault public, media. Washing-ton, DC: Pew Research Center.
Pew Research Center for the People & the Press. (2013). Public’s knowledge of science and technology. Washington,DC: Pew Research Center.
Popper, K. R. (1959). The logic of scientific discovery. New York, NY: Basic Books.
Powell, J. (2012). Why climate deniers have no scientific credibility—in one pie chart. Retrieved from www.desmog-blog.com
Reynolds, T. W., Bostrom, A., Read, D., & Morgan, M. G. (2010). Now what do people know about global climatechange? Survey studies of educated laypeople. Risk Analysis, 30(10), 1520–1538. doi:10.1111/j.1539-6924.2010.01448.x
Roos, J. M. (2012). Measuring science or religion? A measurement analysis of the National Science Foundation spon-sored science literacy scale 2006–2010. Public Understanding of Science.
Saad, L. (2014, March 18). A steady 57% in U.S. blame humans for global warming. Retrieved from http://www.gallup.com/poll/167972/steady-blame-humans-global-warming.aspx
Schuman, H. (1998). Interpreting the poll results better. Public Perspective, 1, 87–88.
Sherman, D. K., & Cohen, G. L. (2006). The psychology of self-defense: Self-affirmation theory. Advances in Experi-mental Social Psychology (Vol. 38, pp. 183–242). New York, NY: Academic Press.
Shtulman, A. (2006). Qualitative differences between na€ıve and scientific theories of evolution. Cognitive Psychology,52(2), 170–194.
Silver, D. (2013, June 6). Most Americans say global warming is real, but opinions split on why. Pew Research Center.Retrieved from http://www.pewresearch.org/fact-tank/2013/06/06/most-americans-say-global-warming-is-real-but-opinions-split-on-why/
Slovic, P., Finucane, M. L., Peters, E., & MacGregor, D. G. (2004). Risk as analysis and risk as feelings: Some thoughtsabout affect, reason, risk, and rationality. Risk Analysis, 24, 311–322.
Stanovich, K. E. (2009). What intelligence tests miss: The psychology of rational thought. New Haven, CT: Yale Univer-sity Press.
Stanovich, K. E. (2011). Rationality and the reflective mind. New York, NY: Oxford University Press.
Strong, K. (2010). Polar puzzle: Will ice melting at the North or South Poles cause sea levels to rise? Science Buddies.Retrieved from http://www.sciencebuddies.org/science-fair-projects/project_ideas/OceanSci_p015.shtml
Tobler, C., Visschers, V. H. M., & Siegrist, M. (2012). Addressing climate change: Determinants of consumers’ willing-ness to act and to support policy measures. Journal of Environmental Psychology, 32, 197–207.
University of Queensland. (2013). Study shows scientists agree humans cause global-warming. Retrieved from http://www.uq.edu.au/news/article/2013/05/study-shows-scientists-agree-humans-cause-global-warming
Watson, W. E., Kumar, K., & Michelson, L. K. (1993). Cultural diversity’s impact on interaction process and perform-ance: Comparing homogeneous and diverse task groups. Academy of Management Journal, 36, 590–602.
Watts, D. J. (2011). Everything is obvious: How common sense fails us. New York, NY: Atlantic Books.
Weber, E. (2006). Experience-based and description-based perceptions of long-term risk: Why global warming does notscare us (yet). Climatic Change, 77, 103–120.
Weber, E. U., Blais, A.-R., & Betz, N. E. (2002). A domain-specific risk-attitude scale: Measuring risk perceptions andrisk behaviors. Journal of Behavioral Decision Making, 15, 263–290
Weber, E. U., & Stern, P. C. (2011). Public understanding of climate change in the United States. American Psycholo-gist, 66, 315–328. doi:10.1037/a0023253
Weller, J., Dieckmann, N. F., Tusler, M., Mertz, C. K., Burns, W., & Peters, E. (2013). Development and testing of anabbreviated numeracy scale: A Rasch analysis approach. Journal of Behavioral Decision Making, 26, 198–212.
Yetton, P. W., & Bottger, P. C. (1982). Individual versus group problem solving: An empirical test of a best-memberstrategy. Organizational Behavior and Human Performance, 29(3), 307–321. doi:10.1016/0030-5073(82)90248-3
Zaller, J. R. (1992). The nature and origins of mass opinion. Cambridge, UK: Cambridge University Press.
Climate-Science Communication and The Measurement Problem 43