Embed Size (px)
Citation preview
Climate Sensitivity of Climate Sensitivity of Boreal Forest Boreal Forest
Ecosystem Carbon Ecosystem Carbon DynamicsDynamics
A. David McGuire and ColleaguesA. David McGuire and Colleagues
BNZ LTER Annual SymposiumBNZ LTER Annual Symposium
5 March 2009 5 March 2009
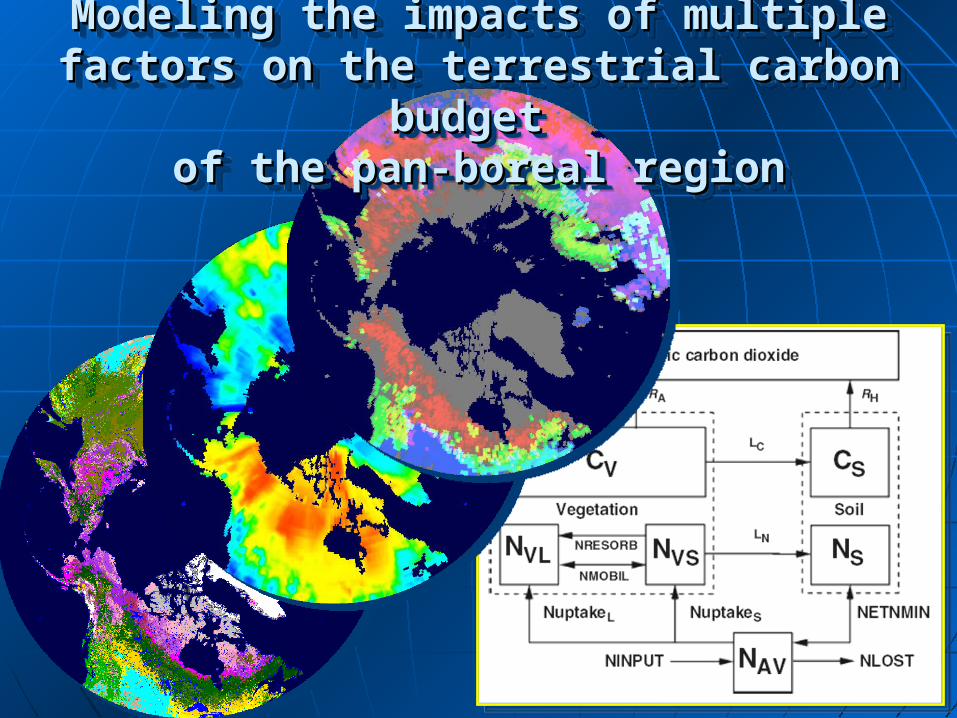
Modeling the impacts of multiple factors Modeling the impacts of multiple factors on the terrestrial carbon budget on the terrestrial carbon budget
of the pan-boreal regionof the pan-boreal region
Modeling the impacts of multiple factors Modeling the impacts of multiple factors on the terrestrial carbon budget on the terrestrial carbon budget
of the pan-boreal regionof the pan-boreal region

NPP HR Conversion Emissions
Product Pools
NET C EXCHANGE (NEE)
ProductDecay
1 yr
DOC Export
TEMCarbon Pools
Vegetation, Soils
(Ecozone)
Disturbance/ Land Use
(LCLUC)
Atmos. CO2
Concentration
Climate(NIRR, TAIR,
PREC)
10 yr
100 yr
Atmos. Chem.(O3, NDEP)
NET ECOSYTEM C BALANCE (NECB)
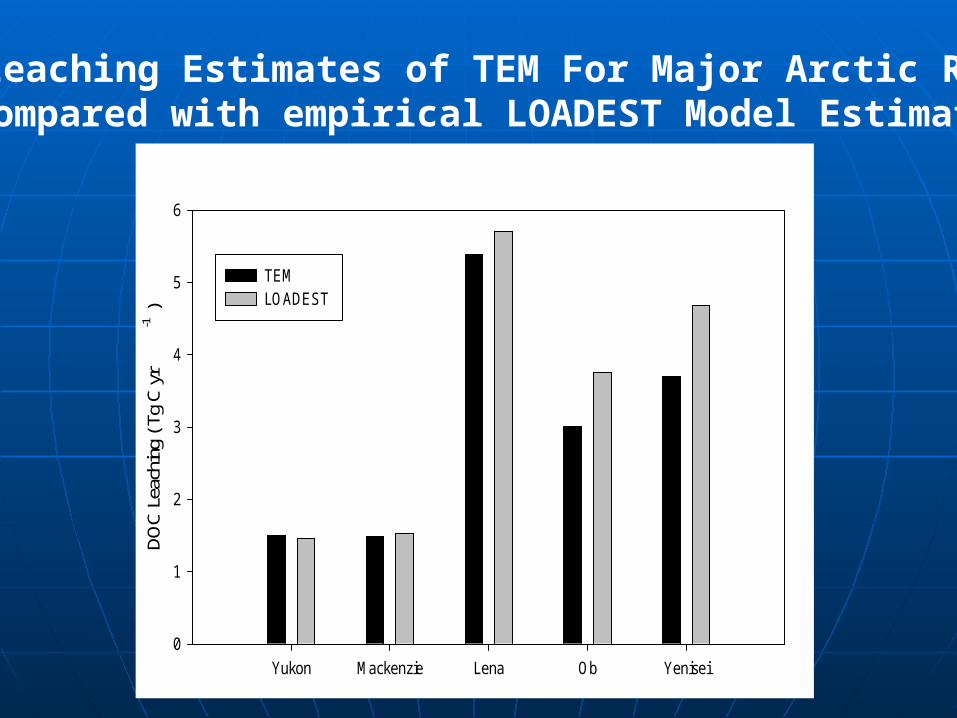
DOC Leaching Estimates of TEM For Major Arctic Rivers compared with empirical LOADEST Model Estimates
Yukon Mackenzie Lena Ob Yenisei
DO
C L
each
ing
( Tg
C y
r-1
)
0
1
2
3
4
5
6
TEMLOADEST


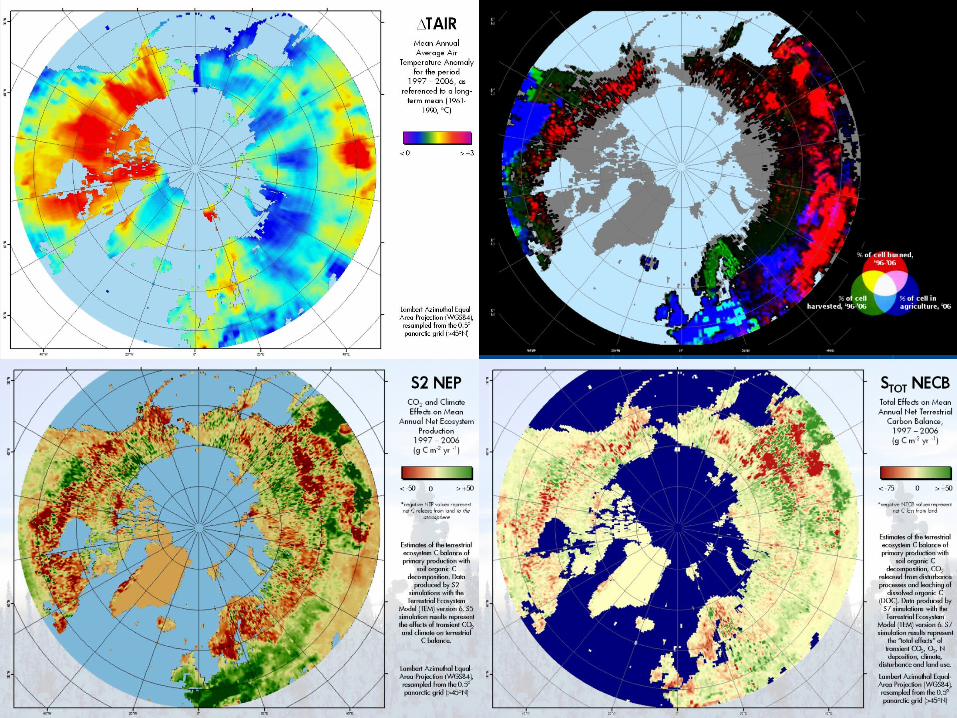
Modeling the impacts of disturbance on Modeling the impacts of disturbance on the terrestrial carbon budget the terrestrial carbon budget
Modeling the impacts of disturbance on Modeling the impacts of disturbance on the terrestrial carbon budget the terrestrial carbon budget
NECB (TgC yrNECB (TgC yr-1-1), N. America, 1997 – 2006), N. America, 1997 – 2006

NDVI trends show boreal NDVI trends show boreal browningbrowning
From Bunn, Lloyd, and Goetz. Associations between tree growth, NDVI, and climate in Boreal forests. American Geophysical Union, December 2006.

-100
-50
0
50
100
1990 1992 1994 1996 1998 2000 2002 2004 2006
Year
De
via
tion
fro
m th
e lo
ng
-te
rm m
ea
n fl
ux
(Tg
C)
NEP NPP HR
-100
-50
0
50
100
1990 1992 1994 1996 1998 2000 2002 2004 2006
Year
Flu
x a
no
ma
ly (
Tg
C)
-30
-15
0
15
30
PM
E a
no
ma
ly (
mm
)
NPP PME
NEP vs. NPP and HR inNorth American Boreal Forests
NPP vs. Precipitation minus ET (PME) in North American Boreal Forests

Climatic controls on NPP of white spruce Climatic controls on NPP of white spruce forests: insights from dendrochronologyforests: insights from dendrochronology
1.1. Negative correlations between growth Negative correlations between growth and warming prevail in white spruce and warming prevail in white spruce forests in Alaska.forests in Alaska.• N=25 sites studied by BNZ P.I.s N=25 sites studied by BNZ P.I.s
(Wilmking, Barber, Juday, Lloyd, Fastie)(Wilmking, Barber, Juday, Lloyd, Fastie)• 28% have predominantly positive 28% have predominantly positive
response to warming, 72% have response to warming, 72% have predominantly negative response to predominantly negative response to warming.warming.
2.2. There is no clear relationship between There is no clear relationship between climate and the location of negatively climate and the location of negatively responding sites.responding sites.


The frequency of trees responding positively to warming The frequency of trees responding positively to warming increases with longitude in the Brooks Range (r=0.903, increases with longitude in the Brooks Range (r=0.903,
P=0.005; Wilmking et al. 2005).P=0.005; Wilmking et al. 2005).

Climatic controls on NPP of white spruce Climatic controls on NPP of white spruce forests: insights from dendrochronologyforests: insights from dendrochronology
3.3. White spruce response to climate White spruce response to climate varies significantly over time varies significantly over time within within some spatial regions, but not in low-some spatial regions, but not in low-elevation interior sites. elevation interior sites.


Climatic controls on NPP of white spruce Climatic controls on NPP of white spruce forests: insights from dendrochronologyforests: insights from dendrochronology
3.3. White spruce response to climate White spruce response to climate varies significantly over time varies significantly over time within within some spatial regions, but not in low-some spatial regions, but not in low-elevation interior sites elevation interior sites . .
4.4. Response to climate varies Response to climate varies significantly within populations of significantly within populations of white spruce, and in many cases white spruce, and in many cases within-population variation exceeds within-population variation exceeds variation among regions.variation among regions.


Climatic controls on NPP of white spruce Climatic controls on NPP of white spruce forests: insights from dendrochronologyforests: insights from dendrochronology
5.5. Stand-level processes also control Stand-level processes also control NPP in white spruce forests, and in NPP in white spruce forests, and in some cases these may have some cases these may have opposing effects to processes opposing effects to processes occurring at the level of individual occurring at the level of individual tree growth.tree growth.

Climatic controls on NPP of white Climatic controls on NPP of white spruce forests: demographic spruce forests: demographic
perspectiveperspective

UP3A
NP
P (
kg C
/ha
/yr)
0
100
200
300
400
500
600
700
UP3B
NP
P (
kg C
/ha
/yr)
0
100
200
300
400
500
UP3C
NP
P (
kg C
/ha
/yr)
0
100
200
300
400
500
UP3s-all
1994 1996 1998 2000 2002 2004 2006 2008
NP
P (
kg C
/ha
/yr)
0
100
200
300
400
500
class0 class1 class2 class3 class4 class5 class6
Inventory Data, beware 1993 Band Data NPP estimate, by site
UP3B
# tr
ees/
ha
0
40
80
120
160
UP3A
# tr
ees/
ha
0
40
80
120
160
UP3C
# tr
ees/
ha
0
40
80
120
160
UP3s-all
1992 1994 1996 1998 2000 2002 2004 2006 2008
# tr
ees/
ha
0
40
80
120
160
UP3B
0
2
4
6
UP3A
0
2
4
6
8
UP3C
Whi
te s
pruc
e N
PP
(kg
C/tr
ee/y
r)
0
2
4
6
UP3s-all
1994 1996 1998 2000 2002 2004 2006 20080
2
4
6
NOTE: 2003 band data was actually collected 5/2004, so NOT using 2003 and 2004.
FP4B
# tr
ees/
ha
0
40
80
120
160
FP4A
# tr
ees/
ha
0
40
80
120
160
FP4C
# tr
ees/
ha
0
40
80
120
160
FP4s-all
1992 1994 1996 1998 2000 2002 2004 2006 2008
# tr
ees/
ha
0
40
80
120
160
class0 class1 class2 class3 class4 class5 class6
FP4B
0
2
4
6
8
FP4A
0
2
4
6
8
FP4C
Whi
te s
pruc
e N
PP
(kg
C/tr
ee/y
r)
0
2
4
6
FP4s-all
1994 1996 1998 2000 2002 2004 2006 20080
2
4
6
8
FP4A
NP
P (
kg C
/ha
/yr)
0
100
200
300
400
500
FP4B
NP
P (
kg C
/ha
/yr)
0
100
200
300
400
500
FP4C
NP
P (
kg C
/ha
/yr)
0
100
200
300
400
500
FP4s-all
1994 1996 1998 2000 2002 2004 2006 2008
NP
P (
kg C
/ha
/yr)
0
100
200
300
400
500
Inventory Data, beware 1993 Band Data NPP estimate, by site

size class 3
1992 1994 1996 1998 2000 2002 2004 2006 2008 2010
Whi
te s
pruc
e N
PP
(kg
C/tr
ee)
0
2
4
6
8UP3aUP3bUP3cUP3s
size class 4
1992 1994 1996 1998 2000 2002 2004 2006 2008 2010
Whi
te s
pruc
e N
PP
(kg
C/tr
ee)
0
2
4
6
8
size class 3
1992 1994 1996 1998 2000 2002 2004 2006 2008 2010
Whi
te s
pruc
e N
PP
(kg
C/tr
ee)
0
2
4
6
8FP4aFP4bFP4cFP4s
size class 4
1992 1994 1996 1998 2000 2002 2004 2006 2008 2010
Whi
te s
pruc
e N
PP
(kg
C/tr
ee)
0
2
4
6
8
Uplands Floodplains

size class 3
1992 1994 1996 1998 2000 2002 2004 2006 2008 2010
Whi
te s
pruc
e N
PP
(kg
C/tr
ee)
0
2
4
6
8
FP4aFP4bFP4cFP4sUP3aUP3bUP3cUP3s
size class 4
1992 1994 1996 1998 2000 2002 2004 2006 2008 2010
Whi
te s
pruc
e N
PP
(kg
C/tr
ee)
0
2
4
6
8
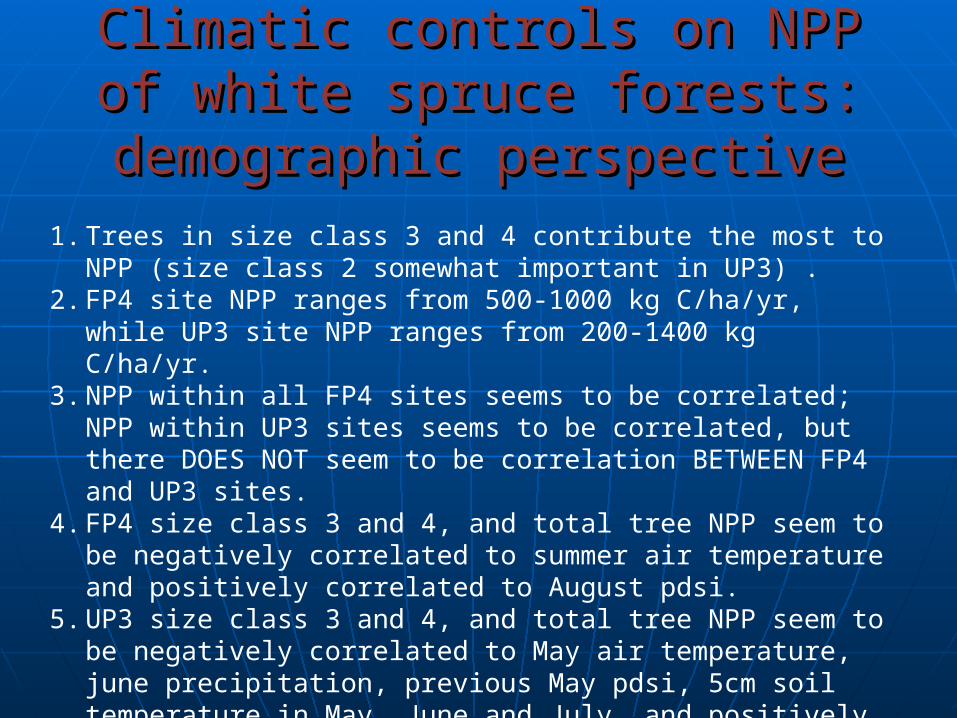
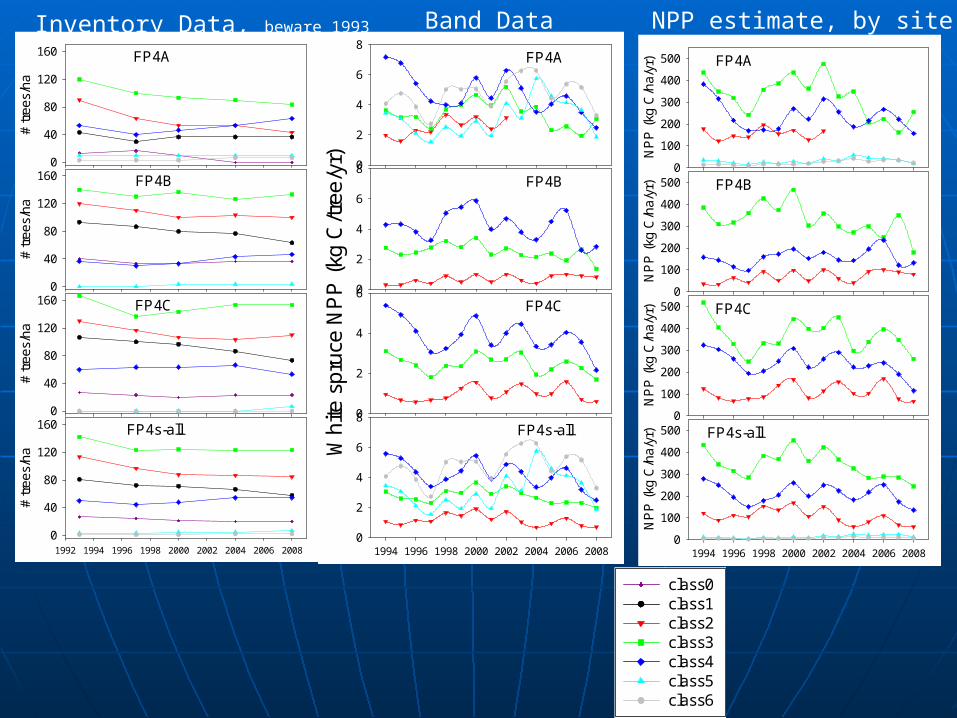
1. Trees in size class 3 and 4 contribute the most to NPP (size class 2 somewhat important in UP3) .
2. FP4 site NPP ranges from 500-1000 kg C/ha/yr, while UP3 site NPP ranges from 200-1400 kg C/ha/yr.
3. NPP within all FP4 sites seems to be correlated; NPP within UP3 sites seems to be correlated, but there DOES NOT seem to be correlation BETWEEN FP4 and UP3 sites.
4. FP4 size class 3 and 4, and total tree NPP seem to be negatively correlated to summer air temperature and positively correlated to August pdsi.
5. UP3 size class 3 and 4, and total tree NPP seem to be negatively correlated to May air temperature, june precipitation, previous May pdsi, 5cm soil temperature in May, June and July, and positively correlated to August pdsi and previous August pdsi.
Climatic controls on NPP of white Climatic controls on NPP of white spruce forests: demographic spruce forests: demographic
perspectiveperspective

Climatic controls on NPP of white spruce Climatic controls on NPP of white spruce forests: experimental perspectiveforests: experimental perspective

HypothesesHypotheses The initial hypotheses were:The initial hypotheses were:
• (1) forest growth in upland birch/aspen ((1) forest growth in upland birch/aspen (Betula Betula neoalaskana neoalaskana Sarg./ Sarg./ Populus tremuloidesPopulus tremuloides Michx.) stands is strongly controlled by Michx.) stands is strongly controlled by summer rainfall, andsummer rainfall, and
• (2) forest growth in balsam poplar/white spruce (2) forest growth in balsam poplar/white spruce ((Populus balsamifera L.Populus balsamifera L./ / Picea glauca Picea glauca (Moench) (Moench) Voss) ecosystems on the floodplain will show Voss) ecosystems on the floodplain will show no relationship to summer rainfall due to the no relationship to summer rainfall due to the influence of ground water, related to river flow influence of ground water, related to river flow dynamics, on soil moisture recharge. dynamics, on soil moisture recharge.

0 2 4 6 8 10 12 14
Cu
mu
lati
ve B
asal
Are
a G
row
th (
cm2)
0
20
40
60
80
100
120
SugarControlSawdust
FertilizerDrought
}= 4.9238 * X
= 8.2367 * X
UP2 – White SpruceUP2 – White Spruce

a
1990 1992 1994 1996 1998 2000 2002
Cu
mu
lati
ve B
as
al
Are
a G
row
th (
cm2
)
0
20
40
60
80
100
120
Sugar
Control
Sawdust
Fertilizer
Drought
}}
= 8.3970 *X
= 5.18616 * X
= 3.7290 * X
FP3 – White SpruceFP3 – White Spruce

Implication for prediction of future forest growthImplication for prediction of future forest growth
Two scenarios can be derived from this Two scenarios can be derived from this research.research.• First for upland sites very little or no change in First for upland sites very little or no change in
tree growth is indicated. Spring snowmelt and tree growth is indicated. Spring snowmelt and summer rainfall will sufficiently replenish soil summer rainfall will sufficiently replenish soil water to maintain the current levels of tree water to maintain the current levels of tree growth.growth.
• Tree growth on the floodplain will have greater Tree growth on the floodplain will have greater dependence on rainfall events assuming no dependence on rainfall events assuming no change in the soil water capillary dynamics. If the change in the soil water capillary dynamics. If the growing season continues to lengthen the growing season continues to lengthen the duration of a potential moisture deficit will duration of a potential moisture deficit will lengthen and the growth capability on the lengthen and the growth capability on the floodplain sites will decrease.floodplain sites will decrease.