Embed Size (px)
Citation preview
Climate-SmartAgriculture Rapid
Appraisal (CSA-RA)
A Prioritization Toolfor Outscaling CSAStep-by-Step Guidelines
CIATThe International Center for Tropical Agriculture (CIAT) – a member of the CGIAR Consortium – develops technologies, innovative methods, and new knowledge that better enable farmers, especially smallholders, to make agriculture eco-efficient – that is, competitive and profitable as well as sustainable and resilient. Headquartered near Cali, Colombia, CIAT conducts research for development in tropical regions of Latin America, Africa, and Asia. www.ciat.cgiar.org
CGIAR is a global research partnership for a food-secure future. Its science is carried out by the 15 research Centers that are members of the CGIAR Consortium in collaboration with hundreds of partner organizations.www.cgiar.org
Climate-Smart Agriculture Rapid Appraisal (CSA-RA)A Prioritization Tool for Outscaling CSAStep-by-Step Guidelines
Caroline Mwongera,A Kelvin Mashisia Shikuku,AC Leigh Winowiecki,A Jennifer Twyman,B Peter Läderach,B Edidah Ampaire,D Piet van Asten,D and Stephen TwomlowE
A = International Center for Tropical Agriculture (CIAT), Nairobi, KenyaB = International Center for Tropical Agriculture (CIAT), Cali, ColombiaC = Wageningen University, The NetherlandsD = International Institute of Tropical Agriculture (IITA), Kampala, UgandaE = International Fund for Agricultural Development (IFAD)
Authors for correspondence
Caroline Mwongera, [email protected] Mashisia Shikuku, [email protected] Winowiecki, [email protected]
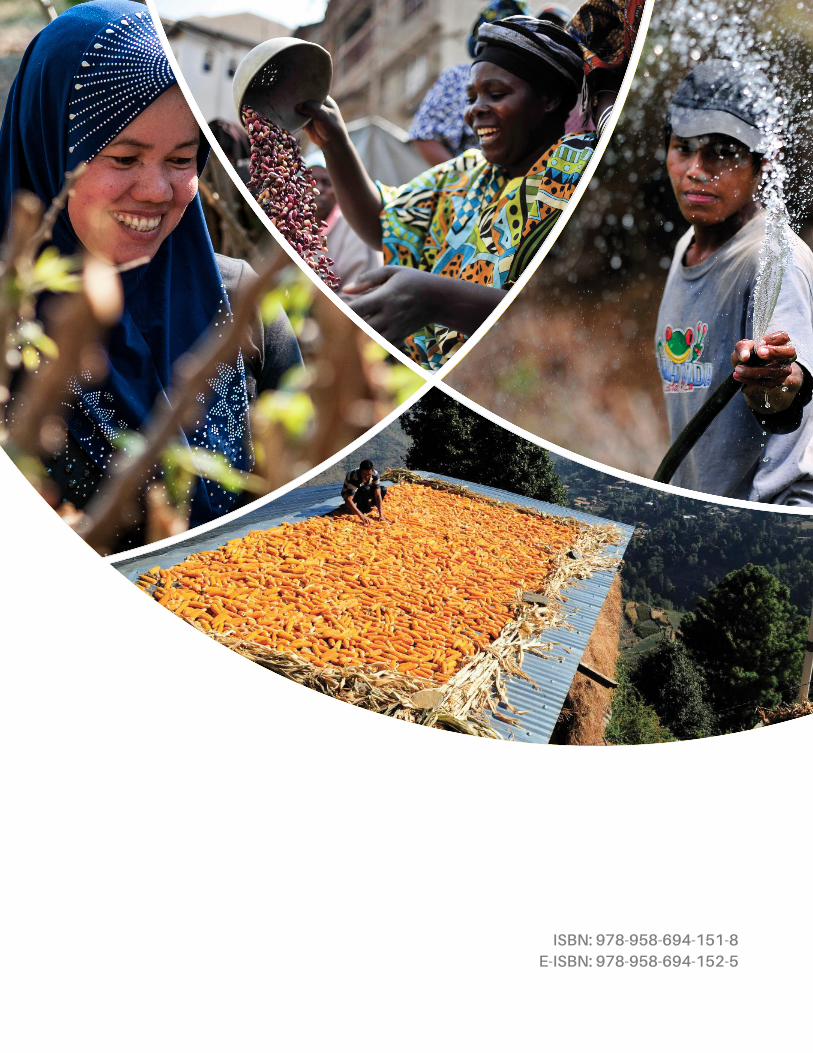
ISBN: 978-958-694-151-8E-ISBN: 978-958-694-152-5
Centro Internacional de Agricultura TropicalInternational Center for Tropical AgricultureApartado Aéreo 6713Cali, ColombiaPhone: +57 2 4450000Fax: +57 2 4450073Website: www.ciat.cgiar.org
CIAT Publication No. 409ISBN: 978-958-694-151-8E-ISBN: 978-958-694-152-5 November 2015
Mwongera C; Shikuku KM; Winowiecki L; Twyman J; Läderach P; Ampaire E; van Asten P; Twomlow S. 2015. Climate-smart agriculture rapid appraisal (CSA-RA): A prioritization tool for outscaling CSA. Step-by-step guidelines. International Center for Tropical Agriculture (CIAT). Cali, Colombia. 44 p.
The International Center for Tropical Agriculture (CIAT) leads the CGIAR Research Program on Climate Change, Agriculture and Food Security (CCAFS), which brings together the world’s best researchers in agricultural science, development research, climate science, and Earth System science, to identify and address the most important interactions, synergies and tradeoffs between climate change, agriculture, and food security. www.ccafs.cgiar.org
Climate-Smart Agriculture Rapid Appraisal (CSA-RA): A Prioritization Tool for Outscaling CSA Step-by-Step Guidelines
This Climate-Smart Agriculture Rapid Appraisal (CSA-RA) was produced as part of the CIAT-led, IFAD-funded project “Increasing food security and farming system resilience in East Africa through wide-scale adoption of climate-smart agricultural practices.” The opinions stated herein are those of the authors and do not necessarily reflect the policies or opinions of CCAFS, donor agencies, or partners.
This manual is divided into two parts: (1) Climate-Smart Agriculture Rapid Appraisal and (2) Climate-Smart Agriculture Prioritization.
Copyright © CIAT 2015
CIAT encourages wide dissemination of its printed and electronic publications for maximum public benefit. Thus, in most cases, colleagues working in research and development should feel free to use CIAT materials for noncommercial purposes. However, the Center prohibits modification of these materials, and we expect to receive due credit. Though CIAT prepares its publications with considerable care, the Center does not guarantee their accuracy and completeness.
Acknowledgements
The authors would like to extend their appreciation to Gulu University in Uganda and the District NAADS offices in Kitgum, Gulu, Nwoya, and Adjumani.
Many thanks to Sokoine University of Agriculture (SUA) in Tanzania, the District Executive Directors and Agriculture Officers in Bagamoyo, Mbarali, Kilolo, and Kilosa for their support. We are grateful to IFAD Uganda County Office, especially Pontian Muhwezi and the IFAD Tanzania Country Offices, especially Rosalie Lehel, Francisco Pichon, and Mwatima Juma. Sincere thanks to Revelian S. Ngaiza of the Ministry of Agriculture in Dar Es Saalam, as well as the CIAT-Arusha and Kampala office staff and the IITA-Kampala staff. Finally, thanks to all the farmers and key informants who participated in the workshops and interviews. We value the time they took from their busy schedules and their willingness to share the information.
Contents
Climate-Smart Agriculture Rapid Appraisal (CSA-RA)
Preparing for the CSA-RA
Training of enumerators for the CSA-RA
Farmer workshops
Key informant interviews
Farmer interviews/transect walk
Climate-Smart Agriculture Prioritization
Activity 1. Icebreaker (this can be replaced with what is relevant to the community)
Activity 2. Mapping exercise
Activity 3. Prioritization of CSA practices using farmer-identified indicators
Appendices
Appendix A. Infographic
Appendix B. Informed Consent
Appendix C. Farm interview format
Appendix D. Assessment of demonstration plots
Appendix E. Key informant interview format
References 44
2
2
3
3
11
11
13
14
14
14
17
17
18
19
28
32
Figures
Figure 1. Crop–gender association exercise at Bagamoyo District,Tanzania, in September 2014
Figure 2. Resource mapping exercise at Mbarali District,Tanzania, in September 2014
Figure 3. Example of a cropping calendar prepared by male participants in a farmer workshop in Mbarali District, Tanzania, in September 2014
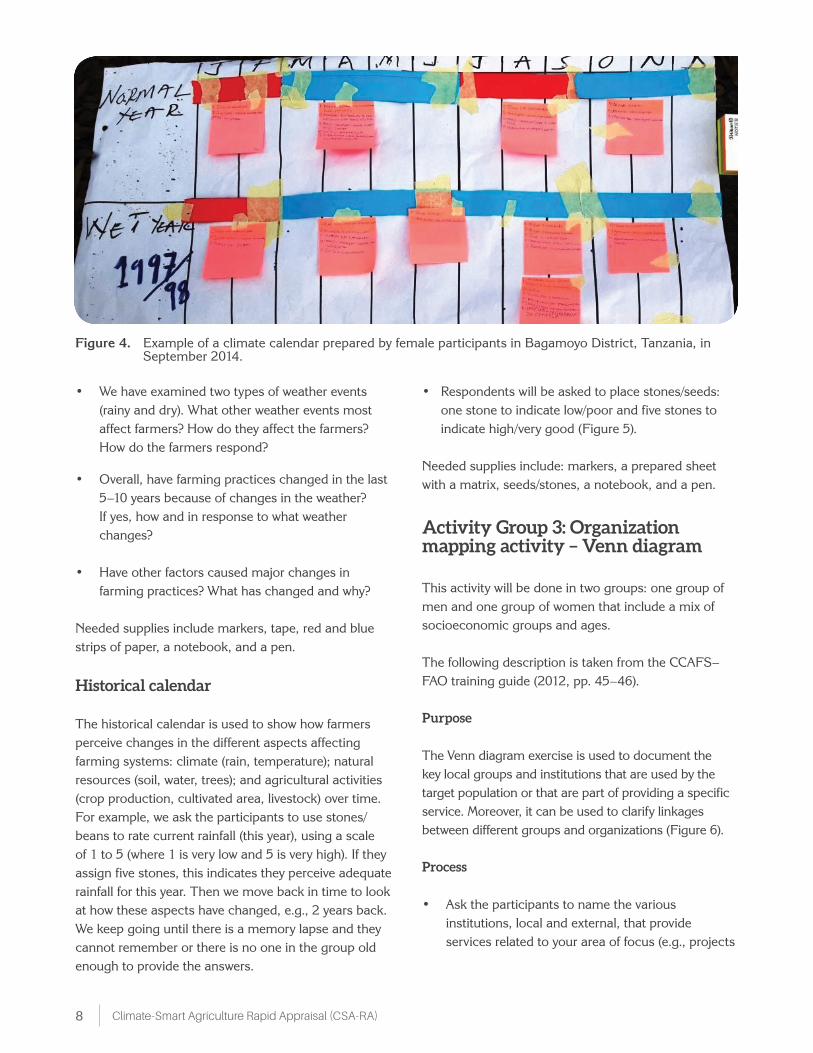
Figure 4. Example of a climate calendar prepared by female participants in Bagamoyo District, Tanzania, in September 2014
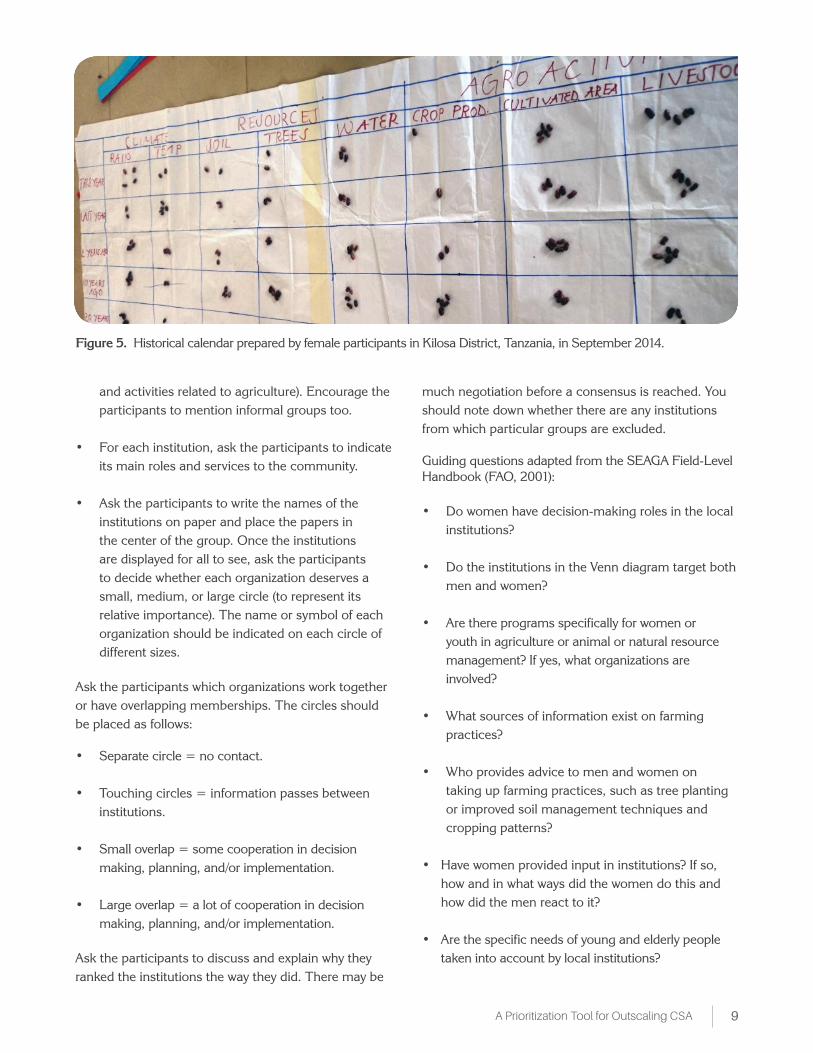
Figure 5. Historical calendar prepared by female participants in Kilosa District, Tanzania, in September 2014
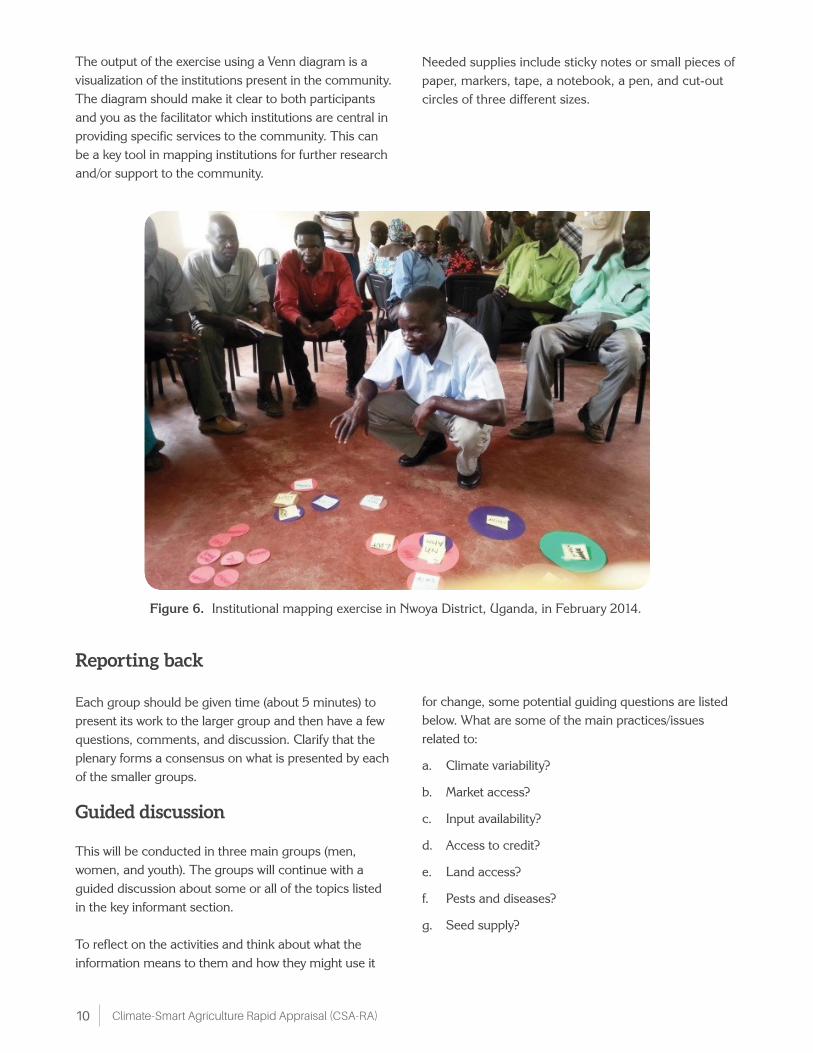
Figure 6. Institutional mapping exercise in Nwoya District,Uganda, in February 2014
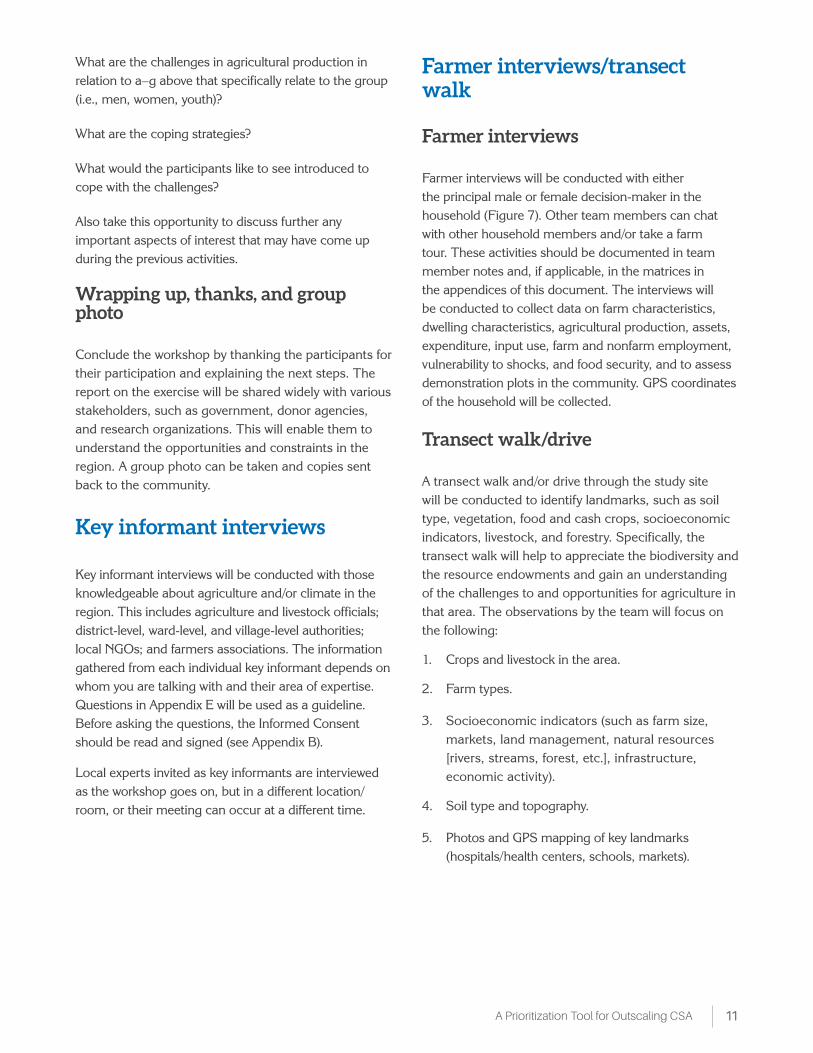
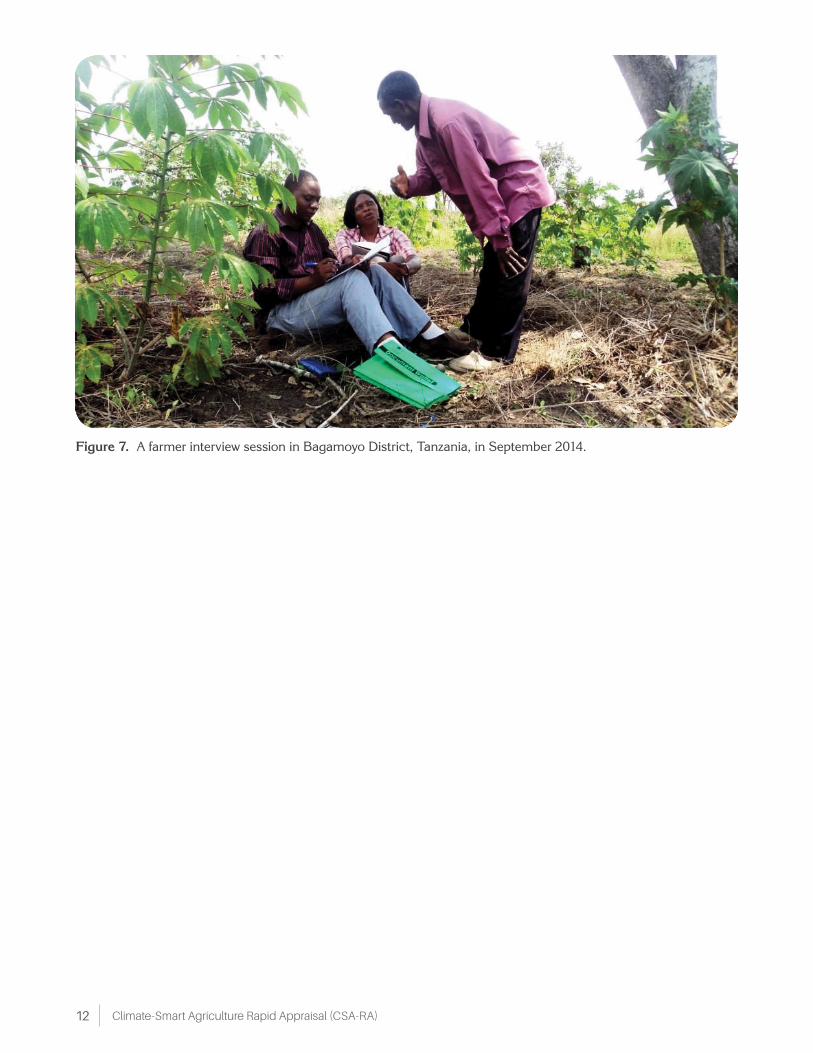
Figure 7. A farmer interview session in Bagamoyo District, Tanzania, in September 2014
4
6
7
8
9
10
12
Climate-Smart Agriculture Rapid Appraisal (CSA-RA)2
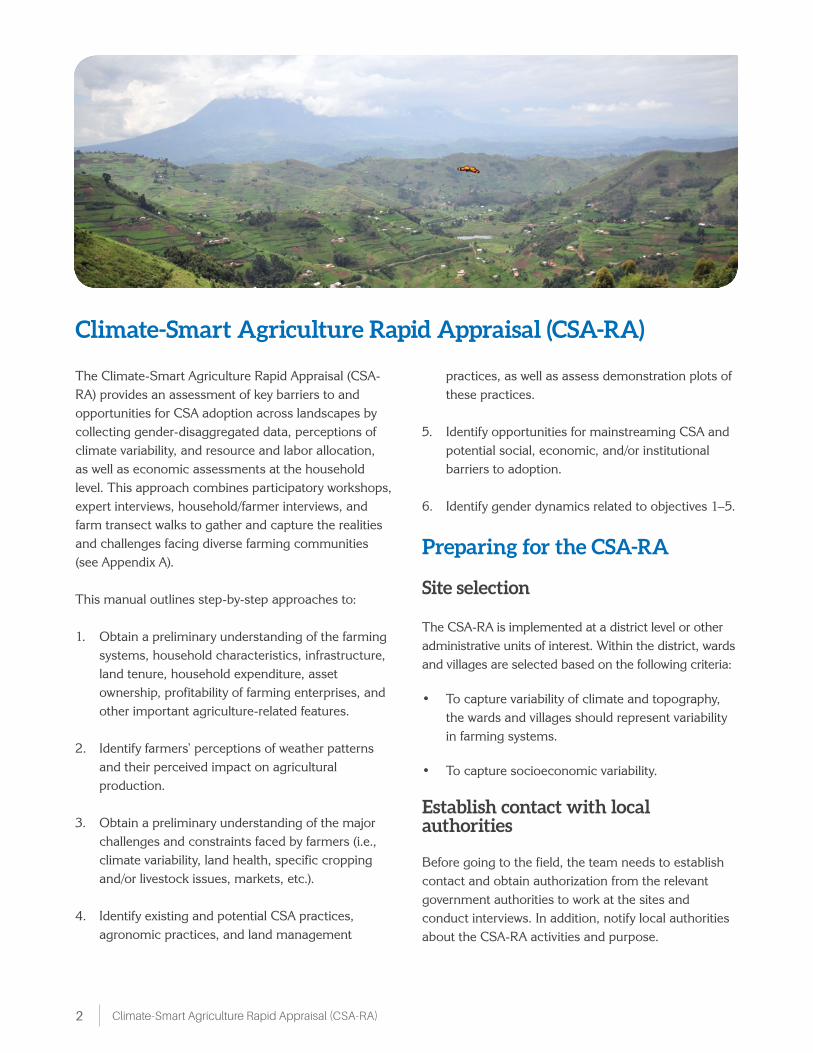
The Climate-Smart Agriculture Rapid Appraisal (CSA-RA) provides an assessment of key barriers to and opportunities for CSA adoption across landscapes by collecting gender-disaggregated data, perceptions of climate variability, and resource and labor allocation, as well as economic assessments at the household level. This approach combines participatory workshops, expert interviews, household/farmer interviews, and farm transect walks to gather and capture the realities and challenges facing diverse farming communities (see Appendix A). This manual outlines step-by-step approaches to:
1. Obtain a preliminary understanding of the farming systems, household characteristics, infrastructure, land tenure, household expenditure, asset ownership, profitability of farming enterprises, and other important agriculture-related features.
2. Identify farmers’ perceptions of weather patterns and their perceived impact on agricultural production.
3. Obtain a preliminary understanding of the major challenges and constraints faced by farmers (i.e., climate variability, land health, specific cropping and/or livestock issues, markets, etc.).
4. Identify existing and potential CSA practices, agronomic practices, and land management
Climate-Smart Agriculture Rapid Appraisal (CSA-RA)
practices, as well as assess demonstration plots of these practices.
5. Identify opportunities for mainstreaming CSA and potential social, economic, and/or institutional barriers to adoption.
6. Identify gender dynamics related to objectives 1–5.
Preparing for the CSA-RA
Site selection
The CSA-RA is implemented at a district level or other administrative units of interest. Within the district, wards and villages are selected based on the following criteria:
• To capture variability of climate and topography, the wards and villages should represent variability in farming systems.
• To capture socioeconomic variability.
Establish contact with local authorities
Before going to the field, the team needs to establish contact and obtain authorization from the relevant government authorities to work at the sites and conduct interviews. In addition, notify local authorities about the CSA-RA activities and purpose.
3A Prioritization Tool for Outscaling CSA
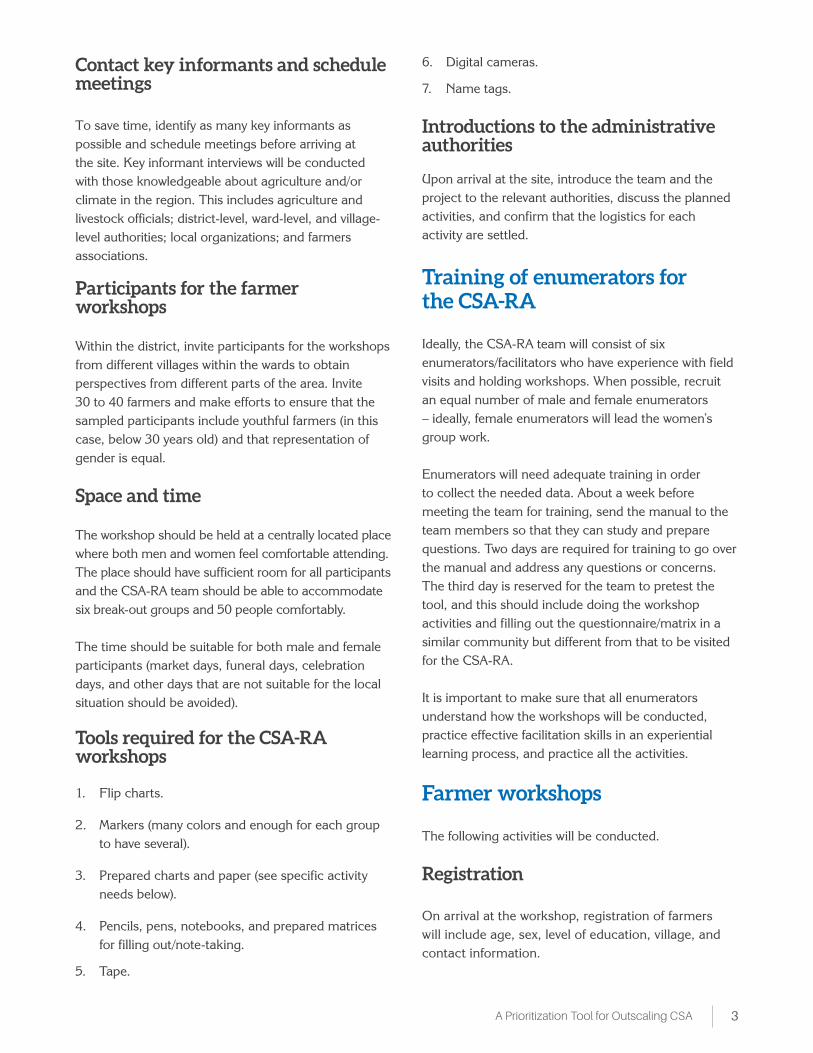
Contact key informants and schedule meetings
To save time, identify as many key informants as possible and schedule meetings before arriving at the site. Key informant interviews will be conducted with those knowledgeable about agriculture and/or climate in the region. This includes agriculture and livestock officials; district-level, ward-level, and village-level authorities; local organizations; and farmers associations.
Participants for the farmer workshops
Within the district, invite participants for the workshops from different villages within the wards to obtain perspectives from different parts of the area. Invite 30 to 40 farmers and make efforts to ensure that the sampled participants include youthful farmers (in this case, below 30 years old) and that representation of gender is equal.
Space and time
The workshop should be held at a centrally located place where both men and women feel comfortable attending. The place should have sufficient room for all participants and the CSA-RA team should be able to accommodate six break-out groups and 50 people comfortably.
The time should be suitable for both male and female participants (market days, funeral days, celebration days, and other days that are not suitable for the local situation should be avoided).
Tools required for the CSA-RA workshops
1. Flip charts.
2. Markers (many colors and enough for each group to have several).
3. Prepared charts and paper (see specific activity needs below).
4. Pencils, pens, notebooks, and prepared matrices for filling out/note-taking.
5. Tape.
6. Digital cameras.
7. Name tags.
Introductions to the administrative authorities
Upon arrival at the site, introduce the team and the project to the relevant authorities, discuss the planned activities, and confirm that the logistics for each activity are settled.
Training of enumerators for the CSA-RA
Ideally, the CSA-RA team will consist of six enumerators/facilitators who have experience with field visits and holding workshops. When possible, recruit an equal number of male and female enumerators – ideally, female enumerators will lead the women’s group work.
Enumerators will need adequate training in order to collect the needed data. About a week before meeting the team for training, send the manual to the team members so that they can study and prepare questions. Two days are required for training to go over the manual and address any questions or concerns. The third day is reserved for the team to pretest the tool, and this should include doing the workshop activities and filling out the questionnaire/matrix in a similar community but different from that to be visited for the CSA-RA.
It is important to make sure that all enumerators understand how the workshops will be conducted, practice effective facilitation skills in an experiential learning process, and practice all the activities.
Farmer workshops
The following activities will be conducted.
Registration
On arrival at the workshop, registration of farmers will include age, sex, level of education, village, and contact information.
Climate-Smart Agriculture Rapid Appraisal (CSA-RA)4
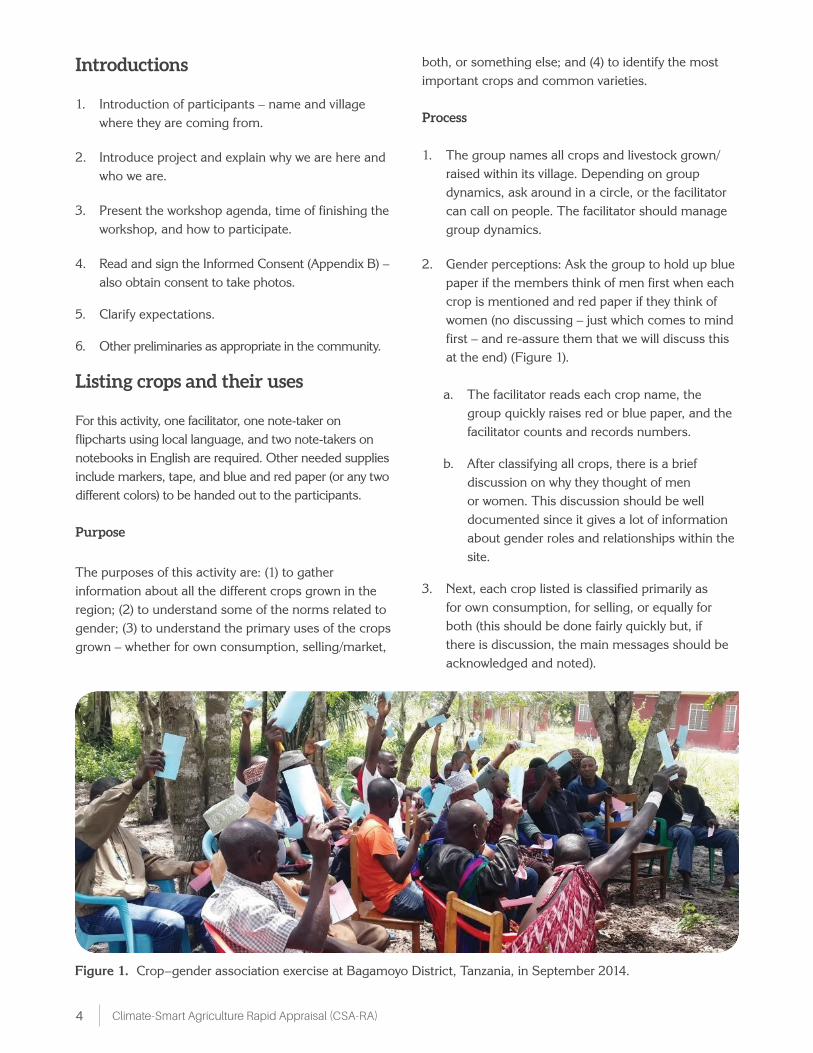
Figure 1. Crop–gender association exercise at Bagamoyo District, Tanzania, in September 2014.
Introductions
1. Introduction of participants – name and village where they are coming from.
2. Introduce project and explain why we are here and who we are.
3. Present the workshop agenda, time of finishing the workshop, and how to participate.
4. Read and sign the Informed Consent (Appendix B) – also obtain consent to take photos.
5. Clarify expectations.
6. Other preliminaries as appropriate in the community.
Listing crops and their uses
For this activity, one facilitator, one note-taker on flipcharts using local language, and two note-takers on notebooks in English are required. Other needed supplies include markers, tape, and blue and red paper (or any two different colors) to be handed out to the participants.
Purpose
The purposes of this activity are: (1) to gather information about all the different crops grown in the region; (2) to understand some of the norms related to gender; (3) to understand the primary uses of the crops grown – whether for own consumption, selling/market,
both, or something else; and (4) to identify the most important crops and common varieties.
Process
1. The group names all crops and livestock grown/raised within its village. Depending on group dynamics, ask around in a circle, or the facilitator can call on people. The facilitator should manage group dynamics.
2. Gender perceptions: Ask the group to hold up blue paper if the members think of men first when each crop is mentioned and red paper if they think of women (no discussing – just which comes to mind first – and re-assure them that we will discuss this at the end) (Figure 1).
a. The facilitator reads each crop name, the group quickly raises red or blue paper, and the facilitator counts and records numbers.
b. After classifying all crops, there is a brief discussion on why they thought of men or women. This discussion should be well documented since it gives a lot of information about gender roles and relationships within the site.
3. Next, each crop listed is classified primarily as for own consumption, for selling, or equally for both (this should be done fairly quickly but, if there is discussion, the main messages should be acknowledged and noted).
5A Prioritization Tool for Outscaling CSA
4. Ask participants to list the five most important crops and discuss the reason why.
5. Also ask about the most common varieties: Is it a local variety or an improved one? Also, note the name. If there is no consensus about the most common varieties, write “multiple.”
Listing livestock and their uses
Repeat steps 1−4 above for livestock and also ask about the most common livestock breeds: Is it a local breed or an improved one?
Community/village resource mapping
This has been adapted from Sanginga and Chitsike (2005).
Purpose
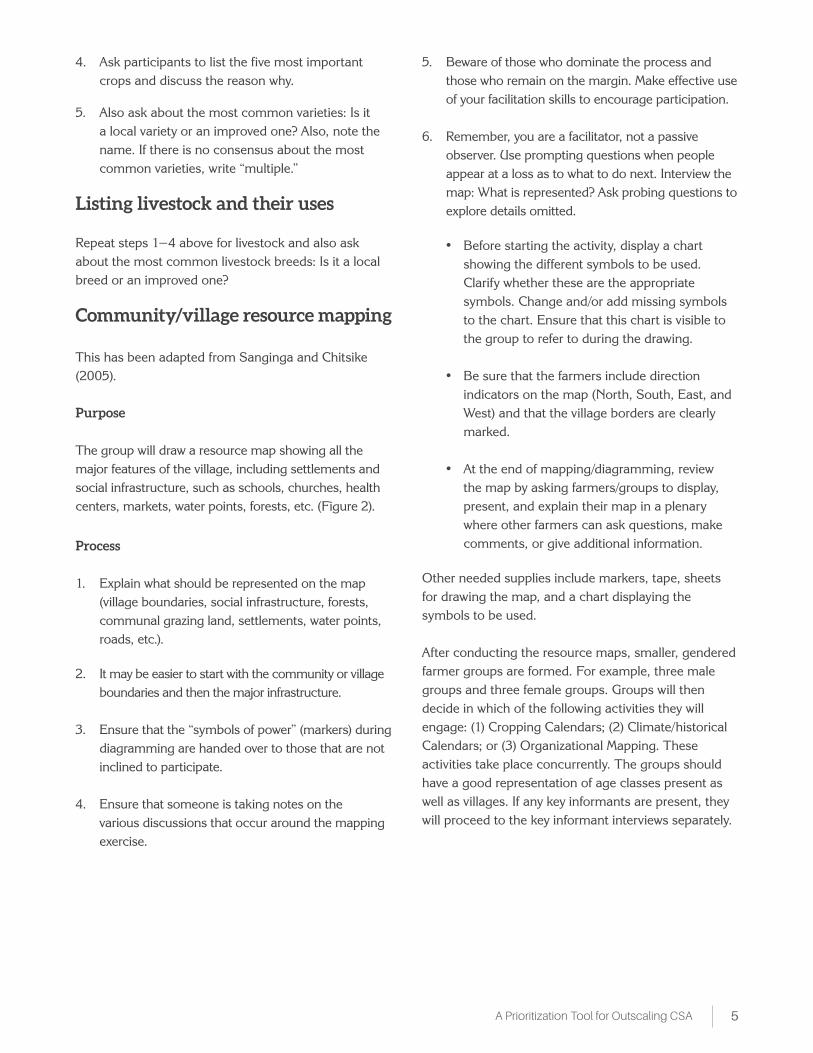
The group will draw a resource map showing all the major features of the village, including settlements and social infrastructure, such as schools, churches, health centers, markets, water points, forests, etc. (Figure 2).
Process
1. Explain what should be represented on the map (village boundaries, social infrastructure, forests, communal grazing land, settlements, water points, roads, etc.).
2. It may be easier to start with the community or village
boundaries and then the major infrastructure.
3. Ensure that the “symbols of power” (markers) during diagramming are handed over to those that are not inclined to participate.
4. Ensure that someone is taking notes on the various discussions that occur around the mapping exercise.
5. Beware of those who dominate the process and those who remain on the margin. Make effective use of your facilitation skills to encourage participation.
6. Remember, you are a facilitator, not a passive observer. Use prompting questions when people appear at a loss as to what to do next. Interview the map: What is represented? Ask probing questions to explore details omitted.
• Before starting the activity, display a chart
showing the different symbols to be used. Clarify whether these are the appropriate symbols. Change and/or add missing symbols to the chart. Ensure that this chart is visible to the group to refer to during the drawing.
• Be sure that the farmers include direction indicators on the map (North, South, East, and West) and that the village borders are clearly marked.
• At the end of mapping/diagramming, review the map by asking farmers/groups to display, present, and explain their map in a plenary where other farmers can ask questions, make comments, or give additional information.
Other needed supplies include markers, tape, sheets for drawing the map, and a chart displaying the symbols to be used.
After conducting the resource maps, smaller, gendered farmer groups are formed. For example, three male groups and three female groups. Groups will then decide in which of the following activities they will engage: (1) Cropping Calendars; (2) Climate/historical Calendars; or (3) Organizational Mapping. These activities take place concurrently. The groups should have a good representation of age classes present as well as villages. If any key informants are present, they will proceed to the key informant interviews separately.
Climate-Smart Agriculture Rapid Appraisal (CSA-RA)6
Figure 2. Resource mapping exercise at Mbarali District, Tanzania, in September 2014.
Activity Group 1: Cropping calendars
This activity will be done in two groups: one group of men and one group of women (Figure 3).
Purpose
This activity allows us to understand the cropping seasons at the site in a normal year, common activities associated with agricultural production, and who performs those activities.
Process
• First, have each group choose the five most important crops. Then, explain that we will now make a calendar that shows the seasons and common agricultural activities.
• Agree on which month to start with (current month, beginning of the cropping season, or beginning of the year, whichever farmers find easy to start with). The months of the year could form the columns.
• With the crops in rows and months in columns, you will have a matrix.
• Add the key activities for production and postharvest handling to the calendar for the chosen crop.
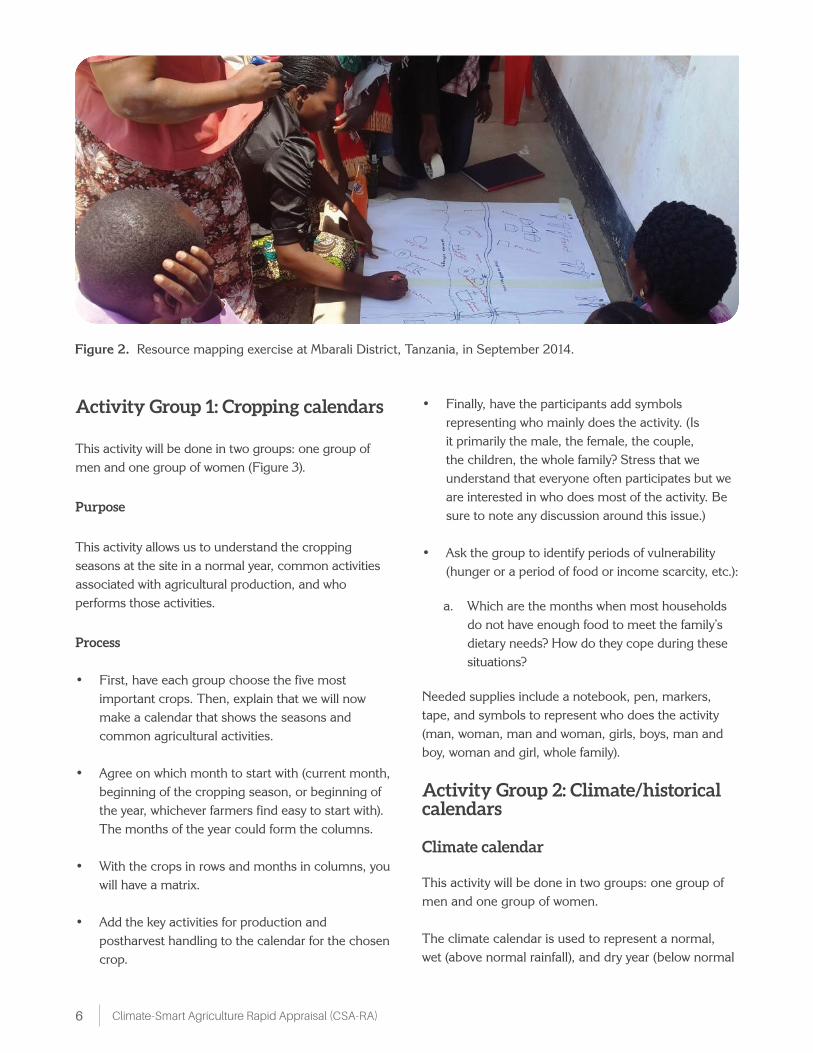
• Finally, have the participants add symbols representing who mainly does the activity. (Is it primarily the male, the female, the couple, the children, the whole family? Stress that we understand that everyone often participates but we are interested in who does most of the activity. Be sure to note any discussion around this issue.)
• Ask the group to identify periods of vulnerability (hunger or a period of food or income scarcity, etc.):
a. Which are the months when most households do not have enough food to meet the family’s dietary needs? How do they cope during these situations?
Needed supplies include a notebook, pen, markers, tape, and symbols to represent who does the activity (man, woman, man and woman, girls, boys, man and boy, woman and girl, whole family).
Activity Group 2: Climate/historical calendars
Climate calendar
This activity will be done in two groups: one group of men and one group of women.
The climate calendar is used to represent a normal, wet (above normal rainfall), and dry year (below normal
7A Prioritization Tool for Outscaling CSA
Figure 3. Example of a cropping calendar prepared by male participants in a farmer workshop in Mbarali District, Tanzania, in September 2014.
rainfall) and associated gender differentiated impacts (Figure 4).
• Setup: Tape up or lay out long paper.
Normal year
1. Ask participants: When does the year start? Add the first month (can be January or another month if they start with land preparation or planting that begins in another month). Add months near the top of the paper.
2. Ask participants to add blue papers to the calendar to indicate the rainy seasons and how long they last.
3. Ask participants to add red papers to the calendar to indicate the dry seasons and how long they last.
4. Then ask for common weather events (strong winds, hail, floods, etc.) and when they typically occur. Add these papers/pictures to the calendar.
Wet year
1. Ask participants to think of a year when there was a lot of rain – maybe flooding. What year was it? Note the year and then repeat the exercise (steps 2–4 above). Then, briefly discuss how the extra rains influenced farming activities.
Guiding questions:
• Which crops (and varieties) and animals were most affected in that year by the extra rain? How were they affected? What happened? How did farmers react?
a. How were men and women affected?
b. How did men and women react?
• Which crops and varieties were least affected? Why?
• Which farmers were most/least affected? Why? How did they respond?
• Did the excess rain in the season affect the next growing season? How? Why?
Dry year
Repeat the exercise with an extremely dry year. Be sure to note the year the farmers refer to. Repeat the discussion questions.
• What are the household/community coping strategies during a dry year? How and where do they obtain food?
• If time allows, continue the conversation by asking more weather-related questions:
Climate-Smart Agriculture Rapid Appraisal (CSA-RA)8
Figure 4. Example of a climate calendar prepared by female participants in Bagamoyo District, Tanzania, in September 2014.
• We have examined two types of weather events (rainy and dry). What other weather events most affect farmers? How do they affect the farmers? How do the farmers respond?
• Overall, have farming practices changed in the last 5–10 years because of changes in the weather? If yes, how and in response to what weather changes?
• Have other factors caused major changes in farming practices? What has changed and why?
Needed supplies include markers, tape, red and blue strips of paper, a notebook, and a pen.
Historical calendar
The historical calendar is used to show how farmers perceive changes in the different aspects affecting farming systems: climate (rain, temperature); natural resources (soil, water, trees); and agricultural activities (crop production, cultivated area, livestock) over time. For example, we ask the participants to use stones/beans to rate current rainfall (this year), using a scale of 1 to 5 (where 1 is very low and 5 is very high). If they assign five stones, this indicates they perceive adequate rainfall for this year. Then we move back in time to look at how these aspects have changed, e.g., 2 years back. We keep going until there is a memory lapse and they cannot remember or there is no one in the group old enough to provide the answers.
• Respondents will be asked to place stones/seeds: one stone to indicate low/poor and five stones to indicate high/very good (Figure 5).
Needed supplies include: markers, a prepared sheet with a matrix, seeds/stones, a notebook, and a pen.
Activity Group 3: Organization mapping activity – Venn diagram
This activity will be done in two groups: one group of men and one group of women that include a mix of socioeconomic groups and ages.
The following description is taken from the CCAFS–FAO training guide (2012, pp. 45–46).
Purpose
The Venn diagram exercise is used to document the key local groups and institutions that are used by the target population or that are part of providing a specific service. Moreover, it can be used to clarify linkages between different groups and organizations (Figure 6).
Process
• Ask the participants to name the various institutions, local and external, that provide services related to your area of focus (e.g., projects
9A Prioritization Tool for Outscaling CSA
Figure 5. Historical calendar prepared by female participants in Kilosa District, Tanzania, in September 2014.
and activities related to agriculture). Encourage the participants to mention informal groups too.
• For each institution, ask the participants to indicate its main roles and services to the community.
• Ask the participants to write the names of the institutions on paper and place the papers in the center of the group. Once the institutions are displayed for all to see, ask the participants to decide whether each organization deserves a small, medium, or large circle (to represent its relative importance). The name or symbol of each organization should be indicated on each circle of different sizes.
Ask the participants which organizations work together or have overlapping memberships. The circles should be placed as follows:
• Separate circle = no contact.
• Touching circles = information passes between institutions.
• Small overlap = some cooperation in decision making, planning, and/or implementation.
• Large overlap = a lot of cooperation in decision making, planning, and/or implementation.
Ask the participants to discuss and explain why they ranked the institutions the way they did. There may be
much negotiation before a consensus is reached. You should note down whether there are any institutions from which particular groups are excluded.
Guiding questions adapted from the SEAGA Field-Level Handbook (FAO, 2001):
• Do women have decision-making roles in the local institutions?
• Do the institutions in the Venn diagram target both men and women?
• Are there programs specifically for women or youth in agriculture or animal or natural resource management? If yes, what organizations are involved?
• What sources of information exist on farming practices?
• Who provides advice to men and women on taking up farming practices, such as tree planting or improved soil management techniques and cropping patterns?
• Have women provided input in institutions? If so, how and in what ways did the women do this and how did the men react to it?
• Are the specific needs of young and elderly people taken into account by local institutions?
Climate-Smart Agriculture Rapid Appraisal (CSA-RA)10
Figure 6. Institutional mapping exercise in Nwoya District, Uganda, in February 2014.
The output of the exercise using a Venn diagram is a visualization of the institutions present in the community. The diagram should make it clear to both participants and you as the facilitator which institutions are central in providing specific services to the community. This can be a key tool in mapping institutions for further research and/or support to the community.
Reporting back
Each group should be given time (about 5 minutes) to present its work to the larger group and then have a few questions, comments, and discussion. Clarify that the plenary forms a consensus on what is presented by each of the smaller groups.
Guided discussion
This will be conducted in three main groups (men, women, and youth). The groups will continue with a guided discussion about some or all of the topics listed in the key informant section.
To reflect on the activities and think about what the information means to them and how they might use it
Needed supplies include sticky notes or small pieces of paper, markers, tape, a notebook, a pen, and cut-out circles of three different sizes.
for change, some potential guiding questions are listed below. What are some of the main practices/issues related to:
a. Climate variability?
b. Market access?
c. Input availability?
d. Access to credit?
e. Land access?
f. Pests and diseases?
g. Seed supply?
11A Prioritization Tool for Outscaling CSA
Key informant interviews will be conducted with those knowledgeable about agriculture and/or climate in the region. This includes agriculture and livestock officials; district-level, ward-level, and village-level authorities; local NGOs; and farmers associations. The information gathered from each individual key informant depends on whom you are talking with and their area of expertise. Questions in Appendix E will be used as a guideline. Before asking the questions, the Informed Consent should be read and signed (see Appendix B). Local experts invited as key informants are interviewed as the workshop goes on, but in a different location/room, or their meeting can occur at a different time.
Farmer interviews/transect walk
Farmer interviews
Farmer interviews will be conducted with either the principal male or female decision-maker in the household (Figure 7). Other team members can chat with other household members and/or take a farm tour. These activities should be documented in team member notes and, if applicable, in the matrices in the appendices of this document. The interviews will be conducted to collect data on farm characteristics, dwelling characteristics, agricultural production, assets, expenditure, input use, farm and nonfarm employment, vulnerability to shocks, and food security, and to assess demonstration plots in the community. GPS coordinates of the household will be collected.
Transect walk/drive
A transect walk and/or drive through the study site will be conducted to identify landmarks, such as soil type, vegetation, food and cash crops, socioeconomic indicators, livestock, and forestry. Specifically, the transect walk will help to appreciate the biodiversity and the resource endowments and gain an understanding of the challenges to and opportunities for agriculture in that area. The observations by the team will focus on the following:
1. Crops and livestock in the area.
2. Farm types.
3. Socioeconomic indicators (such as farm size, markets, land management, natural resources [rivers, streams, forest, etc.], infrastructure, economic activity).
4. Soil type and topography.
5. Photos and GPS mapping of key landmarks (hospitals/health centers, schools, markets).
Key informant interviews
What are the challenges in agricultural production in relation to a–g above that specifically relate to the group (i.e., men, women, youth)?
What are the coping strategies?
What would the participants like to see introduced to cope with the challenges?
Also take this opportunity to discuss further any important aspects of interest that may have come up during the previous activities.
Wrapping up, thanks, and group photo
Conclude the workshop by thanking the participants for their participation and explaining the next steps. The report on the exercise will be shared widely with various stakeholders, such as government, donor agencies, and research organizations. This will enable them to understand the opportunities and constraints in the region. A group photo can be taken and copies sent back to the community.
Climate-Smart Agriculture Rapid Appraisal (CSA-RA)12
Figure 7. A farmer interview session in Bagamoyo District, Tanzania, in September 2014.
13A Prioritization Tool for Outscaling CSA
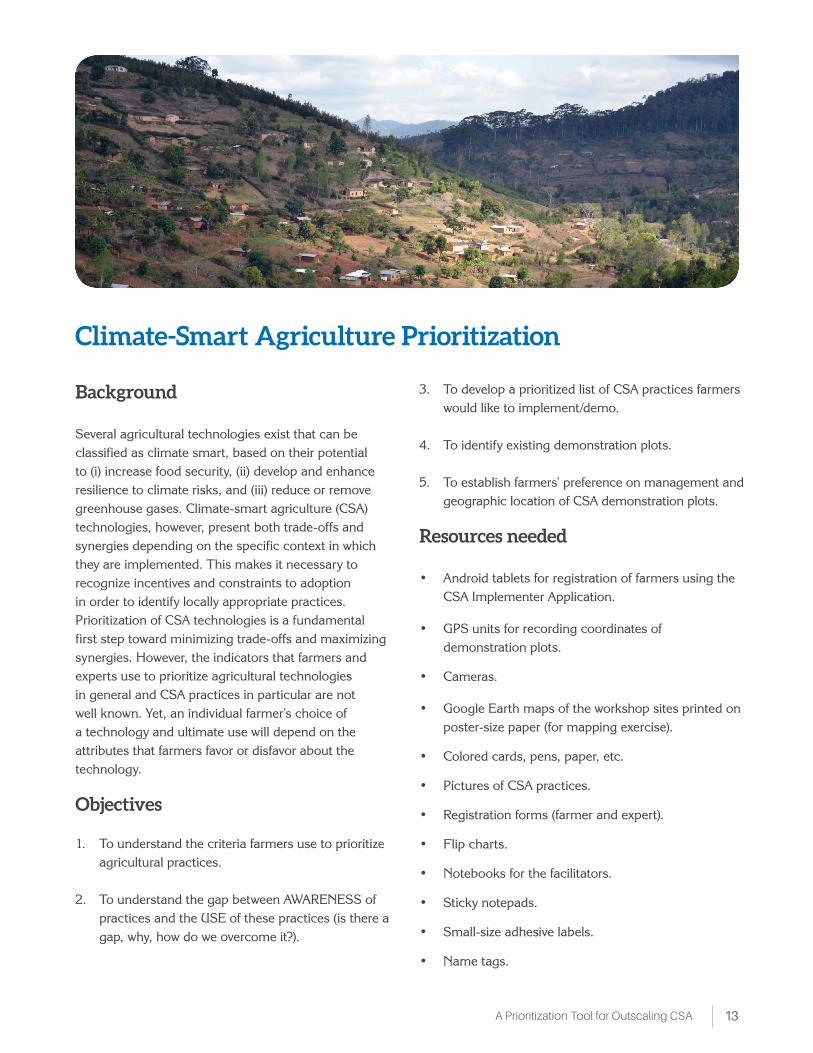
Background
Several agricultural technologies exist that can be classified as climate smart, based on their potential to (i) increase food security, (ii) develop and enhance resilience to climate risks, and (iii) reduce or remove greenhouse gases. Climate-smart agriculture (CSA) technologies, however, present both trade-offs and synergies depending on the specific context in which they are implemented. This makes it necessary to recognize incentives and constraints to adoption in order to identify locally appropriate practices. Prioritization of CSA technologies is a fundamental first step toward minimizing trade-offs and maximizing synergies. However, the indicators that farmers and experts use to prioritize agricultural technologies in general and CSA practices in particular are not well known. Yet, an individual farmer’s choice of a technology and ultimate use will depend on the attributes that farmers favor or disfavor about the technology.
Objectives
1. To understand the criteria farmers use to prioritize agricultural practices.
2. To understand the gap between AWARENESS of practices and the USE of these practices (is there a gap, why, how do we overcome it?).
3. To develop a prioritized list of CSA practices farmers would like to implement/demo.
4. To identify existing demonstration plots.
5. To establish farmers’ preference on management and geographic location of CSA demonstration plots.
Resources needed
• Android tablets for registration of farmers using the CSA Implementer Application.
• GPS units for recording coordinates of demonstration plots.
• Cameras.
• Google Earth maps of the workshop sites printed on poster-size paper (for mapping exercise).
• Colored cards, pens, paper, etc.
• Pictures of CSA practices.
• Registration forms (farmer and expert).
• Flip charts.
• Notebooks for the facilitators.
• Sticky notepads.
• Small-size adhesive labels.
• Name tags.
Climate-Smart Agriculture Prioritization
Climate-Smart Agriculture Rapid Appraisal (CSA-RA)14
Activity 1: Icebreaker (this can be replaced with what is relevant to the community)
• Give farmers blue and pink cards. Ask, by showing a card (blue is good, pink is bad), how good are your soils?
• For those who raised a blue card: What indicators do you use to say that the soil is good?
• For those who raised a pink card: What indicators
do you use to say that the soil is not good? • Is burning a common practice? Why?
• Does burning influence soil fertility in any way? If yes, how?
Activity 2: Mapping exercise
Objectives
1. To identify agro-ecological zones (AEZs) and to obtain information on each zone that will help researchers understand farmers’ prioritization and use of farm practices.
2. To guide the selection of important agro-ecological characteristics to be included in the land inventory that may influence either output level or environmental impact.
Instructions
1. Display the Google Earth map of the site where all farmers can see it.
2. Ask farmers to indicate on the map the different AEZs in the site. Describe how they characterize each zone, for example, is it by farming systems, crops grown, climate?
3. What are the main challenges/limitations to production in each zone?
4. Have there been any changes in AEZs as a result of climate change?
5. Have there been changes in forest cover, river flows, etc.?
6. Enumerators will take notes of the discussion.
Activity 3: Prioritization of CSA practices using farmer-identified indicators
Objectives
1. To identify practices that farmers are currently using.
2. To identify farmers’ indicators/drivers in adopting agricultural practices.
3. To identify barriers to the adoption of agricultural practices.
4. To understand the gap between AWARENESS of practices and the USE of these practices (e.g., why is there this gap and how can we overcome it?).
5. To gather information on farmers’ own criteria for prioritization.
6. To identify relevant CSA practices that farmers are not using.
Note: This activity will be done with the whole group.
Instructions
1. Ask farmers to list the practices that they know or have heard about (refer to land, soil, crop, livestock, and water management and ask farmers to list the practices they have heard of).
2. Ask by a show of hands how many farmers know or have heard about each practice (facilitators will count by gender, i.e., how many male vs. female participants). Also, note the total number of farmers present by gender.
3. Ask, by a show of hands, how many farmers are currently (present and last season) using the
15A Prioritization Tool for Outscaling CSA
practice (facilitators will count by gender, i.e., how many male vs. female participants). Also, note the total number of farmers present by gender.
4. If there is a noticeable gap between awareness and use, ask why such a gap exists, for example, why is it that many people know about the practice but are not currently using it? (Do this for each listed practice).
5. Ask: Are there any practices that you used to practice before but you are currently not using? (Enumerator will list the abandoned practices).
6. For each practice, ask: Why did you stop using the practice?
7. Pull out a list of pre-listed CSA practices that could be appropriate for the site (our list).
8. Compare the practices listed by farmers and those in “our” list.
9. Identify any missing practices and ask whether farmers are aware of these practices.
10. For practices that farmers are not aware of, present a description of the practices with the aid of pictures (what they are, where they are applicable, their benefits, AND confirm that farmers are not aware).
11. If the group agrees these are appropriate for the site, add these practices to the list generated by farmers and indicate proportion of awareness equals zero (now we have a master list of practices).
12. Ask: What do you consider when deciding whether or not to use this practice (for each practice)? Here we aim to identify barriers to adoption as well as indicators for trade-offs.
them to also consider practices we described and added that they are not using).
• Ask farmers about the benefits/importance of these practices (e.g., why they selected the practice as relevant for the zone).
• For practices perceived to be relevant but not presently being used (from the master list), probe for reasons why the practices are not being used.
• What would the farmers need to implement the practices?
• What do they perceive as constraints to implementation of these practices?
Ranking/prioritization of the practices by pairwise ranking (for each AEZ and by gender)
• Construct a pairwise matrix (each box in the matrix represents the intersection [or pairing] of two practices).
• Rank each pair. For each pair, have the group (using a consensus-oriented discussion) determine which of the two practices is preferred. Then, for each pair, write the preferable practice in the appropriate box. Repeat this process until the matrix is filled.
• Note the reasons for the preference for each pair of practices.
• Count the number of times each practice appears in the matrix. Rank the practices by the total number of times they appear in the matrix. To break a tie (where two practices appear the same number of times), look at the box in which those two practices are compared.
• The practice appearing in that box receives the higher ranking.
• Ask farmers to select and rank from the master list five practices they would like to see tried in a demonstration plot.
Generate a short list of practices related to AEZ and gender
• Ask farmers to select from the master list practices that they perceive as important or relevant for their agro-ecological zone (remind
Divide into groups based on AEZ (generated from farmers’ mapping exercise) and gender.
Climate-Smart Agriculture Rapid Appraisal (CSA-RA)16
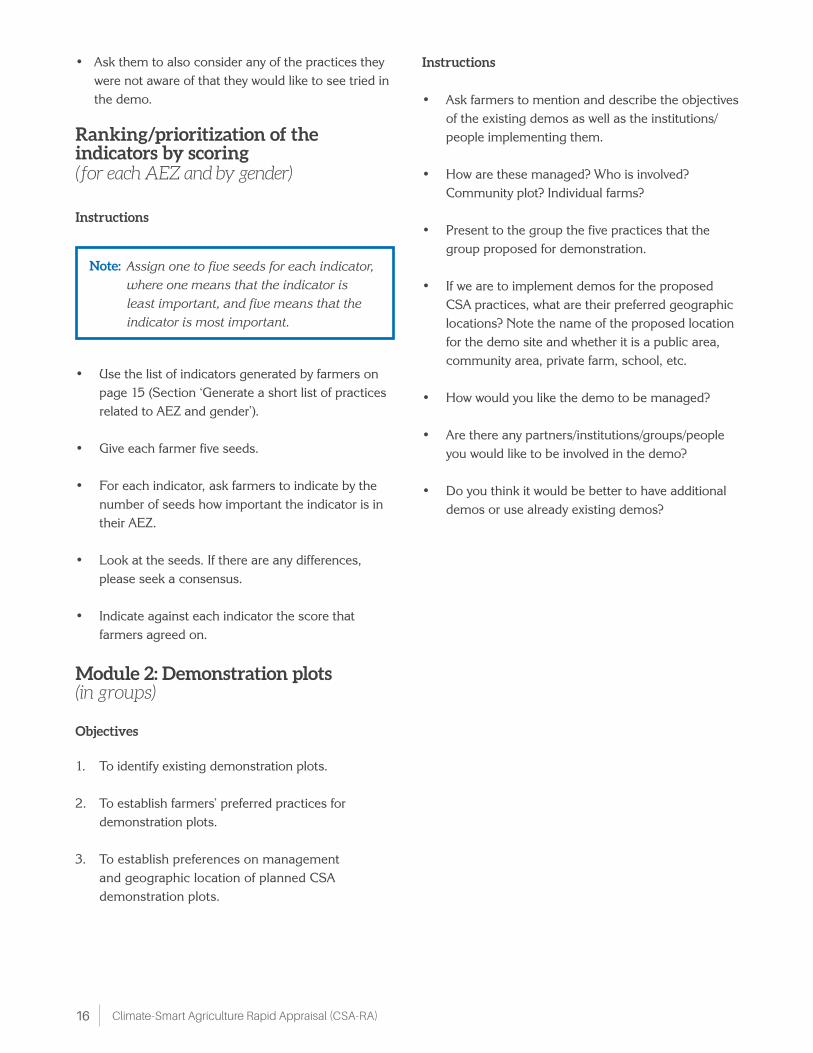
• Ask them to also consider any of the practices they were not aware of that they would like to see tried in the demo.
Ranking/prioritization of the indicators by scoring (for each AEZ and by gender)
Instructions
Instructions
• Ask farmers to mention and describe the objectives of the existing demos as well as the institutions/people implementing them.
• How are these managed? Who is involved? Community plot? Individual farms?
• Present to the group the five practices that the group proposed for demonstration.
• If we are to implement demos for the proposed CSA practices, what are their preferred geographic locations? Note the name of the proposed location for the demo site and whether it is a public area, community area, private farm, school, etc.
• How would you like the demo to be managed?
• Are there any partners/institutions/groups/people you would like to be involved in the demo?
• Do you think it would be better to have additional demos or use already existing demos?
• Use the list of indicators generated by farmers on page 15 (Section ‘Generate a short list of practices related to AEZ and gender’).
• Give each farmer five seeds.
• For each indicator, ask farmers to indicate by the number of seeds how important the indicator is in their AEZ.
• Look at the seeds. If there are any differences, please seek a consensus.
• Indicate against each indicator the score that farmers agreed on.
Module 2: Demonstration plots (in groups)
Objectives
1. To identify existing demonstration plots.
2. To establish farmers’ preferred practices for demonstration plots.
3. To establish preferences on management and geographic location of planned CSA demonstration plots.
Note: Assign one to five seeds for each indicator, where one means that the indicator is least important, and five means that the indicator is most important.
17A Prioritization Tool for Outscaling CSA
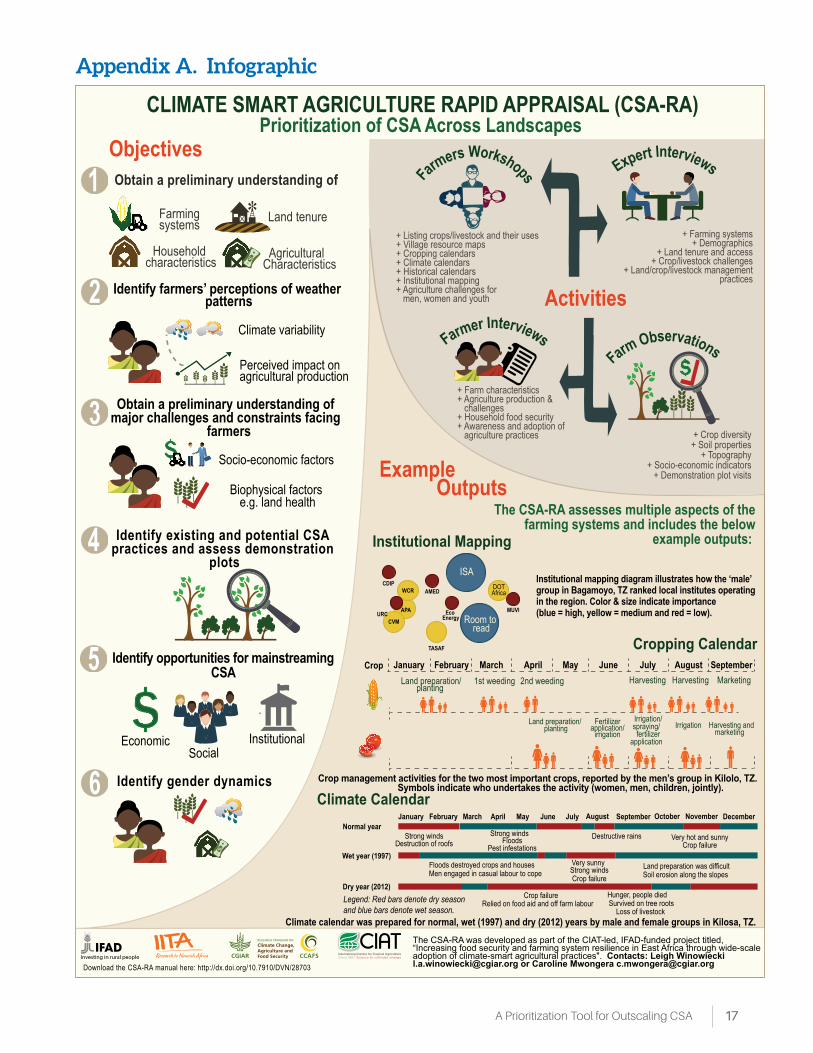
Appendix A. Infographic
Legend: Red bars denote dry season and blue bars denote wet season.
Objectives
CLIMATE SMART AGRICULTURE RAPID APPRAISAL (CSA-RA)Prioritization of CSA Across Landscapes
Obtain a preliminary understanding of
Identify existing and potential CSA practices and assess demonstration
plots
Identify farmers’ perceptions of weather patterns
Farmingsystems
Household characteristics
Land tenure
Climate variability
SocialEconomic
Socio-economic factors
Biophysical factors e.g. land health
Perceived impact on agricultural production
Agricultural Characteristics
Obtain a preliminary understanding of major challenges and constraints facing
farmers
Identify opportunities for mainstreaming CSA
Institutional mapping diagram illustrates how the ‘male’ group in Bagamoyo, TZ ranked local institutes operatingin the region. Color & size indicate importance(blue = high, yellow = medium and red = low).
Identify gender dynamics
Download the CSA-RA manual here:
Institutional
1
2
3
4
5
6
Activities
Example
The CSA-RA assesses multiple aspects of the farming systems and includes the below
example outputs:
Institutional Mapping
Cropping Calendar
Climate Calendar
Farmers Workshops Expert Interviews
Farmer InterviewsFarm Observations
+ Listing crops/livestock and their uses + Village resource maps+ Cropping calendars + Climate calendars+ Historical calendars + Institutional mapping+ Agriculture challenges for men, women and youth
+ Farming systems+ Demographics
+ Land tenure and access+ Crop/livestock challenges
+ Land/crop/livestock management practices
+ Farm characteristics+ Agriculture production & challenges+ Household food security+ Awareness and adoption of agriculture practices
+ Crop diversity+ Soil properties
+ Topography + Socio-economic indicators
+ Demonstration plot visits
January
Very sunnyStrong windsCrop failure
Hunger, people died Survived on tree roots
Loss of livestock
Land preparation was difficultSoil erosion along the slopes
Floods destroyed crops and houses
Crop failureRelied on food aid and off farm labour
Climate calendar was prepared for normal, wet (1997) and dry (2012) years by male and female groups in Kilosa, TZ.
Men engaged in casual labour to cope
Strong winds Strong winds Floods
Pest infestationsDestructive rains Very hot and sunny
Crop failureDestruction of roofs
Normal year
Wet year (1997)
Dry year (2012)
February March April May June July August September October November December
ISA
Room to read
DOTAfrica
MUVIEco Energy
AMED
URC
CDIP
TASAF
CVM
APA
WCR
Crop management activities for the two most important crops, reported by the men’s group in Kilolo, TZ. Symbols indicate who undertakes the activity (women, men, children, jointly).
JanuaryCrop FebruaryLand preparation/
planting 1st weeding 2nd weeding
Land preparation/ planting
Fertilizer application/
irrigation
Irrigation/spraying/
fertilizerapplication
Irrigation Harvesting andmarketing
March April May June July August SeptemberHarvesting Harvesting Marketing
Outputs
The CSA-RA was developed as part of the CIAT-led, IFAD-funded project titled, “Increasing food security and farming system resilience in East Africa through wide-scale adoption of climate-smart agricultural practices". Contacts: Leigh [email protected] or Caroline Mwongera [email protected]://dx.doi.org/10.7910/DVN/28703
Climate-Smart Agriculture Rapid Appraisal (CSA-RA)18
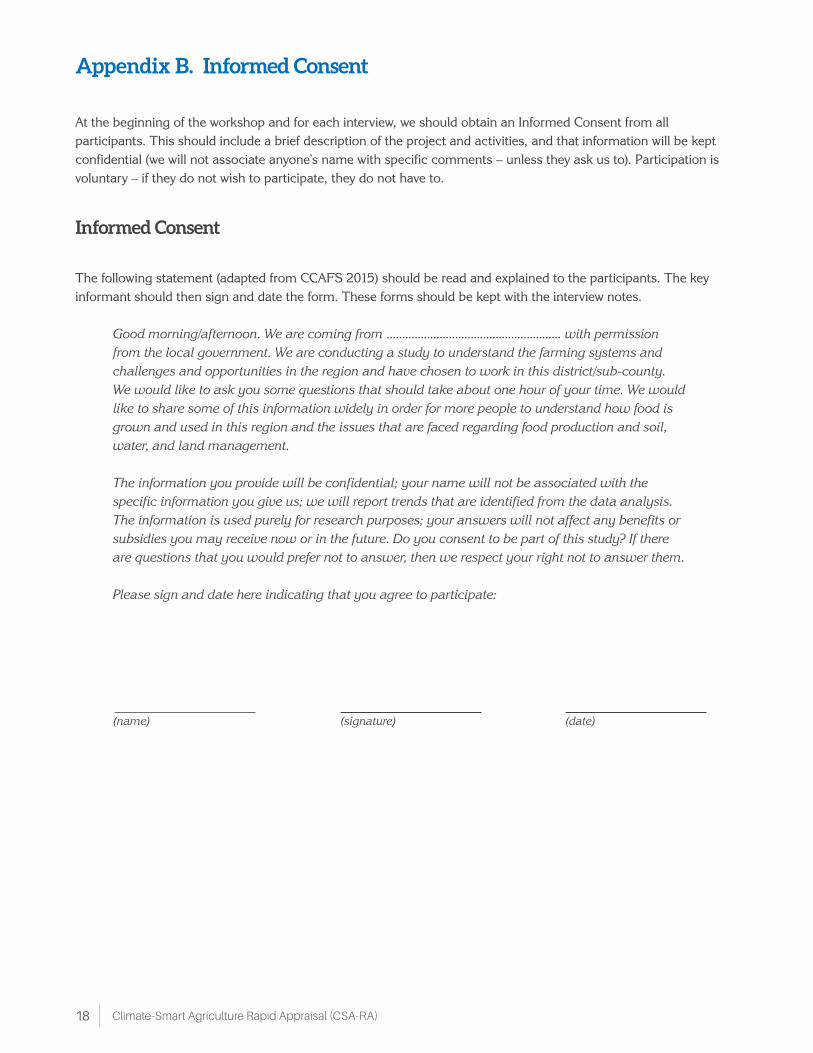
At the beginning of the workshop and for each interview, we should obtain an Informed Consent from all participants. This should include a brief description of the project and activities, and that information will be kept confidential (we will not associate anyone’s name with specific comments – unless they ask us to). Participation is voluntary – if they do not wish to participate, they do not have to.
The following statement (adapted from CCAFS 2015) should be read and explained to the participants. The key informant should then sign and date the form. These forms should be kept with the interview notes.
Good morning/afternoon. We are coming from ........................................................ with permission from the local government. We are conducting a study to understand the farming systems and challenges and opportunities in the region and have chosen to work in this district/sub-county. We would like to ask you some questions that should take about one hour of your time. We would like to share some of this information widely in order for more people to understand how food is grown and used in this region and the issues that are faced regarding food production and soil, water, and land management.
The information you provide will be confidential; your name will not be associated with the specific information you give us; we will report trends that are identified from the data analysis. The information is used purely for research purposes; your answers will not affect any benefits or subsidies you may receive now or in the future. Do you consent to be part of this study? If there are questions that you would prefer not to answer, then we respect your right not to answer them.
Please sign and date here indicating that you agree to participate:
Informed Consent
(name) (signature) (date)
Appendix B. Informed Consent
19A Prioritization Tool for Outscaling CSA
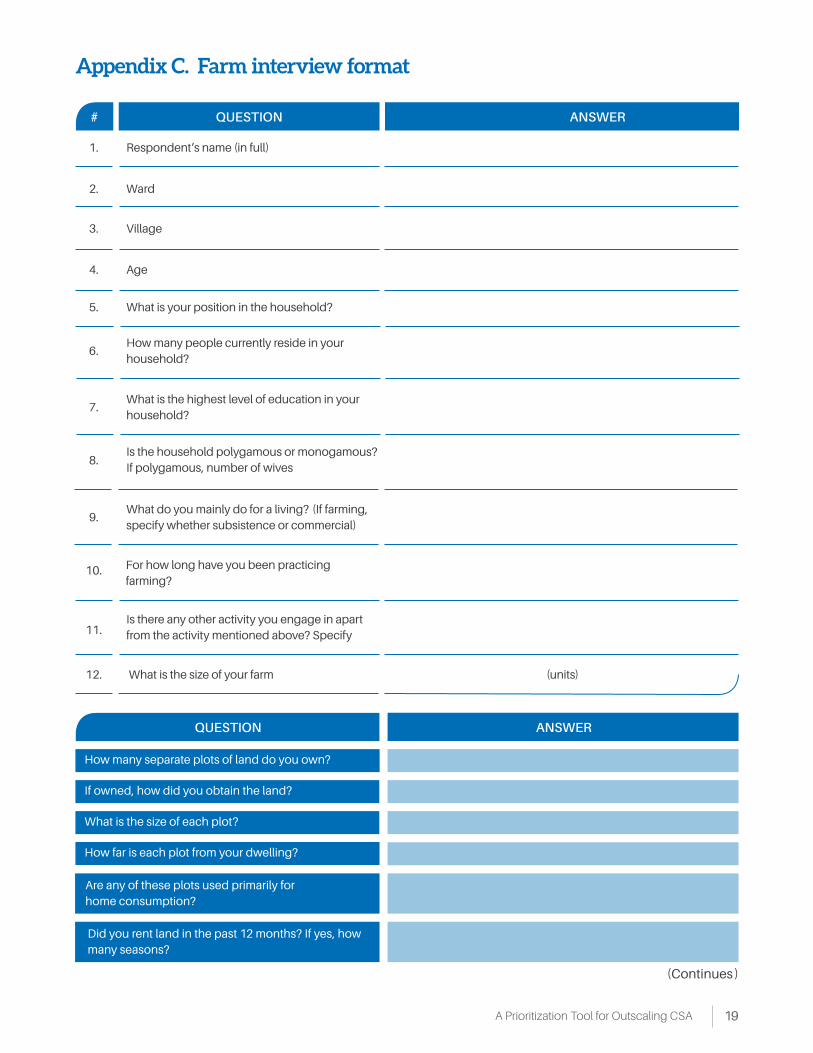
Appendix C. Farm interview format
# QUESTION ANSWER
1.
2.
6.
11.
5.
10.
3.
7.
12.
4.
9.
8.
Respondent’s name (in full)
Ward
How many people currently reside in your household?
What is your position in the household?
Village
What is the highest level of education in your household?
Age
Is the household polygamous or monogamous? If polygamous, number of wives
What do you mainly do for a living? (If farming, specify whether subsistence or commercial)
Is there any other activity you engage in apart from the activity mentioned above? Specify
What is the size of your farm
For how long have you been practicing farming?
QUESTION ANSWER
How many separate plots of land do you own?
Are any of these plots used primarily for home consumption?
Did you rent land in the past 12 months? If yes, how many seasons?
What is the size of each plot?
If owned, how did you obtain the land?
How far is each plot from your dwelling?
(units)
(Continues )
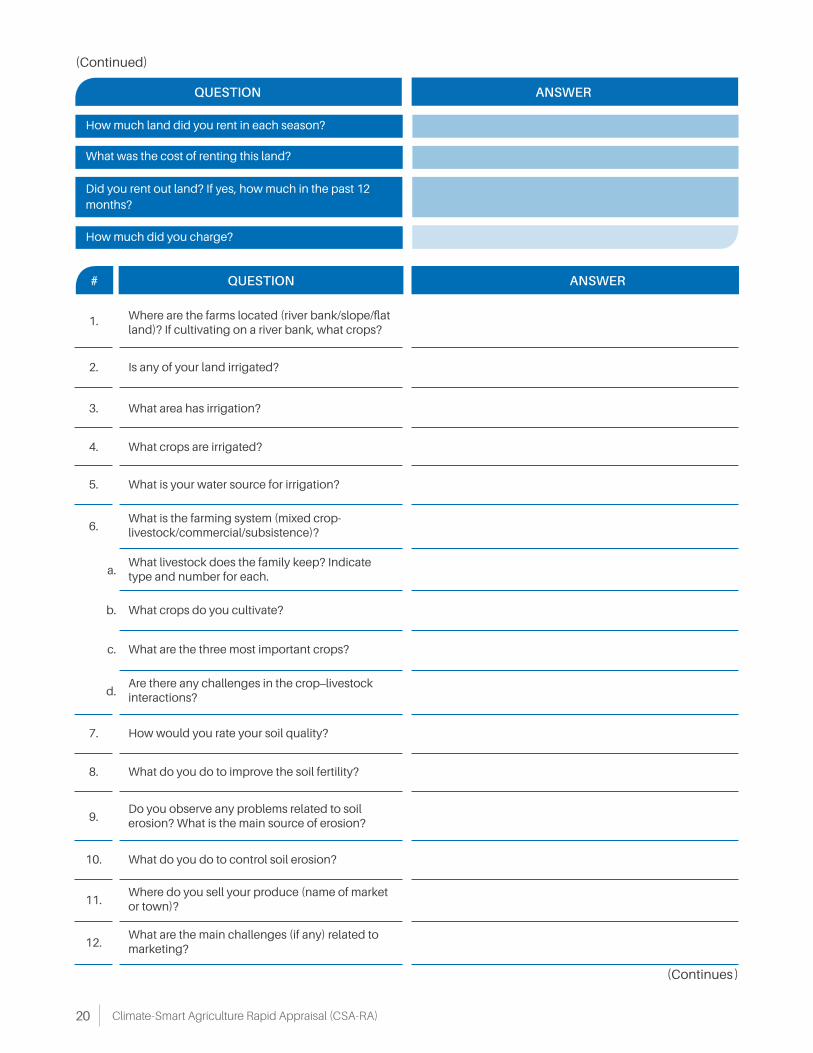
Climate-Smart Agriculture Rapid Appraisal (CSA-RA)20
How much land did you rent in each season?
What was the cost of renting this land?
How much did you charge?
Did you rent out land? If yes, how much in the past 12 months?
# QUESTION ANSWER
1.
2.
6.
a.
5.
3.
4.
Where are the farms located (river bank/slope/flat land)? If cultivating on a river bank, what crops?
Is any of your land irrigated?
What is the farming system (mixed crop-livestock/commercial/subsistence)?
What livestock does the family keep? Indicate type and number for each.
What is your water source for irrigation?
What area has irrigation?
What crops are irrigated?
b. What crops do you cultivate?
c. What are the three most important crops?
d.Are there any challenges in the crop–livestock interactions?
7. How would you rate your soil quality?
8. What do you do to improve the soil fertility?
9.Do you observe any problems related to soil erosion? What is the main source of erosion?
10. What do you do to control soil erosion?
Where do you sell your produce (name of market or town)?11.
What are the main challenges (if any) related to marketing?12.
(Continues )
QUESTION ANSWER
(Continued)
21A Prioritization Tool for Outscaling CSA
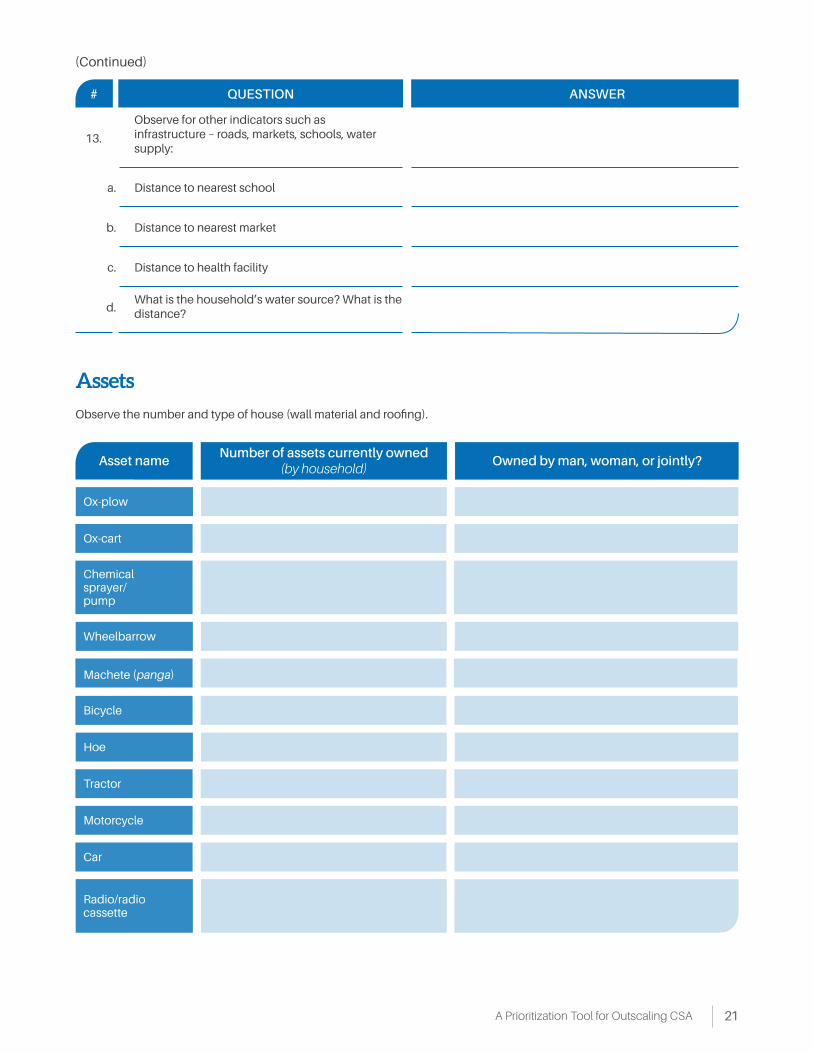
13.
a.
Observe for other indicators such as infrastructure – roads, markets, schools, water supply:
Distance to nearest school
b. Distance to nearest market
c. Distance to health facility
d.What is the household’s water source? What is the distance?
(Continued)
Assets
Asset nameNumber of assets currently owned
(by household)Owned by man, woman, or jointly?
Ox-plow
Ox-cart
Wheelbarrow
Bicycle
Hoe
Tractor
Motorcycle
Car
Chemicalsprayer/ pump
Machete (panga)
Radio/radio cassette
# QUESTION ANSWER
Observe the number and type of house (wall material and roofing).
Climate-Smart Agriculture Rapid Appraisal (CSA-RA)22
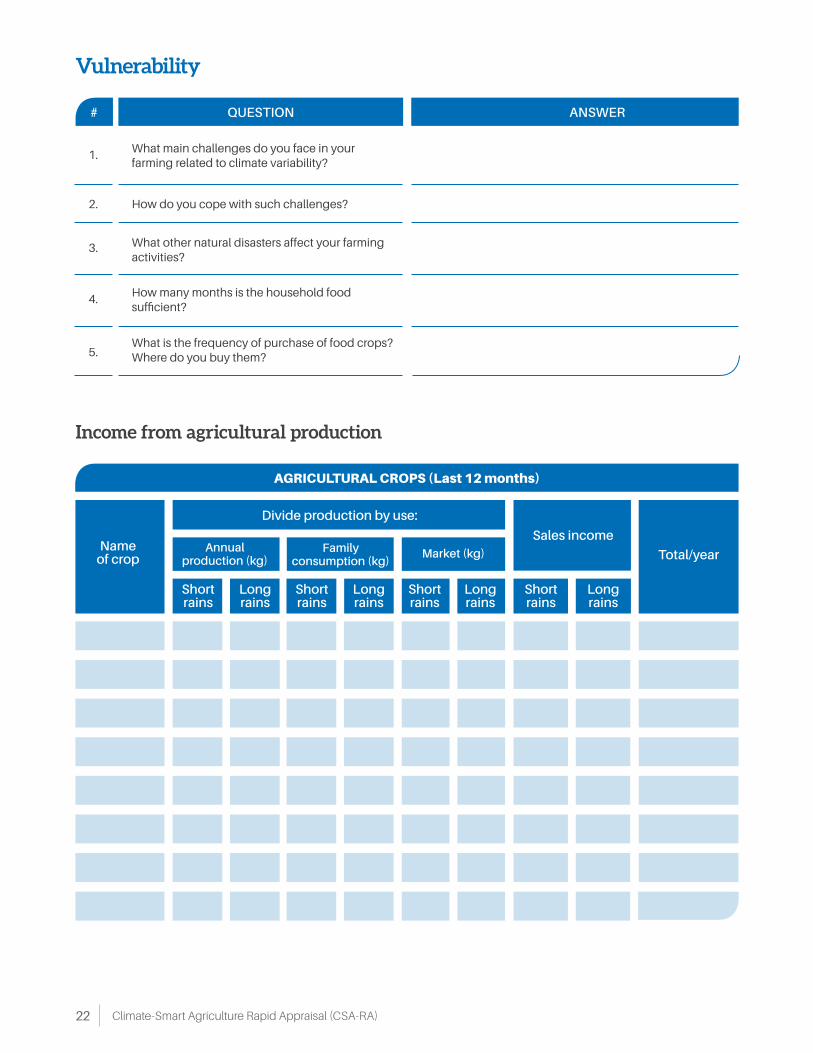
Vulnerability
# QUESTION ANSWER
1.
2.
5.
3.
4.
What main challenges do you face in your farming related to climate variability?
How do you cope with such challenges?
What is the frequency of purchase of food crops? Where do you buy them?
What other natural disasters affect your farming activities?
How many months is the household food sufficient?
AGRICULTURAL CROPS (Last 12 months)
Divide production by use:
Sales income
Total/year
Short rains
Long rains
Short rains
Short rains
Short rains
Long rains
Long rains
Long rains
Market (kg)Family consumption (kg)
Annual production (kg)
Nameof crop
Income from agricultural production
23A Prioritization Tool for Outscaling CSA
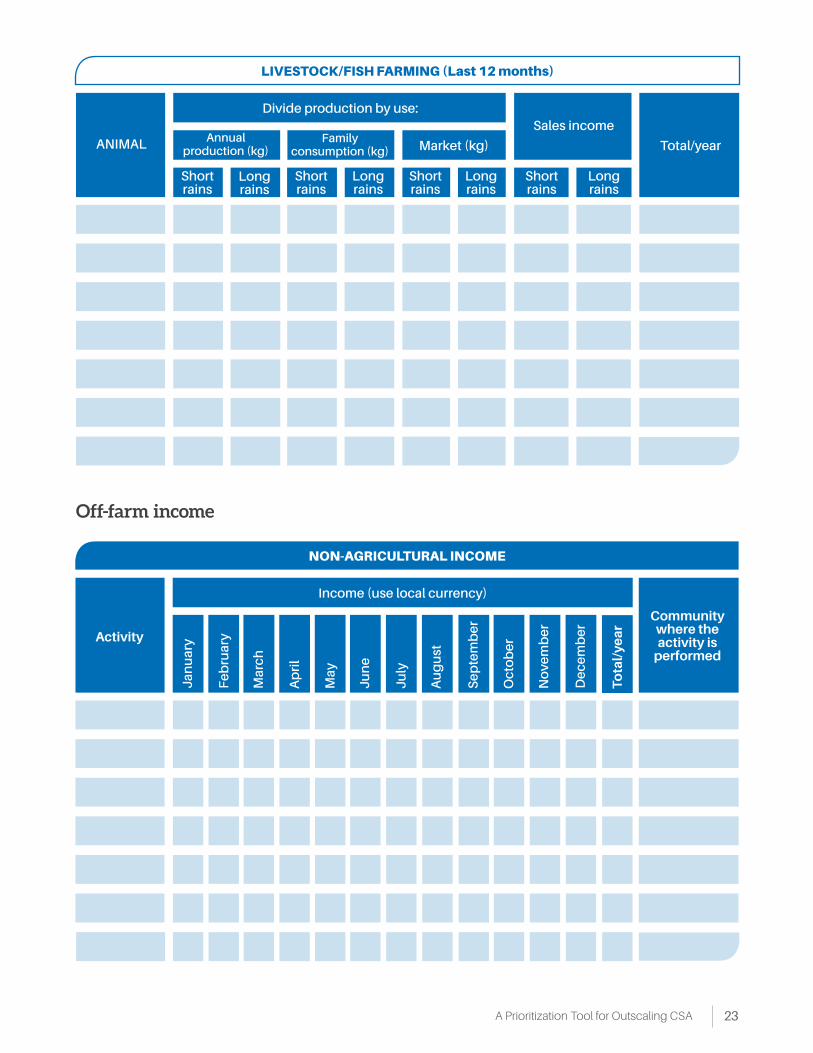
LIVESTOCK/FISH FARMING (Last 12 months)
NON-AGRICULTURAL INCOME
Divide production by use:
Income (use local currency)
Sales income
Total/year
Short rains
Jan
uar
y
Fe
bru
ary
Mar
ch
Ap
ril
Long rains
Short rains
Short rains
Short rains
Long rains
Long rains
Long rains
Market (kg)Family
consumption (kg)Annual
production (kg)ANIMAL
Activity
Community where the activity is
performed
Off-farm income
May
Ju
ne
Ju
ly
Au
gu
st
Se
pte
mb
er
Oct
ob
er
No
vem
be
r
De
cem
be
r
To
tal/
year
Climate-Smart Agriculture Rapid Appraisal (CSA-RA)24
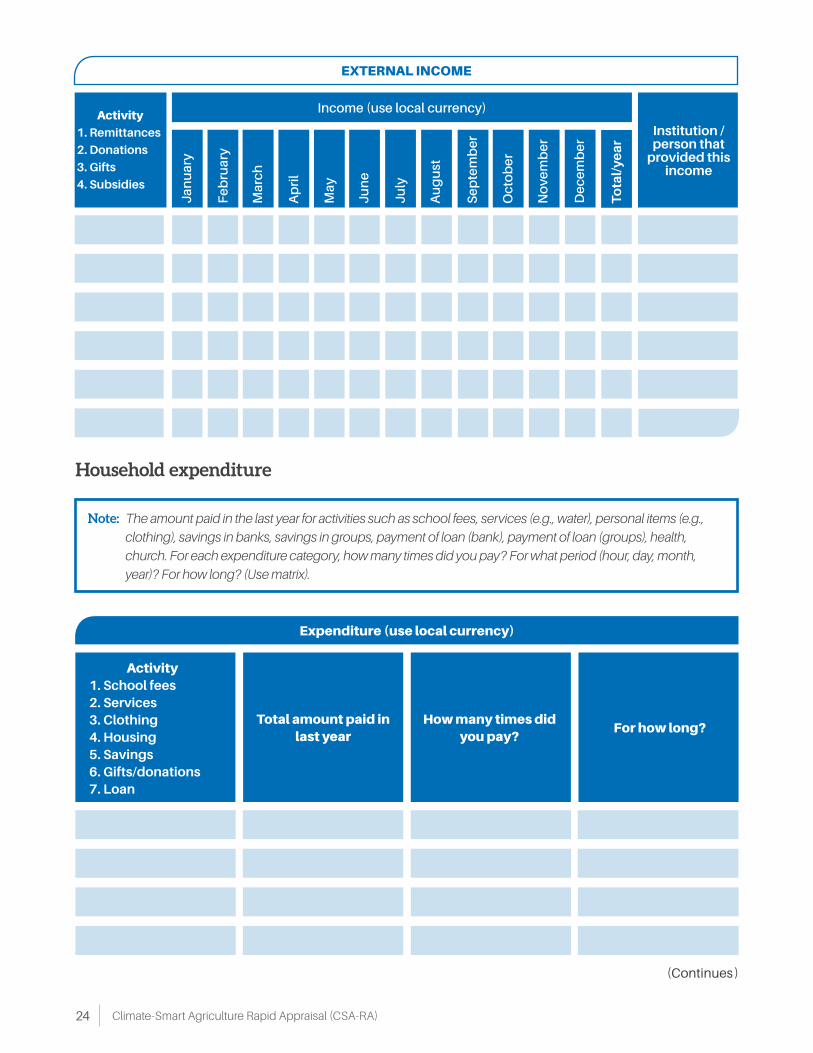
EXTERNAL INCOME
Expenditure (use local currency)
Income (use local currency)
Jan
uar
y
Fe
bru
ary
Mar
ch
Ap
ril
Activity
1. Remittances
2. Donations
3. Gifts
4. Subsidies
Institution / person that
provided this income
May
Ju
ne
Ju
ly
Au
gu
st
Se
pte
mb
er
Oct
ob
er
No
vem
be
r
De
cem
be
r
To
tal/
year
Household expenditure
Activity1. School fees2. Services3. Clothing4. Housing5. Savings6. Gifts/donations7. Loan
Total amount paid in last year
How many times did you pay?
For how long?
(Continues )
Note: The amount paid in the last year for activities such as school fees, services (e.g., water), personal items (e.g.,
clothing), savings in banks, savings in groups, payment of loan (bank), payment of loan (groups), health,
church. For each expenditure category, how many times did you pay? For what period (hour, day, month,
year)? For how long? (Use matrix).
25A Prioritization Tool for Outscaling CSA
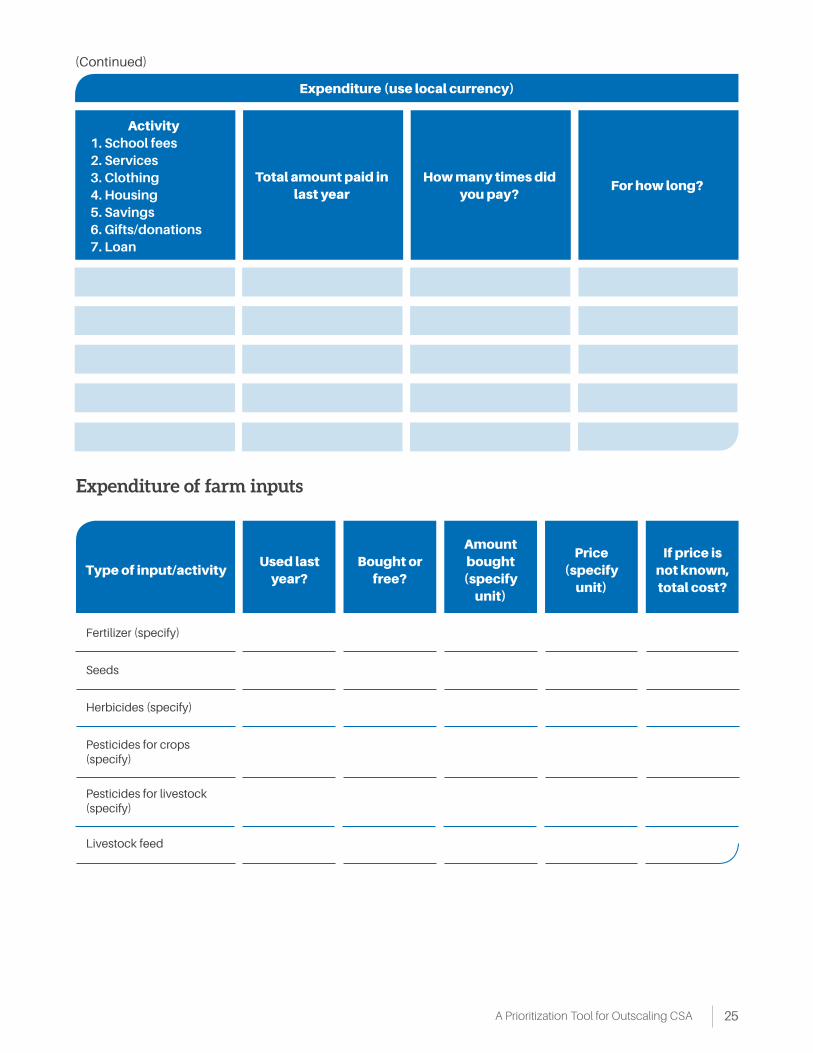
Expenditure (use local currency)
Activity1. School fees2. Services3. Clothing4. Housing5. Savings6. Gifts/donations7. Loan
Type of input/activity
Total amount paid in last year
Used last year?
Bought or free?
Amount bought
(specify unit)
Price (specify
unit)
If price is not known, total cost?
How many times did you pay?
For how long?
Fertilizer (specify)
Seeds
Herbicides (specify)
Livestock feed
Pesticides for crops (specify)
Pesticides for livestock (specify)
(Continued)
Expenditure of farm inputs
Climate-Smart Agriculture Rapid Appraisal (CSA-RA)26
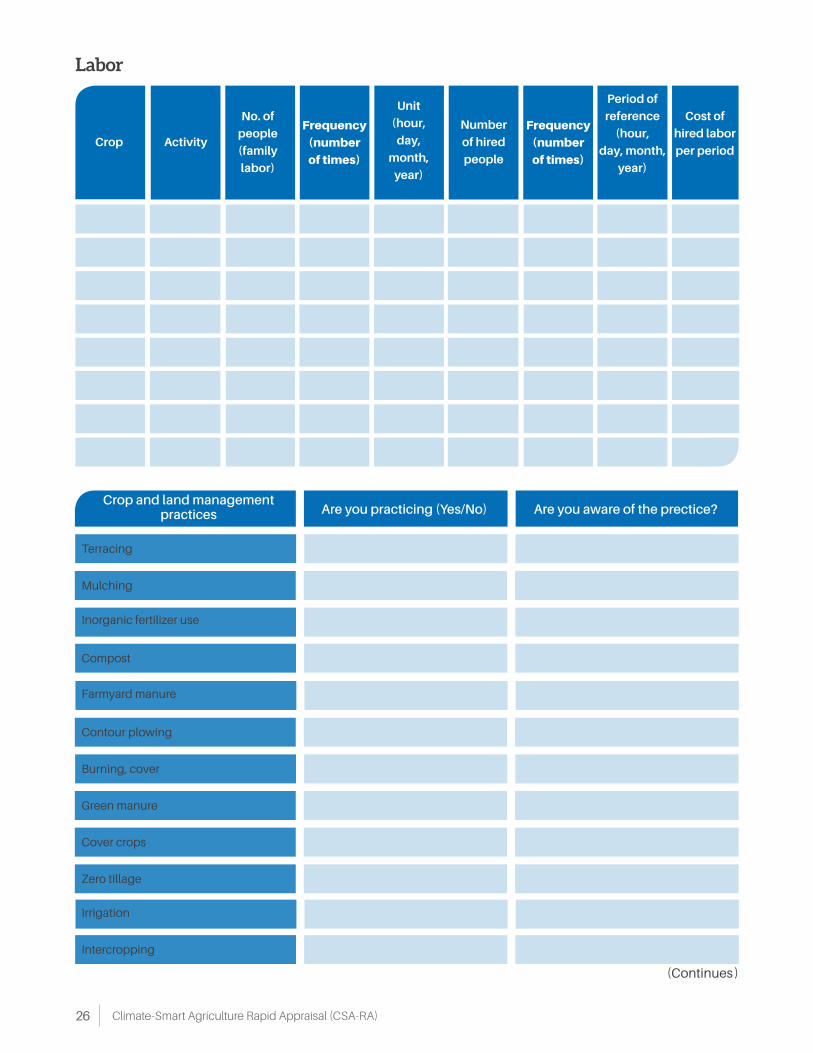
Labor
Crop Activity
No. of
people
(family
labor)
Frequency
(number
of times)
Unit
(hour,
day,
month,
year)
Number
of hired
people
Frequency
(number
of times)
Period of
reference
(hour,
day, month,
year)
Cost of
hired labor
per period
Crop and land management practices
Terracing
Mulching
Intercropping
Compost
Contour plowing
Burning, cover
Green manure
Cover crops
Zero tillage
Inorganic fertilizer use
Farmyard manure
Irrigation
Are you practicing (Yes/No) Are you aware of the prectice?
(Continues )
27A Prioritization Tool for Outscaling CSA
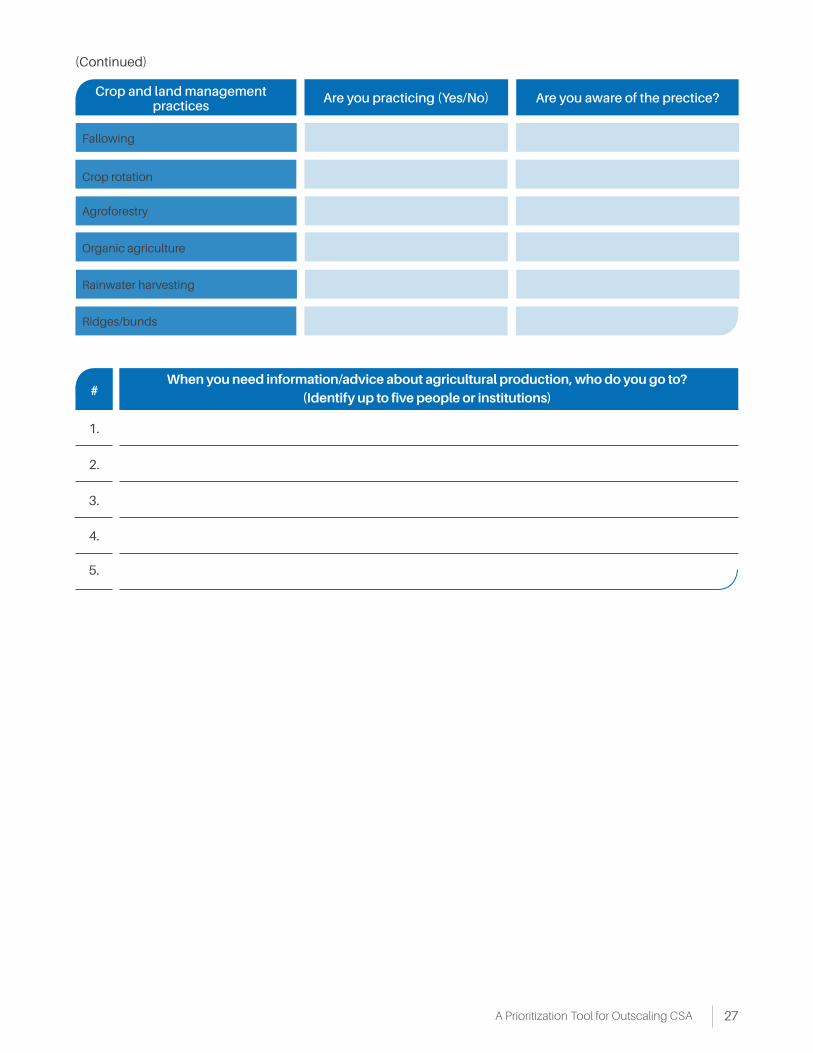
Crop and land management practices
Crop rotation
Organic agriculture
Rainwater harvesting
Ridges/bunds
Fallowing
Agroforestry
Are you practicing (Yes/No) Are you aware of the prectice?
(Continued)
When you need information/advice about agricultural production, who do you go to? (Identify up to five people or institutions)
1.
#
2.
3.
4.
5.
Climate-Smart Agriculture Rapid Appraisal (CSA-RA)28
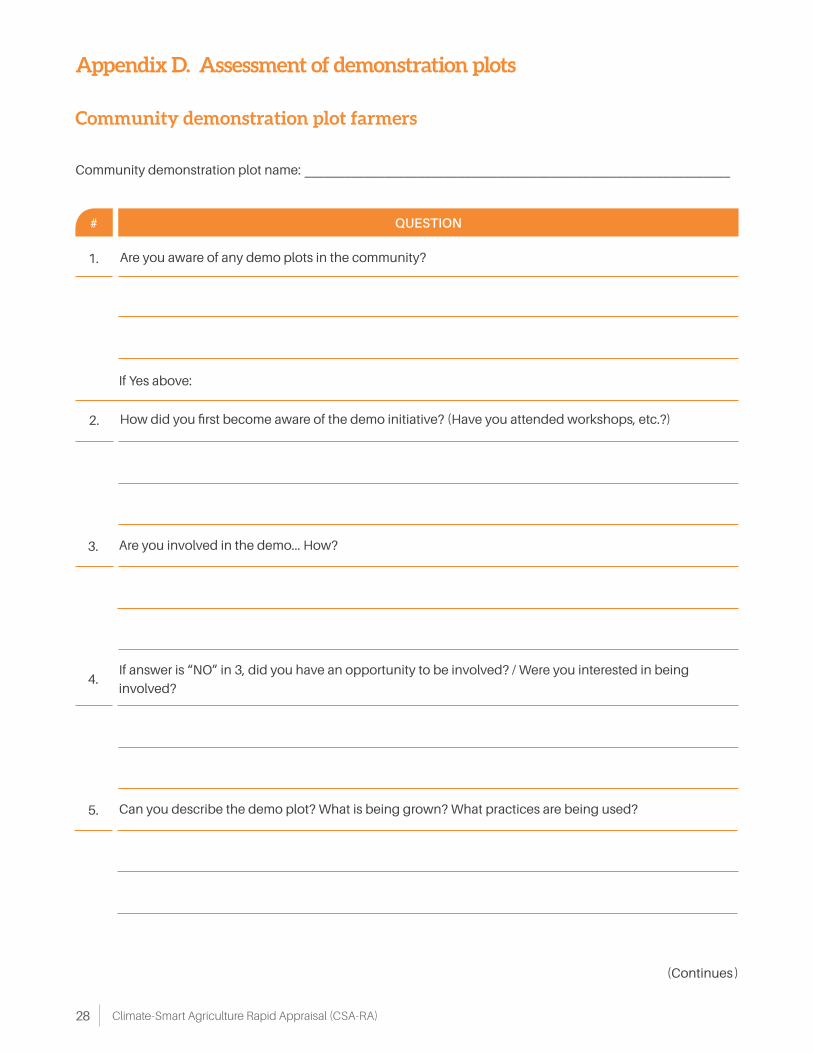
Community demonstration plot farmers
Community demonstration plot name: ________________________________________________________________
# QUESTION
1.
2.
3.
5.
4.
Are you aware of any demo plots in the community?
If Yes above:
How did you first become aware of the demo initiative? (Have you attended workshops, etc.?)
Are you involved in the demo... How?
Can you describe the demo plot? What is being grown? What practices are being used?
If answer is “NO” in 3, did you have an opportunity to be involved? / Were you interested in being
involved?
(Continues )
Appendix D. Assessment of demonstration plots
29A Prioritization Tool for Outscaling CSA
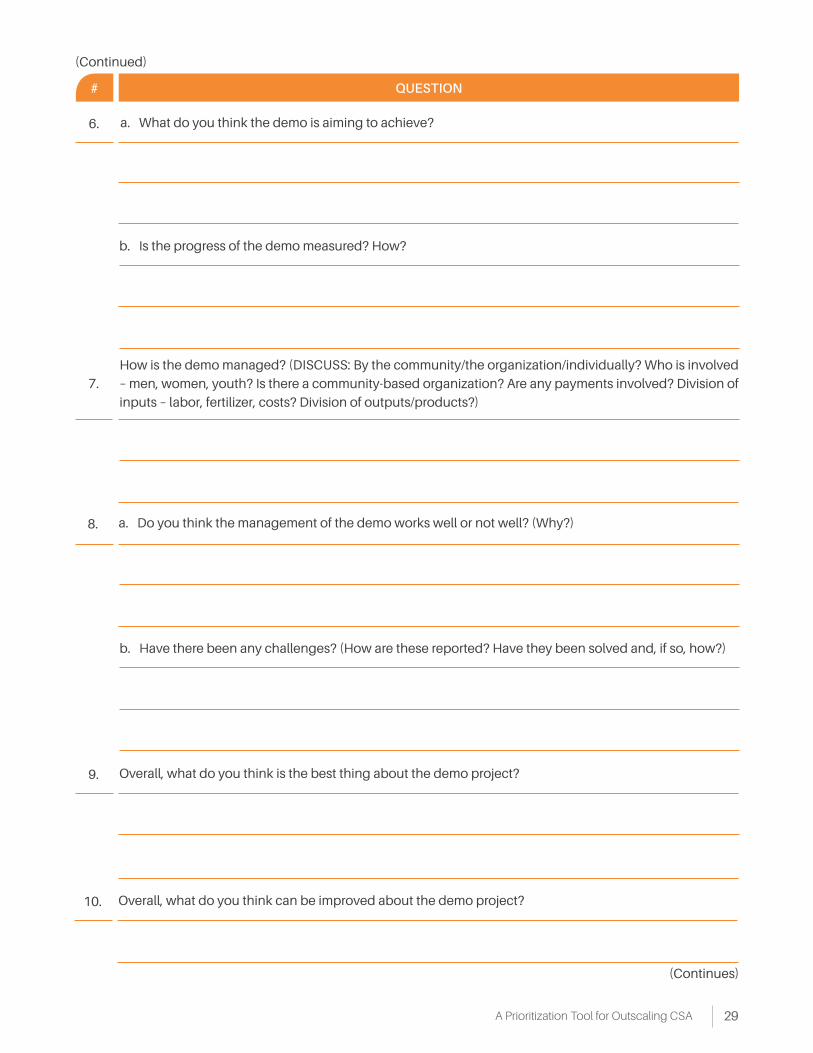
# QUESTION
6.
7.
8.
9.
10.
a. What do you think the demo is aiming to achieve?
b. Is the progress of the demo measured? How?
b. Have there been any challenges? (How are these reported? Have they been solved and, if so, how?)
How is the demo managed? (DISCUSS: By the community/the organization/individually? Who is involved
– men, women, youth? Is there a community-based organization? Are any payments involved? Division of
inputs – labor, fertilizer, costs? Division of outputs/products?)
a. Do you think the management of the demo works well or not well? (Why?)
Overall, what do you think is the best thing about the demo project?
Overall, what do you think can be improved about the demo project?
(Continues)
(Continued)
Climate-Smart Agriculture Rapid Appraisal (CSA-RA)30
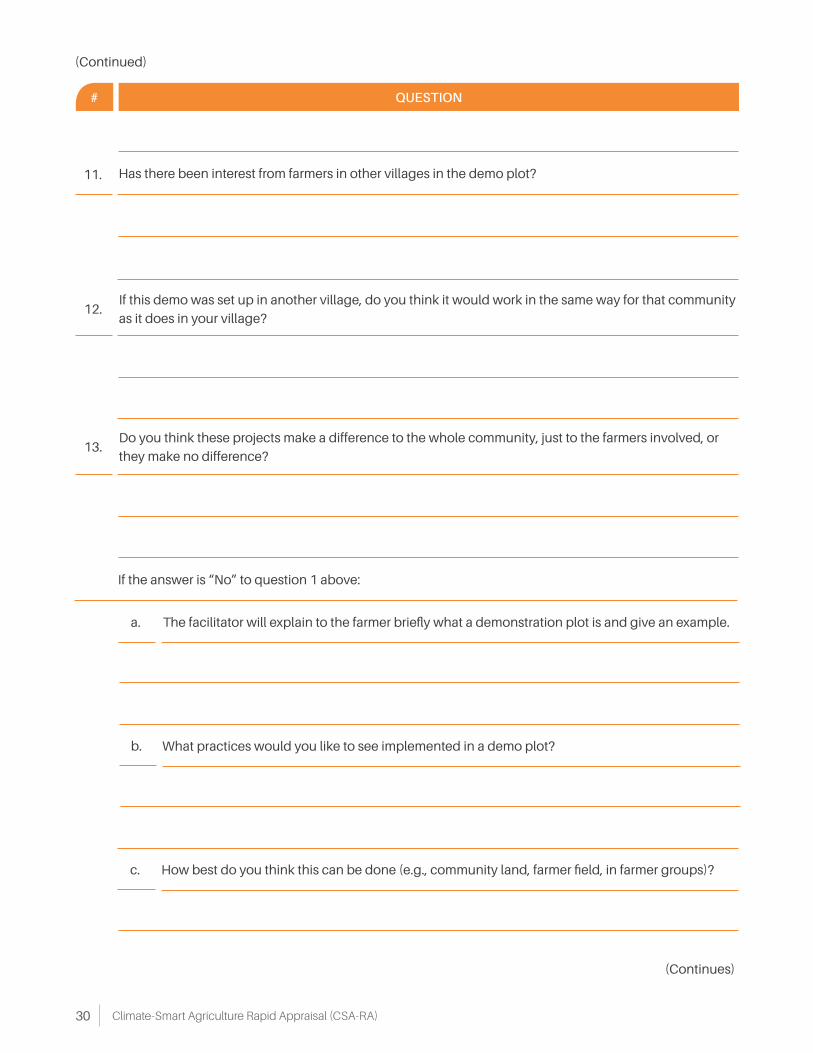
# QUESTION
(Continued)
11. Has there been interest from farmers in other villages in the demo plot?
12.
13.
If this demo was set up in another village, do you think it would work in the same way for that community
as it does in your village?
Do you think these projects make a difference to the whole community, just to the farmers involved, or
they make no difference?
If the answer is “No” to question 1 above:
a.
b.
c.
The facilitator will explain to the farmer briefly what a demonstration plot is and give an example.
What practices would you like to see implemented in a demo plot?
(Continues)
How best do you think this can be done (e.g., community land, farmer field, in farmer groups)?
31A Prioritization Tool for Outscaling CSA
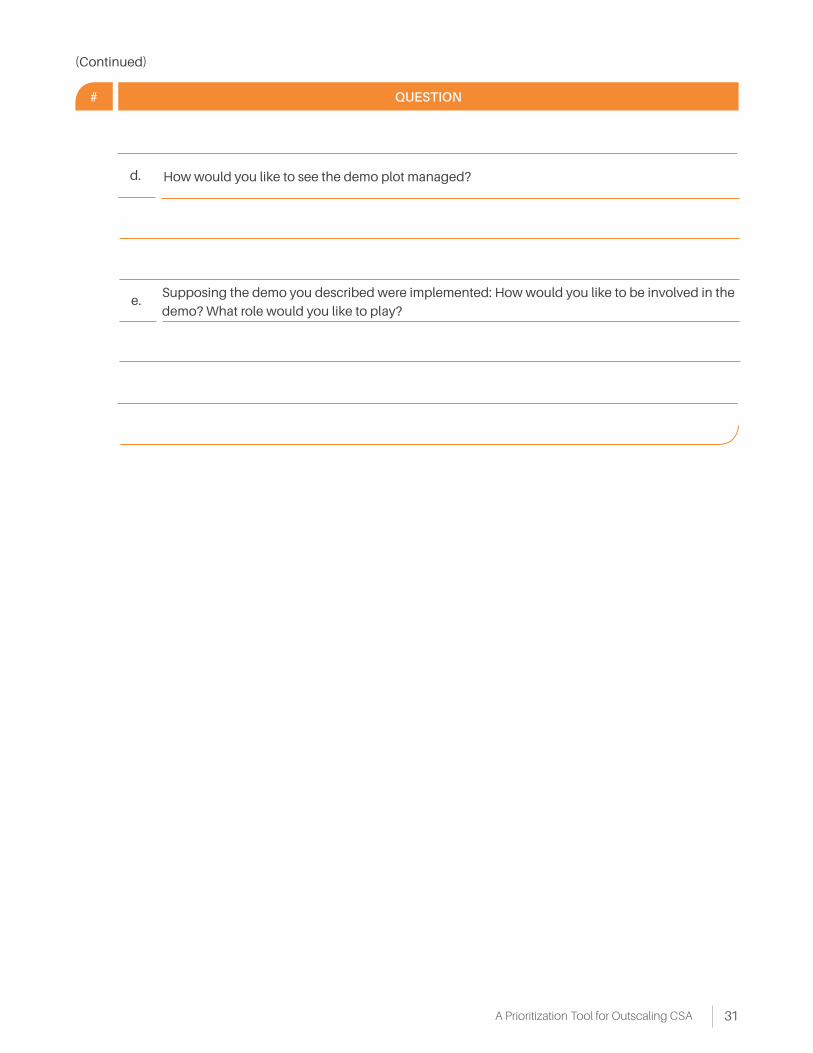
# QUESTION
d.
e.
How would you like to see the demo plot managed?
Supposing the demo you described were implemented: How would you like to be involved in the
demo? What role would you like to play?
(Continued)
Climate-Smart Agriculture Rapid Appraisal (CSA-RA)32
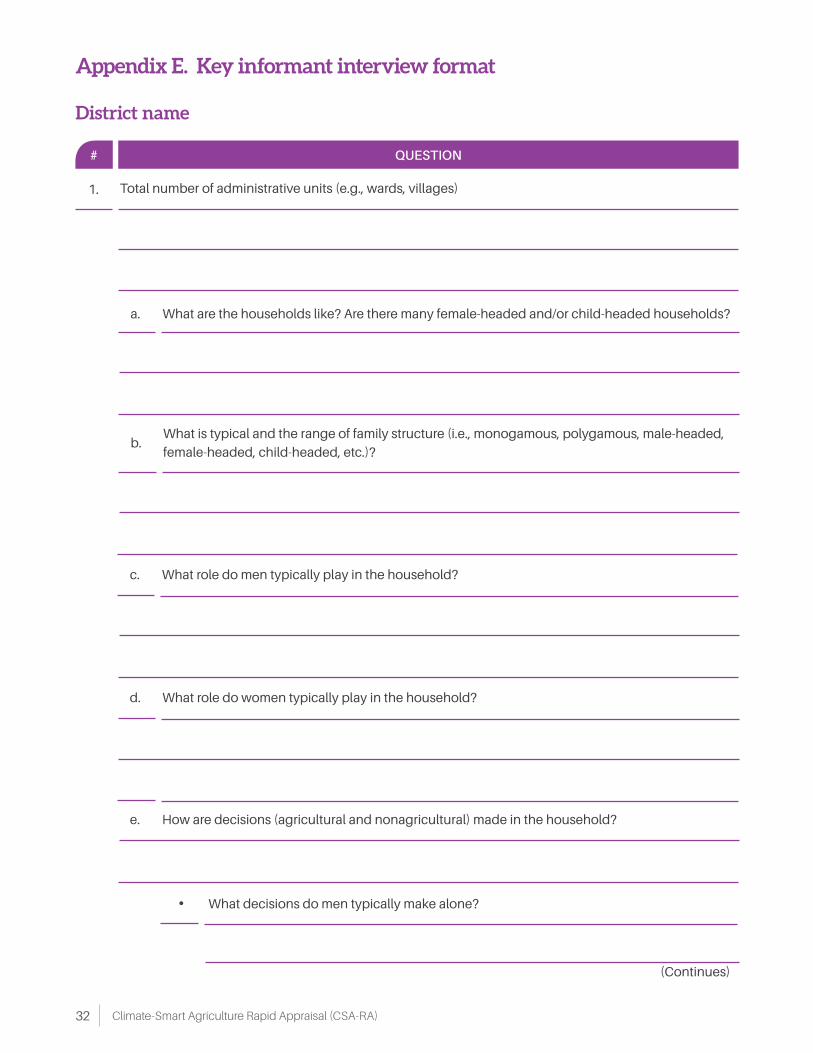
Appendix E. Key informant interview format
# QUESTION
1. Total number of administrative units (e.g., wards, villages)
District name
a.
d.
b.
c.
e.
•
What are the households like? Are there many female-headed and/or child-headed households?
What role do women typically play in the household?
What is typical and the range of family structure (i.e., monogamous, polygamous, male-headed,
female-headed, child-headed, etc.)?
What role do men typically play in the household?
How are decisions (agricultural and nonagricultural) made in the household?
What decisions do men typically make alone?
(Continues)
33A Prioritization Tool for Outscaling CSA
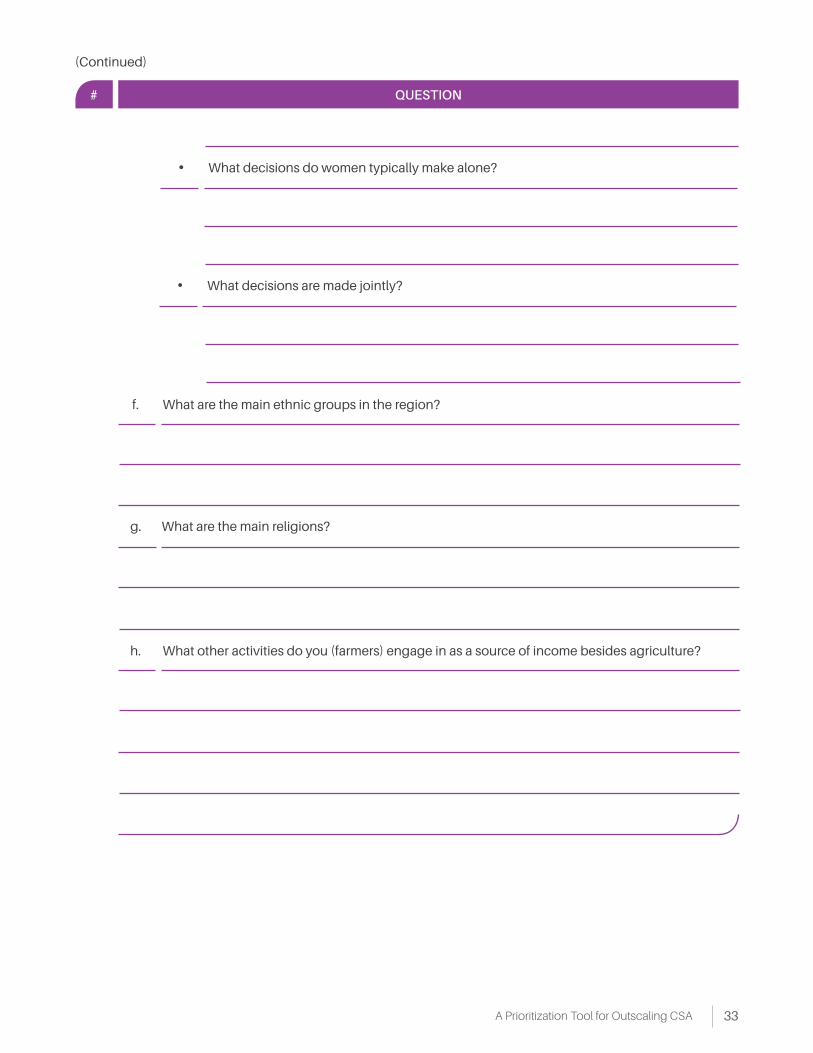
# QUESTION
f.
g.
h.
•
•
What are the main ethnic groups in the region?
What are the main religions?
What other activities do you (farmers) engage in as a source of income besides agriculture?
What decisions are made jointly?
What decisions do women typically make alone?
(Continued)
Climate-Smart Agriculture Rapid Appraisal (CSA-RA)34
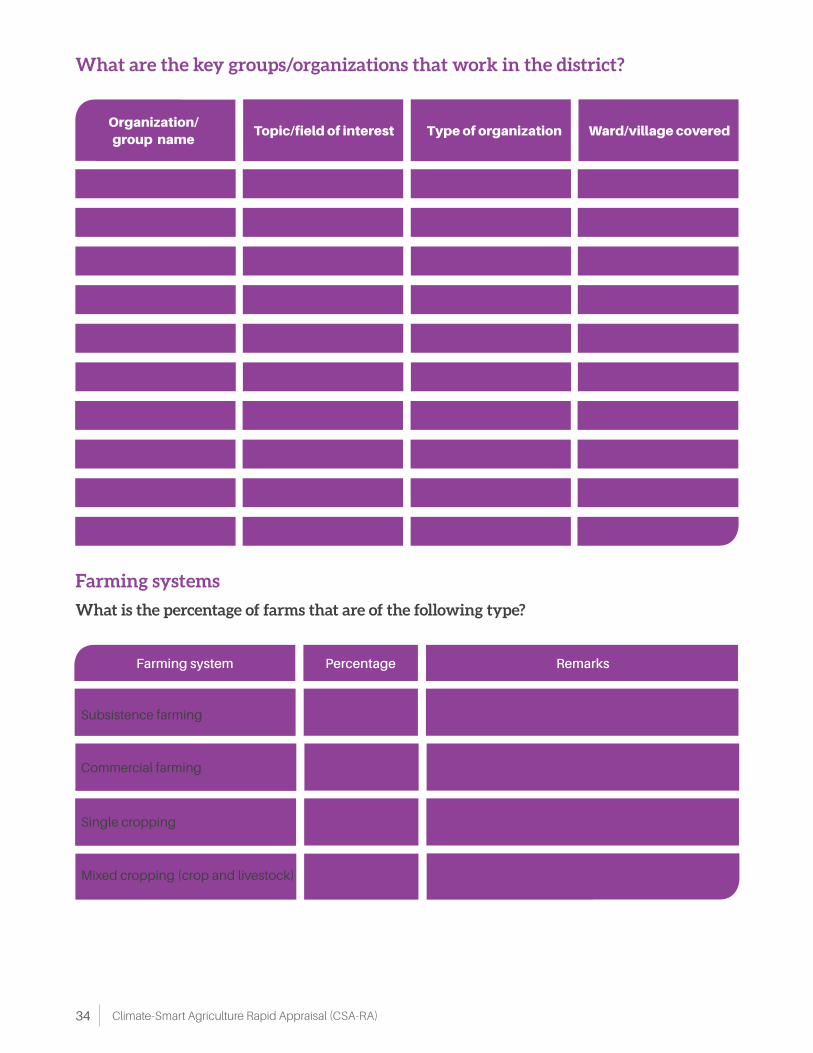
What are the key groups/organizations that work in the district?
Farming systems
Organization/group name
Topic/field of interest Type of organization Ward/village covered
Farming system
Subsistence farming
Commercial farming
Mixed cropping (crop and livestock)
Single cropping
Percentage Remarks
What is the percentage of farms that are of the following type?
35A Prioritization Tool for Outscaling CSA
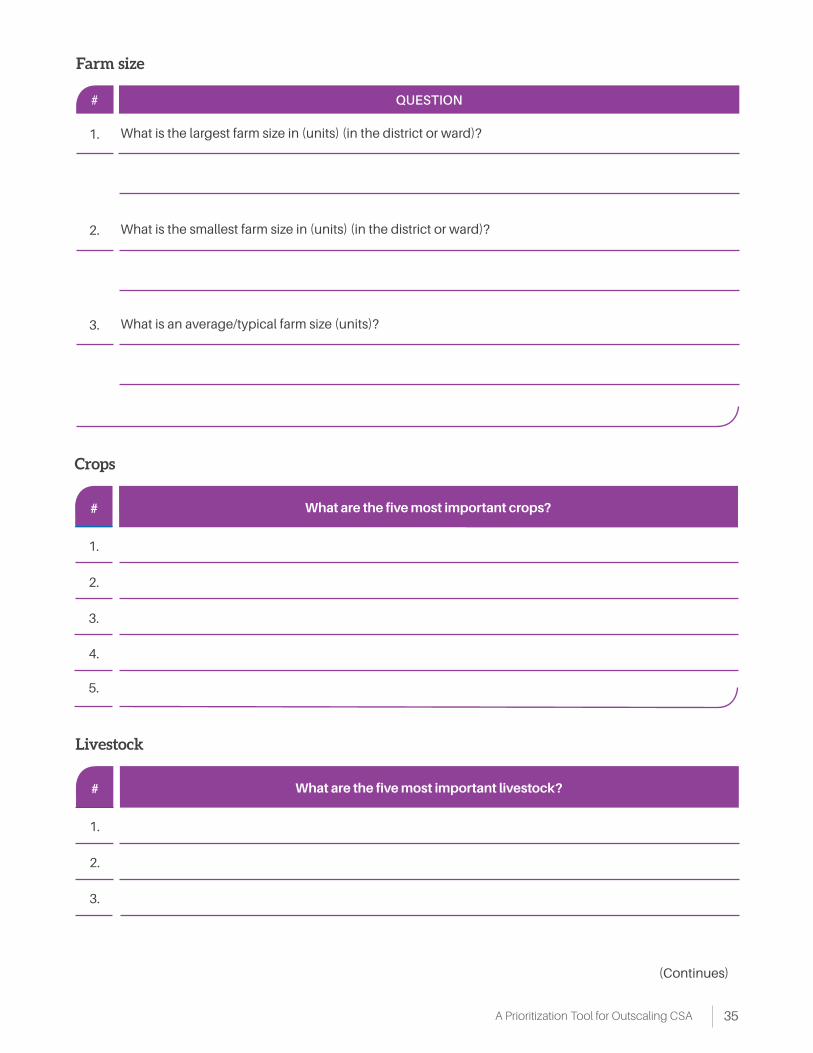
Crops
Livestock
Farm size
# QUESTION
1.
2.
3.
What is the largest farm size in (units) (in the district or ward)?
What is the smallest farm size in (units) (in the district or ward)?
What is an average/typical farm size (units)?
What are the five most important crops?
What are the five most important livestock?
1.
1.
#
#
2.
2.
3.
3.
4.
5.
(Continues)
Climate-Smart Agriculture Rapid Appraisal (CSA-RA)36
4.
5.
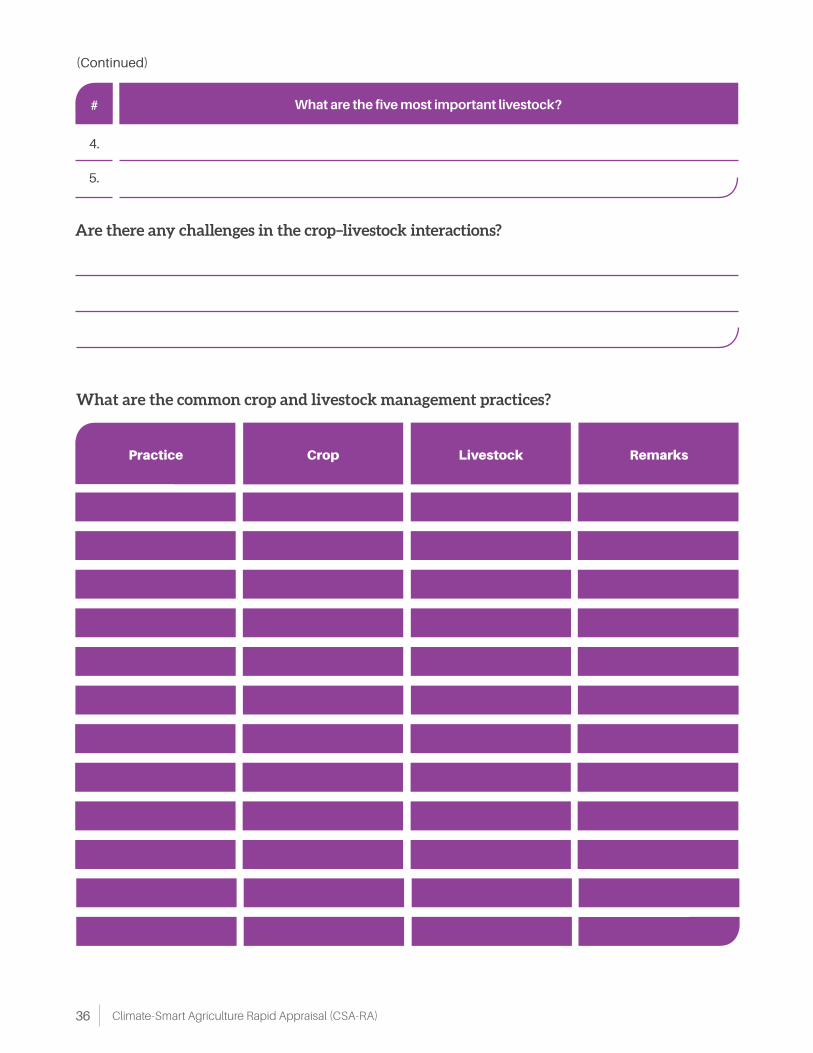
What are the five most important livestock?#
Are there any challenges in the crop–livestock interactions?
What are the common crop and livestock management practices?
Practice Crop Livestock Remarks
(Continued)
37A Prioritization Tool for Outscaling CSA
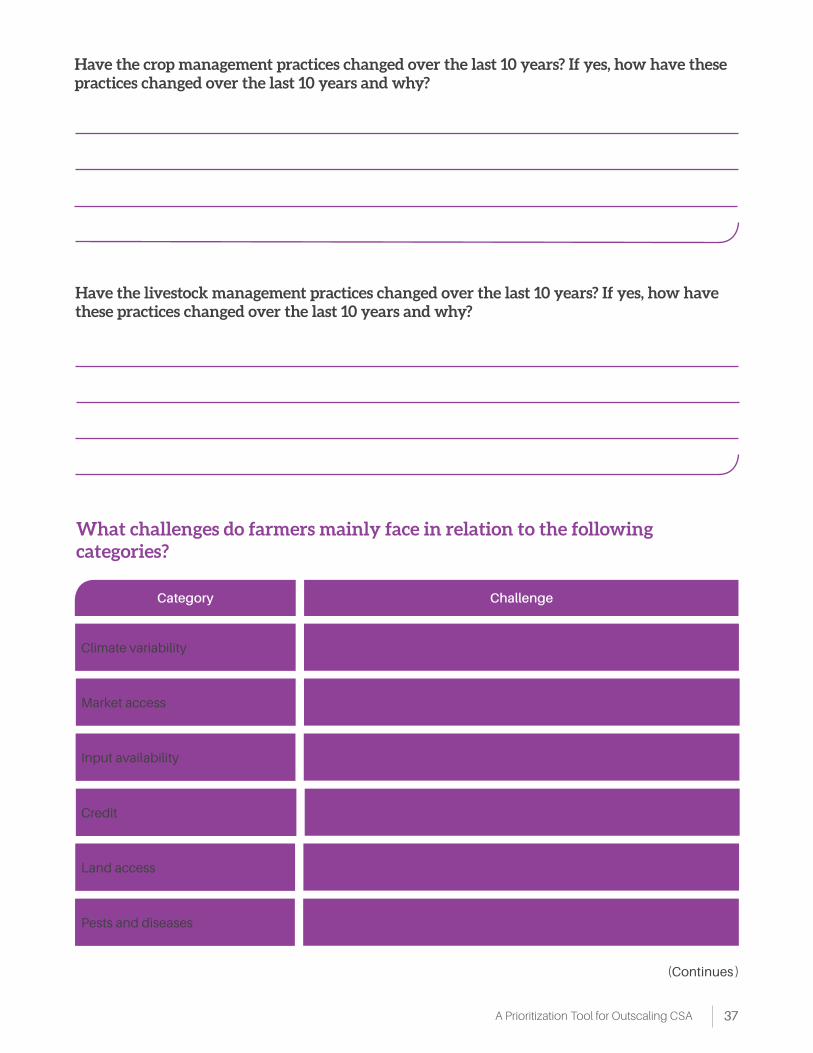
What challenges do farmers mainly face in relation to the following categories?
Have the crop management practices changed over the last 10 years? If yes, how have these practices changed over the last 10 years and why?
Have the livestock management practices changed over the last 10 years? If yes, how have these practices changed over the last 10 years and why?
Category
Climate variability
Market access
Credit
Pests and diseases
Input availability
Land access
Challenge
(Continues )
Climate-Smart Agriculture Rapid Appraisal (CSA-RA)38
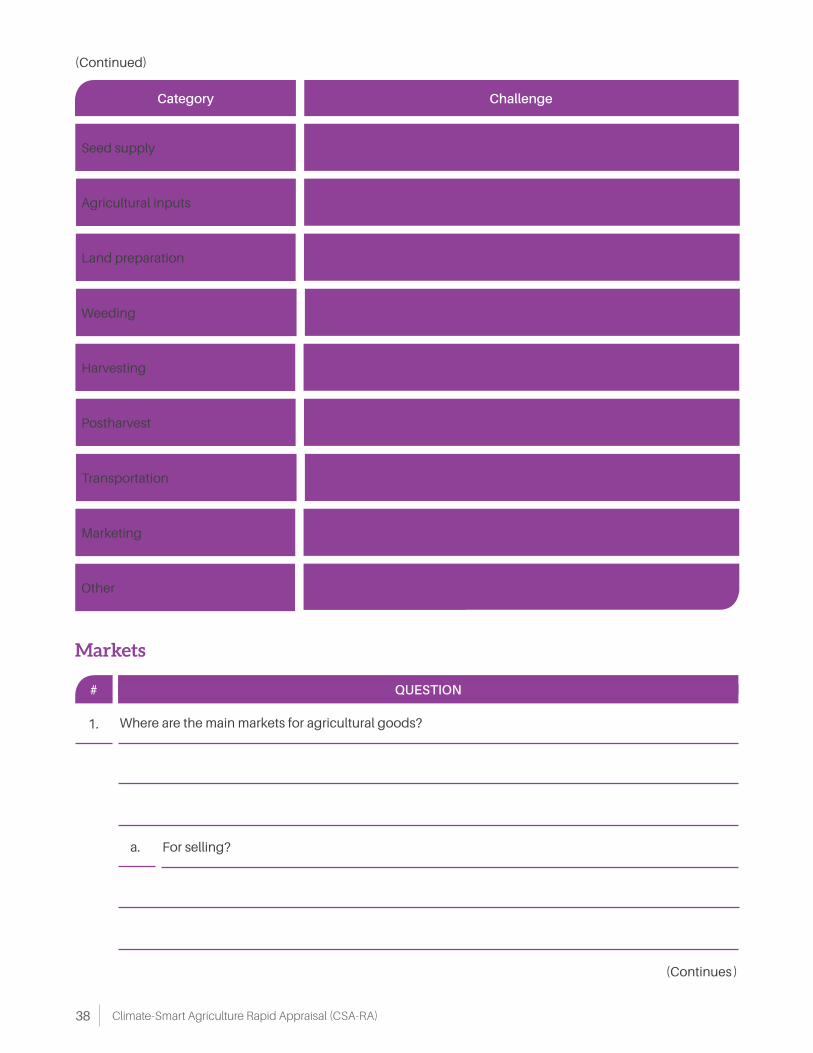
Category
Seed supply
Agricultural inputs
Weeding
Transportation
Postharvest
Other
Land preparation
Harvesting
Marketing
Challenge
Markets
# QUESTION
1. Where are the main markets for agricultural goods?
a. For selling?
(Continued)
(Continues )
39A Prioritization Tool for Outscaling CSA
# QUESTION
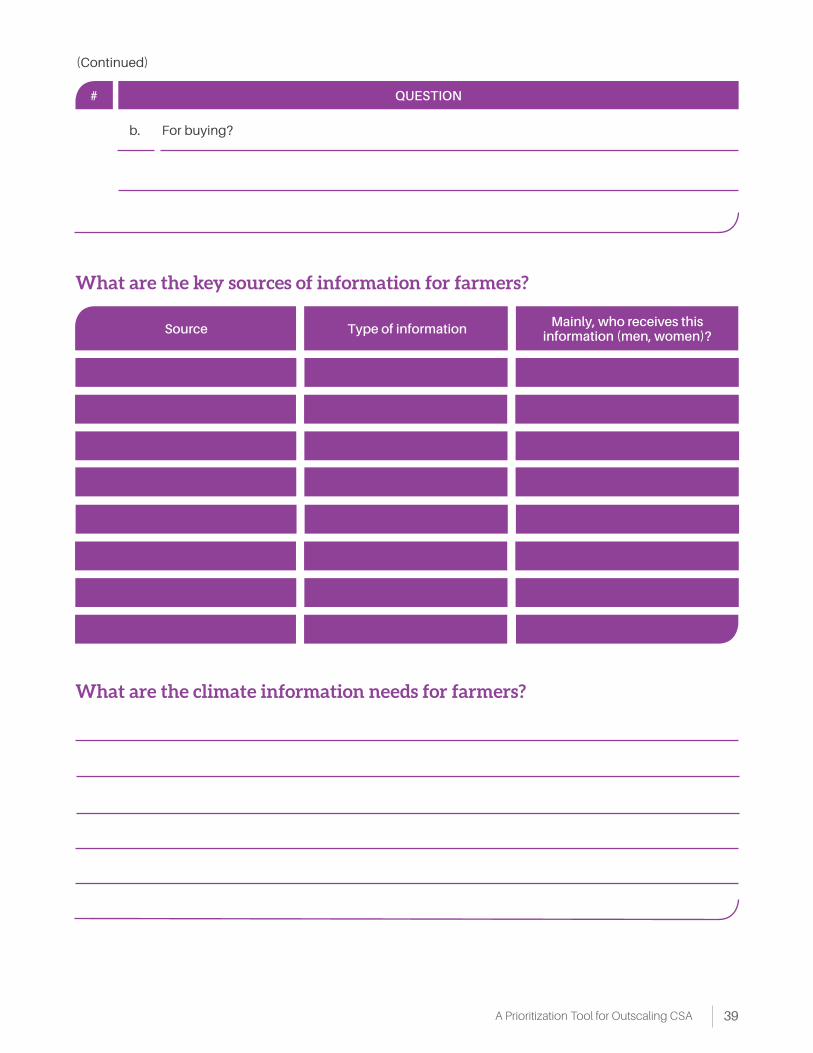
What are the key sources of information for farmers?
What are the climate information needs for farmers?
b. For buying?
Source Type of information Mainly, who receives this information (men, women)?
(Continued)

Climate-Smart Agriculture Rapid Appraisal (CSA-RA)40
# QUESTION
1.
2.
3.
5.
4.
6.
What is the land tenure system?
Land ownership
If land is not owned, how are access and use determined?
Who owns and who rents (e.g., the rich, etc.)?
Are there sharecropping systems?
Do both men and women own land?
a. If collective ownership, how is land divided?
Land tenure and property rights
(Continues)
41A Prioritization Tool for Outscaling CSA
#
#
QUESTION
QUESTION
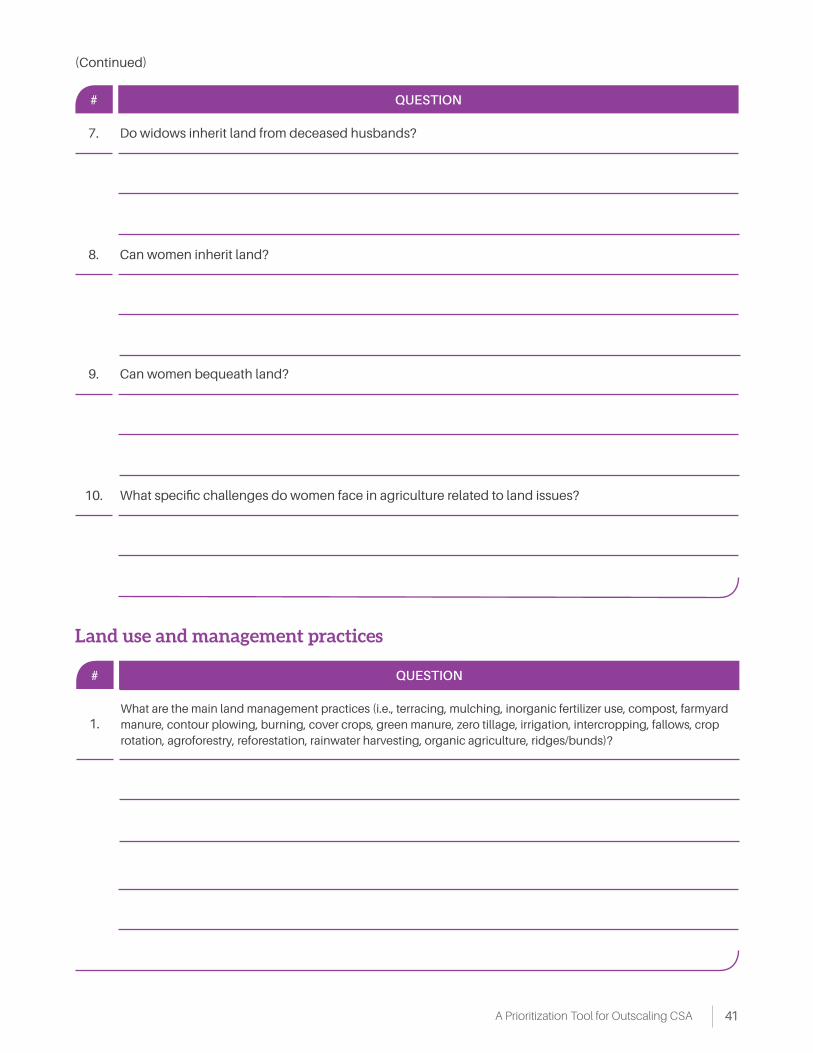
1.What are the main land management practices (i.e., terracing, mulching, inorganic fertilizer use, compost, farmyard manure, contour plowing, burning, cover crops, green manure, zero tillage, irrigation, intercropping, fallows, crop rotation, agroforestry, reforestation, rainwater harvesting, organic agriculture, ridges/bunds)?
Land use and management practices
7.
9.
8.
10.
Do widows inherit land from deceased husbands?
Can women bequeath land?
Can women inherit land?
What specific challenges do women face in agriculture related to land issues?
(Continued)
Climate-Smart Agriculture Rapid Appraisal (CSA-RA)42
Practice Why (benefits)? Why is it not being used (constraints)?
2.What practices (crop, livestock, soil, and water) do you think would be beneficial? What are the constraints to undertaking such practices?
43A Prioritization Tool for Outscaling CSA
Name Designation E-mail
a. Please note who is present in this meeting, including designation.
b. Try to complete this within an hour so as not to take up officials’ time.
c. Acknowledge participants’ support during this assessment, and please offer THANKS for their participation.
d. Please tell the officials that we will be happy to share the overall report with them and record the key persons’ correct contact details for this purpose below.
General guidance
Climate-Smart Agriculture Rapid Appraisal (CSA-RA)44
References
CCAFS. 2015. CCAFS Household Baseline Survey 2010–2012. Harvard Dataverse, V1. DOI: 10.7910/DVN/IUJQZV
CCAFS/FAO. 2012. Gender and climate change research in agriculture and food security for rural development: Training guide. CGIAR Research Program on Climate Change, Agriculture and Food Security (CCAFS) and Food and Agriculture Organization of the United Nations (FAO).
FAO. 2001. Socio-Economic and Gender Analysis Programme: Field level handbook. Food and Agriculture Organization of the United Nations. Available at: http://goo.gl/4YbZm2
Sanginga P; Chitsike C. 2005. The power of visioning. A handbook for facilitating the development of community action plan. Enabling Rural Innovation Guide 1. International Center for Tropical Agriculture (CIAT): Kampala, Uganda.
Design and layout Daniel Gutiérrez and Carlos Andrés Polo
Production editing Victoria Eugenia Rengifo
Cali, Colombia
CIAT Publication No. 409
ISBN: 978-958-694-151-8E-ISBN: 978-958-694-152-5