Embed Size (px)
Citation preview


Climate System – Social System Climate System – Social System Interactions in the Northern AtlanticInteractions in the Northern Atlantic
North Atlantic Arc project – NAArcNorth Atlantic Arc project – NAArc
NSF Arctic Social Sciences and ARCSSNSF Arctic Social Sciences and ARCSS

Physical system change
Human activities
Biological system change
Biological changes affect humans
Physical/social interactions affect biological system
Influences, feedbacks and interactions among systems

Three case studiesThree case studies Major changes have Major changes have
affected fisheries across affected fisheries across the Northern Atlantic.the Northern Atlantic.
Interactions between Interactions between physical, biological and physical, biological and human systems.human systems.
Despite local differences, Despite local differences, strong patterns emerge.strong patterns emerge.
Such patterns provide Such patterns provide “empirical models” of “empirical models” of human response to large human response to large environmental change.environmental change.

Siglufjörður, North Iceland Traditional 1965—66
After Vilhjalmsson 1997
2deg isotherm.shp herring-trad.shp
View: Iceland
#
#
GREENLANDSEA
NORTHATLANTIC FAROE
ISLANDSSHETLANDISLANDS
ICELANDSEA
Seydisfjordur
Siglufjordur
0 200 400 600 Kilometers
2 Degree Isotherm at 50 MHerring Feeding Area
63°
68°
73°
20° 14° 8° 2°
2deg isotherm.shp herring-trad.shp
View: Iceland
#
#
GREENLANDSEA
NORTHATLANTIC FAROE
ISLANDSSHETLANDISLANDS
ICELANDSEA
Seydisfjordur
Siglufjordur
0 200 400 600 Kilometers
2 Degree Isotherm at 50 MHerring Feeding Area
63°
68°
73°
20° 14° 8° 2°


““The herring years were The herring years were special, indescribable. And special, indescribable. And they will never come again.”they will never come again.” Siglufjörður residentSiglufjörður resident

Siglufjörður in March 2003

Herring catch and salinity, 1905–2000Herring catch and salinity, 1905–2000
34.4
34.5
34.6
34.7
34.8
34.9
3535
.1S
alin
ity
0
100
200
300
400
500
600
Her
ring
catc
h, 1
000
tons
1900 1910 1920 1930 1940 1950 1960 1970 1980 1990 2000
Iceland herring catch Siglunes salinity
Late-1960s herring collapse coincided with arrival of an Arctic-origin Great Salinity Anomaly – GSA’70s
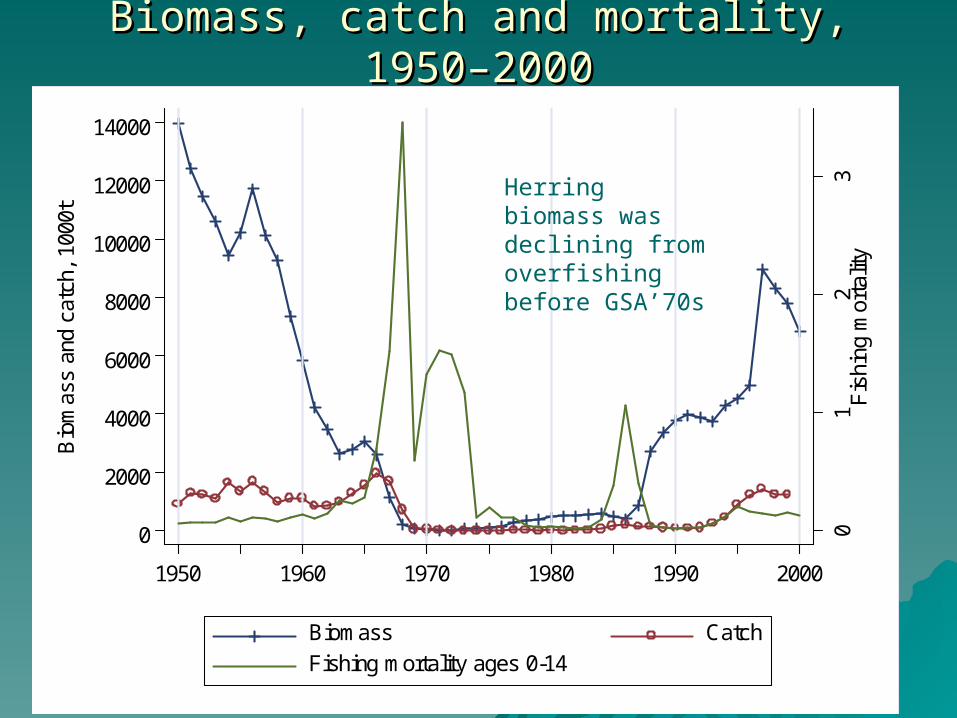
Biomass, catch and mortality, 1950–2000Biomass, catch and mortality, 1950–2000
01
23
Fis
hing
mor
talit
y
0
2000
4000
6000
8000
10000
12000
14000
Bio
mas
s an
d ca
tch,
100
0t
1950 1960 1970 1980 1990 2000
Biomass Catch
Fishing mortality ages 0-14
Herring biomass was declining from overfishing before GSA’70s

Population of SiglufjPopulation of Siglufjörðörður, 1890–2000ur, 1890–2000
0
1000
2000
3000
Pop
ulat
ion
1890 1900 1910 1920 1930 1940 1950 1960 1970 1980 1990 2000
Siglufjörður population declined as N Iceland herring declined and the fishery needed less labor.

0 400 800 Kilometers
Iceland
UnitedKingdom
Norway
Denmark
FAROE
ISLANDS
0 80 160 Kilometers
N
Torshavn
North
Atlantic
Ocean
Norwegian
Sea
Faroe Islands, Northeast Atlantic

Faroese landings of demersal fish from Faroese landings of demersal fish from home waters, 1961-2000home waters, 1961-2000
10
00
ton
s
Plateau cod Haddock Saithe
1960 1965 1970 1975 1980 1985 1990 1995 2000
0
10
20
30
40
50
60
Fisheries crisis ca. 1985-95. Overfishingplus physical change (GSA’80s?).

Faroe Islands total population 1970-2000Faroe Islands total population 1970-2000P
op
ula
tion
in th
ou
san
ds
1970 1980 1990 2000
38
40
42
44
46
48
Faroes population 13% lower than pre-crisis trend

Faroe Islands cod catch and net migration Faroe Islands cod catch and net migration 1980-20001980-2000
Ne
t mig
ratio
n
Year
Co
dfis
h c
atc
h, t
on
s
Net migration Codfish catch, tons
1980 1985 1990 1995 2000
-2000
-1500
-1000
-500
0
500
20000
30000
40000
50000
60000
70000
80000
Net migration follows cod catches, with lag of 1-2 years, 1982-96

Net migration by sex and age group, crisis Net migration by sex and age group, crisis years 1989-95years 1989-95
Ne
t mig
ratio
n
Age in 5-year groups
Males Females
0 5 10 15 20 25 30 35 40 45 50 55 60 65 70 75 80
-1100
-1000
-900
-800
-700
-600
-500
-400
-300
-200
-100
0
Crisis-years net migration: more men than women leaving, ages 25 and higher. More women than men leaving, ages 15-24.

Newfoundland, Newfoundland, showing showing Northern Northern Peninsula and Peninsula and northern Gulf of northern Gulf of St. LawrenceSt. Lawrence
QUEBEC
LABRADOR 55W
50N
Northern Peninsula
(Northern Cod)
AvalonPeninsula
Northern Gulf ofSt. Lawrence
St. John's
N
0 200 400 Kilometers


““Winners and losers” from ecological change: Winners and losers” from ecological change: Landings value in 3 regions, 1986-98Landings value in 3 regions, 1986-98
South Coast
Burin Peninsula
Northern Peninsula
0
20
40
60
1986 1988 1990 1992 1994 1996 19980
20
40
60
1986 1988 1990 1992 1994 1996 1998
0
20
40
60
1986 1988 1990 1992 1994 1996 1998
Mill
ion
s o
f 1
99
8 d
olla
rs
Shellfish
Demersal
Pelagic
other types/products

Integrating time series across disciplines: Newfoundland’s Integrating time series across disciplines: Newfoundland’s Northern Peninsula and the northern Gulf of St. LawrenceNorthern Peninsula and the northern Gulf of St. Lawrence
Min. CIL temp.
Max. ice area
N. Gulf cod catchtotal and Canada
Mean weight per fish,8 indicator species
N. Peninsulapopulation
1965 1970 1975 1980 1985 1990 1995 2000

General patternsGeneral patterns
Dramatic spikes followed by steep declines often Dramatic spikes followed by steep declines often characterize modern fisheries.characterize modern fisheries.
Declines reflect interaction between fishing Declines reflect interaction between fishing pressure and climate.pressure and climate.
Long-lived species have adapted to decadal-scale Long-lived species have adapted to decadal-scale climatic variations.climatic variations.
Fisheries remove predators and larger fish, Fisheries remove predators and larger fish, leaving less robust ecosystems behind.leaving less robust ecosystems behind.
Invertebrates become more abundant.Invertebrates become more abundant. Outmigration reshapes human populations, and Outmigration reshapes human populations, and
affects prospects for sustainable development.affects prospects for sustainable development.

Small places see outmigration and Small places see outmigration and demographic change.demographic change.
Net migration is a sensitive indicator.Net migration is a sensitive indicator. Young adults first to leave.Young adults first to leave. Older, less educated population remains.Older, less educated population remains. Transfer-payment dependency grows.Transfer-payment dependency grows. Regional centers expand.Regional centers expand.

Social factors influence the differential Social factors influence the differential outcomes among people and places.outcomes among people and places.
Economic diversification is a difficult goal.Economic diversification is a difficult goal. New fisheries risk depletion, like the old.New fisheries risk depletion, like the old. Tourism is “Plan B” everywhere.Tourism is “Plan B” everywhere. Government investments are vital, but Government investments are vital, but
often fail.often fail. Some communities are more cohesive, Some communities are more cohesive,
effective than others.effective than others.

THE END