Embed Size (px)
Citation preview

Climatic oscillations triggered post-Messinian speciation of WesternPalearctic brown frogs (Amphibia, Ranidae)
M. Veith,a,* J. Kosuch,a and M. Vencesb
a Institut f€uur Zoologie, Universit€aat Mainz, Saarstraße 2 Mainz D-55099, Germanyb Institute for Biodiversity and Ecosystem Dynamics, PO Box 94766, Amsterdam 1090 GT, The Netherlands
Received 2 July 2001; revised 12 July 2002
Abstract
Oscillating glacial cycles over the past 2.4 million years are proposed to have had a major impact on the diversity of contem-
porary species communities. We used mitochondrial and nuclear DNA sequence data to infer phylogenetic relationships within
Western Palearctic brown frogs and to test the influence of Pliocene and Pleistocene climatic changes on their evolution. We se-
quenced 1976 bp of the mitochondrial genes 16S rRNA and cytochrome b and of the nuclear rhodopsin gene for all current species
and subspecies. Based on an established allozyme clock for Western Palearctic water frogs and substitution rate constancy among
water frogs and brown frogs, we calibrated a molecular clock for 1425 bp of the 16S and rhodopsin genes. We applied this clock to
date speciation events among brown frogs. Western Palearctic brown frogs underwent a basal post-Messinian radiation about 4
million years ago (mya) into five major clades: three monotypic lineages (Rana dalmatina, Rana latastei, Rana graeca), an Anatolian
lineage, and a lineage comprising Rana italica, Rana arvalis, and all Iberian taxa. Polytypic lineages radiated further in concordance
with the onset of climatic oscillations ca. 3.2, 2.0, and 1.0–0.6 mya, respectively. The dated fossil record corroborates our paleo-
biogeographic scenario. We conclude that drastic climatic changes followed by successive temperature oscillations ‘‘trapped’’ most
brown frog species in their southern European glacial refugia with enough time to speciate. Substantial dispersal was only possible
during extensive interglacial periods of a constant subtropical climate.
� 2002 Elsevier Science (USA). All rights reserved.
Keywords: Phylogeny; Speciation; Vicariance; Glacials; Interglacials; Molecular clock; Palearctic brown frogs; Rana
1. Introduction
Species evolve either instantaneously or through three
processes of gradual speciation: allopatric, sympatric,and parapatric speciation (Mayr and Ashlock, 1991).
Despite recent empirical and theoretical evidence for
sympatric speciation mechanisms (e.g., Dieckmann and
Doebeli, 1999; Schliewen et al., 1994) the significance of
parapatric and sympatric speciation is a controversial
issue (e.g., Bush, 1994). Allopatric speciation is usually
regarded the major process of species diversification
(Coyne and Orr, 1989).In an allopatric speciation scenario, climatic changes
are often invoked to explain the break-up of distribution
areas and subsequent evolution of separated lineages. In
particular, the large series of climatic changes since the
Pliocene has markedly shaped the present-day species
communities of the Northern hemisphere (Blondel andAronson, 1999). The Praetiglian cold stage, starting at
2.3–2.4 mya, brought to an end the long period of
Tertiary forests with their rich floristic diversity in
northwestern Europe (West, 1988). It was initiated by an
abrupt glaciation of substantial scale in the Northern
hemisphere, although it was preceded by small increases
in ice volume at ca. 3.0 and 2.55 mya (Ruddiman and
Raymo, 1988). Smaller climatic fluctuations followedthroughout the Late Pliocene. Calcareous nannoplank-
ton records indicate a relatively warm period with less
pronounced temperature fluctuations during the early
Pleistocene (M€uuller, 1985; Ruddiman and Raymo,
1988). During the last 700.000 years climatic oscilla-
tions, followed by the growth and retreat of the Arctic
Molecular Phylogenetics and Evolution 26 (2003) 310–327
www.elsevier.com/locate/ympev
MOLECULARPHYLOGENETICSANDEVOLUTION
* Corresponding author. Fax: +49-6131-3923731.
E-mail address: [email protected]
(M. Veith).
1055-7903/02/$ - see front matter � 2002 Elsevier Science (USA). All rights reserved.
PII: S1055-7903 (02 )00324-X

ice sheet, have been mainly the result of orbital eccen-tricity with a roughly 100 ka cycle (Milankovitch oscil-
lations; Hays et al., 1976). This caused changes in
insolation. Along with lesser variation in axial tilt
(40 ka) and precession (23 ka) they produced a complex
pattern of climatic oscillations (e.g., Ruddiman and
Raymo, 1988).
Oscillating climatic shifts were greater towards the
poles. Consequently, they initiated tremendous speciesrange dynamics in Europe and Northern America (e.g.,
Coope, 1994). Pliocene and Pleistocene temperature
changes often occurred very rapidly (Lowe and Walker,
1997), leading to a negative effect on gradual speciation
in northern Europe (Dynesius and Jansson, 2000). In
contrast, they probably promoted divergence and spe-
ciation in southern refugia (Taberlet et al., 1998).
Classical vicariance theory (Rosen, 1978) predicts thatthe phylogenetic relationships among taxa in an area
should mirror successive rises of gene flow barriers
among glacial refugia. Amphibians are ideal for testing
such vicariance hypotheses, as has been repeatedlyshown for the Mediterranean fauna (e.g., Oosterbroek
and Arntzen, 1992; Taberlet et al., 1998). They disperse
terrestrially; marine or even air-bound dispersal is almost
impossible. Since each species individually responds to
climatic changes (Hewitt, 1996), speciose taxa allow for a
more differentiated evaluation of the effect of climatic
deterioration or amelioration. Among Western Palearc-
tic amphibians, the frog genus Rana represents the mostspecious genus. Of its 20 species, nine are comprised in
the subgenus Pelophylax (Dubois, 1992), the so-called
European water frogs. The remaining species represent
the western members of the Palearctic subgenus Rana,
the so-called brown frogs. So far, the distinction of
Western and Eastern Palearctic brown frogs has simply
been based on biogeographical grounds.
In contrast to the semi-aquatic water frogs, brownfrogs are largely terrestrial, with an aquatic larval stage.
They are usually found in montane habitats, and while
some species are explicit generalists (e.g., Rana tempo-
Fig. 1. Distributions of currently recognised species of Western Palearctic brown frogs (after Gasc et al., 1997; Demirsoy, 1996; Kuzmin, 1999).
Upper left: Rana temporaria (hatched) and R. macrocnemis (black). Upper right: R. dalmatina (hatched) and R. holtzi (dot). Lower left: R. arvalis
(hatched) and R. camerani (black). Lower right: Atlanto-Iberian and Mediterranean endemics: R. iberica (horizontally hatched), R. pyrenaica (black),
R. latastei (vertically hatched), R. italica (dotted), and R. graeca (cross-hatched).
M. Veith et al. / Molecular Phylogenetics and Evolution 26 (2003) 310–327 311
raria breeds in all kinds of stagnant and moderatelyrunning water and occurs from lowland habitats up to
2745m a.s.l. in the Alps), others are specialists (e.g.,
Rana graeca is restricted to fast running mountain
brooks of the southern Balkans and adjacent regions).
Western Palearctic brown frogs occur all over Europe
and Asia Minor (Gasc et al., 1998; Baran and Atat€uur,1998). With the exception of R. graeca Boulenger, 1891,
Rana italica Dubois, 1985, and Rana dalmatina Bona-parte, 1840, they are absent from the Mediterranean
climatic zone (as defined by Blondel and Aronson, 1999:
Fig. 1.5), including islands (only R. dalmatina occurs on
Sicily and some Dalmatian and Ionian islands; Lanza
and Vanni, 1987). According to their distribution, they
can be divided into four groups (Fig. 1): (i) wide-spread
European species: R. temporaria Linnaeus, 1758; R.
dalmatina; Rana arvalis Nilsson, 1842 (the latter with astrong affiliation to Asia); (ii) Ibero-Atlantic endemics:
R. iberica Boulenger, 1879; R. pyrenaica Serra-Cobo,
1993; (iii) Mediterranean endemics: R. graeca; R. italica;
Rana latastei Boulenger, 1879; and (iv) Minor Asian and
Caucasian endemics: Rana camerani Boulenger, 1886; R.
holtzi Werner, 1898; R. macrocnemis Boulenger, 1885.
The phylogeny of Western Palearctic brown frogs has
repeatedly been studied using allozymes, although onlyfor subsets of taxa (Arano et al., 1993; Green and
Borkin, 1993; Mensi et al., 1992; Picariello et al., 1990).
A comprehensive study that includes all currently
known and accepted species is still lacking. Therefore,
Barbadillo et al. (1997) summarised the scattered
knowledge on the phylogenetic relationships of Western
Palearctic brown frog species to infer a reconciled tree.However, R. pyrenaica, a recently described species
(Serra-Cobo, 1993) was included in their tree without
electrophoretic evidence. We therefore used recently
published allozyme data (Veith et al., 2002) to propose
another tree depicting the presumed relationships of
Western Palearctic brown frogs (Fig. 2). This tree will
serve as reference to test phylogenetic hypotheses: are
Western Palearctic brown frogs monophyletic? If not, assuggested by Barbadillo et al. (1997), can we define
major monophyletic lineages within Western Palearctic
brown frogs?
To link speciation events to paleoclimate we cali-
brated and applied a molecular clock. If in fact onsets of
climatic oscillations were responsible for brown frog
speciation (Dynesius and Jansson, 2000) we would ex-
pect a concentration of speciation events at the begin-ning of each oscillation interval rather than a random
distribution of species splits across periods of climatic
oscillations.
2. Materials and methods
2.1. Samples
We studied all Western Palearctic brown frog taxa
that are currently acknowledged (Appendix A). For
outgroup rooting we used Rana (Pelophylax) bedriagae
from Turkey and the Nearctic Rana (Aquarana) cates-
beiana which belong to related subgenera within the
genus Rana (Dubois, 1992). All sequences generated for
this study are deposited in GenBank (see Appendix Afor Accession Numbers).
2.2. Preparation of DNA templates, PCR, and DNA
sequencing
Tissues were obtained from either fresh, frozen, or
ethanol preserved specimens. DNA was extracted using
the QiAmp tissue extraction kits (Qiagen). PCR wasused to amplify fragments of the mitochondrial 16S
rRNA (two separate portions) and cytochrome b genes
as well as for part of the nuclear rhodopsin gene. The
primers and cycling procedures were:
(i) 16S-1: 16SA (light chain; 50-CGC CTG TTT
ATC AAA AAC AT-30) and 16SB (heavy chain; 50-CCG GTC TGA ACT CAG ATC ACG T-30) of
Palumbi et al. (1991) amplified a ca. 560 bp section ofthe mitochondrial 16S ribosomal RNA gene. PCR
cycling procedure was as follows. Initial denaturation
step: 90 s at 94 �C; 33 cycles: denaturation 45 s at
94 �C, primer annealing for 45 s at 55 �C, extension for
90 s at 72 �C.
(ii) 16S-2: 16L3 (light chain; 50-AGC AAA GAH
YWW ACC TCG TAC CTT TTG CAT-30) modified
Fig. 2. Hypothesis on the phylogenetic relationships among Western
Palearctic (in bold face) and some Eastern Palearctic (indicated by
asterisks) brown frog species (modified after Barbadillo et al., 1997).
312 M. Veith et al. / Molecular Phylogenetics and Evolution 26 (2003) 310–327

from Hedges (1994) and 16SA-H (heavy chain; reversecomplement of 16SA) amplified a ca. 680 bp section of
the mitochondrial 16S ribosomal RNA gene; PCR cy-
cling procedure was the same as for 16S-1.
(iii) Cyt b: L14841 (light chain; 50-CTC CCA GCC
CCA TCC AAC ATC TCA GCA TGA TGA AAC
TTC G-30), modified from Kocher et al. (1989), and
CB3-H (heavy chain; 50-GGC AAA TAG GAA GTA
TCA TTC TG-30), modified from Palumbi et al. (1991),amplified a ca. 700 section of the mitochondrial cyto-
chrome b (cyt b) gene. PCR cycling procedure was as
follows. Initial denaturation step: 120 s at 94 �C; 34 cy-
cles: denaturation 45 s at 92 �C, primer annealing for 60 s
at 50 �C, extension for 90 s at 72 �C.
Rhodopsin: rhod1-a (50-ACC ATG AAC GGA ACA
GAA GGY CC-30) and rhod1-d (50- GTA GCG AAG
AAR CCT TCA AMG TA-30) of Bossuyt and Milin-kovitch (2000) amplified a ca. 380 bp section of the
rhodopsin gene (rhod in Appendix A); PCR cycling
procedure was as follows. Thirty-five cycles: denatur-
ation 45 s at 94 �C, primer annealing for 45 s at 55 �C,
extension for 60 s at 72 �C.
PCR products were purified using the Qiaquick pu-
rification kit (Qiagen). We sequenced single-stranded
fragments on an ABI 377 automatic sequencer usingApplied Biosystems standard protocols.
Obtained mitochondrial DNA sequences (lengths
referring to the aligned sequences including gaps) com-
prised 540 and 643 bp (16S), and 465 bp (cyt b) homol-
ogous to base pair positions 4004–4565, 3278–3942, and
16420–16885 of the Xenopus laevis mitochondrial ge-
nome (Roe et al., 1985). The rhodopsin fragment was
327 bp long. We consistently achieved 1976 bp for allsamples. Sequences were aligned automatically using the
clustal option of the SEQUENCE NAVIGATOR soft-
ware (Applied Biosystems). The 16S alignment was
slightly refined by eye in the loop regions.
Partial sequences of the 16S rRNA (equivalent to our
16S-1 fragment) and the cytochrome b genes for five
species of Eastern Palearctic brown frogs were accessible
through GenBank (Appendix A). We aligned them tothe homologous sequences of our samples to test for
monophyly of Western Palearctic species.
To test for saturation of genes we plotted uncorrected
p distances versus TrN distances for 16S, rhodopsin, and
first, second and third codon positions of cytochrome b
following the approach of Reed and Sperling (1999).
2.3. Phylogenetic analysis
We determined the number, nature, and distribution
of base substitutions. To assess the amount of phyloge-
netic signal we generated 106 random trees and calcu-
lated the skewness (g1) and kurtosis (g2) of the resultingtree length distribution (with PAUP�; Swofford, 2001).
To gain confidence in a combined phylogenetic
analysis of mitochondrial and nuclear gene fragments
we tested for congruence among data partitions (Huel-
senbeck et al., 1996). We used the implementation of the
parsimony method of Farris et al. (1995) in PAUP� (100
replicates, heuristic search using the TBR branch
swapping algorithm).Conventional tree-building methods from nucleotide
sequences can be unreliable when the base composition
of taxa varies between sequences (Steel et al., 1993).
Varying base compositions necessitate the application of
the LogDet transformation that allows to consistently
recover the correct tree when sequences evolve under
simple asymmetric models that can vary between lin-
eages (Lockhart et al., 1994). We therefore used PAUP�
to perform v2 tests for equal base composition between
sequences. Equal base composition between sequences
would allow us to apply substitution models that fit our
data best (as recently emphasised by Sullivan and
Swofford, 2001).
We applied a hierarchical likelihood ratio test for the
goodness-of-fit of nested substitution models (for in-
group taxa only). Using the program MODELTEST(Posada and Crandall, 1998) we calculated the test sta-
tistic d ¼ 2 logK with K being the ratio of the likelihood
of the null model divided by the likelihood of the al-
ternative model (for details see Huelsenbeck and Cran-
dall, 1997). Due to the performance of multiple tests, we
adjusted the significance level of rejection of the null
hypothesis via the sequential Bonferroni correction to
a ¼ 0:01 (Rice, 1989).The data were subjected to four different methods of
phylogenetic reconstruction: (i) neighbor joining (NJ)
(Saitou and Nei, 1987) using the TrNþ I þ C substitu-
tion model; (ii) maximum parsimony with gaps treated
Table 1
Alignment statistics for fragments of the 16S rRNA, the cytochrome b, the rhodopsin gene and combined alignments; number of base pairs (bp),
number of variable sites (vs), number of phylogenetically informative sites (pi); base frequencies ðpA, pG, pT, pC), skewness (g1), kurtosis (g2). The
transition-transversion ratio (ti/tv) is given for ingroups only, 1 used for molecular clock calibration only
Alignment bp vs pi pA pG pT pC g1 g2 ti/tv
16S 1184 317 182 0.374 0.183 0.243 0.236 0.69 0.49 4.82
Cytochrome b 465 169 132 0.239 0.162 0.306 0.292 0.65 0.34 6.11
Rhodopsin 327 23 14 0.268 0.178 0.308 0.246 0.81 0.66 2.85
16Sþ rhodopsin1Þ 1511 354 204 0.321 0.210 0.245 0.223 0.68 0.45 4.63
16S+ cyt b+ rhodopsin 1976 509 328 0.318 0.176 0.255 0.251 0.67 0.40 5.20
M. Veith et al. / Molecular Phylogenetics and Evolution 26 (2003) 310–327 313

as fifth character state; transitions and transversionswere given equal weight; heuristic search with the TBR
branch swapping algorithm; (iii) maximum likelihood
(ML) analysis based on the TrNþ I þ C substitution
model, (iv) Bayesian inference (Huelsenbeck et al., 2001;
Rannala and Yang, 1996), which is similar to ML and is
based upon the notion of posterior probabilities of a
phylogenetic tree. With the exception of the Bayesian
approach (MrBayes; Huelsenbeck and Ronquist, 2001),all analyses were done with PAUP� (Swofford, 2001).
Robustness of NJ and MP tree topologies was tested by
bootstrap analyses (Felsenstein, 1985), with 2000 repli-
cates each (Hedges, 1992). Only bootstrap values
P 70% indicate sufficiently resolved topologies (Huel-
senbeck and Hillis, 1993), those between 50 and 70%
were regarded as tendencies. Despite some reasonable
criticism (Cao et al., 1998) but due to computationalconstraints, we used Quartet Puzzling (Strimmer and
von Haeseler, 1996) with 2000 permutations to infer
reliability values (which are usually slightly higher than
bootstrap values; Cao et al., 1998) for ML tree topolo-
gies. We applied the Bayesian method using the general
time reversible model of nucleotide substitution (GTR;
Rodr�ııguez et al., 1990; the TrN model is not available in
MRBAYES) with a gamma shape parameter estimatedfor eight rate categories of equal weight from the data.
We run four simultaneous Metropolis-coupled Monte-
Carlo Markov chains for 500,000 generations. We
sampled a tree every 100 generations and calculated a
consensus topology for 4000 trees by omitting the first
1000 trees (burn-in).
For the combined analysis of Western and Eastern
Palearctic brown frogs sequences (16S and cytochromeb) we applied the Bayesian method, using the same
settings as outlined above.
2.4. Statistical test of competing phylogenetic tree
hypotheses
A priori chosen tree topologies were tested against the
alternative topology of the NJ tree using the non-para-metric likelihood ratio test of Shimodaira and Haseg-
awa, 1999; likelihood settings: HKY85 substitution
model, ti/tv ratio¼ 2, empirical base frequencies; one-
tailed SH test using 1000 RELL bootstrap replicates) as
implemented in PAUP� (Swofford, 2001). This modifi-
cation of the Kishino–Hasegawa test (Kishino and Ha-
segawa, 1989) corrects for multiplicity of testing and
appears to be very conservative in rejecting topologies asuntrue (Whelan et al., 2001). To avoid overrepresenta-
tion of polytypic lineages we used a reduced data set with
Rana macrocnemis macrocnemis, R. m. tavasensis, and R.
m. pseudodalmatina for the clade of Anatolian mountain
frogs and the respective nominotypic subspecies as rep-
resentatives of R. temporaria and R. arvalis. We kept the
topology of the NJ tree as constant as possible. For some
hypotheses several alternative topologies had to beconsidered (trees are given in Table 2):
(1) Monophyly of all species living in the Iberian pen-
insula (R. temporaria, R. pyrenaica, and R. iberica).
(2) Rana graeca and R. italica form a monophylum;
they had originally been regarded as conspecific (Du-
bois, 1985); two alternative topologies.
(3) Rana iberica is the sister taxon of R. temporaria;
this is the original hypothesis of Barbadillo et al.(1997); two alternative topologies.
(4) Rana arvalis is ancestral to all other Western Pa-
learctic taxa; this is assumed by Barbadillo et al.
(1997) based on its 2n ¼ 24 chromosome number
(all other Western Palearctic species: 2n ¼ 26).
2.5. Test for substitution rate constancy and molecular
clock calibration
A test for substitution rate constancy (molecular
clock test) was performed using TREE-PUZZLE
(Schmidt et al., 2000), with R. bedriagae as the root for
Western Palearctic brown frogs.
Concerns against the application of molecular clocks
have repeatedly been published (e.g., Scherer, 1990), and
substitution rate heterogeneity among taxa is obvious
Table 2
Shimodaira–Hasegawa test of alternative tree topologies against the
NJ tree topology; the asterisk indicates topologies significantly worse
than the best tree (p < 0:05)
Tree � ln L Diff � ln L p
NJ tree 7386.70 0.67 0.882
1 7386.03 (Best tree)
2a 7418.33 32.30 0.026�
2b 7416.78 30.75 0.031�
3a 7399.98 13.94 0.222
3b 7404.52 18.49 0.141
4 7402.07 16.04 0.167
NJ tree¼ (P. bedriagae, (R. catesbeiana, ((((R. m. pseudodalmatina,
R. m. tavasensis), R. m. macrocnemis), ((R. latastei, R. dalmatina), R.
graeca)), (((R. pyrenaica, R. t. temporaria), R. a. arvalis), (R. italica,
R. iberica))))); tree 1¼ (P. bedriagae, (R. catesbeiana, ((((R. m. pseudo-
dalmatina, R. m. tavasensis), R. m. macrocnemis), ((R. latastei, R. dal-
matina), R. graeca)), (R. italica, (((R. pyrenaica, R. t. temporaria), R. a.
arvalis), R. iberica))))); tree 2a¼ (P. bedriagae, (R. catesbeiana, (((R. m.
pseudodalmatina, R. m. tavasensis), R. m. macrocnemis), ((R. latastei, R.
dalmatina), (R. italica, R. graeca))), (((R. pyrenaica, R. t. temporaria),R.
a. arvalis), R. iberica)))); tree 2b¼ (P. bedriagae, (R. catesbeiana, ((((R.
m. pseudodalmatina, R. m. tavasensis), R. m. macrocnemis), (R. latastei,
R. dalmatina)), (((R. pyrenaica, R. t. temporaria), R. a. arvalis), ((R.
italica,R. graeca),R. iberica))))); tree 3a¼ (P. bedriagae, (R. catesbeiana,
((((R. m. pseudodalmatina, R. m. tavasensis), R. m. macrocnemis), (R.
graeca, (R. latastei, R. dalmatina))), (((R. pyrenaica, (R. iberica, R. t.
temporaria)), R. a. arvalis), R. italica)))); tree 3b¼ (P. bedriagae, (R.
catesbeiana, ((((R. m. pseudodalmatina, R. m. tavasensis), R. m. ma-
crocnemis), (R. graeca, (R. latastei, R. dalmatina))), ((R. pyrenaica, R. a.
arvalis), ((R. iberica, R. t. temporaria), R. italica))))); tree 4¼ (P. be-
driagae, (R. catesbeiana, (R. a. arvalis, ((((R. m. pseudodalmatina, R. m.
tavasensis),R. m. macrocnemis), (R. graeca, (R. latastei, R. dalmatina))),
((R. pyrenaica, R. t. temporaria), (R. iberica, R. italica)))))).
314 M. Veith et al. / Molecular Phylogenetics and Evolution 26 (2003) 310–327

(e.g., Martin et al., 1992; Mindel et al., 1996; Rand,1994). Therefore, usage of a clock calibration from
closely related taxa is considered more reliable (e.g.,
Caccone et al., 1997; Pook et al., 2000).
Trustworthy paleogeographic events that can unam-
biguously be attributed to species splits within Western
Palearctic brown frogs are lacking (as outlined above,
these species are almost completely missing on Medi-
terranean islands with their usually well known lastconnection to the mainland). Therefore, a molecular
clock can only be inferred indirectly. Beerli (1994) cali-
brated an allozyme clock for Aegean and other Medi-
terranean water frogs (subgenus Pelophylax of Rana) to
8.14 my/D�Nei). His calibration can serve as a base line to
calibrate a molecular clock. We compared pairwise al-
lozyme genetic distances of Beerli (1994) to 16S and
rhodopsin TrNþ I0:5148 þ C0:4549 distances among spe-cies pairs among water frogs (for samples see Appendix
A). Methods of sequencing, alignment, and data anal-
ysis were the same as above. Cytochrome b was excluded
from the molecular clock calibration since (i) transitions
showed signs of saturation and (ii) two water frog spe-
cies, R. epeirotica and R. saharica, repeatedly gave
negative results in the PCR.
To test whether the selected gene fragments weresuited for molecular clock calibration, we conducted
relative rate tests (Takezaki et al., 1995) using PHYL-
TEST software (Kumar, 1996). All tests were performed
with two of the different substitution models imple-
mented in PHYLTEST, namely the Jukes–Cantor and
the Kimura 2-parameter model. To test for possible rate
heterogeneity between water frogs (as used for calibra-
tion) and brown frogs, we compared both groups usingFejervarya limnocharis (Dicroglossinae), a distantly re-
lated ranid, as an outgroup. Brown frogs were tested
both together and separately (with the R. macrocnemis
complex and the R. temporaria and R. arvalis subspecies
subsumed in single clusters, respectively).
3. Results
Saturation plots of uncorrected sequence divergence
against TrN distances are given in Fig. 3. Only the third
codon position of cytochrome b showed clear evidence
for saturation. Beginning saturation was indicated for
the 16S rDNA, the rhodopsin gene and the first codon
position of the cytochrome b gene. We therefore ac-
cepted the homoplastic noise related to saturation andkept all base positions for further analyses.
The partition homogeneity test revealed a lack of
difference among data partitions (P ¼ 0:84). Conse-
quently, we merged gene fragments for further analyses.
The Tamura and Nei (1993) model fitted our com-
bined alignment best (� ln L ¼ 7823:99), with the pro-
portion of invariable sites (I ¼ 0:5148) and the gamma
distribution shape parameter (a ¼ 0:4549) estimatedfrom the data (TrNþ I þ C-model). We used empirical
base frequencies and the substitution model of
rate½A–G ¼ 9:69 and rate½C–T ¼ 17:04 (all other rate-
s¼ 1.0), estimated from the data.
3.1. Test for monophyly of Western Palearctic brown
frogs
In the combined analysis of partial 16S and cyto-
chrome b sequences of 19 Western and five Eastern Pa-
learctic brown frog taxa (Bayesian inference), Western
Palearctic species came out as a monophylum with re-
spect to Eastern Palearctic species. However, basal splits
were poorly resolved (Fig. 4). In the NJ analysis (not
shown), basal resolution was even worse. Consequently,
monophyly of Western Palearctic species could not un-ambiguously be proven. This allowed us only to tenta-
tively discuss the phylogenetic relationships among
Western Palearctic species. We rather focussed on the
evolution of monophyletic species groups withinWestern
Palearctic brown frogs. This does not affect the dating of
speciation events, which is based on anagenetic (pairwise
sequence divergence), not on cladogenetic processes.
3.2. Sequence and tree statistics
Sequence statistics for the three gene fragments and
for the combined alignment are given in Table 1. The g1statistics indicated that significant phylogenetic signal
was present in all data sets.
All multiple samples of a taxon showed identical se-
quences. Five hundred and nine out of 1976 bp werevariable in the combined alignment, with 328 being
parsimony informative. Base frequencies clearly devi-
ated from equal distribution. The average ti/tv ratio
varied among genes and was 5.20 in the combined data
set when considering only ingroup taxa. This 10-fold
bias towards ti�s indicated that they were at best slightly
saturated among ingroups (see also Fig. 3).
The single most parsimonious tree required 1132evolutionary steps. For 106 random trees we calculated
the skewness g1 ¼ 0:67 and kurtosis g2 ¼ 0:40. Tree
statistics were as follows: consistency index CI¼ 0.5716,
homoplasy index HI¼ 0.4284, retention index RI¼0.6372, and rescaled consistency index RC¼ 0.3642. An
adjusted consistency index that corrects for random ef-
fects in a data set of a given number of taxa was cal-
culated to 0.4006 from the formula of Klassen et al.(1991): CIadjusted ¼ CI� CIrandom, with CIrandom ¼2:9370 n�0:9339
taxa .
3.3. Trees and topology tests
All phylogenetic analyses resulted in essentially the
same topologies (only the NJ tree is shown in Fig. 5).
M. Veith et al. / Molecular Phylogenetics and Evolution 26 (2003) 310–327 315

The following clades consistently emerged from allanalyses with sufficient resolution when regarding only
splits with bootstrap p-values P70% as statistically re-
liable (Huelsenbeck and Hillis, 1993):
(i) A basal multifurcation into five lineages emerged:
R. graeca, R. dalmatina, R. latastei, an Anatolian clade,
and a clade comprising all remaining taxa (for the time
being we name it ‘‘Rana temporaria species group’’).
Rana graeca, R. dalmatina and R. latastei form a sig-nificant monophylum in the ML and Bayesian trees.
(ii) The Rana temporaria species group immediately
splits into five sub-lineages: R. italica, R. iberica, R. ar-
valis, R. temporaria, and R. pyrenaica; R. arvalis, R.
temporaria, and R. pyrenaica form a monophylum;
however, R. pyrenaica is the sister taxon to a (R. arvalis
R. temporaria) clade in the Bayesian phylogeny (95%
Bayesian posterior probability).(iii) The polytypic R. temporaria is a monophylum
(support: 100, 100, 94, and 100% Bayesian posterior
probability, respectively) with R. t. parvipalmata stand-ing basal to all other subspecies (support: 100, 100, 95,
and 100%).
(iv) The polytypic R. arvalis is a monophylum (sup-
port: 100% each).
(v) Anatolian brown frogs form a monophylum
(support: 100, 100, 97, and 100%, respectively), how-
ever, R. macrocnemis does not; a significant internal
monophylum is formed by R. m. macrocnemis, R. holtzi,and R. camerani (support: 100% each).
Some weekly supported clades formed as follows:
(vi) Rana iberica and R. italica are sister taxa.
(vii) Rana pyrenaica and R. temporaria are sister taxa.
Neither monophyly of the species that occur in the
Iberian Peninsula (tree 1) nor a sister relationship of
R. temporaria and R. iberica (tree 2a and 2b) could be
excluded (Table 2). Despite a fairly high bootstrapsupport for the R. temporaria species group, a position
of R. arvalis basal to all other western Palearctic brown
Fig. 3. Plot of uncorrected p distances of 16S, rhodopsin and different codon positions of cytochrome b (cyt b-nt1, cyt b-nt2, and cyt b-nt3) against
corrected molecular (TrN) distances; deviations of points from the uncorrected p ¼ TrN line suggest the degree of saturation for each data partition.
316 M. Veith et al. / Molecular Phylogenetics and Evolution 26 (2003) 310–327

frogs was also supported by our data. In contrast, ourdata did not support a sister relationship of R. graeca
and R. italica.
3.4. Calibration and application of a molecular clock
Enforcing a molecular clock and using R. bedriagae
as the root resulted in a tree with a log-likelihood sig-
nificantly worse than the more complex tree without aclock (log Lwithoutclock ¼ �7011:39; log Lwithclock ¼�7038:39; the simpler, clock-like tree was rejected on a
significance level of 5%). This is probably caused by the
fact that only a small number of autapomorphic sub-
stitutions accumulated in the brook-dwelling R. graeca
and R. pyrenaica.
Rate constancy among Western Palearctic brown
frogs (we compared all taxa with each other, again de-
fining the R. macrocnemis complex and the R. tempo-
raria and R. arvalis subspecies as single lineages, and
using R. catesbeiana as the outgroup) was not rejected at
the 0.05% level in any of the 28 comparisons (PHYL-
TEST; Kumar, 1996).
Rate constancy between Western Palearctic brown
frogs and water frogs was not rejected (at the 0.05 level)
in any of the comparisons, although the rates of brown
frogs were consistently slightly higher (up to 5%). In theoverall comparison using Jukes-Cantor distances, the
brown frog and water frog rates (La and Lb in
PHYLTEST) were estimated as 0.0827 and 0.080
(Z ¼ 0:165).TrNþ I0:5623 þ C0:5129 distances and D�
Nei (Nei�s, 1972,standard genetic distance in the modification of Hillis,
1984) of Western Palearctic water frogs are significantly
correlated (r2 ¼ 0:602, p < 0:001; Fig. 6). Time of
Fig. 4. Bayesian inference of phylogenetic relationships among Western and Eastern Palearctic brown frogs, based on partial sequences of the
mitochondrial 16S rRNA and the cytochrome b genes; Bayesian posterior probabilities are given for 4000 trees; asterisks indicates Eastern Palearctic
species.
M. Veith et al. / Molecular Phylogenetics and Evolution 26 (2003) 310–327 317

separation was therefore calculated from TrN distances
using the following equation: time-of-separationmean ¼0:198þ 8:189 � D�
Nei � TrN, with 1D�Nei ¼ 8:14 million
years (my) being Beerli�s (1994) calibration of the
allozyme clock. The lower and upper 95% confidence
limits (CI) of the calibration were calculated from
time-of-separation�95%CI ¼ ð0:198þ 1:96SDÞ þ ð8:189�1:96SDÞ � 8:14my � TrN, and time-of-separationþ95%CI ¼ð0:198� 1:96SDÞ þ ð8:189þ1:96SDÞ � 8:14my � TrN. We
subsequently used this calibration to discuss splits
among Western Palearctic brown frogs.The basic radiation among Western Palearctic brown
frogs can be dated to the post-Messinian, ca. 4.0 million
years ago (mya) (Table 3). The upper 95% CI just ap-
proaches the time of the Messinian salinity crisis; a
Messinian origin of the earliest splits thus can not be
completely ruled out, although it is unlikely. It can be
taken for granted that the diversification into the major
Fig. 5. Neighbor-joining tree (TrNþ I0:5148 þ C0:4549 substitution model) of 1976bp of 16S, cytochrome b and rhodopsin for all species and subspecies
of Western Palearctic brown frogs. Bootstrap supports are given for NJ (upper value; 2000 replicates), MP (upper half; 2000), ML (lower half; 2000),
and Baysian inference (lower; 4000). Closed circles indicate brown frog lineages that evolved after a basal radiation. Open circles indicate lineages
within the R. temporaria species group.
318 M. Veith et al. / Molecular Phylogenetics and Evolution 26 (2003) 310–327

lineages was completed before the onset of the first
Pleistocene glaciations. Starting with the pronounced
glaciation about 3.0 mya at the Early Pliocene/Late
Pliocene boundary, the R. temporaria species group (as
named above) rapidly split into five lineages (R. arvalis,R. pyrenaica, R. temporaria, R. iberica, and R. italica).
In concordance with the onset of further sever glaciation
around 2.4 mya the Anatolian lineage further radiated
(R. m. macrocnemis, R. m. tavasensis, and R. m.
pseudodalmatina). About 1 mya, R. temporaria has split
into two genetically well-differentiated lineages: the
Iberian R. t. parvipalmata and a clade of all remaining
subspecies. Simultaneously, R. arvalis has split into itscurrently recognised subspecies. A simultaneous diver-
sification of the Anatolian clade into R. camerani, R.holtzi, and R. m. macrocnemis and of R. temporaria can
be dated to the onset of the present cycle of climatic
oscillations ca. 600.000 years ago.
4. Discussion
Our molecular data clearly indicate that Western
Palearctic brown frogs underwent a basal radiation into
at least five distinct lineages about four million years
ago. Well-supported sub-lineages comprise the Anato-
lian taxa (R. macrocnemis R. camerani, and R. holtzi)
and most Western Mediterranean species (R. italica, R.
iberica, R. pyrenaica, and R. temporaria, including R.
arvalis), respectively. This scenario supports the allo-zyme-based assumption of a Plio-Pleistocene diversifi-
cation of Western Palearctic brown frogs (Mensi et al.,
1992) rather than a Miocene origin of basal lineages as
assumed by Oosterbroek and Arntzen (1992). The evo-
lutionary relationships within Anatolian taxa contradict
current systematics and call for a taxonomic revision
(Appendix B). The polytypic R. arvalis and R. tempo-
raria constitute valid monophyletic lineages.
4.1. Are Western and Eastern Palearctic brown frogs
monophyletic lineages?
The masked brown frog morphotype that is common
even among semi-terrestrial frogs of other families (e.g.,
Leptodactylidae and Myobatrachidae; Green and Bor-
kin, 1993) makes a morphological delimitation ofmonophyletic assemblages problematic, if not impossi-
ble. Therefore, Eastern and Western Palearctic brown
frogs do not necessarily define monophyletic lineages.
Fig. 6. Calibration of a 16S clock for Western Palearctic water frogs;
allozyme distances were taken from Beerli (1994). Dashed lines indi-
cate the 95% CI of the regression line. Regression parameters are as
follows: slope� SD ¼ 8:189� 1:306, intercept� SD ¼ 0:198� 0:079;
r2 ¼ 0:602, p < 0:001.
Table 3
Estimated time of divergence (my¼million years) among brown frog lineages; mean time of divergence from n pairwise comparisons and the lower
and upper 95% CI of the calibration are given; lower and upper 95% CI of the total estimate are gained from lowercal � 1:96SD and
uppercal þ 1:96SD
Split n Average time of divergence (my) using pairwise
comparisons
Total 95% CI of the time of
divergence (my)
Lowercal � SD Meancal � SD Uppercal � SD Lowertotal Meantotal Uppertotal
Pelophylax to Rana 20 6:62� 0:22 9:32� 0:32 12:01� 0:43 6.19 9.32 12.85
Rana to Aquarana 19 5:01� 0:24 7:00� 0:39 8:84� 0:46 4.54 7.00 9.74
Basal split within brown frogs 106 2:96� 0:32 3:99� 0:34 5:02� 0:45 2.33 3.99 5.90
Basal split within R. temporaria
species group
39 2:40� 0:29 3:18� 0:43 3:96� 0:56 1.83 3.18 5.06
R. a. arvalis to R. a. wolterstorffi 1 0.92 1.03 1.13 0.92 1.03 1.13
R. t. parvipalmata to other
R. temporaria ssp.
5 0:98� 0:07 1:12� 0:10 1:25� 0:13 0.84 1.12 1.50
Among R. temporaria ssp. but
without R. t. parvipalmata
10 a 0:58� 0:11 a 0.36 0.58 0.80
Major Anatolian lineages 7 1:62� 0:14 2:04� 0:20 2:46� 0:27 1.35 2.04 2.99
Within R. m. macrocnemis lineage 3 a 0:60� 0:12 a 0.36 0.61 0.84
aA calculation of lower and upper 95% CI�s of D�Nei was not possible due to low levels of TrN; it resulted in lower 95% CIs> upper 95% CIs,
which is an artefact of the non-zero intercept of the regression equation.
M. Veith et al. / Molecular Phylogenetics and Evolution 26 (2003) 310–327 319

One Western Palearctic species, R. arvalis, is geo-graphically intermediate and overlaps with Western
(e.g., R. dalmatina, R. temporaria) and Eastern (R. am-
urensis) species. It is this species that was placed basal to
the remaining Western Palearctic brown frogs and to
two clades of eastern species in the consensus tree of
Barbadillo et al. (1997; see Fig. 2). This may appear
justified by its 2n ¼ 24 chromosome number, which it
shares only with some Eastern Palearctic species like R.
chensinensis, R. dybowskii, R. ornativentris, and R. pirica
(King, 1990; Miura et al., 1995; Odierna et al., 2001; but
see Green and Borkin, 1993, for discussion of species
boundaries within these groups). However, paraphyly of
the 2n ¼ 24 species was already indicated by an allo-
zyme analysis of Eastern and Western brown frogs
(Green and Borkin, 1993), with R. arvalis and R. am-
urensis standing basal to a mixed clade of Western andEastern Palearctic species. We found strong evidence
that R. arvalis, the 2n ¼ 24 species, is member of the R.
temporaria species group. This adds support to the as-
sumptions of Green and Borkin (1993) that a 2n ¼ 24
genotype evolved convergently among Palearctic brown
frogs.
4.2. Timing of speciation among Western Palearctic
brown frogs
Speciation within several European amphibian gen-
era can be attributed to the end of the Messinian salinity
crisis (e.g., Salamandra, water frogs of the genus Rana,
subgenus Pelophylax; see Veith et al., 1998; Beerli,
1994). A sudden re-flooding of the formerly desiccated
Mediterranean basin at 5.9–5.5 mya (Riding et al., 1998)separated many amphibian populations that had spread
throughout the basin during the Messinian.
The Messinian salinity crisis was associated with
drastic changes towards a cooler and arid climate in the
circum-Mediterranean (Hs€uu et al., 1977). Nevertheless,
dispersal of amphibians throughout the basin was pos-
sible even for montane taxa (e.g., Salamandra; Lanza
and Vanni, 1987; Veith et al., 1998). To date, almost allEuropean amphibian genera are present on larger
Mediterranean islands. Only spade-foot toads (Pelo-
bates), the widespread newt genus Triturus, and brown
frogs are restricted to a few coastal islands that they
have colonised in recent times (Lanza and Vanni, 1987).
Brown frogs that had dispersed during the Messinian
crisis should have found suitable habitats on large is-
lands such as Corsica, Sardinia, or Crete. It is thereforeastonishing that they are currently absent. Two expla-
nations seem plausible: (i) brown frogs in fact reached
Mediterranean islands during the Messinian, but sub-
sequently went extinct; (ii) brown frogs did not live in
the circum-Mediterranean during the Messinian salinity
crisis. Two lines of evidence advocate the second hy-
pothesis. First, apart from a single Holocene record of
R. cf. temporaria on Corsica (Vigne, 1985), no fossilbrown frogs are known from Mediterranean islands
(Holman, 1998). The oldest fossil records that can be
attributed to present day species (e.g., R. temporaria, R.
cf. arvalis, R. cf. latastei, R. cf. dalmatina) are known
from the late Pliocene (Roc�ek and Rage, 2000, and
references cited therein). Second, brown frogs are
montane or subalpine species that prefer cold and moist
habitats and breed in lowland habitats only towardsnorthern latitudes. The arid climate that dominated the
circum-Mediterranean during the salinity crisis (Hs€uu et
al., 1977) would have forced an ancestral brown frog to
retreat to isolated high elevation habitats. If so, a
Messinian split of major lineages should have been the
result. However, according to our estimate, brown frogs
diverged in the post-Messinian, about 4 mya. Bianco
(1990) discussed a similar scenario for primary fresh-water fish of the Mediterranean basin. Like Baranescu
(1983), he postulated that most of the present-day gen-
era reached Central Europe from eastern Asia during
the Miocene. Most of them were then established in
Europe in the Middle Miocene, however, they were
apparently absent in Mediterranean peninsular regions
and NW Africa, or occurred after the Messinian.
From where Western Palearctic brown frogs origi-nated remains still open. Boehme (2001) recently pub-
lished a fossil record that may link Western Palearctic
brown frogs to eastern Asia. However, a final solution
of this question necessitates the inclusion of Eastern and
Western Palearctic brown frogs as well as numerous
Asian genera of the subfamily Raninae.
But what accounted for brown frog radiation during
Pliocene? Considering that most modern brown frogsare cold-adapted (the single exception is R. latastei), we
require a moist climate during the Pliocene that allowed
for a substantial range expansion of an ancestral brown
frog. In fact, a long-lasting subtropical period of about 1
my during the Early Pliocene (M€uuller, 1985; Maldo-
nado, 1985) with only minor climatic oscillations should
have allowed for range expansion of any amphibian
groups, including brown frogs. Eustatic sea-level chan-ges induced the first periods of cooling 4 mya and ca. 3
mya (Wilson et al., 1999). A strong pan-oceanic drop of
temperature in combination with a substantial growth
of the Arctic ice sheet marked the onset of a series of
glaciations in the late Pliocene, ca. 2.4 mya (M€uuller,1985; Wilson et al., 1999). These post-Messinian climatic
fluctuations almost perfectly meet our estimates of ma-
jor speciation times in brown frogs, ca. 4, 3, and 2.4 mya(Table 3).
4.3. Oscillation per se may have promoted speciation
processes in Western Palearctic brown frogs
It seems that speciation of Western Palearctic brown
frogs was triggered by the onset of glacials with cycles of
320 M. Veith et al. / Molecular Phylogenetics and Evolution 26 (2003) 310–327

repeated cold (stadials) and warm (interstadials) peri-ods. However, why did single stadials of interstadials did
not have the same effect? It is obvious that despite on-
going climatic oscillations since the Late Pliocene and
throughout the Quaternary, a substantial subdivision of
extant brown frog lineages into more sublineages did
not occur (several biochemical and molecular studies on
intraspecific genetic variation of brown frogs are in line
with this: Capula, 1991; Arano et al., 1993; Rafinski andBabik, 2000; Veith et al., 2002).
The large and regularly occurring (on a major inter-
val of ca. 100,000 years) temperature changes during the
Quaternary and before may have had a negative effect
on gradual speciation following vicariance (Dynesius
and Jansson, 2000). Especially towards northern lati-
tudes, species range dynamics caused by climatic oscil-
lations favoured ecological generalism and vagility,which promote high regional population densities and
wide distributions. Vagility enhances gene flow, and this
predates differentiation that had evolved in isolation.
This may well explain the low degree of differentiation
among populations of widespread species such as R.
arvalis (Rafinski and Babik, 2000) and R. dalmatina
(unpublished data).
More specialised species like the southern mountain
endemics (e.g., R. graeca, R. iberica, and R. pyrenaica)
were probably ‘‘trapped’’ in their glacial refugia. Fast
climatic oscillations left little time for range expansions.
Evidence comes from paleontology. Pleistocene species-
specific brown frog records mostly lie within the species�present distribution (Fig. 7). The only exceptions are R.
arvalis, R. dalmatina, and R. graeca of which single
fossils are found outside their current distribution. But
why did southern endemics never escape from their re-
fugia, though they apparently persisted for at least 2.5
my? Hewitt (1996) developed a scenario for grasshopper
distribution as a consequence of climatic oscillations
that may also hold for montane brown frog endemics.Following a climatic amelioration, a montane brown
frog population has two ways to react: (i) it can move
upthe mountain (altitudinal reaction), or (ii) it can
migrate northward (latitudinal reaction). Both these
Fig. 7. Current distribution (grey) and Pleistocene fossil records (symbols) of five Western Palearctic brown frog species (according to Holman, 1998);
geographically close fossil sites are pooled; 1) lower Pleistocene records that are only affiliated as c.f. to the respective taxon.
M. Veith et al. / Molecular Phylogenetics and Evolution 26 (2003) 310–327 321

‘‘subpopulations’’ have three principle ways to respondto a troublesome subsequent cooling (Coope, 1994): (i)
they can evolve out of trouble, (ii) they can move out of
trouble, (iii) they may become extinct. Only island spe-
cies have to endure environmental changes on the spot.
Temperature probably changed during oscillations with
great rapidity and intensity (e.g., the transition from the
last glaciation to the present day interglacial occurred
within one human lifetime; Dansgaard et al., 1989).Assuming that rapid changes were common (Wilson
et al., 1999: p. 113), options (i) and (ii) did not exist for
latitudinally responding brown frog populations. Con-
sequently they went extinct, and with them all adapta-
tions they may have evolved through the colonisation
process. In contrast, populations that had shifted alti-
tudinally were able to escape extinction by simply
moving up and down the mountains due to short dis-tances between different temperature zones. Any species
that was able to survive the first change could, by
adopting the same strategy, survive succeeding ones. As
a consequence, and even if substantial latitudinal range
expansions may have occurred, populations evolved in
their refugia as if they had constantly been isolated.
Rana temporaria does not fit this model. It is the only
species that was recorded from ice-free areas during fullglacial times (Holman, 1998). Today, its northern dis-
tribution is more or less delimited by forest-free tundras
(Gasc et al., 1998). Therefore, its glacial refugia may wellhave been in the close vicinity of the east–west extended
southern tundra line or even close to the Arctic ice-sheet.
Increasing evidence from tree charcoal and mammalian
fossils suggest that southern refugia were supplemented
by multiple cryptic refugia in Central and Northern
Europe during the Pleistocene (Steward and Lister,
2001). This may also explain whyR. temporaria harbours
the largest degree of genetic variation among WesternPalearctic brown frogs (e.g., Reh and Seitz, 1990).
4.4. Concluding remarks
All lines of evidence advocate a post-Messinian spe-
ciation of brown frogs, originating from an ancestor
that had invaded Europe from Asia during the Early
Pliocene. Subsequent major radiations among WesternPalearctic brown frogs seem to be triggered by the on-
sets of drastic climatic oscillations. It becomes obvious
that such climatic oscillations marked simultaneous
speciation events in different lineages (Fig. 8). Tempo
and length of cold periods seem to have been as im-
portant as the strength of the initial oscillation. Even if
the ice-sheets and permafrost did not reach the Medi-
terranean (which in principle was established geologi-cally and climatically some 3.2mya; Blondel and
Aronson, 1999), its marked effect on the Mediterranean
Fig. 8. Inference of fluctuation of surface-water temperature during the late Miocene to the Recent in the Mediterranean (after M€uuller, 1985) based
on calcareous nannoplankton records, and estimated time of speciation in different brown frog lineages. Minor climatic oscillations also occurred on
a regular scale during periods of stable nannoplankton records in the Early Quaternary and the Early Pliocene (Ruddiman and Raymo, 1988; Wilson
et al., 1999).
322 M. Veith et al. / Molecular Phylogenetics and Evolution 26 (2003) 310–327
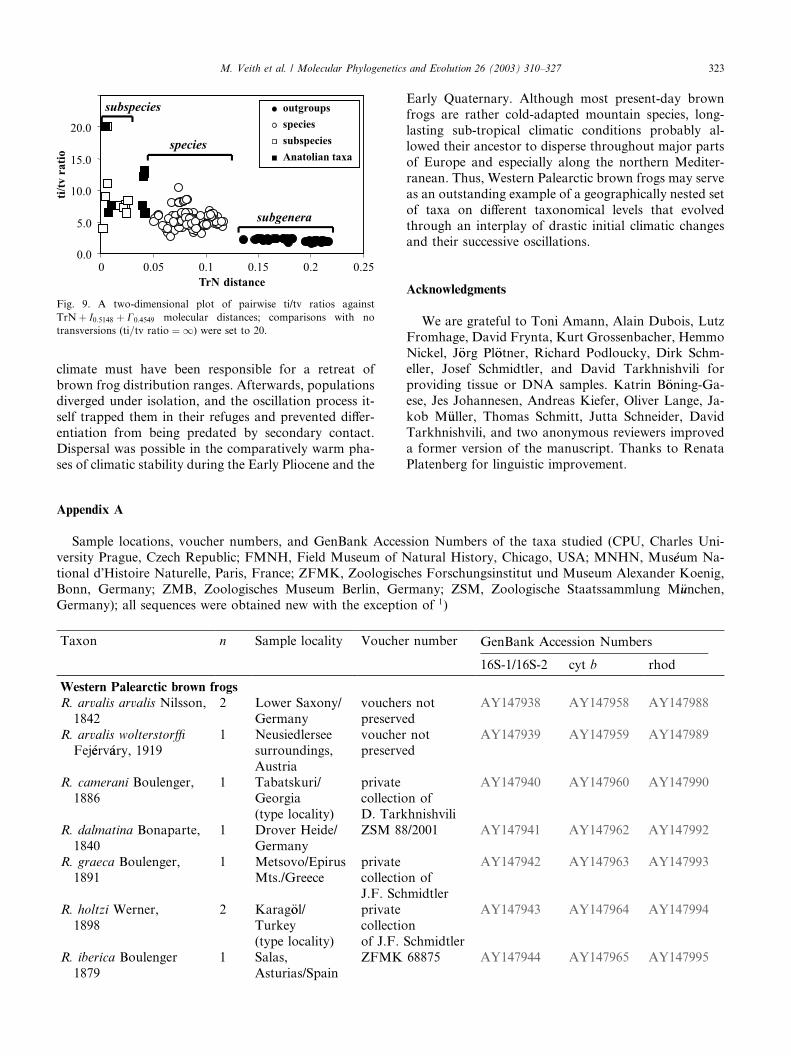
climate must have been responsible for a retreat of
brown frog distribution ranges. Afterwards, populationsdiverged under isolation, and the oscillation process it-
self trapped them in their refuges and prevented differ-
entiation from being predated by secondary contact.
Dispersal was possible in the comparatively warm pha-
ses of climatic stability during the Early Pliocene and the
Early Quaternary. Although most present-day brownfrogs are rather cold-adapted mountain species, long-
lasting sub-tropical climatic conditions probably al-
lowed their ancestor to disperse throughout major parts
of Europe and especially along the northern Mediter-
ranean. Thus, Western Palearctic brown frogs may serve
as an outstanding example of a geographically nested set
of taxa on different taxonomical levels that evolved
through an interplay of drastic initial climatic changesand their successive oscillations.
Acknowledgments
We are grateful to Toni Amann, Alain Dubois, Lutz
Fromhage, David Frynta, Kurt Grossenbacher, Hemmo
Nickel, J€oorg Pl€ootner, Richard Podloucky, Dirk Schm-eller, Josef Schmidtler, and David Tarkhnishvili for
providing tissue or DNA samples. Katrin B€ooning-Ga-
ese, Jes Johannesen, Andreas Kiefer, Oliver Lange, Ja-
kob M€uuller, Thomas Schmitt, Jutta Schneider, David
Tarkhnishvili, and two anonymous reviewers improved
a former version of the manuscript. Thanks to Renata
Platenberg for linguistic improvement.
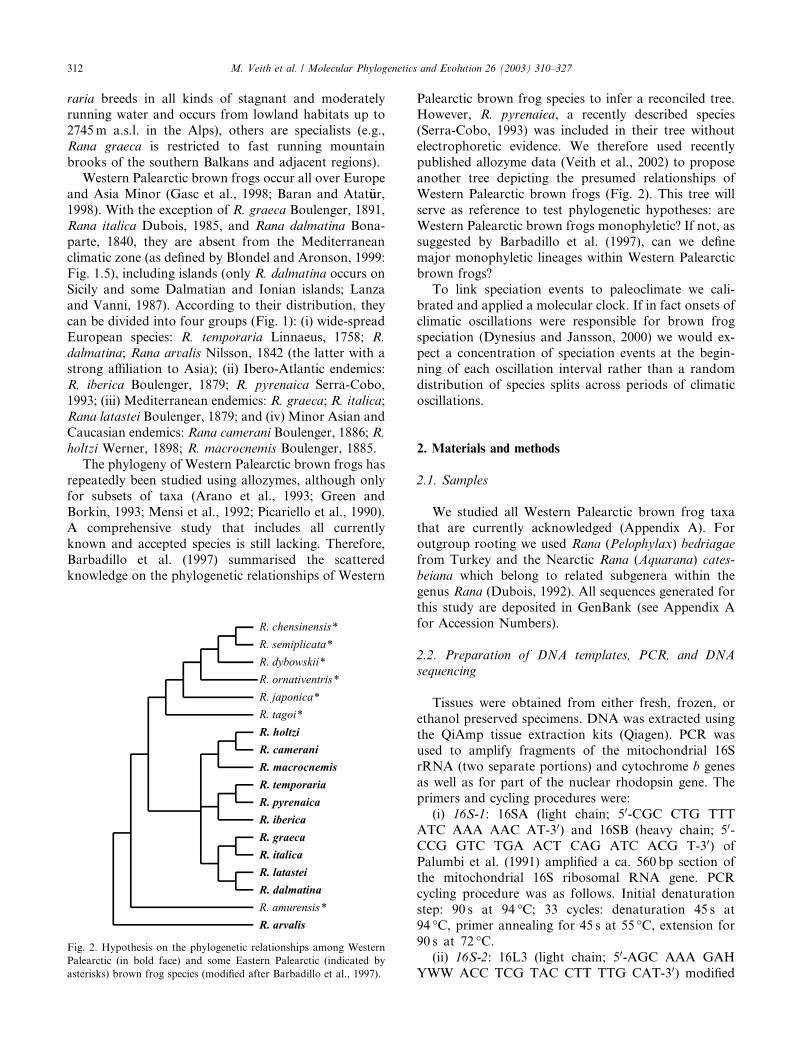
Fig. 9. A two-dimensional plot of pairwise ti/tv ratios against
TrNþ I0:5148 þ C0:4549 molecular distances; comparisons with no
transversions (ti=tv ratio ¼ 1) were set to 20.
Appendix A
Sample locations, voucher numbers, and GenBank Accession Numbers of the taxa studied (CPU, Charles Uni-
versity Prague, Czech Republic; FMNH, Field Museum of Natural History, Chicago, USA; MNHN, Mus�eeum Na-
tional d�Histoire Naturelle, Paris, France; ZFMK, Zoologisches Forschungsinstitut und Museum Alexander Koenig,
Bonn, Germany; ZMB, Zoologisches Museum Berlin, Germany; ZSM, Zoologische Staatssammlung M€uunchen,Germany); all sequences were obtained new with the exception of 1)
Taxon n Sample locality Voucher number GenBank Accession Numbers
16S-1/16S-2 cyt b rhod
Western Palearctic brown frogs
R. arvalis arvalis Nilsson,
1842
2 Lower Saxony/
Germany
vouchers not
preserved
AY147938 AY147958 AY147988
R. arvalis wolterstorffi
Fej�eerv�aary, 19191 Neusiedlersee
surroundings,
Austria
voucher notpreserved
AY147939 AY147959 AY147989
R. camerani Boulenger,
1886
1 Tabatskuri/
Georgia
(type locality)
private
collection of
D. Tarkhnishvili
AY147940 AY147960 AY147990
R. dalmatina Bonaparte,
1840
1 Drover Heide/
Germany
ZSM 88/2001 AY147941 AY147962 AY147992
R. graeca Boulenger,1891
1 Metsovo/EpirusMts./Greece
privatecollection of
J.F. Schmidtler
AY147942 AY147963 AY147993
R. holtzi Werner,
1898
2 Karag€ool/Turkey
(type locality)
private
collection
of J.F. Schmidtler
AY147943 AY147964 AY147994
R. iberica Boulenger
1879
1 Salas,
Asturias/Spain
ZFMK 68875 AY147944 AY147965 AY147995
M. Veith et al. / Molecular Phylogenetics and Evolution 26 (2003) 310–327 323

Appendix A (continued)
Taxon n Sample locality Voucher number GenBank Accession Numbers
16S-1/16S-2 cyt b rhod
R. italica Dubois,1985
1 Naples/Italy voucher notpreserved
AY147945 AY147966 AY147996
R. latastei Boulenger,
1879
2 Campagna,
Seseglio 2 km
SW Chiasso/Italy
vouchers not
preserved
AY147946 AY147967 AY147997
R. macrocnemis
macrocnemis
Boulenger, 1885
2 Uludag/Turkey
(type
locality)
private collection
of J.F. Schmidtler
AY147947 AY147968 AY147998
R. macrocnemis
tavasensis Baran
and Atat€uur, 1986
1 Akdag nearTavas/
Turkey (type
locality)
MNHN 2000.660and 2000.661
AY147949 AY147970 AY148000
R. macrocnemis
pseudodalmatina
Eiselt and
Schmidtler, 1971
1 Mazandaran
province/Iran
CUP AMPH/IRA/
013; see Frynta
et al. (1997)
AY147948 AY147969 AY147999
R. pyrenaica
Serra-Cobo, 19932 Zuriza, Arag�oon/
SpainZFMK65447-65448
AY147950 AY147971 AY148001
R. temporaria
‘‘aragonensis’’
Palanca-Soler,
Rodriguez Vieites
and Su�aarez Mart�ıınez,1998
1 Respomuso, type
locality/Spain
ZFMK 65430 AY147951 AY147972 AY148002
R. temporaria canigonensis
Boub�eee, 18331 Mt. Canigou/
France (type
locality)
MNHN 1997.4347 AY147952 AY147973 AY148003
R. temporaria ‘‘gasseri’’ 1 surroundings of
Gerde/France
MNHN 1997.4910 AY147953 AY147974 AY148004
R. temporaria honnorati
H�eeron-Royer, 1881
2 Faillefeu Bas
Granges and Le
Brusquet/France
vouchers not
preserved
AY147954 AY147975 AY148005
R. temporaria
parvipalmata
Seoane, 1885
1 Serra deCapelada/Spain
(vicinity of type
locality)
ZSM 88/2001 AY147955 AY147976 AY148006
R. temporaria
temporaria Linnaeus,
1758
3 Koblenz/
Germany
ZFMK 69883-
69885
AY147956 AY147977 AY148007
Eastern Palearctic brown frogsRana amurensis 1 Mongolia not available AB0588851 ) AF2050941 )
Rana dybowskii 1 Japan
(Tsushima)
not available AB0588731 ) AF0773991 )
Rana japonica 1 Japan
(Hiroshima)
not available AB0588761 ) AF0773951 )
R. ornativentris 1 Japan (Aomori) not available AB0588751 ) AF0774001 )
R. pirica 1 Japan (Sapporo) not available AB0588721 ) AF0773981 )
water frogsR. bedriagae Camerano,
1882
2 Marmaris/
Turkey
vouchers not
preserved
AY147937 AY147957 AY148008
324 M. Veith et al. / Molecular Phylogenetics and Evolution 26 (2003) 310–327

Appendix A (continued)
Taxon n Sample locality Voucher number GenBank Accession Numbers
16S-1/16S-2 cyt b rhod
R. lessonae
Camerano, 18821 Italy voucher not
preservedAY147982 AY148012
R. epeirotica
Schneider, Sofianidou
and Kyriakopoulou-
Sklavounou, 1984
1 Greece ZMB 47711 AY147981 AY148011
R. perezi Seoane, 1885 1 Narbonne/
France
private collection
of Dirk Schmeller
AY147985 AY148015
R. ridibunda Pallas, 1771 1 Greece ZMB 49267 AY147983 AY148013R. saharica Boulenger,
1913
1 Bizente/Tunisia private collection
of Dirk Schmeller
AY147984 AY148014
R. cerigensis Beerli,
Hotz, Heppich
and Uzzell, 1994
1 Rhodes/Greece voucher not
preserved
AY147979 AY148009
R. cretensis Beerli, Hotz,
Heppich and Uzzell,
1994
1 Crete/Greece voucher not
preserved
AY147980 AY148010
outgroups
R. catesbeiana Shaw,
1802
1 frog farm/Java private collection
of Michael Veith
AY147978 AY147961 AY147991
Fejervarya limnocharis
Gravenhorst,
1829
1 Sidikalang,
Sumatra/
Indonesia
FMNH 256768 AY147986 AY147991
Appendix B. Taxonomic conclusions
The subspecies Rana m. tavasensis, R. m. pseudodal-
matina, and the (R. m. macrocnemis, R. camerani, and R.
holtzi) clade are basal lineages within the Anatolian
clade. In contrast, the species R. holtzi and R. camerani
form a monophylum with R. m. macrocnemis. This
makes Rana macrocnemis paraphyletic. On the basis of
16S haplotypes of Anatolian mountain frogs from 40
populations, Veith et al. (in press) already showed that
morphological assignment of species status to popula-tions is impossible and has led to much confusion. This
calls for a taxonomic revision.
In doing so, we (i) intend to stay as close as possible
to current taxonomy and (ii) to apply taxonomic cate-
gories in accordance to other brown frog lineages.
TrNþ I0:5148 þ C0:4549 distances among Anatolian
brown frogs fall into two categories: species and sub-
species (Fig. 9). The latter refers to comparisons amongR. m. macrocnemis, R. camerani, and R. holtzi. We
therefore regard them as conspecific: R. macrocnemis
macrocnemis, R. m. camerani, and R. m. holtzi. This
opinion was repeatedly advocated by various authors
(reviewed in Veith et al., in press). Species level differ-
entiation, although at the lower end within brown frogs,
separates three lineages to which we assign species rank:
R. macrocnemis, R. tavasensis, and R. pseudodalmatina.
References
Arano, B., Esteban, M., Herrero, P., 1993. Evolutionary divergence of
the Iberian brown frogs. Ann. Sci. Nat. Zool. 14 (13), 49–57.
Baran, I., Atat€uur, M.K., 1998. Turkish herpetofauna (amphibians and
reptiles). Ankara.
Baranescu, P., 1983. On the affinities and derivation of the aquatic
fauna of High Asia. Rev. Roum. Biol. Biol. Anim. 28, 97–101.
Barbadillo, L.J., Garc�ııa-Paris, M., Sanch�ıız, B., 1997. Or�ııgenes y
relaciones evolutivas de la herpetofauna Ib�eerica. In: Pleguezuelos,
J.M. (Ed.), Distribuci�oon y biogeograf�ııa de los anfibos y reptiles en
Espana y Portugal. Monograf�ııas de Herpetolog�ııa, vol. 3. Granada,
pp. 47–100.
Beerli, P., 1994. Genetic isolation and calibration of an average protein
clock in western Palearctic water frogs of the Aegean region. Ph.D.
Thesis, Z€uurich.
Bianco, P.G., 1990. Potential role of the paleohistory of the Mediter-
ranean and Paratethys basin on the early dispersal of Euro-
Mediterranean freshwater fishes. Ichthyol. Explor. Freshwaters 1,
167–184.
Blondel, J., Aronson, J., 1999. Biology and Wildlife of the Mediter-
ranean Region. Oxford University Press, New York.
M. Veith et al. / Molecular Phylogenetics and Evolution 26 (2003) 310–327 325

Boehme, M., 2001. The oldest representative of a brown frog
(Ranidae) from the Early Miocene of Germany. Acta Pal. Polonica
46, 119–124.
Bossuyt, F., Milinkovitch, C.M., 2000. Convergent adaptive radiation
in Madagascan and Asian ranid frogs reveal covariation between
larval and adult traits. Proc. Natl. Acad. Sci. USA 97 (12), 6585–
6590.
Bush, G.L., 1994. Sympatric speciation in animals: new wine in old
bottles. Trends Ecol. Evol. 9, 285–288.
Caccone, A., Milinkovitch, M.C., Sbordoni, V., Powell, R.J., 1997.
Mitochondrial DNA rates and biogeography in European newts
(genus Euproctus). Syst. Biol. 46, 126–144.
Cao, Y., Adachi, J., Hasegawa, M., 1998. Comment on the Quartet
Puzzling method for finding maximum-likelihood tree topologies.
Mol. Biol. Evol. 15, 87–89.
Capula, M., 1991. Allozyme variation in Rana latastei populations
(Amphibia: Ranidae) from Northern Italy and Istria (NW Yugo-
slavia): biogeographic inferences from electrophoretic data. Zool.
Anz. 227, 1–12.
Coope, G.R., 1994. The response of insect faunas to glacial-interglacial
climatic fluctuations. Philos. Trans. R. Soc. London B 344, 19–26.
Coyne, J.A., Orr, H.A., 1989. Two rules of speciation. In: Otte, D.,
Endler, J.A. (Eds.), Speciation and Its Consequences. Sinauer,
Massachusetts, pp. 180–207.
Dansgaard, W., White, J.W.C., Johnson, S.J., 1989. The abrupt
termination of the Younger Dryas event. Nature 339, 532–533.
Demirsoy, A., 1996. Amfibiler. Ankara.
Dieckmann, U., Doebeli, M., 1999. On the origin of species by
sympatric speciation. Nature 400, 354–357.
Dubois, A., 1985. Notes sur les grenouilles brunes (groupe de Rana
temporaria Linn�ee, 1758). IV. Note pr�eeliminaire sur Rana graeca
Boulenger, 1891. Alytes 4, 135–138.
Dubois, A., 1992. Notes sur la classification des Ranidae (Amphibiens
Anoures). Bull. Mens. Soc. Linn. Lyon. 61, 305–352.
Dynesius, M., Jansson, R., 2000. Evolutionary consequences of
changes in species� geographical distribution driven by Milankov-
itch climate oscillations. Proc. Natl. Acad. Sci. USA 97, 9115–9120.
Farris, J.S., K€aallersj€oo, M., Kluge, A.G., Bult, C., 1995. Testing
significance of incongruence. Cladistics 10, 315–319.
Felsenstein, J., 1985. Confidence limits on phylogenies: an approach
using the bootstrap. Evolution 39, 783–791.
Frynta, D., Moravec, J., Chihakova, J., Sadlo, J., Hodkova, Z.,
Kaftan, M., Kodym, P., Kral, D., Pitule, V., Sejne, L., 1997.
Results of the Czech Biological Expedition to Iran. Part 1: Notes
on the distribution of amphibians and reptiles. Acta Soc. Zool.
Bohem. 61, 3–17.
Gasc, J.-P., Cabela, A., Crnobrnja-Isailovic, J., Dolmen, D., Gros-
senbacher, K., Haffner, P., Lescure, J., Martens, H., Mart�iinez-
Rica, J.P., Maurin, H., Oliveira, M.E., Sofianidou, T.S., Veith, M.,
Zuiderwijk, A., 1997. Atlas of amphibians and reptiles in Europe.
Societas Europaea Herpetologica and Mus�eeum national d�Histoire
naturelle, Paris.
Green, D.M., Borkin, L.J., 1993. Evolutionary relationships of Eastern
Palearctic brown frogs, genus Rana: paraphyly of the 24-chromo-
some species group and the significance of chromosome number
change. Zool. J. Linn. Soc. 109, 1–25.
Hays, J.D., Imbrie, J., Shackleton, N.J., 1976. Variation in the Earth�sorbit: pacemaker of the ice age. Science 194, 1121–1132.
Hedges, S.B., 1992. The number of replications needed for accurate
estimation of the bootstrap P value in phylogenetic studies. Mol.
Biol. Evol. 9, 366–369.
Hedges, S.B., 1994. Molecular evidence for the origin of birds. Proc.
Nat. Acad. Sci. USA 91, 2621–2624.
Hewitt, G.M., 1996. Some genetic consequences of ice ages, and their
role in divergence and speciation. Biol. J. Linn. Soc. 58, 247–276.
Hillis, D.M., 1984. Misuse and modification of Nei�s genetic distance.
Syst. Zool. 3, 238–240.
Holman, J.A., 1998. Pleistocene Amphibians and Reptiles in Britain
and Europe. Oxford University Press, New York/Oxford.
Hs€uu, K.J., Montadert, L., Bernoulli, D., Cita, M.B., Erickson, A.,
Garrison, R.E., Kidd, R.B., M�eelier�ees, F., M€uuller, C., Wright, R.,
1977. History of the Mediterranean salinity crisis. Nature 267, 399–
403.
Huelsenbeck, J.P., Bull, J.J., Cunningham, C.W., 1996. Combining
data in phylogenetic analysis. TREE 11, 152–158.
Huelsenbeck, J.P., Crandall, K.A., 1997. Phylogeny estimation and
hypothesis testing using maximum likelihood. Ann. Rev. Ecol.
Syst. 28, 437–466.
Huelsenbeck, J.P., Hillis, D.M., 1993. Success of phylogenetic methods
in the four-taxon case. Syst. Biol. 42, 247–264.
Huelsenbeck, J.P., Ronquist, F.R., 2001. MrBayes: Bayesian inference
of phylogenetic trees. Bioinformatics 17, 754–755.
Huelsenbeck, J.P., Ronquist, F., Nielsen, R., Bollback, J.P., 2001.
Bayesian inference of phylogeny and its impact on evolutionary
biology. Science 294, 2310–2314.
King, M., 1990. Animal Cytogenetics, vol.4: Chordata 2: Amphibia.
Borntraeger, Berlin/Stuttgart.
Kishino, H., Hasegawa, M., 1989. Evaluation of the maximum
likelihood estimate of the evolutionary tree topologies from
DNA sequence data, and the branching order in Hominoidea. J.
Mol. Evol. 29, 170–179.
Klassen, G.J., Mool, R.D., Locke, A., 1991. Consistency indices and
random data. Syst. Zool. 40, 446–457.
Kocher, T.D., Thomas, W.K., Meyer, A., Edwards, S.V., P€aa€aabo, S.,Villablanca, F.X., Wilson, A.C., 1989. Dynamics of mitochondrial
DNA evolution in animals: amplification and sequencing with
conserved primers. Proc. Natl. Acad. Sci. USA 86, 6196–6200.
Kumar, S., 1996. PHYLTEST: Phylogeny Hypothesis Testing Soft-
ware. The Pennsylvania State University, Pennsylvania.
Kuzmin, S.L., 1999. The Amphibians of the Former Soviet Union.
Pensoft, Sofia/Moscow.
Lanza, B., Vanni, S., 1987. Hypotheses on the origin of the
Mediterranean island batrachofauna. Bull. Soc. Zool. France
112, 179–196.
Lockhart, P.J., Steel, M.A., Hendy, M.D., Penny, D., 1994. Recov-
ering evolutionary trees under a more realistic model of sequence
evolution. Mol. Biol. Evol. 11, 605–612.
Lowe, J.J., Walker, M.J.C., 1997. Reconstructing Quaternary Envi-
ronments, second ed. Longman, London.
Maldonado, A., 1985. Evolution of the Mediterranean basins and a
detailed reconstruction of the Cenozoic paleooceanography. In:
Margalef, R. (Ed.), Key Environments: Western Mediterranean.
Pergamon Press, Oxford, pp. 17–59.
Martin, A.P., Naylor, G.J.P., Palumbi, S.R., 1992. Rates of mito-
chondrial DNA evolution in sharks are slow compared with
mammals. Nature 357, 153–155.
Mayr, E., Ashlock, P.D., 1991. Principles of Systematic Zoology,
second ed. McGraw-Hill, New York.
Mensi, P., Lattes, A., Marcario, B., Salvidio, S., Giacoma, C., Baletto,
E., 1992. Taxonomy and evolution of European brown frogs. Zool.
J. Linn. Soc. 104, 293–311.
Mindel, D.P., Knight, A., Baer, C., Huddlestone, C.J., 1996. Slow
rates of molecular evolution in birds and the metabolic rate and
body temperature hypothesis. Mol. Biol. Evol. 13, 422–426.
Miura, I., Nishioka, M., Borkin, L., Wu, Z., 1995. The origin of the
brown frogs with 2n ¼ 24 chromosomes. Experientia 51, 179–188.
M€uuller, C., 1985. Late Miocene to recent Mediterranean biostratigra-
phy and paleoenvironments based on calcareous nannoplankton.
In: Stanley, D.J., Wezel, F.-C. (Eds.), Geological Evolution of the
Mediterranean Basin. Springer, New York, pp. 475–481.
Nei, M., 1972. Genetic distance between populations. Am. Nat. 106,
283–292.
Odierna, G., Aprea, G., Arribas, O., Capriglione, T., 2001. A
chromosomal study of the Pyrenean endemic brown frog species,
326 M. Veith et al. / Molecular Phylogenetics and Evolution 26 (2003) 310–327

Rana pyrenaica, and various Italian populations of R. dalmatina
and R. italica. Folia Zool. 50, 55–63.
Oosterbroek, P., Arntzen, J.W., 1992. Aera-cladograms of Circum-
Mediterranean taxa in relation to Mediterranean paleogeography.
J. Biogeography 19, 3–20.
Palumbi, S., Martin, A., Romano, S., McMillan, W.O., Stice, L.,
Grabowski, G., 1991. The simple fool�s guide to PCR, Version 2.
Honolulu, Hawai.
Picariello, O., Scillitani, G., Cretella, M., 1990. Electrophoretic data
supporting the specific rank of the frog Rana graeca italica Dubois,
1985. Amph.-Rept. 11, 189–192.
Pook, C.E., W€uuster, W., Thorpe, R.S., 2000. Historical biogeography
of the western rattlesnake (Serpentes: Viperidae: Crotalus viridis),
inferred from mitochondrial DNA sequence information. Mol.
Phyl. Evol. 15, 269–282.
Posada, D., Crandall, K.A., 1998. MODELTEST: testing the model of
DNA substitution. Bioinformatics 14, 817–818.
Rafinski, J., Babik, W., 2000. Genetic differentiation among northern
and southern populations of the moor frog Rana arvalis Nilsson in
central Europe. Heredity 84, 610–618.
Rand, D.M., 1994. Thermal habitat, metabolic rate and the evolution
of mitochondrial DNA. TREE 9, 125–131.
Rannala, B., Yang, Z., 1996. Probability distribution of molecular
evolutionary trees: a new method for phylogenetic inference. J.
Mol. Evol. 43, 304–311.
Reed, R.D., Sperling, F.A.H., 1999. Interaction of process partitions
in phylogenetic analysis: an example from the swallowtail butterfly
genus Papilio. Mol. Biol. Evol. 16, 286–297.
Reh, W., Seitz, A., 1990. The influence of land-use on the genetic
structure of populations of the common frog Rana temporaria.
Biol. Cons. 54, 239–249.
Rice, W.R., 1989. Analyzing tables of statistical tests. Evolution 43,
223–225.
Riding, R., Braga, J.C., Martin, J.M., S�aanchez-Almazo, I.M., 1998.
Mediterranean Messinian salinity crisis: constraints from a coeval
marginal basin, Sorbas, south-eastern Spain. Marine Geol. 146, 1–
20.
Roc�ek, Z., Rage, L.-C., 2000. Tertiary anura of Europe, Africa, Asia,
North America, and Australia. In: Heatwole, H., Carrol, R.L.
(Eds.), Amphibian Biology, vol. 4, Palaeontology. Surrey Beatty &
Sons, USA, pp. 1332–1337.
Rodr�ııguez, F., Oliver, J.F., Mar�ıın, A., Medina, J.R., 1990. The general
stochastic model of nucleotide substitution. J. Theoret. Biol. 142,
485–501.
Roe, B.A., Din-Pow, M., Wilson, R.K., Wong, J.F., 1985. The
complete nucleotide sequence of the Xenopus leavis mitochondrial
genome. J. Biol. Chem. 260, 9759–9774.
Rosen, D.E., 1978. Vicariant pattern and historical explanation in
biogeography. Syst. Zool. 27, 159–313.
Ruddiman, W.F., Raymo, M.E., 1988. Northern hemisphere climate
r�eegimes during the past 3 ma: possible tectonic connections. Philos.
Trans. R. Soc. London B 318, 411–430.
Saitou, N., Nei, M., 1987. The neighbor-joining method: a new
method for reconstructing phylogenetic trees. Mol. Biol. Evol. 4,
406–425.
Scherer, S., 1990. The protein molecular clock. In: Hecht, M.K.,
Wallace, B., Mcintyre, R.J. (Eds.), Evolutionary Biology, vol. 24,
pp. 83–106.
Schliewen, U.K., Tautz, D., P€aa€aabo, S., 1994. Sympatric speciation
suggestedbymonophyly of crater lake cichlids.Nature 368, 629–632.
Schmidt, H.A., Strimmer, K., Vingron, M., von Haeseler, A., 2000.
TREE-PUZZLE, version 5.0. M€uunchen.
Serra-Cobo, J., 1993. Descripci�oon de una nueva especie europea de
rana parda (Amphibia, Anura, Ranidae). Alytes 11, 1–15.
Shimodaira, H., Hasegawa, M., 1999. Multiple comparison of log-
likelihoods with applications to phylogenetic inference. Mol. Biol.
Evol. 16, 1114–1116.
Steel, M.A., Lockhart, P.J., Penny, D., 1993. Confidence in evolu-
tionary trees from biological sequence data. Nature 364, 440–442.
Steward, J.R., Lister, A.M., 2001. Cryptic northern refugia and the
origin of the modern biota. TREE 16, 608–613.
Strimmer, K., von Haeseler, A., 1996. Quartet puzzling: a quartet
maximum likelihood method for reconstructing tree topologies.
Mol. Biol. Evol. 13, 964–969.
Sullivan, J., Swofford, D.L., 2001. Should we use model-based
methods for phylogenetic inference when we know that assump-
tions about among-site rate variation and nucleotide substitution
pattern are violated? Syst. Biol. 50, 723–729.
Swofford, D.L., 2001. Paup*: Phylogenetic Analysis Using Parsimony
and Other Methods, Version 4.0b8a. Sinauer Associates, Sunder-
land/Massachusetts.
Taberlet, P., Fumagalli, L., Wust-Saucy, A.-G., Cosson, J.-F., 1998.
Comparative phylogeography and postglacial colonization routes
in Europe. Mol. Ecol. 7, 453–464.
Takezaki, N., Rzhetsky, A., Nei, M., 1995. Phylogenetic test of the
molecular clock and linearized trees. Mol. Biol. Evol. 12, 823–833.
Tamura, K., Nei, M., 1993. Estimation of the number of nucleotide
substitutions in the control region of mitochondrial DNA in
humans and chimpanzee. Mol. Biol. Evol. 10, 512–526.
Veith, M., Steinfartz, S., Zardoya, R., Seitz, A., Meyer, A., 1998. A
molecular phylogeny of �true� salamanders (family Salamandridae)
and the evolution of terrestriality of reproductive modes. J. Zool.
Syst. Evolut. Res. 36, 7–16.
Veith, M., Vences, M., Rodriguez Vieites, D., Nieto Roman, S.,
Palanca-Soler, A., 2002. Genetic differentiation and population
structure within the Spanish Rana temporaria complex (Amphibia:
Ranidae). Folia Zool., 51, in press.
Veith, M., Schmidtler, J.F., Kosuch, J., Baran, I., Seitz, A., in press.
Paleoclimatic changes explain Anatolian mountain frog evolution:
a test for alternating, vicariance and dispersal events. Mol. Ecol.
Vigne, J.-D., 1985. Les amphibiens du Quarternaire d�Araguina-
Sennola Bonfacio: pr�eesence d�une grenouille rousse dans les
niveaux pr�eehistorique de Corse. Bull. Soc. Herp. France 35, 13–16.
West, F.R.S., 1988. The record of the cold stage. Philos. Trans. R. Soc.
London B 318, 505–522.
Whelan, S., Li�oo, P., Goldman, N., 2001. Molecular phylogenetics:
state-of-the-art methods for looking into the past. Trends Genet.
17, 262–272.
Wilson, R.C.L., Drury, S.A., Chapman, J.L., 1999. The Great Ice Age.
The Open University, London and New York.
M. Veith et al. / Molecular Phylogenetics and Evolution 26 (2003) 310–327 327


![V. SPECIATION A. Allopatric Speciation B. Parapatric Speciation (aka Local or Progenitor - Derivative) C. Adaptive Radiation D. Sympatric Speciation [Polyploidy]](https://img.pdfslide.net/doc/110x75/56649d3f5503460f94a186e2/v-speciation-a-allopatric-speciation-b-parapatric-speciation-aka-local.jpg)