Embed Size (px)
Citation preview
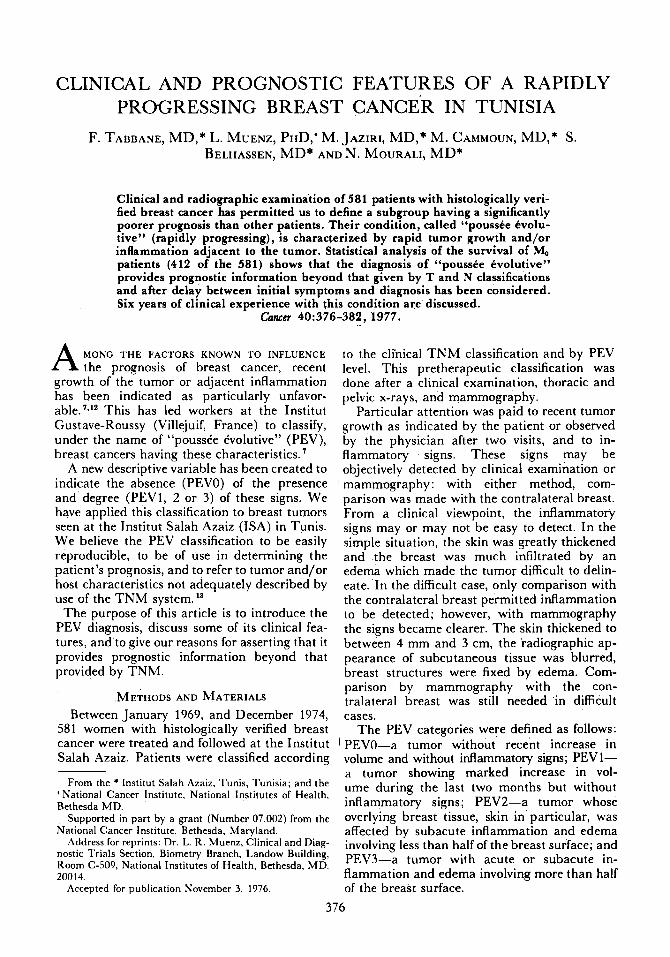
CLINICAL AND PROGNOSTIC FEATURES OF A RAPIDLY PROGRESSING BREAST CANCER IN TUNISIA
F. TABBANE, MD,* L. MUENZ, PHD,+ M. JAZIRI, MD,* M. CAMMOUN, MD,* S. BELHASSEN, MD* AND N. MOURALI, MD*
Clinical and radiographic examination of 581 patients with histologically veri- fied breast cancer has permitted us to define a subgroup having a significantly poorer prognosis than other patients. Their condition, called “pousste Cvolu- tive” (rapidly progressing), is characterized by rapid tumor growth and/or inflammation adjacent to the tumor. Statistical analysis of the survival of M, patients (412 of the 581) shows that the diagnosis of “pousste Cvolutive” provides prognostic information beyond that given by T and N classifications and after delay between initial symptoms and diagnosis has been considered. Six years of clinical experience with this condition are discussed.
Cancer 40:376-382, 1977.
MONC THE FACTORS KNOWN TO INFLUENCE A the prognosis of breast cancer, recent growth of the tumor or adjacent inflammation has been indicated as particularly unfavor- able.’,’’ This has led workers at the Institut Gustave-Roussy (Villejuif, France) to classify, under the name of “pousste Cvolutive” (PEV), breast cancers having these characteristics.’
A new descriptive variable has been created to indicate the absence (PEVO) of the presence and degree (PEVl, 2 or 3) of these signs. We have applied this classification to breast tumors seen at the Institut Salah Azaiz (ISA) in Tunis. We believe the PEV classification to be easily reproducible, to be of use in determining the patient’s prognosis, and to refer to tumor and/or host characteristics not adequately described by use of the TNM system.”
The purpose of this article is to introduce the PEV diagnosis, discuss some of its clinical fea- tures, and to give our reasons for asserting that it provides prognostic information beyond that provided by TNM.
METHODS AND MATERIALS Between January 1969, and December 1974,
581 women with histologically verified breast cancer were treated and followed at the Institut Salah Azaiz. Patients were classified according
From the * Institut Salah Azaiz, Tunis, Tunisia; and the ’ National Cancer Institute, National Institutes of Health, Bethesda MD.
Supported in part by a grant (Number 07.002) from the National Cancer Institute, Bethesda, Maryland.
Address for reprints: Dr. L. R. Muenz, Clinical and Diag- nostic Trials Section, Biometry Branch, Landow Building, Room (2-509, National Institutes of Health, Bethesda, MD. 20014.
Accepted for publication November 3, 1976.
to the clinical TNM classification and by PEV level. This pretherapeutic classification was done after a clinical examination, thoracic and pelvic x-rays, and mammography.
Particular attention was paid to recent tumor growth as indicated by the patient or observed by the physician after two visits, and to in- flammatory signs. These signs may be objectively detected by clinical examination or
I mammography: with either method, com- parison was made with the contralateral breast. From a clinical viewpoint, the inflammatory signs may or may not be easy to detect. In the simple situation, the skin was greatly thickened and the breast was much infiltrated by an edema which made the tumor difficult to delin- eate. In the difficult case, only comparison with the contralateral breast permitted inflammation to be detected; however, with mammography the signs became clearer. The skin thickened to between 4 mm and 3 cm, the radiographic ap- pearance of subcutaneous tissue was blurred, breast structures were fixed by edema. Com- parison by mammography with the con- tralateral breast was still needed in difficult cases.
The PEV categories were defined as follows: I PEVO-a tumor without recent increase in volume and without inflammatory signs; PEVl- a tumor showing marked increase in vol- ume during the last two months but without inflammatory signs; PEV2-a tumor whose overlying breast tissue, skin in particular, was affected by subacute inflammation and edema involving less than half of the breast surface; and PEV3-a tumor with acute or subacute in- flammation and edema involving more than half of the breast surface.
376
No. 1 RAPIDLY PROGRESSING BREAST CANCER Tabbane et al. 377
Note that these definitions did not specify the size of the tumor, but rather its rate of change and the extent of inflammatory involvement.
Surgical treatment of the tumor was not the first therapeutic step for patients diagnosed as having PEVl, 2 or 3 . ’ ~ ‘ ~ After biopsy, these pa- tients were surgically castrated if they were still ovulating or had entered menopause within less than three years. This permitted more rapid cessation of ovarian function than would ovarian irradiation and also permitted an intra-abdomi- nal search for metastases. Patients were then given 4500 rads of radiation to the mammary region and the axillary, internal mammary, and supraclavicular nodes. .The residual tumor and involved nodes were then given additional radi- ation to a total of 7500 to 9000 rads, according to the response obtained. Mastectomy was consid- ered six to 12 months after the end of radio- therapy according to the local disease state and if there was no evidence of distant dissemina- tion.
For patients whose tumors were classified as PEVO, M, the treatment was first surgery (for TI, Tz, T, less than 7 cm with No or N J followed by radiotherapy if N+; or first radiotherapy (for T, > 7 cm or TI, or all T with Nz or N3), the protocol in these cases is the same as for PEVl, 2 or 3.
After the end of their treatment, the patients were regularly followed both clinically and ra- diologically (every three months ’during the first three years, then every six months). Complete clinical examination, periodic chest and pelvic x-rays, or any other investigation (isotopic, cy- tological or histological) which seemed useful in view of new symptoms, were used in our pro- gram of surveillance.
Unfortunately, socio-economic conditions of- ten prevented us from knowing the exact date of death of patients. We chose, instead, to use the date of the first detection of‘metastasis as the survival endpoint; because of this, we are re- stricted to consideration of patients who are M, at diagnosis.
If PEV is indeed a distinct clinical entity not already subsumed by T N M classification, we would expect that for two hypothetical patients having the same value of T, N and M, the one with a diagnosis of PEV positive would have a significantly shorter survival than the one with- out this diagnosis.
RESULTS
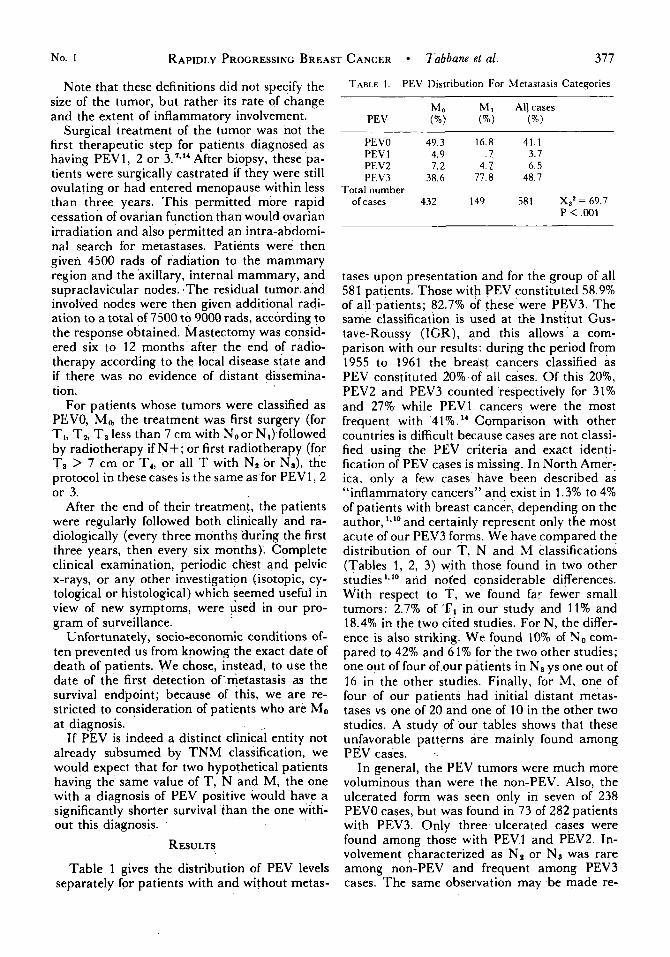
Table 1 gives the distribution of PEV levels separately for patients with and without metas-
TABLE 1. PEV Distribution For Metastasis Categories
PEVO 49.3 16.8 41.1 PEV 1 4.9 . 7 3.7 PEV2 7.2 4 . 7 6 .5 PEV3 38.6 77.8 48.7
Total number of cases 432 149 581 X,’= 69.7
P < ,001
tases upon presentation and for the group of all 581 patients. Those with PEV constituted 58.9% of all patients; 82.7% of these were PEV3. The same classification is used at the Institut Gus- tave-Roussy (IGR), and this allows a com- parison with our results: during the period from 1955 to 1961 the breast cancers classified as PEV constituted 20% of all cases. Of this 20%, PEV2 and PEV3 counted ‘respectively for 31% and 27% while PEVl cancers were the most frequent with 41%.” Comparison with other countries is difficult because cases are not classi- fied using the PEV criteria and exact identi- fication of PEV cases is missing. In North Amer- ica, only a few cases have been described as “inflammatory cancers’’ and exist in 1.3% to 4% of patients with breast cancer, depending on the author, ‘*‘O and certainly represent only the most acute of our PEV3 forms. We have compared the distribution of our T , N and M classifications (Tables 1 , 2, 3) with those found in two other studies l.lo and noted considerable differences. With respect to T, we found far fewer small tumors: 2.7% of TI in our study and 1 1 % and 18.4% in the two cited studies. For N, the differ- ence is also striking. We found 10% of N o com- pared to 42% and 61% for the two other studies; one out of four of our patients in N, ys one out of 16 in the other studies. Finally, for M, one of four of our patients had initial distant metas- tases vs one of 20 and one of 10 in the other two studies. A study of our tables shows that these unfavorable patterns are mainly found among PEV cases. .
In general, the PEV tumors were much more voluminous than were the non-PEV. Also, the ulcerated form was seen only in seven of 238 PEVO cases, but was found in 73 of 282 patients with PEV3. Only three ulcerated cases were found among those with PEVl and PEV2. In- volvement characterized as N, or N:, was rare among non-PEV and frequent among PEV3 cases. The same observation may be made re-
378 CANCER July 1977 Vol. 40
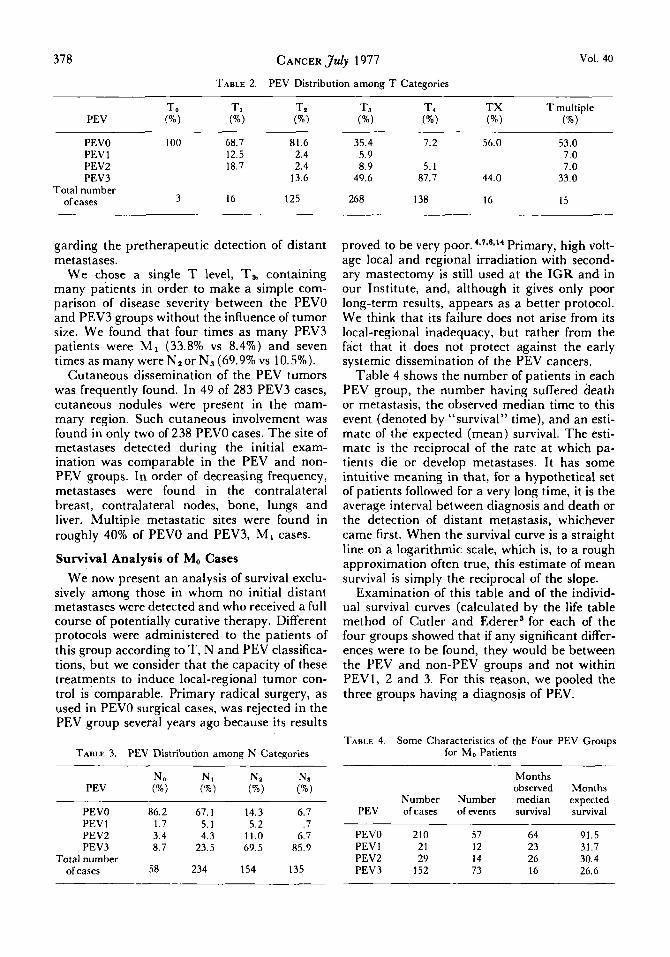
TABLE 2. PEV Distribution among T Categories
PEVO 100 68.7 81.6 PEV 1 12.5 2.4 PEVZ 18.7 2.4 PEV3 13.6
Total number of cases 3 16 125
35.4 7.2 56.0 53.0 5.9 7 .0 8 .9 5.1 7.0
49.6 87.7 44.0 33.0
268 138 16 15
garding the pretherapeutic detection of distant metastases.
We chose a single T level, T3, containing many patients in order to make a simple com- parison of disease severity between the PEVO and PEV3 groups without the influence of tumor size. We found that four times as many PEV3 patients were M I (33.8% vs 8.4%) and seven times as many were Nzor N, (69.9% vs 10.5%).
Cutaneous dissemination of the PEV tumors was frequently found. In 49 of 283 PEV3 cases, cutaneous nodules were present in the mam- mary region. Such cutaneous involvement was found in only two of 238 PEVO cases. The site of metastases detected during the initial exam- ination was comparable in the PEV and non- PEV groups. In order of decreasing frequency, metastases were found in the contralateral breast, contralateral nodes, bone, lungs and liver. Multiple metastatic sites were found in roughly 40% of PEVO and PEV3, MI cases.
Survival Analysis of M, Cases We now present an analysis of survival exclu-
sively among those in whom no initial distant metastases were detected and who received a full course of potentially curative therapy. Different protocols were administered to the patients of this group according to T, N and PEV classifica- tions, but we consider that the capacity of these treatments to induce local-regional tumor con- trol is comparable. Primary radical surgery, as used in PEVO surgical cases, was rejected in the PEV group several years ago because its results
TABLE 3. PEV Distribution among N Categories
PEVO 86.2 67.1 14.3 6.7 PEV 1 1.7 5.1 5.2 . 7 PEV2 3.4 4.3 11.0 6.7 PEV3 8.7 23.5 69.5 85.9
Total number of cases 58 234 154 135
proved to be very Primary, high volt- age local and regional irradiation with second- ary mastectomy is still used at the IGR and in our Institute, and, although it gives only poor long-term results, appears as a better protocol. We think that its failure does not arise from its local-regional inadequacy, but rather from the fact that it does not protect against the early systemic dissemination of the PEV cancers.
Table 4 shows the number of patients in each PEV group, the number having suffered death or metastasis, the observed median time to this event (denoted by “survival” time), and an esti- mate of the expected (mean) survival. The esti- mate is the reciprocal of the rate at which pa- tients die or develop metastases. It has some intuitive meaning in that, for a hypothetical set of patients followed for a very long time, it is the average interval between diagnosis and death or the detection of distant metastasis, whichever came first. When the survival curve is a straight line on a logarithmic scale, which is, to a rough approximation often true, this estimate of mean survival is simply the reciprocal of the slope.
Examination of this table and of the individ- ual survival curves (calculated by the life table method of Cutler and Ederer’ for each of the four groups showed that if any significant differ- ences were to be found, they would be between the PEV and non-PEV groups and not within PEV1, 2 and 3. For this reason, we pooled the three groups having a diagnosis of PEV.
TABLE 4. Some Characteristics of the Four PEV Groups for M, Patients
Months observed Months
Number Number median expected PEV of cases of events survival survival
PEVO 210 57 64 91.5 PEVl 21 12 23 31.7 PEVZ 29 14 26 30.4 PEV3 152 73 16 26.6
No. 1
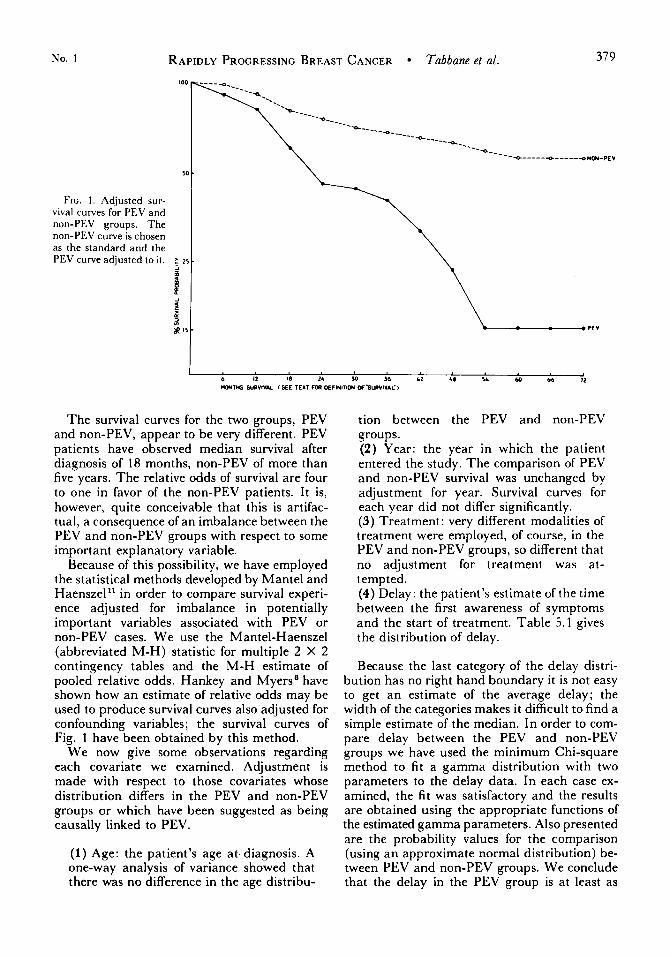
FIG. 1 . Adjusted sur- vival curves for PEV and non-PEV groups. The non-PEV curve is chosen as the standard and the PEV curve adjusted to it. ; 25 -
RAPIDLY PROGRESSING BREAST CANCER Tabbane et al .
-
379
f l
\ \
The survival curves for the two groups, PEV and non-PEV, appear to be very different. PEV patients have observed median survival after diagnosis of 18 months, non-PEV of more than five years. The relative odds of survival are four to one in favor of the non-PEV patients. It is, however, quite conceivable that this is artifac- tual, a consequence of an imbalance between the PEV and non-PEV groups with respect to some important explanatory variable.
Because of this possibility, we have employed the statistical methods developed by Mantel and Haenszel** in order to compare survival experi- ence adjusted for imbalance in potentially important variables associated with PEV or non-PEV cases. We use the Mantel-Haenszel (abbreviated M-H) statistic for multiple 2 X 2 contingency tables and the M-H estimate of pooled relative odds. Hankey and Myers' have shown how an estimate of relative odds may be used to produce survival curves also adjusted for confounding variables; the survival curves of Fig. 1 have been obtained by this method.
We now give some observations regarding each covariate we examined. Adjustment is made with respect to those covariates whose distribution differs in the PEV and non-PEV groups or which have been suggested as being causally linked to PEV.
(1) Age: the patient's age at.diagnosis. A one-way analysis of variance showed that there was no difference in the age distribu-
tion between the PEV and non-PEV groups. (2) Year: the year in which the patient entered the study. The comparison of PEV and non-PEV survival was unchanged by adjustment for year. Survival curves for each year did not differ significantly. (3) Treatment: very different modalities of treatment were employed, of course, in the PEV and non-PEV groups, so different that no ad.justment for treatment was at- tempted. (4) Delay: the patient's estimate of the time between the first awareness of symptoms and the start of treatment. Table 5.1 gives the distribution of delay.
Because the last category of the delay distri- bution has no right hand boundary it is not easy to get an estimate of the average delay; the width of the categories makes it difficult to find a simple estimate of the median. In order to com- pare delay between the PEV and non-PEV groups we have used the minimum Chi-square method to fit a gamma distribution with two parameters to the delay data. In each case ex- amined, the fit was satisfactory and the results are obtained using the appropriate functions of the estimated gamma parameters. Also presented are the probability values for the comparison (using an approximate normal distribution) be- tween PEV and non-PEV groups. We conclude that the delay in the PEV group is at least as
380 CANCER July 1977 Vol. 40
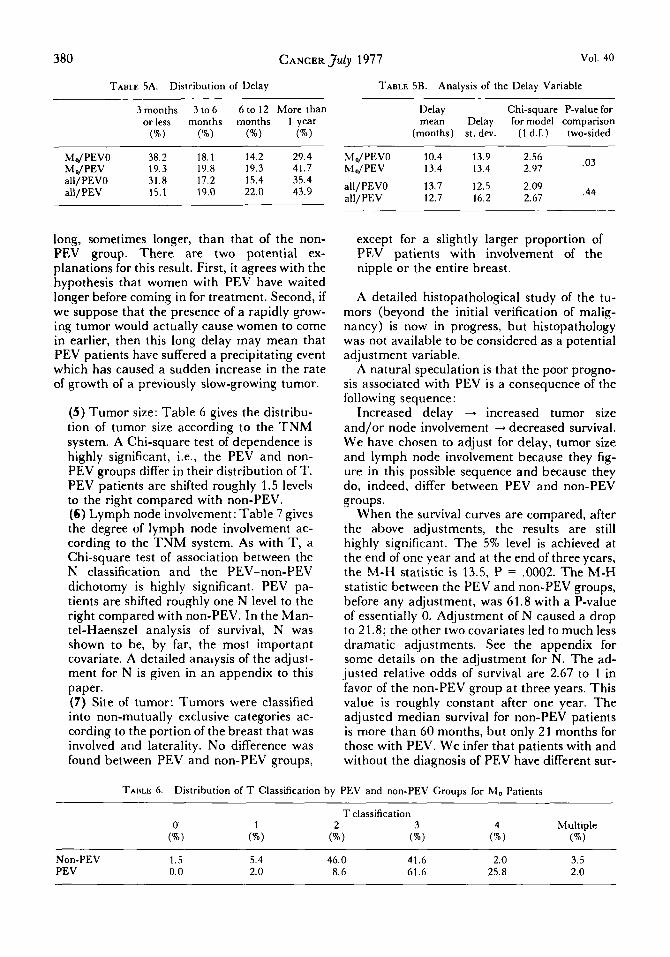
TABLE SA. Distribution of Delay TABLE SB. Analysis of the Delay Variable
3 months 3 to 6 6 to 12 More than orless months months 1 year 6) W) (%) ("/.I
MdPEVO 38.2 18.1 14.2 29.4 M o/ PEV 19.3 19.8 19.3 41.7 all/PEVO 31.8 17.2 15.4 35.4 all/PEV 15.1 19.0 22.0 43.9
Delay Chi-square P-value for mean Delay for model comparison
(months) st. dev. (1 d.f.) two-sided
.03 MdPEVO 10.4 13.9 2.56 M,,/PEV 13.4 13.4 2.97
.44 all/PEVO 13.7 12.5 2.09 all/PEV 12.7 16.2 2.67
long, sometimes longer, than that of the non- PEV group. There are two potential ex- planations for this result. First, it agrees with the hypothesis that women with PEV have waited longer before coming in for treatment. Second, if we suppose that the presence of a rapidly grow- ing tumor would actually cause women to come in earlier, then this long delay may mean that PEV patients have suffered a precipitating event which has caused a sudden increase in the rate of growth of a previously slow-growing tumor.
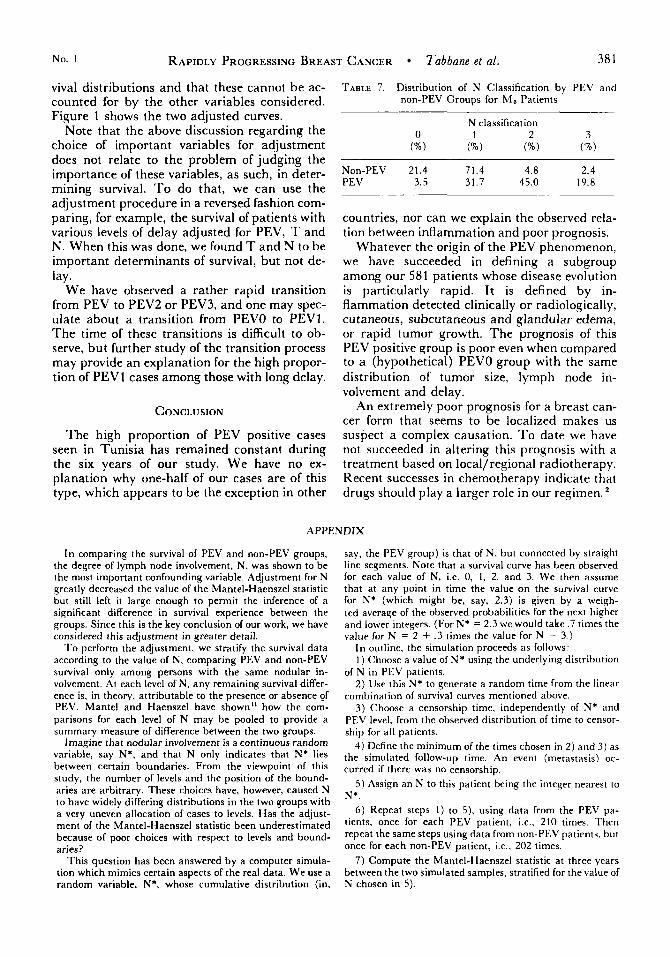
(5) Tumor size: Table 6 gives the distribu- tion of tumor size according to the T N M system. A Chi-square test of dependence is highly significant, i.e., the PEV and non- PEV groups differ in their distribution of T. PEV patients are shifted roughly 1.5 levels to the right compared with non-PEV. (6) Lymph node involvement: Table 7 gives the degree of lymph node involvement ac- cording to the TNM system. As with T, a Chi-square test of association between the N classification and the PEV-non-PEV dichotomy is highly significant. PEV pa- tients are shifted roughly one N level to the right compared with non-PEV. In the Man- tel-Haenszel analysis of survival, N was shown to be, by far, the most important covariate. A detailed analysis of the adjust- ment for N is given in an appendix to this paper. (7) Site of tumor: Tumors were classified into non-mutually exclusive categories ac- cording to the portion of the breast that was involved and laterality. No difference was found between PEV and non-PEV groups,
except for a slightly larger proportion of PEV patients with involvement of the nipple or the entire breast.
A detailed histopathological study of the tu- mors (beyond the initial verification of malig- nancy) is now in progress, but histopathology was not available to be considered as a potential adjustment variable.
A natural speculation is that the poor progno- sis associated with PEV is a consequence of the following sequence:
Increased delay + increased tumor size and/or node involvement -+ decreased survival. We have chosen to adjust for delay, tumor size and lymph node involvement because they fig- ure in this possible sequence and because they do, indeed, differ between PEV and non-PEV groups.
When the survival curves are compared, after the above adjustments, the results are still highly significant. The 5% level is achieved at the end of one year and at the end of three years, the M-H statistic is 13.5, P = .0002. The M-H statistic between the PEV and non-PEV groups, before any adjustment, was 61.8 with a P-value of essentially 0. Adjustment of N caused a drop to 21.8; the other two covariates led to much less dramatic adjustments. See the appendix for some details on the adjustment for N. The ad- justed relative odds of survival are 2.67 to 1 in favor of the non-PEV group at three years. This value is roughly constant after one year. The adjusted median survival for non-PEV patients is more than 60 months, but only 21 months for those with PEV. We infer that patients with and without the diagnosis of PEV have different sur-
TABLE 6. Distribution of T Classification by PEV and non-PEV Groups for M, Patients
Non-PEV 1.5 5.4 46.0 41.6 2.0 3.5 PEV 0.0 2.0 8.6 61.6 2 5 . 8 2.0
No. 1 RAPIDLY PROGRESSING BREAST CANCER Tabbane et al. 38 1
viva1 distributions and that these cannot be ac- counted for by the other variables considered. Figure 1 shows the two adjusted curves.
Note that the above discussion regarding the choice of important variables for adjustment does not relate to the problem of judging the importance of these variables, as such, in deter- mining survival. T o do that, we can use the adjustment procedure in a reversed fashion com- paring, for example, the survival of patients with various levels of delay adjusted for PEV, T and N. When this was done, we found T and N to be important determinants of survival, but not de- lay.
We have observed a rather rapid transition from PEV to PEV2 or PEV3, and one may spec- ulate about a transition from PEVO to PEV1. The time of these transitions is difficult to ob- serve, but further study of the transition process may provide an explanation for the high propor- tion of PEVl cases among those with long delay.
CONCLUSION
The high proportion of PEV positive cases seen in Tunisia has remained constant during the six years of our study. We have no ex- planation why one-half of our cases are of this type, which appears to be the exception in other
TABLE 7. Distribution of N Classification by PEV and non-PEV Groups for M, Patients
Non-PEV 21.4 71.4 4.8 2.4 PEV 3.5 31.7 45.0 19.8
countries, nor can we explain the observed rela- tion between inflammation and poor prognosis.
Whatever the origin of the PEV phenomenon, we have succeeded in defining a subgroup among our 581 patients whose disease evolution is particularly rapid. It is defined by in- flammation detected clinically or radiologically, cutaneous, subcutaneous and glandular edema, or rapid tumor growth. The prognosis of this PEV positive group is poor even when compared to a (hypothetical) PEVO group with the same distribution of tumor size, lymph node in- volvement and delay.
An extremely poor prognosis for a breast can- cer form that seems to be localized makes us suspect a complex causation. T o date we have not succeeded in altering this prognosis with a treatment based on local/regional radiotherapy. Recent successes in chemotherapy indicate that drugs should play a larger role in our regimen.
APPENDIX
In comparing the survival of PEV and non-PEV groups, the degree of lymph node involvement, N, was shown to be the most important confounding variable. Adjustment for N greatly decreased the value of the Mantel-Haenszel statistic but still left it large enough to permit the inference of a significant difference in survival experience between the groups. Since this is the key conclusion of our work, we have considered this adjustment in greater detail.
To perform the adjustment, we stratify the survival data according to the value of N, comparing PEV and non-PEV survival only among persons with the same nodular in- volvement. At each level of N, any remaining survival differ- ence is. in theory, attributable to the presence or absence of PEV. Mantel and Haenszel have shown” how the com- parisons for each level of N may be pooled to provide a summary measure of difference between the two groups.
Imagine that nodular involvement is a continuous random variable, say N*, and that N only indicates that N* lies between certain boundaries. From the viewpoint of this study, the number of levels and the position of the bound- aries are arbitrary. These choices have, however, caused N to have widely differing distributions in the two groups with a very uneven allocation of cases to levels. Has the adjust- ment of the Mantel-Haenszel statistic been underestimated because of poor choices with respect to levels and bound- aries?
This question has been answered by a computer simula- tion which mimics certain aspects of the real data. We use a random variable, N*, whose cumulative distribution (in,
say, the PEV group) is that of N. but connected by straiqht line segments. Note that a survival curve has been observed for each value of N, i.e. 0, 1, 2, and 3. We then assume that at any point in time the value on the survival curve for N* (which might be, say, 2.3) is given by a weigh- ted average of the observed probabilities for the next higher and lower integers. (For N* = 2.3 we would take .7 times the value for N = 2 + .3 times the value for N = 3.)
In outline, the simulation proceeds a s follows: 1 ) Choose a value of N* using the underlying distribution
of N in PEV patients. 2) Use this N* to generate a random time from the linear
combination of survival curves mentioned above. 3) Choose a censorship time, independently of N* and
PEV level, from the observed distribution of time to censor- ship for all patients.
4 ) Define the minimum of the times chosen in 2) and 3) as the simulated follow-up time. An event (metastasis) oc- curred if there was no censorship.
5) Assign an N to this patient being the integer nearest to N*.
6) Repeat steps 1) to 5), using data from the PEV pa- tients, once for each PEV patient. i.e., 210 times. Then repeat the same steps using data from non-PEV patients, but once for each non-PEV patient, i.e.. 202 times.
7) Compute the Mantel-Haenszel statistic a t three years between the two simulated samples, stratified for the value of N chosen in 5).
382 CANCER J u l ~ 1977 Vol. 40
imum deviation between the observed and expected distribu- tion functions (of the Mantel-Haenszel statistics) to be .07. This eives a sienificance level of more than .2 for the Kol-
8) Repeat 1) to 7) 50 times to provide a sample of adjusted
If, in the passage from N* to the re-discretized N, we have Mantel-Haenszel statistics.
~
not lost too much information, the Mantel-Haenszel statis- tics accumulated in 8) should be a sample from a Xp distri- bution. In other words, the choice of boundaries and levels
m o g o ~ o v ~ ~ m i r ~ o v statistic indicating that the original ad- justment for was satisfactory,
used to define N would be a good one because it allowed The need for this appendix was suggested by Dr. N.E. Y
“adjustment” for N*. Day and we have greatly profited from his advice on how to proceed. When we performed this experiment, we found the max-
REFERENCES
1. Berndt, H., and Titze, U.: TNM classification of breast cancer. Int. J . Cancer 4:837-844, 1969.
2. Carter, S. K.: Integration of chemotherapy into com- bined modality treatment of solid tumors. VII Adenocarci- noma of the breast. Cancer ‘Treat. Rcu. (In press).
3. Cutler, S. J., and Ederer. F.: Maximum utilization of the life table in analysing survival. J. Chronic Dis. 8:699-712, 1958.
4. Fletcher, G. H., and Montague, E. D. : Radical irradia- tion of advanced breast cancer. Am. J . Roentgenol. Radium Ther. .Nucl. Med. 3:573-584, 1965.
5. Haagensen, C. D.: Inflammatory Carcinoma in Dis- eases of the Breast, 2nd ed. Philadelphia, W. B. Saunders Co.. 1971; pp. 579-584.
6. Hankey, B. F. and Myers, M. H.: Evaluating differ- ences in survival between two groups of patients. J. Chronic Dzs. 24:523-531, 1971.
7. Lacour, J., and Hourtoule, F. G.: La place de la chi- rurgie dans le traitement des formes tvolutives du cancer du sein. Mem. Acad. Chir. 93:635-643, 1967.
8. Lalanne, C., Sarrazin, D., Lt, M., Hourtoule, F. G. , Juret, P., and Rathle, C.: Le traitement du cancer a’ 1’Institut Gustave-Roussy depuis 1954. Excerpta Medica Int. Congress Series. 105:988-999, 1963.
9. Lee, B. J., and Tannenenbaum, N.E.: Inflammatory carcinoma of the breast Surg. Gynccol. Obstet. 39:580-, 1924.
10. MacKay, E. N., and Sellers, A. H.: A prospective trial of the TNM classification of breast cancer by the regional cancer treatment centers of Ontario, 1960-1964. Int. J. Cun- cer 6:517-528, 1970.
11. Mantel, N., and Haenszel, W.: Statistical aspects of the analysis of data retrospective studies of disease. J. .Null. Cancer Inst. 22:719-748, 1958.
12. Mourali, N., Tabbane, F., Vogt Hoerner, G., Jaziri, M., Cammoun, M., and Ben Attia, R.: Choice of treatment according to the rate of growth. In Proceedings of the XI International Cancer Congress Florence, 1974. In Excerpta Medica Amsterdam. New York, American Elsevier Pub- lishing Co. Inc., 1975; 11-16.
13. Mourali, N., Tabbane, F., Jaziri, M., Cammoun, M., and Belhassen, S. : Fulminating breast cancer: Clinical fea- tures. In Proceedings of the Third International Symposium on Detection and Prevention of Cancer, New York, 1976 (in press).
14. Sarrazin, D.. Lacour, .I.. and Juret, P.: Protocole schematique de traitement des cancers du sein en phase Cvolutive. La Rev. du Pral. XVIII, 25:3617-3621, 1968.
15. Taylor, G. W.. and Meltzer, A.: Inflammatory Carci- noma of the breast. Am. J. Cancer 33:33, 1938.