Embed Size (px)
Citation preview

Clinical Operations in a Service Line ModelJohn D’Angelo, MD, FACEPExecutive Director & Senior Vice President
Sarah Healey Herod, MPHDirector, Service Line Development
Jill CastanedaProject Manager, Clinical Operations Team
Emergency Medicine Service LineNorthwell Health
December 12, 2017
1
Friday, November 24, 2017 2
Introductions
What is the Service Line?
IHI and Process Improvement
Origin & Evolution of the Clinical Operations Team
Continuous Site Improvement work
Data & Analytics
Accountability & Sustainability
Questions and Discussions
Agenda

3
What is a Service Line?

Emergency Medicine Service Line
Friday, November 24, 2017 4
> 900,000 annual ED visits
5 Tertiary EDs | 11 Community EDs | 1 Free-Standing ED

Service Line Vision
Friday, November 24, 2017 5
“To be a fully integrated network of emergency departments and acute care centers capable of consistently delivering high quality care in the most efficient manner possible”
Northwell Top Line Initiatives
Hospital Top Line Initiatives
Physician Nurse & ACP
Collaboration
Patient

The Emergency Medicine Service Line is responsible to drive strategy across the entire continuum of unscheduled acute care services:
6
Market Growth
Patient Experience
Employee Investment
Finance
Quality
Community Benefit
Teaching & Research
Operations
Friday, November 24, 2017
Service Line Responsibilities

Service Line Strategy
Optimize service line team
Effective Site Leadership
Implementation of best practice standards and workflow models
Comprehensive performance improvement program
Leveraging all forms of technology for documentation, communication, delivery and marketing
Key contributor to Northwell Health financial success
Improve market share and prepare for future healthcare landscape
7Friday, November 24, 2017

8
8
EMSL Centralized Services

How do we work with our Emergency Departments?
9
Partner with MD & RN Leaders
Share best practices Guide operational
improvements
Standardize Practices
Clinical & Administrative Quality Review & Data
Collection
Education & Development
Physician Admin Fellow Clinical Leadership
Development Program
Telehealth Expansion
Telepsych & Telestroke eICU Collaboration
Service Line Collaboration
Pediatrics, Psychiatry, Hospitalists, Cardiology, HR, Nursing
Program Development
ACP (NP/PA) Fellowship SAFE Program Quality Committee
New Business Development
Northwell Strategy Support Market Growth
Patient Experience
Six Sigma Projects Patient Referral
Programs
Financial Tracking & Reporting
Centralized Budget Ongoing Financial
Assessments
Standardize Practices
Clinical & Administrative Quality Review & Data
Collection
Education & Development
Physician Admin Fellow Clinical Leadership
Development Program
Telehealth Expansion
Telepsych & Telestroke eICU Collaboration
New Business Development
Northwell Strategy Support Market Growth
Patient Experience
Six Sigma Projects Patient Referral
Programs
Financial Tracking & Reporting
Centralized Budget Ongoing Financial
Assessments
Service Line Collaboration
Pediatrics, Psychiatry, Hospitalists, Cardiology, HR, Nursing
Standardize Practices
Clinical & Administrative Quality Review & Data
Collection
Education & Development
Nursing Education Physician Admin Fellow Clinical Leadership
Development Program
Telehealth Expansion
Telepsych & Telestroke eICU Collaboration
New Business Development
Northwell Strategy Support Market Growth
Patient Experience
Six Sigma Projects Patient Referral
Programs
Financial Tracking & Reporting
Centralized Budget Ongoing Financial
Assessments

10
IHI &
Process Improvement

Process Improvement
Month Day, Year 11
Create a culture in all Northwell Emergency Departments of continuous introspective review and enhancement using
improvement science techniques to optimize operations and provide the best care and treatment of patients and family
members.
Continuous Transparent Site LedMetric Driven
Multi-disciplinary

The IHI Model for Improvement
Aim•What are we trying to accomplish?
Measures
•How will we know that a change is an improvement?
Ideas
•What change can we make that will result in improvement?
Month Day, Year 12

Month Day, Year 13
The IHI Model for Improvement:
Plan Do Study Act (PDSA) Small tests of change, Continuous, Sequential and easy to begin
• Carry out the plan
• Document barriers
• Begin analysis of data
• Analysis of the data
• Compare to predictions
• Summarize what was learned
• Objective
• Why?
• Who, what, where, when?
• What changes are to be made?
• Next cycle?
Act Plan
DoStudy

The IHI Model for ImprovementPlan Do Study Act (PDSA) Steps
Month Day, Year 14
Step 1: PlanPlan the test or observation, including a plan for collecting data.State the objective of the test.Make predictions about what will happen and why.Develop a plan to test the change. (Who? What? When? Where? What data need to be collected?)
Step 2: DoTry out the test on a small scale.Carry out the test.Document problems and unexpected observations.Begin analysis of the data.
Step 3: StudySet aside time to analyze the data and study the results. Complete the analysis of the data.Compare the data to your predictions.Summarize and reflect on what was learned.
Step 4: ActRefine the change, based on what was learned from the test.Determine what modifications should be made.Prepare a plan for the next test.
15
Origin and Evolution of the Clinical Operations (Clin Ops) Team

Month Day, Year 16
Northwell /IHI Collaborative Timeline – focus on early identification & treatment in the ED
Action Period
includes monthly calls
& team reports
Getting Started:
includes calls & activities
Action Period
includes monthly calls
& team reports
Learning Session 2
July2012
Learning Session 3
January2013
Action Period
includes monthly calls
& team reports
Learning Session 1
February 2012
Learning Sessions:
Improvement Science methodology
Team Report Outs
Sharing of experiences, challenges and solutions
Goal Setting
Structure:
Teams from each site
Leaders, front line staff
Executive Sponsors
Data Definitions / Reporting
Team site / E-list / Collaborative Calls
Month Day, Year 17
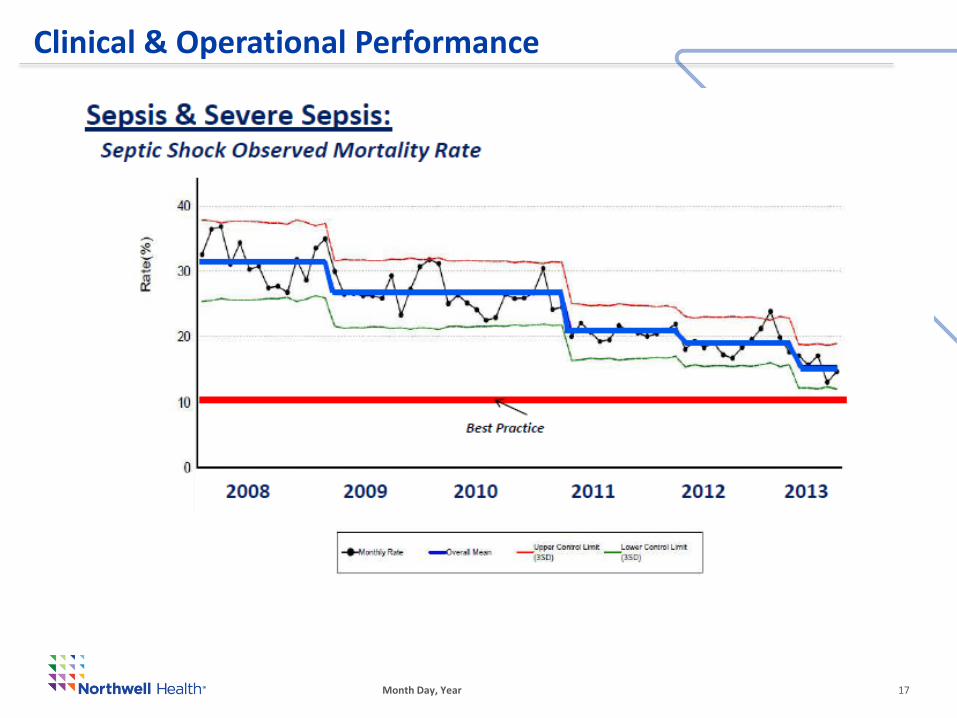
Clinical & Operational Performance
Month Day, Year 18
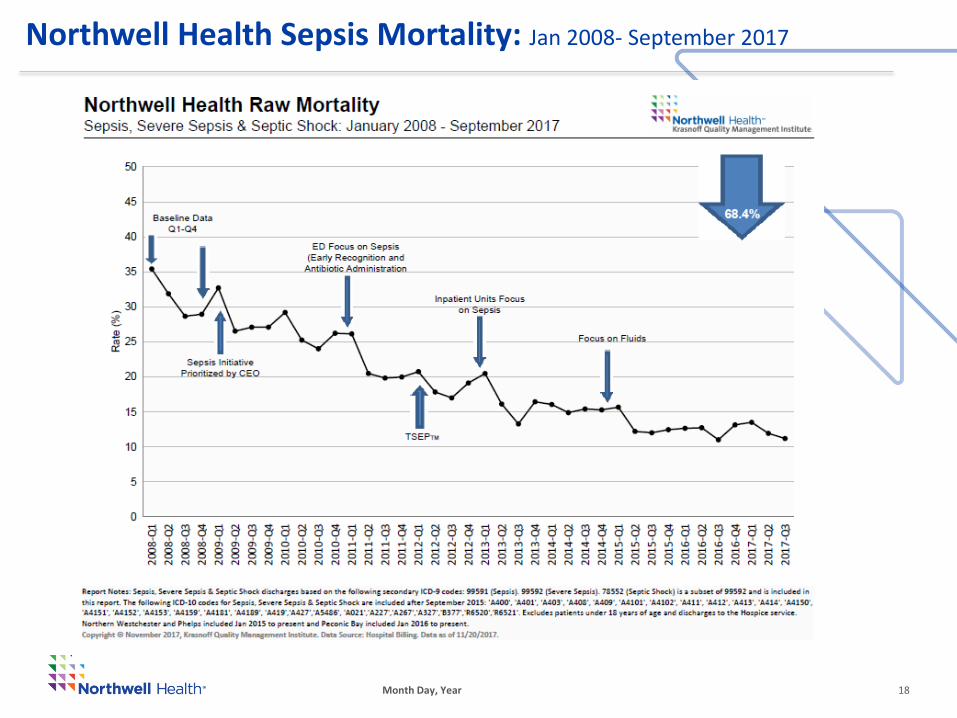
Northwell Health Sepsis Mortality: Jan 2008- September 2017

How do we know what to do?Because the Sepsis Collaborative worked!
Develop a Structure for leadership, partnering, communication, sharing and reporting.
Promote Change
Identify and overcome Barriers
Focus on culture, work with site leadership on engaging front line
Define the Outcomes that you want to achieve and develop processes to obtain them
Data Definitions are crucial to acceptance of results
Utilize Improvement Processes to facilitate change
Process Maps
Small Scale tests of change (ex. PDSAs)
Run Chart analysis
Share lessons learned and best practices
Month Day, Year 19

Month Day, Year 20
Clinical & Operational Excellence EM Strategy for Sustainable Results
Standard Accountability System
Must Haves Standardization
Aligned Goals Aligned Behaviors Aligned Process Strategic Goals Leader
Accountability Process
Cascade of Goals Communication &
Transparency Success Sharing
Co-Leadership Model
Driving positive culture and productive organizational energy
Selecting and Retaining Talent
Leadership & Staff Training & Development
Drive towards Excellence in all mission critical areas
Improvement Methodology
Leader Evaluation & Performance Scorecard
Standardized PI Process

Risk Taking and Organization ChangeThe Change Equation
C=(DxVxF) > R*Three factors must be present for meaningful organizational change to take place, and together they must be greater than the RESISTANCE of those who fear the change. C = ChangeD = Dissatisfaction with the status quoV = Vision of a better future stateF = Practical First StepsR = Resistance to Change by people or the organization system
Before the change:When planning a major change, planning teams need to make sure all three elements are built into their plans.
During the change:Use it as trouble-shooting tool for figuring out why people are resisting the change.
* Change Equation formula developed by Richard Beckhard 1977; modified by David Gleicher, and Kathy Dannemiller.

Where the rubber meets the road….
EXECUTION
22

Clin Ops Team Structure
Month Day, Year 23
Director,Clinical
Optimization
Project Manager
Assistant Director, QM
Regional Physician VP
Regional Analysts
Regional Nurses
Collaboration

Month Day, Year 24
How do we work with our Sites?
Clin Ops Team
Physician Chair
Nursing Director
Vice/ Asst. Chairs
RN Managers
ACP Leads ED Administrator

“Typical” Emergency Department Flow
InputTriage
Room placement
ThroughputProvider interaction,
Work up, Intervention
OutputProvider Signoff
Discharge: home or hospital
25Press Ganey Scores Average Admit LOS
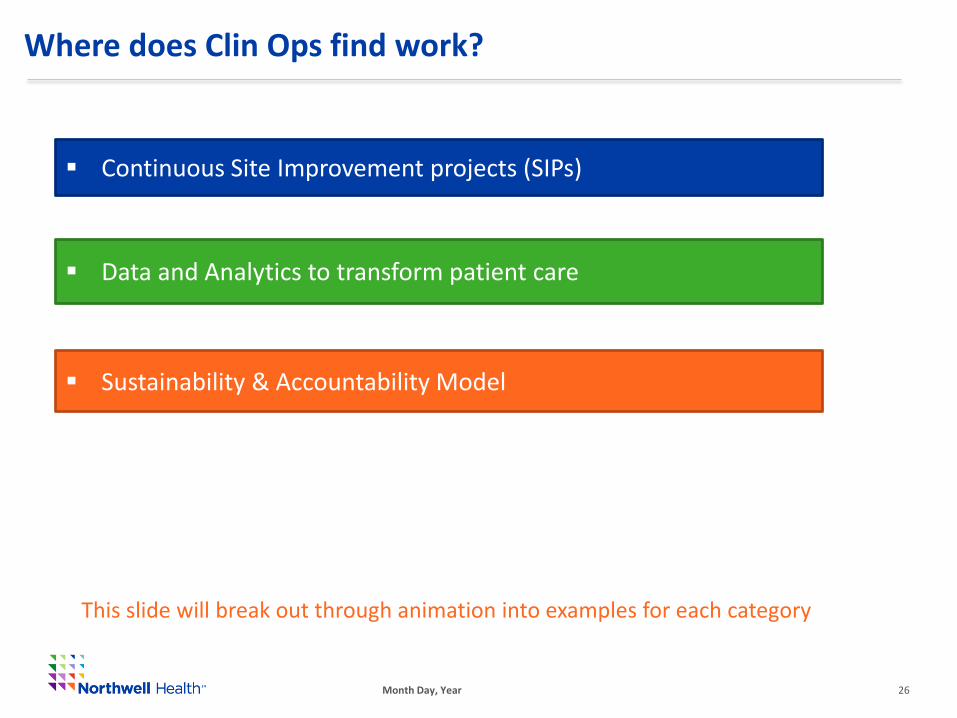
Where does Clin Ops find work?
Month Day, Year 26
Continuous Site Improvement projects (SIPs)
Sustainability & Accountability Model
Data and Analytics to transform patient care
This slide will break out through animation into examples for each category

27
Continuous Site Improvement projects (SIPs)

Month Day, Year 28
Continuous Site Improvement Projects (SIPs)
Swim Lane Process Mapping
Brainstorming
Town HallsLEAN Events
Priority Pay Off Matrix
Fast Track Decision Making
Identification of non-value added
waste

LEAN Events with our Sites
Friday, November 24, 2017 29
Problem Statement:The introduction of an electronic medical record highlighted an inefficient intake process resulting in an increasing Door to Provider time.
Action Steps by Clin Ops and ED Team: LEAN Event with an interdisciplinary group of frontline staff Workflow process mapping Redesign of triage documentation PDSA testing
Plainview Hospital
Plainview, NY
Volume: 33,000ED Beds: 26Pediatrics: 9%Admission Rate: 24% Stroke Center

Plainview: Decrease Door to Provider < 30 mins
Friday, November 24, 2017 30
Multi-disciplinary LEAN event
Workflow mapping
Measurable results

Month Day, Year 31
Plainview – Door to Provider

Lenox Hill
Friday, November 24, 2017 32
Problem Statement:A small Fast Track footprint hinderedefficiency of care for treat and release(T&R) patients; the Fast Track areatreated 37% of all patient volume, andthere was a high LWOBE rate from thearea with complaints of lack of privacy.

Month Day, Year 33
Lenox Hill: Increased capacity, throughput and patient and staff experience
Action Steps: Redesign use/purpose of clinical space LEAN Event with an interdisciplinary group of frontline staff Workflow process mapping Role redesign PDSA testing

Month Day, Year 34
Lenox Hill – LEAN Event
Brainstorming Solutions and
Causes
Buy-in from front line staff
Workflow process mapping
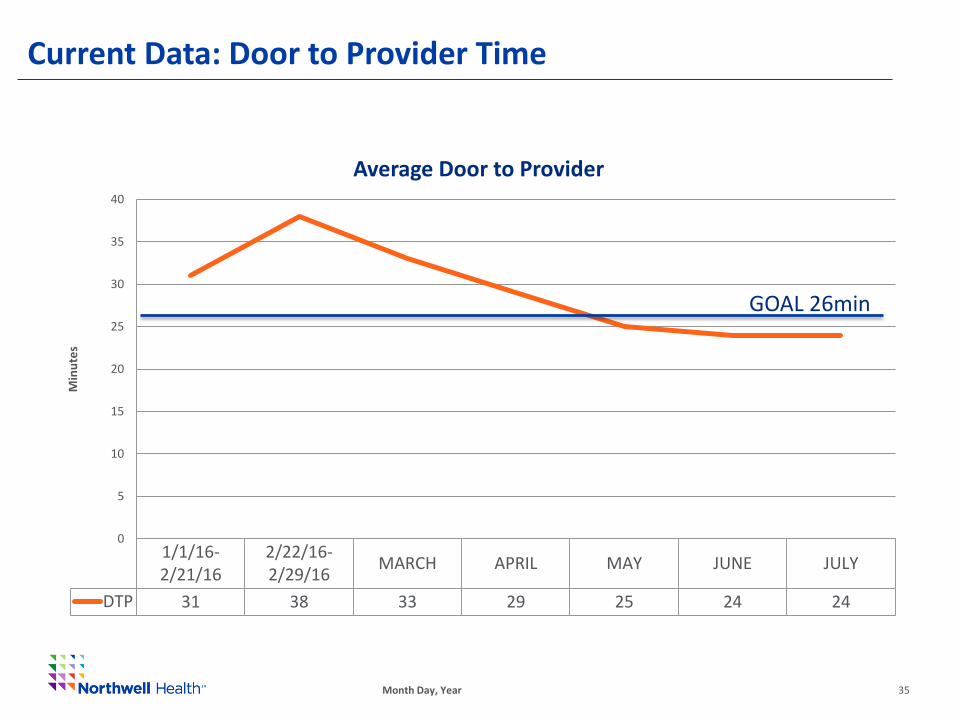
Current Data: Door to Provider Time
1/1/16-2/21/16
2/22/16-2/29/16
MARCH APRIL MAY JUNE JULY
DTP 31 38 33 29 25 24 24
0
5
10
15
20
25
30
35
40
Min
ute
s
Average Door to Provider
Month Day, Year 35
GOAL 26min

1/1/16-2/21/16
2/22/16-2/29/16
MARCH APRIL MAY JUNE JULY
Series1 222 222 218 215 207 207 200
185
190
195
200
205
210
215
220
225
Min
ute
s
T&R ALOS
Current Data: Treat and Release Average LOS
Month Day, Year 36
GOAL 205min

Current Data: Treat and Release Length of Stay
Month Day, Year 37

Long Island Jewish Medical Center
38
Problem Statement:
52% of patients seen at LIJ are an ESI level 3 and represent 68% of patients that LWOBE.
In 2015 the avg. Door to Doc was 85 mins and this has contributed to increased LOS, increased LWOBE rates, decreased patient and employee satisfaction.
Volume: 97,736ED Beds: 60Admission Rate: 26% Stroke Center, Chest Pain Center, Cath Lab
LIJ Medical Center
New Hyde Park, NY
LEAN Event with Front-line Staff to brainstorm causes and solutions and swimlane out the process map for ESI 3 patients in the department.

39
LIJ: Baseline Data
65
85
2014 2015
ED Door to Provider
1.40%
2.60%
2014 2015
Left Without Being Evaluated
303
334
2014 2015
T&R LOS
88,263
93,964
2014 2015
Emergency Department Volume
7% Increase9% Increase
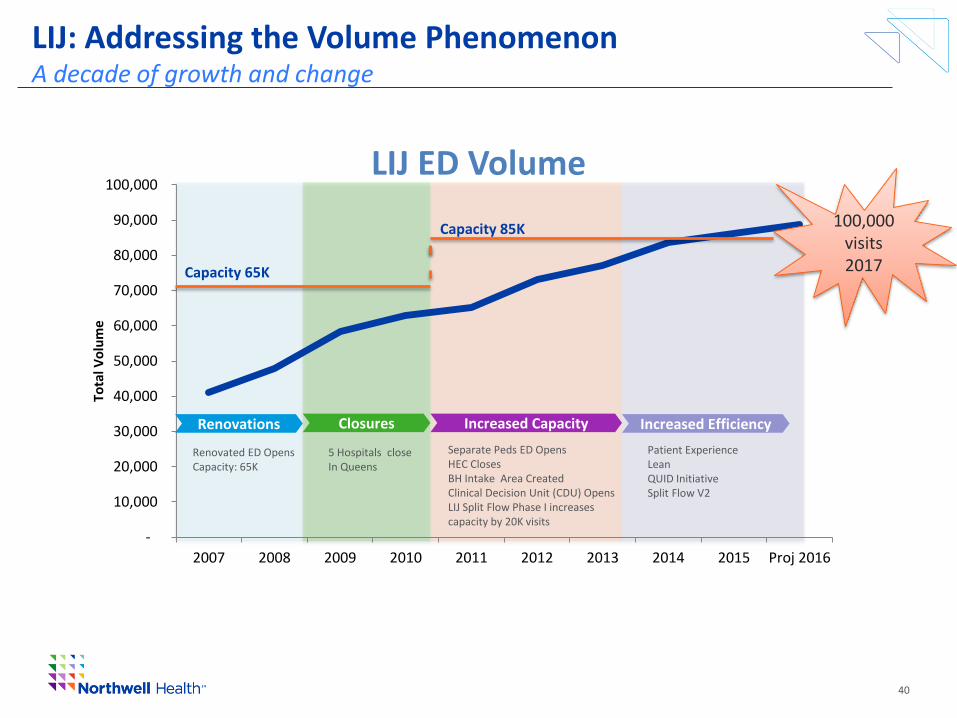
LIJ: Addressing the Volume PhenomenonA decade of growth and change
40
-
10,000
20,000
30,000
40,000
50,000
60,000
70,000
80,000
90,000
100,000
2007 2008 2009 2010 2011 2012 2013 2014 2015 Proj 2016
Tota
l Vo
lum
e
LIJ ED Volume
Capacity 65K
Capacity 85K
Renovations
Renovated ED OpensCapacity: 65K
Closures Increased Capacity Increased Efficiency
5 Hospitals closeIn Queens
Separate Peds ED OpensHEC ClosesBH Intake Area CreatedClinical Decision Unit (CDU) OpensLIJ Split Flow Phase I increases capacity by 20K visits
Patient Experience LeanQUID InitiativeSplit Flow V2
100,000 visits2017

Friday, November 24, 2017 41
LIJ: Goals met and Sustained ImprovementGoal is to decrease ED Turnaround times by January 2017: Reduce Door to Provider times to < 60 minutes Reduce ED LWOBE < 2 % Reduce ED Treat and Release LOS to < 280 minutes Improve Patient Satisfaction Scores

42
Data and Analytics

Friday, November 24, 2017 43
QUALITY
• Pneumonia
• Sepsis – Lactates Sepsis - Abx
• Cardiac Care-Balloon &EKG
• Cath – Door to EKG, Door to PCI
• Pediatrics
• Restraint
• Sedation
• Hand-washing
• Pain Control –Documentation & Timeliness
• Vital Signs
• Transfers
• Capnography
• Care of Sexual Assault Survivors
• Abuse Screen
• Med Errors
• Adverse Drug Reactions
• Falls
• Stroke Code
VOLUME
• Total Registered
• Total Admissions
• Treat & Release
• Pediatric Treat & Release
• Pediatric Admits
• Pediatric Transfers
• Unplanned Returns
• CDU admits & Treat & Release
THROUGHPUT
•Door to Bed
•Door to RN
•Door to Provider
•Provider to Disposition
•Decision to Admit to Bed Assignment
•Bed Assignment to ED Departure
•Total ALOS
•ALOS Treat & Release
•ALOS Admitted Patients
•ALOS Transfers
•ALOS Pediatrics
•ALOS Psych
•ALOS ERHO
•ALOS CDU
•ALOS Class 1 OR
•ED Midnight Census
•Ambulance –Volume
•Ambulance – TAT
•LWBS
•Diversion
•ED Registration
•Mortality within 24hrs
FINANCE
• PQRI
• IV Start and Stop
• P&L
• E&M Distribution Tech & Pro
• Charges
• Utilization by physician
• Revenue
• Billed vs. Budget
• Pro Charges
• Avg Charge
• Avg Payment
• Gross Collection Rate
• Trending/ Variance Analysis
• KPI Monitoring
PATIENT SATISFACTION
• Overall Satisfaction
• Likelihood to Recommend
• How well was your pain controlled
• Physician and Nursing Section Scoring
• Top Box scores
EMPLOYEE ENGAGEMENT
•Annual employee engagement surveys
•Tier leaders
Emergency Medicine Data Metrics
Over 200 metrics are captured by the EMSL sites. This slide highlights a portion of those metrics.

Dynamic Dashboards
Our Dashboards identify opportunities for operational improvements (T&R LOS) and help us to see which sites need support.
The dashboards are dynamic allowing the sites control and transparency over their data.
Friday, November 24, 2017 44

Friday, November 24, 2017 45
Static Monthly Dashboards
Threshold Goal
22 17 17 23 20 21 20.86 20.18 21.61 19.11
Median 13 13 10 11 13 13 13 13 11 13 13 12
202 200 188 200 190 188 188.75 180.88 194.84 181.78
Median 168 173 171 159 171 160 161 153 154 159 151 161
425 346 362 384 355 369 405 327.38 361.77 366.18
Median 365 381 317 330 331 335 340 334 298 326 329 332
218 211 200 213 202 200 200.33 191.74 205.54 193.01
3070 2707 2914 3127 3185 3101 2984 2908 3146 3184
5.2% 5.1% 5.5% 4.5% 5.1% 4.3% 7.3% 5.6% 5.1% 5.2%
# of pts 1,716 159 137 159 142 162 133 219 162 161 167 1,601
1.40% 1.11% 1.48% 1.92% 1.79% 1.42% 1.71% 1.55% 1.53% 1.82%
# of pts 666 43 30 43 60 57 44 51 45 48 58 479
8 12 4 11 11 6 9 3 1
8 12 4 11 11 6 9 3 1
84.6% 95.2% 92% 77% 94% 78% 90.0% 76.9% 100% 95.7%
79.0 81.3 75.3 72.9 67.0 71.7 70.90 71.40 74.8 66.2
94.0 99.0 77.0 67.0 40.0 60.0 57.0 58.00 75 35
Aug Sep Oct Nov Dec 2017 YTD2017 Targets
Door to DocAvg. 20 20 24 21
Lenox Health GV 2017 2016 Baseline Jan Feb Mar Apr May Jun Jul
T&R LOSAvg. 201 191 195 190
Admit LOSAvg. 407 370
Total LOS Avg. 215 203
Volume Total 36,648 30,326
Admit Rate% 4.70% 5.3%
LWOBE Rate% 1.82% 1.58% 1.6% 1.5%
Sepsis - Fluid % Compliant 63% 80.0% 63% 67%
Sepsis - Abx % Compliant 86% 86.2% 87% 92%
Cauti % Compliant 86% 88.4% 90% 91%
Patient Exp. -
Likelihood to
Recommend
Top Box Score 73.3 74.0 74.7 75.4
Patient Exp. -
Likelihood to
Recommend
Percentile Rank 74.0 71 80 83

Friday, November 24, 2017 46
Static Monthly Dashboards
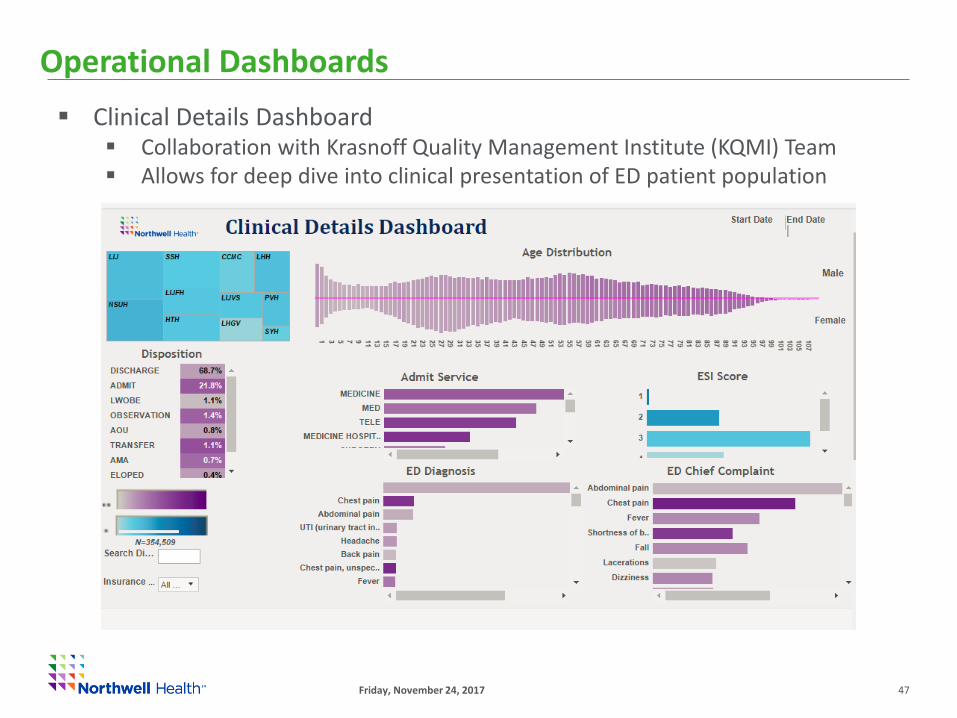
Friday, November 24, 2017 47
Clinical Details Dashboard Collaboration with Krasnoff Quality Management Institute (KQMI) Team Allows for deep dive into clinical presentation of ED patient population
Operational Dashboards

Transparency and Accountability
48

Using Data and Analytics to Transform Patient Care
Month Day, Year 49
Nursing and Tech Staffing

50
Sustainability & Accountability

SIP Meetings with Sites
Month Day, Year 51
Aim: All sites will focus SIP work on reducing Treat and Release LOS
Structure: Meetings organized by Volume Cohort (<35k, 35-60k and > 60k)
Frequency: occur every 6 weeks and alternate with the EMSL leadership meeting.
Format: Webex to increase participation and convenience
Accountability: Site update on PDSA cycles (3 slides)

Formal Report Outs of Improvement Work
EMSL Leadership Meetings occur once every six weeks.
Provide 2-3 ED Leadership teams and Front Line staff the
opportunity to report out in front of peers.
Formal presentation to entire EMSL once a year.
Allows for feedback and questions from all Eds.
Friday, November 24, 2017 52

STIPs: Individual Provider Score Card (Academic sites)
Friday, November 24, 2017 53
Emergency Department Performance
Metric
Quality
Severe Sepsis/ Septic Shock- Abx w/in 180 min: Overall department performance (Percent Compliance)
Severe Sepsis/ Septic Shock- Fluids w/in 30 min: Overall department performance (Percent Compliance)
OperationsDoor to Provider time - Overall department performance
TRLOS- Overall department performance
Patient Experience Press Ganey Likelihood to Recommend - Overall departmentperformance Top Box Score
Emergency Department Provider Performance
Metric
CitizenshipObjective criteria to be determined by Site Chairs (Examples -
meeting attendance, committee participation, community benefit initiatives (ex. EMS directorship)
AcademicObjective criteria to be determined by Med School Chair based on milestones within academic tracks (Examples -
research, education, innovation, etc.)
Patient ExperiencePress Ganey- MD Took Time (Courtesy)Question; Top Box Score for Individual Provider **

STIPs: Individual Provider Score Card (Non-academic sites)
Friday, November 24, 2017 54
Emergency Department Performance
Metric
Quality
Severe Sepsis/ Septic Shock- Abx w/in 180 min: Overall department performance (Percent Compliance)
Severe Sepsis/ Septic Shock- Fluids w/in 30 min: Overall department performance (Percent Compliance)
OperationsDoor to Provider time - Overall department performance
TRLOS- Overall department performance
Patient Experience Press Ganey Likelihood to Recommend - Overall departmentperformance Top Box Score
Emergency Department Provider Performance
Metric
CitizenshipObjective criteria to be determined by Site Chairs (Examples -meeting attendance, committee participation, community benefit initiatives (ex. EMS directorship)
Patient Experience**Press Ganey- MD Took Time (courtesy) Question;Top Box Score for Individual Provider **
Based on department and individual provider performance.

STIPs: Physician Leadership
Friday, November 24, 2017 55
Service Line Performance (%)
• Financial
• Patient Experience
• Quality
• Operations
Emergency Department
Performance (%)
• Financial
• Patient Experience
• Quality
• Operations
Chairs and Vice Chairs are held to the same metrics at the Service Line and Department level for their sites.

56
Thank You
Questions?