Embed Size (px)
Citation preview
1
Clinical Safety & EffectivenessCohort # 8
Improvement of the Quality of Patient Messages
DATEEducating for Quality Improvement & Patient Safety
FINANCIAL DISCLOSURE
Muhammad Akram, MD has no relevant financial relationships with commercial interests to disclose.
2
3
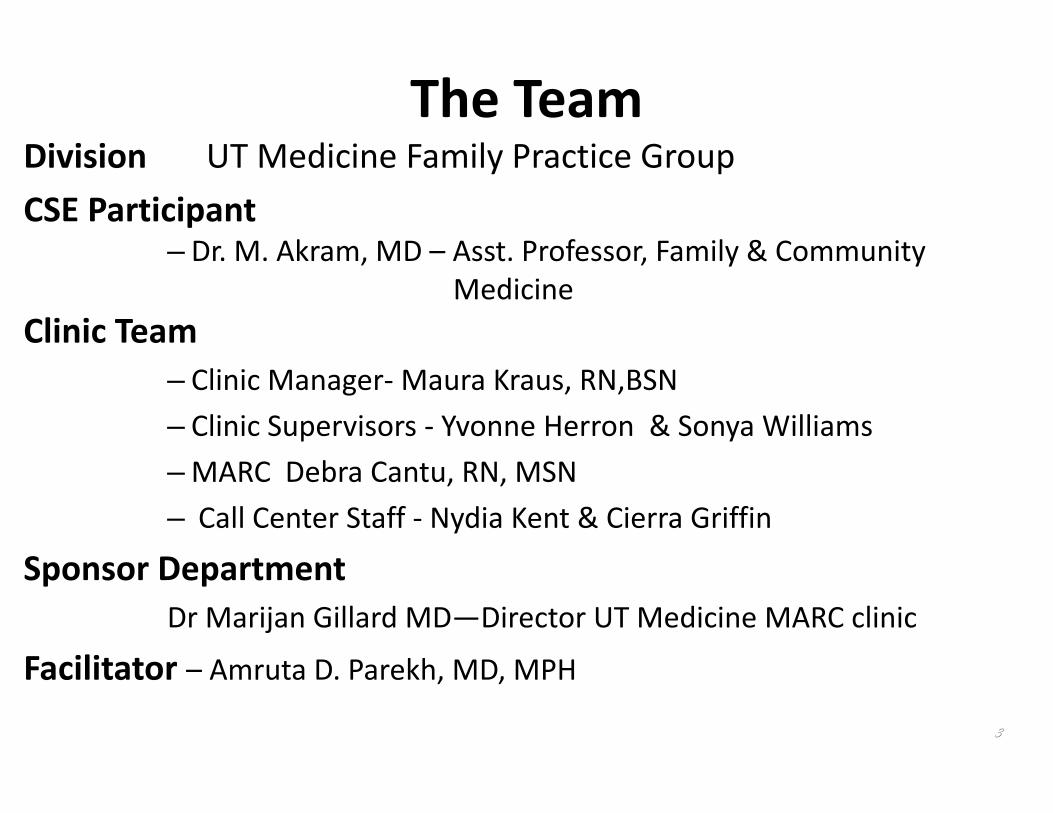
The TeamDivision UT Medicine Family Practice GroupCSE Participant
– Dr. M. Akram, MD – Asst. Professor, Family & Community Medicine
Clinic Team– Clinic Manager‐Maura Kraus, RN,BSN– Clinic Supervisors ‐ Yvonne Herron & Sonya Williams–MARC Debra Cantu, RN, MSN– Call Center Staff ‐ Nydia Kent & Cierra Griffin
Sponsor DepartmentDr Marijan Gillard MD—Director UT Medicine MARC clinic
Facilitator – Amruta D. Parekh, MD, MPH
4
What We Are Trying to Accomplish?
OUR AIM STATEMENTImprove the quality, clarity, and accuracy of patient messages, in the Family Medicine Clinic at the MARC by increase messaging satisfaction scores by 40%, decreasing message errors by 90%, and increase use of message templates to 90% by August 3, 2011.
See Appendix B for guidance about aim statements
5
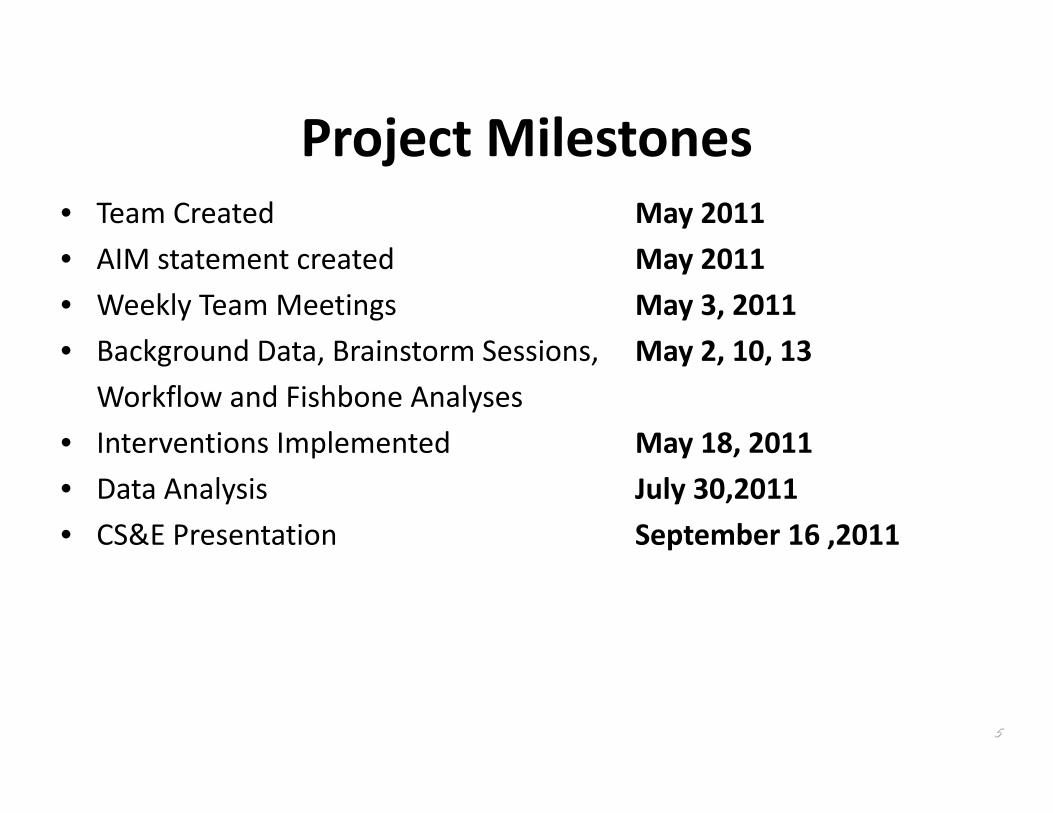
Project Milestones• Team Created May 2011• AIM statement created May 2011• Weekly Team Meetings May 3, 2011• Background Data, Brainstorm Sessions, May 2, 10, 13
Workflow and Fishbone Analyses• Interventions Implemented May 18, 2011• Data Analysis July 30,2011• CS&E Presentation September 16 ,2011
6
Background
• Context• Confusing messages• Patient Charts with grammatical and spelling errors
• Necessary information to answer patient’s question or address patient’s concerns is missing from messages. Which could potentially lead to a patient safety issue
7
How Will We Know That a Change is an Improvement?
We will monitor and measure change by :Random Message/Encounter AuditsPatient and Staff/Provider Satisfaction Surveys
before and after interventionsAccuracy and Clarity of message
We are focusing on changing the message process and decreasing grammatical and spelling errors. 90 % of message encounters use templates for documentation
8
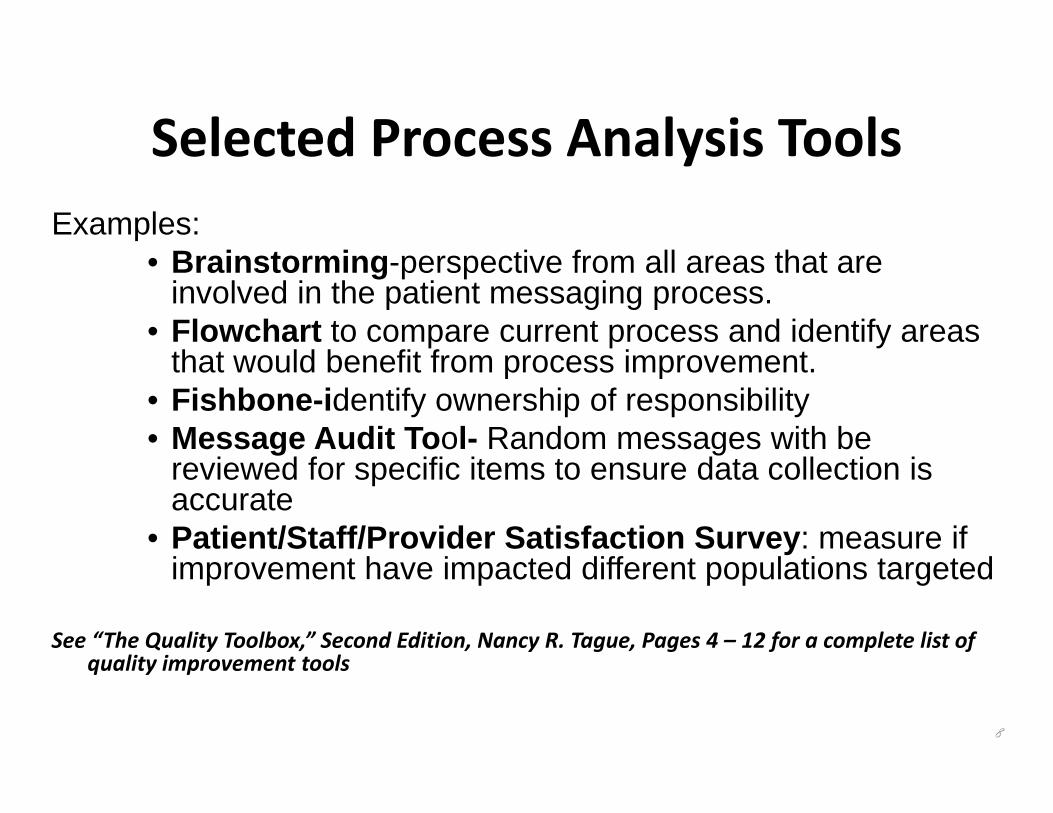
Selected Process Analysis ToolsExamples:
• Brainstorming-perspective from all areas that are involved in the patient messaging process.
• Flowchart to compare current process and identify areas that would benefit from process improvement.
• Fishbone-identify ownership of responsibility• Message Audit Tool- Random messages with be
reviewed for specific items to ensure data collection is accurate
• Patient/Staff/Provider Satisfaction Survey: measure if improvement have impacted different populations targeted
See “The Quality Toolbox,” Second Edition, Nancy R. Tague, Pages 4 – 12 for a complete list of quality improvement tools
9
Adapted from:Aaron Standard, “How to Calculate ROI.” Working Smarter website. http://blog.smartdraw.com/archive/2009/03/16/how-to-calculate-roi.aspx
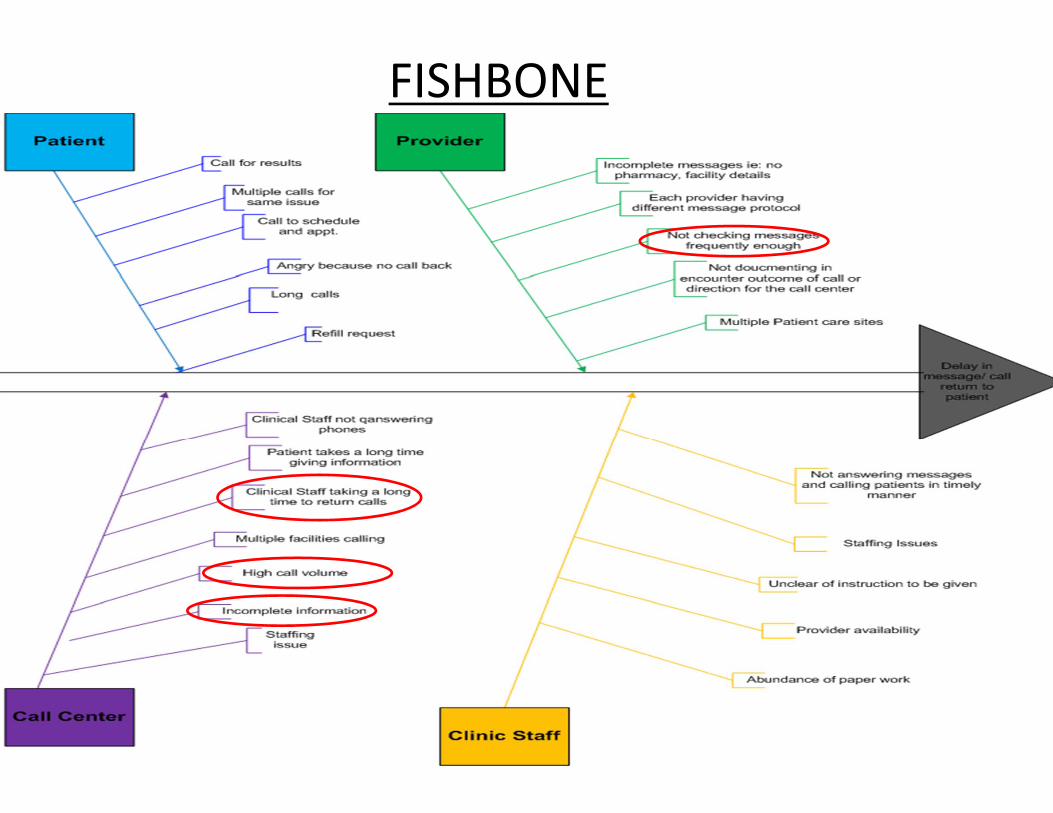
FISHBONE
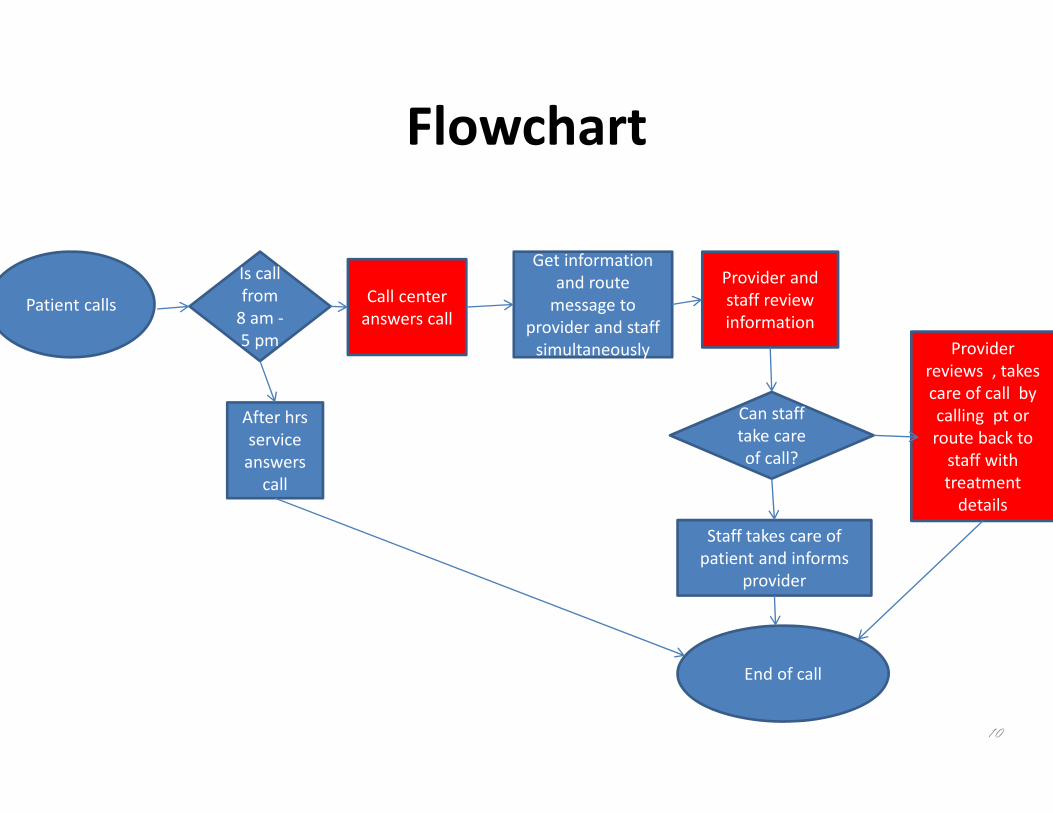
Flowchart
10
Patient calls Call center answers call
Is call from 8 am ‐5 pm
After hrs service answers call
Get information and route message to
provider and staff simultaneously
Provider and staff review information
Can staff take care of call?
Staff takes care of patient and informs
provider
End of call
Provider reviews , takes care of call by calling pt or route back to staff with treatment details
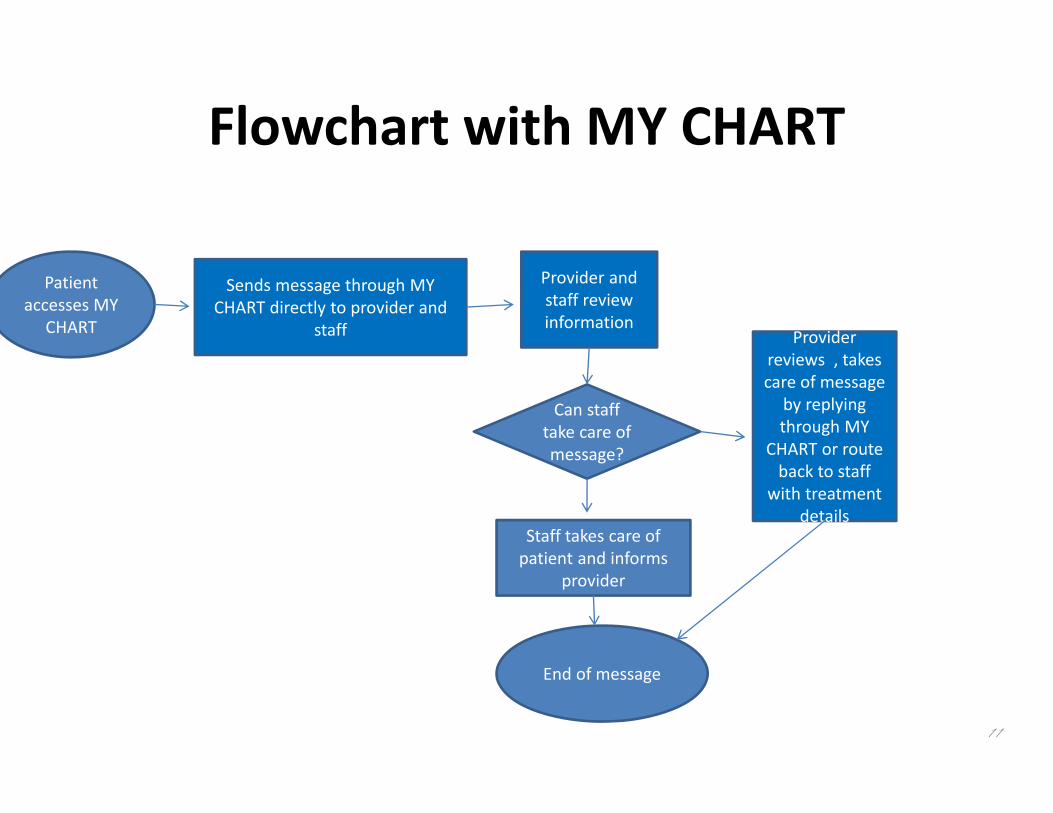
Flowchart with MY CHART
11
Patient accesses MY
CHART
Sends message through MY CHART directly to provider and
staff
Provider and staff review information
Can staff take care of message?
Staff takes care of patient and informs
provider
End of message
Provider reviews , takes care of message
by replying through MY
CHART or route back to staff
with treatment details
12
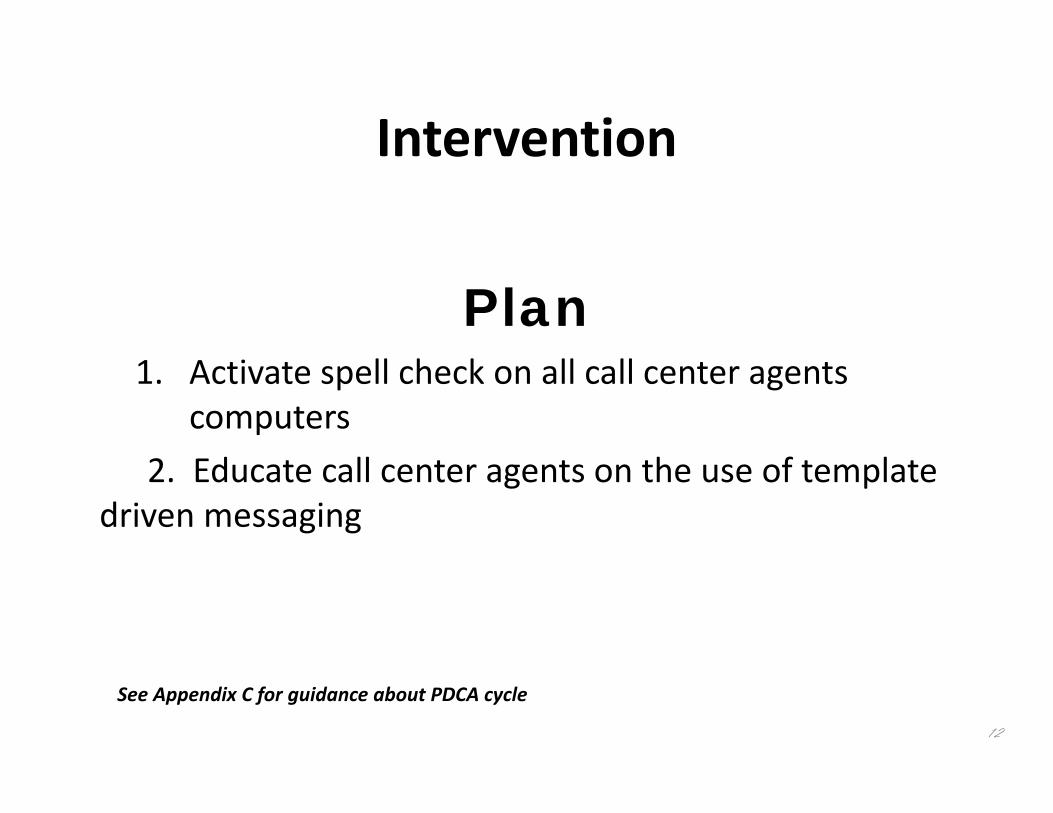
Intervention
Plan1. Activate spell check on all call center agents
computers 2. Educate call center agents on the use of template
driven messaging
See Appendix C for guidance about PDCA cycle
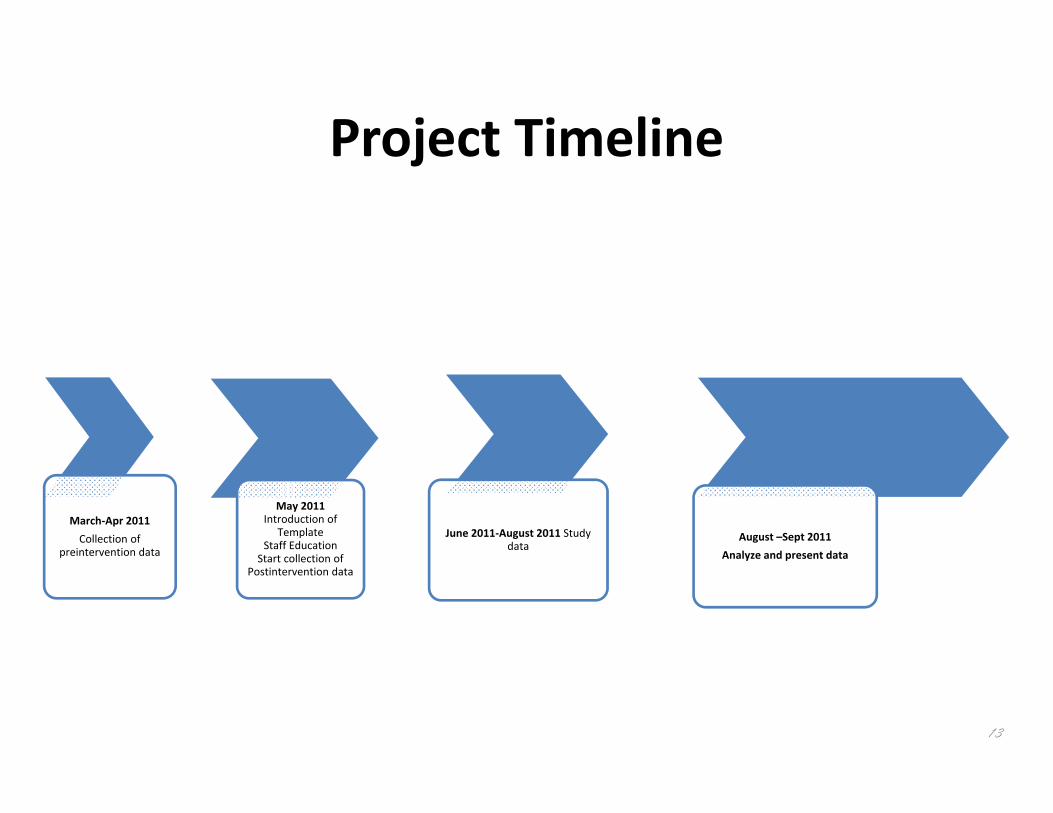
Project Timeline
March‐Apr 2011Collection of
preintervention data
May 2011 Introduction of
Template Staff Education
Start collection of Postintervention data
June 2011‐August 2011 Study data
August –Sept 2011Analyze and present data
13
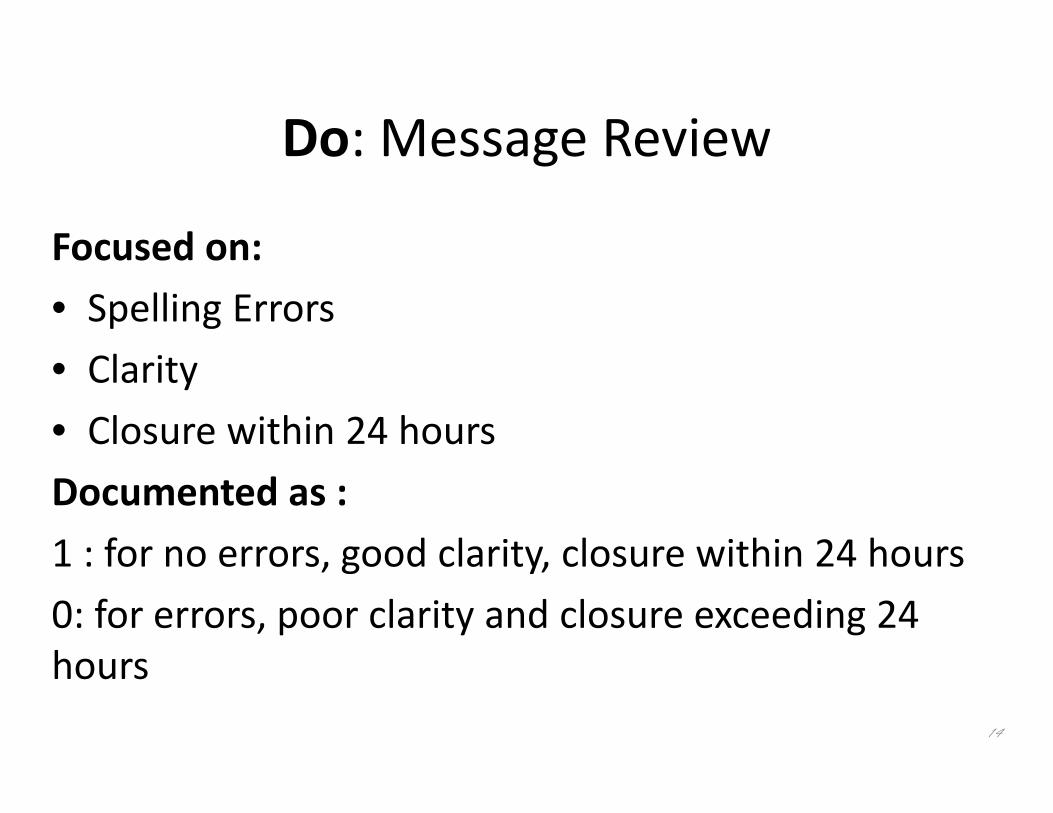
Do: Message Review
Focused on:• Spelling Errors• Clarity• Closure within 24 hoursDocumented as :1 : for no errors, good clarity, closure within 24 hours0: for errors, poor clarity and closure exceeding 24 hours
14
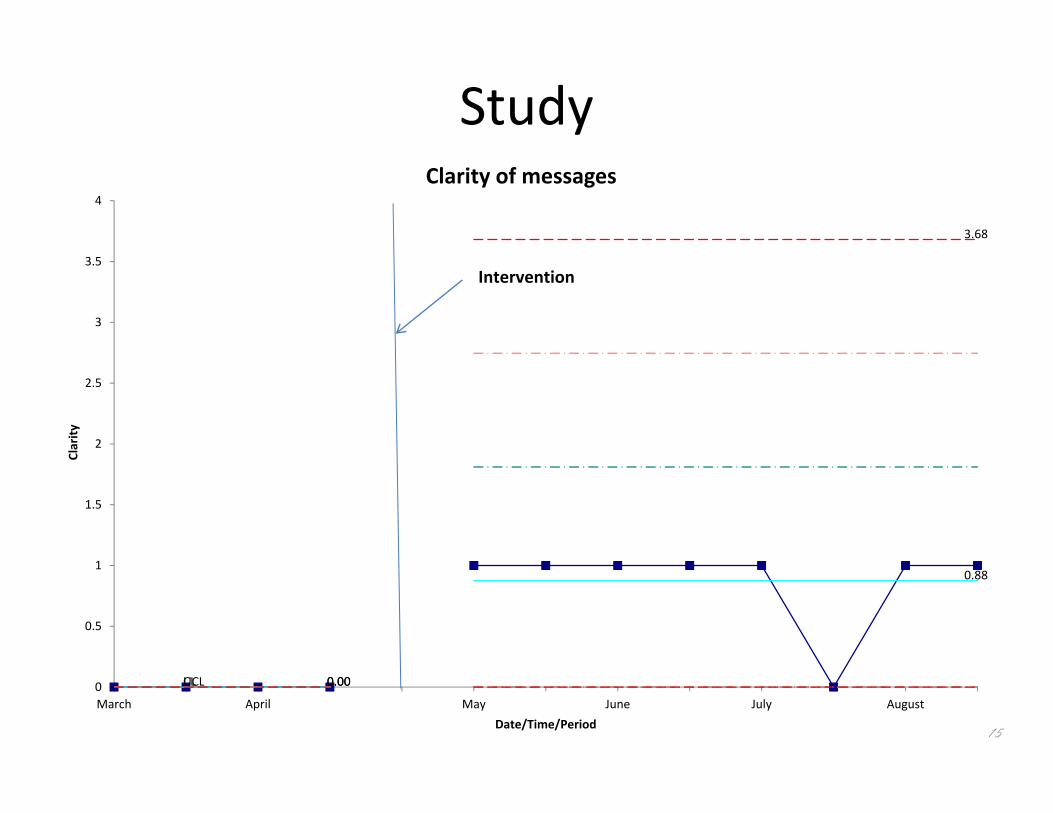
Study
15
UCL 0.00
3.68
CL 0.00
0.88
0
0.5
1
1.5
2
2.5
3
3.5
4
March April May June July August
Clarity
Date/Time/Period
Clarity of messages
Intervention
16
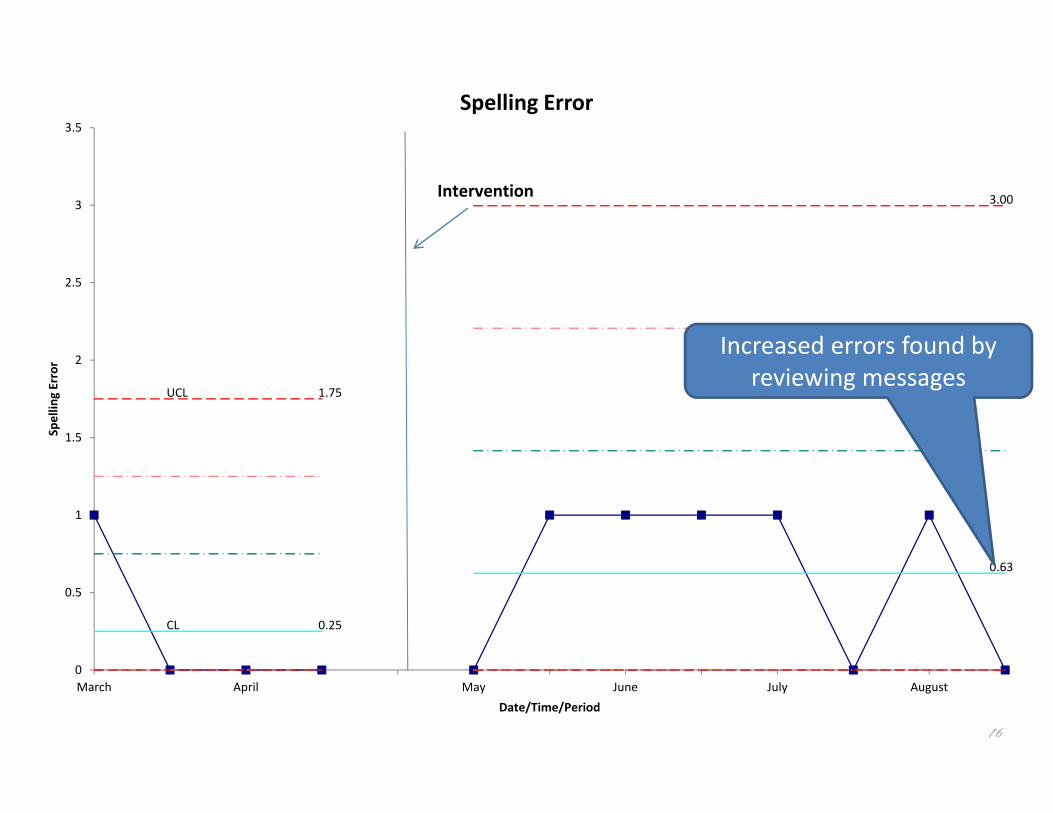
UCL 1.75
3.00
CL 0.25
0.63
0
0.5
1
1.5
2
2.5
3
3.5
March April May June July August
Spellin
g Error
Date/Time/Period
Spelling Error
Intervention
Increased errors found by reviewing messages
17
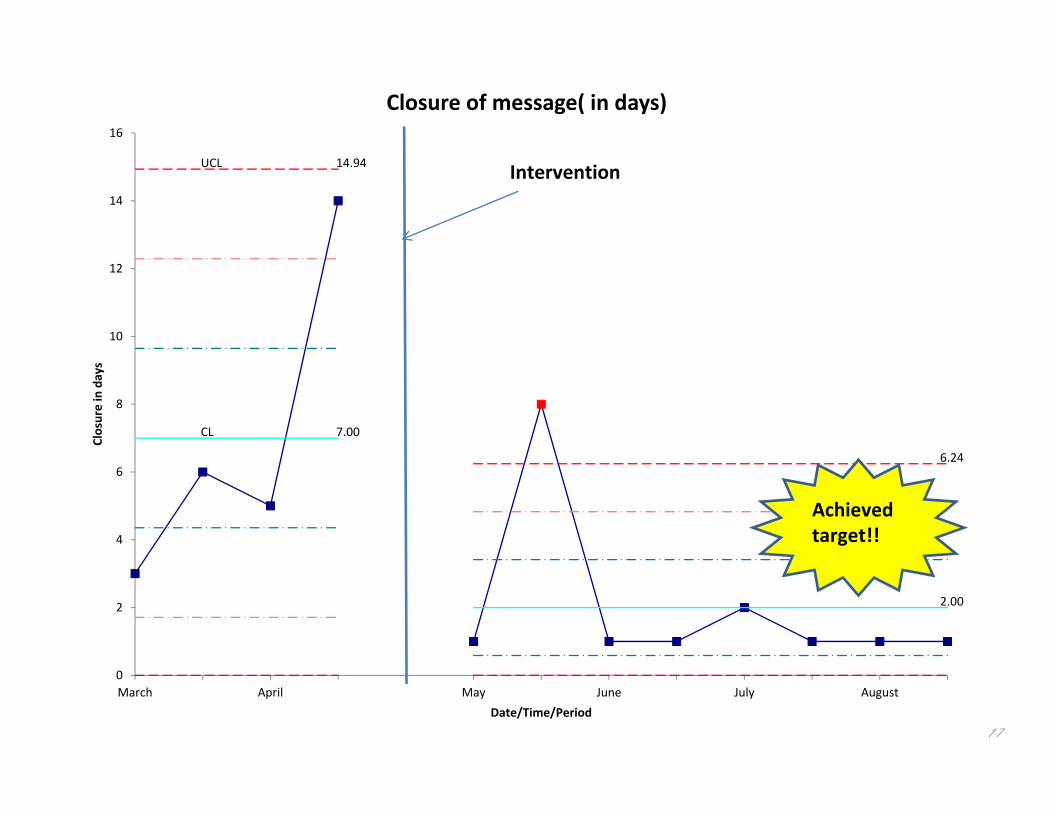
UCL 14.94
6.24
CL 7.00
2.00
0
2
4
6
8
10
12
14
16
March April May June July August
Closure in days
Date/Time/Period
Closure of message( in days)
Intervention
Achieved target!!
18
Return on InvestmentDetermination of return on investment was not possible due to the unexpected date change of My Chart implementation.
MY CHART advantages:1. Increased messages directly to provider2. Prompt response from provider3. Patients can see their results real‐time and may not be
necessary for them to call the clinic for results4. Patients can request medication refills through MY
CHART that will eliminate number of call center calls*
19
Expansion of Our ImplementationAct
• Reinforce education about template usage• Implementing MY CHART will reduce Call center burden
• Accuracy of documenting information is expected to improve
• Disseminating project protocol at the Family Practice Bready Green Clinic in downtown

20
Thank you!
Educating for Quality Improvement & Patient Safety