Embed Size (px)
Citation preview
Clinical Trials Overview
Bruce Craig
Clinical Trials
• A clinical trial : prospectively planned experiment for the purpose of evaluating potentially beneficial therapies or treatments
• In general, these studies are conducted under as many controlled conditions as possible so that they provide definitive answers to pre-determined, well-defined questions
Primary vs. Secondary Questions
• Primary– most important (i.e., central question)– ideally, only one – stated in advance– basis for design and sample size calcs
• Secondary– related to primary– also stated in advance– limited in number but usually more than 1
Examples
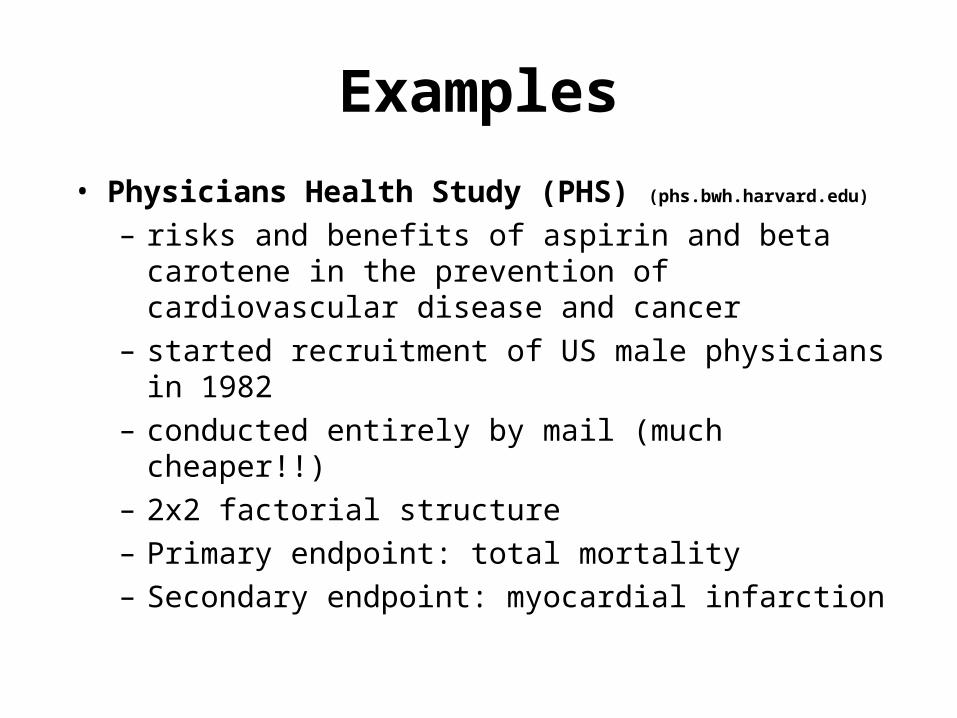
• Physicians Health Study (PHS) (phs.bwh.harvard.edu)
– risks and benefits of aspirin and beta carotene in the prevention of cardiovascular disease and cancer
– started recruitment of US male physicians in 1982– conducted entirely by mail (much cheaper!!)– 2x2 factorial structure – Primary endpoint: total mortality– Secondary endpoint: myocardial infarction
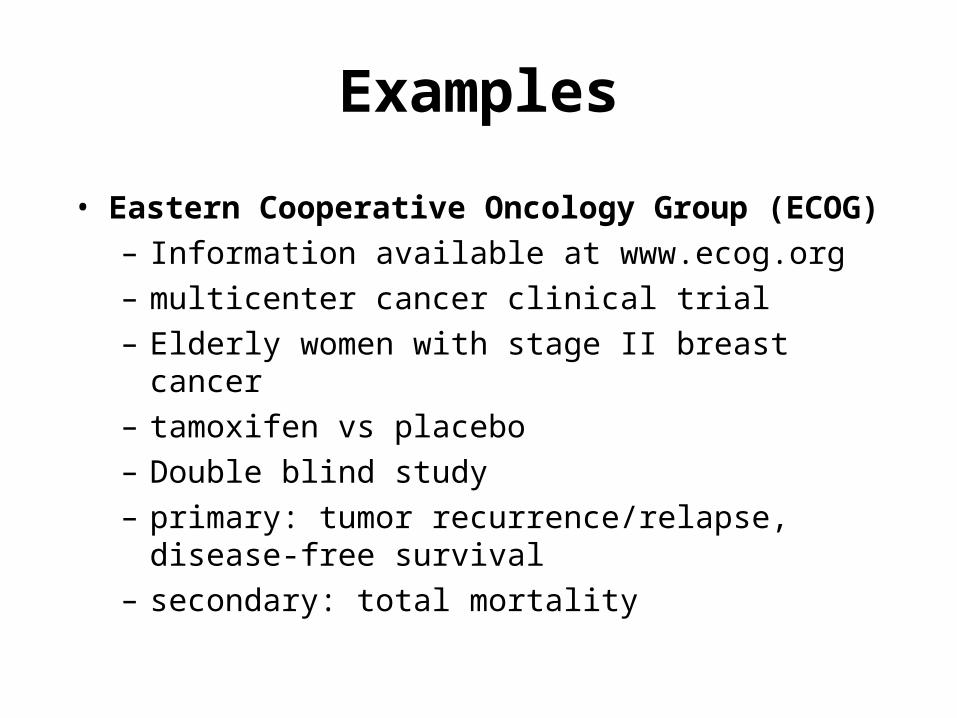
Examples
• Eastern Cooperative Oncology Group (ECOG) – Information available at www.ecog.org– multicenter cancer clinical trial– Elderly women with stage II breast cancer– tamoxifen vs placebo– Double blind study– primary: tumor recurrence/relapse, disease-free
survival– secondary: total mortality
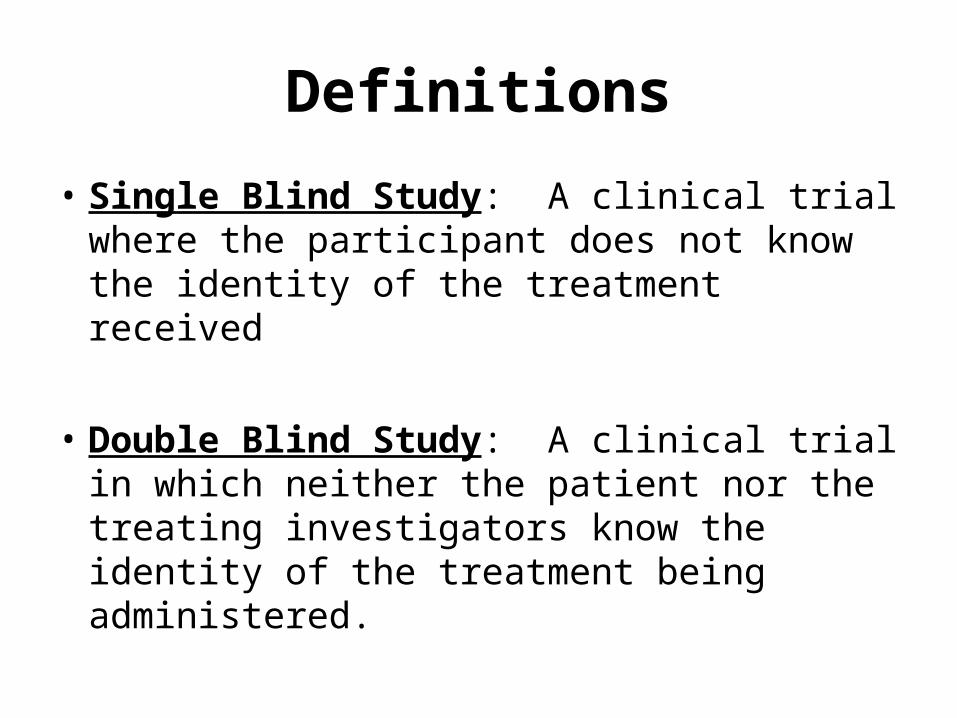
Definitions
• Single Blind Study: A clinical trial where the participant does not know the identity of the treatment received
• Double Blind Study: A clinical trial in which neither the patient nor the treating investigators know the identity of the treatment being administered.
Definitions
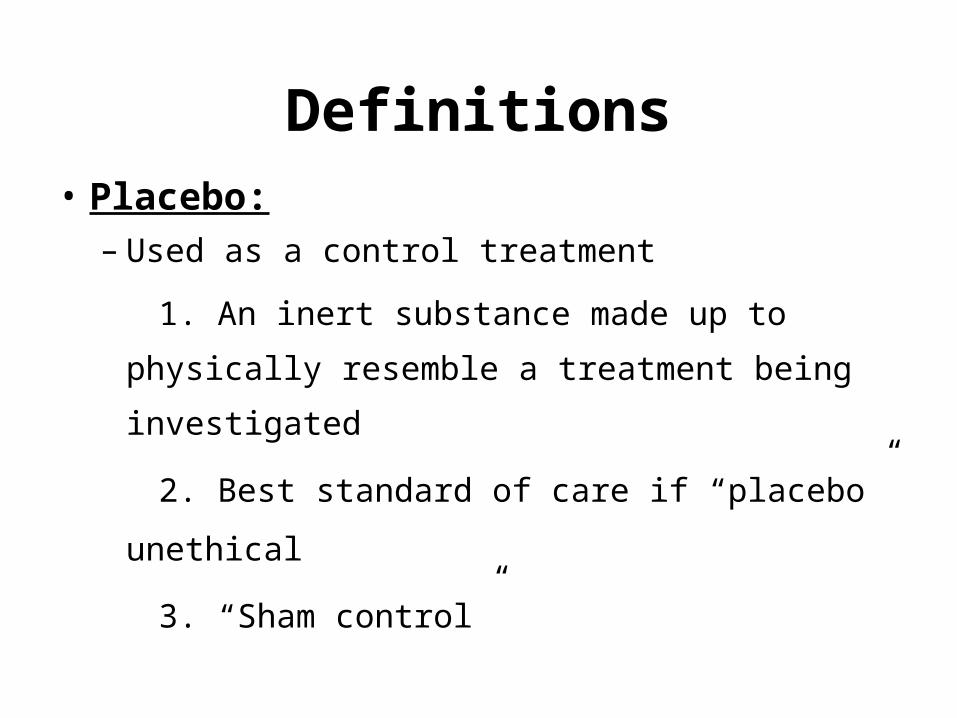
• Placebo: – Used as a control treatment
1. An inert substance made up to physically
resemble a treatment being investigated
2. Best standard of care if “placebo” unethical
3. “Sham control”
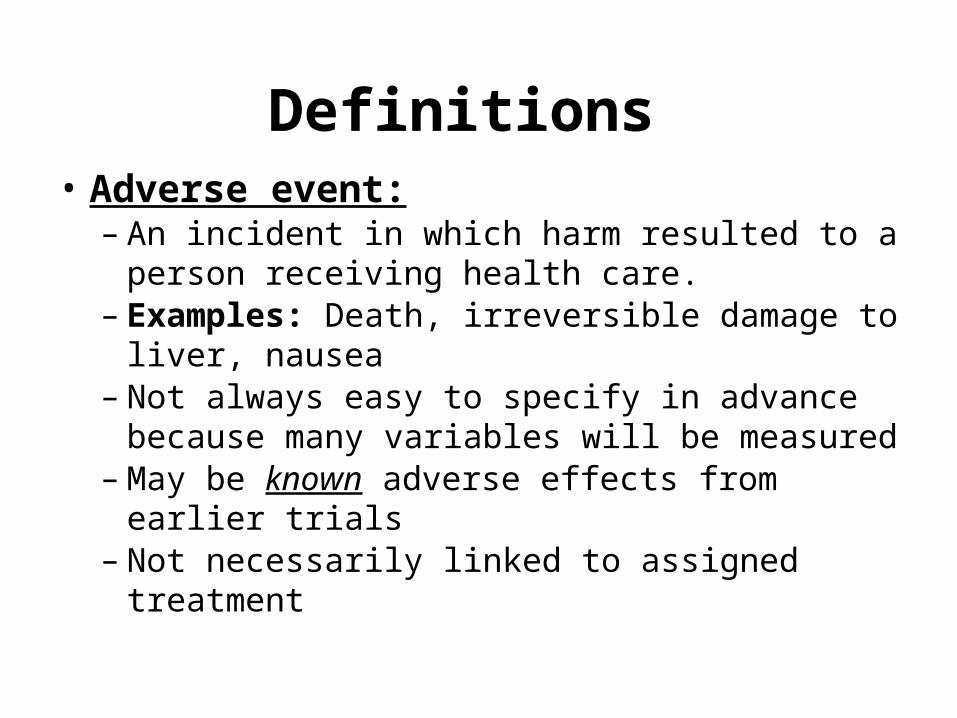
Definitions • Adverse event:
– An incident in which harm resulted to a person receiving health care.
– Examples: Death, irreversible damage to liver, nausea
– Not always easy to specify in advance because many variables will be measured
– May be known adverse effects from earlier trials
– Not necessarily linked to assigned treatment
Adverse Events
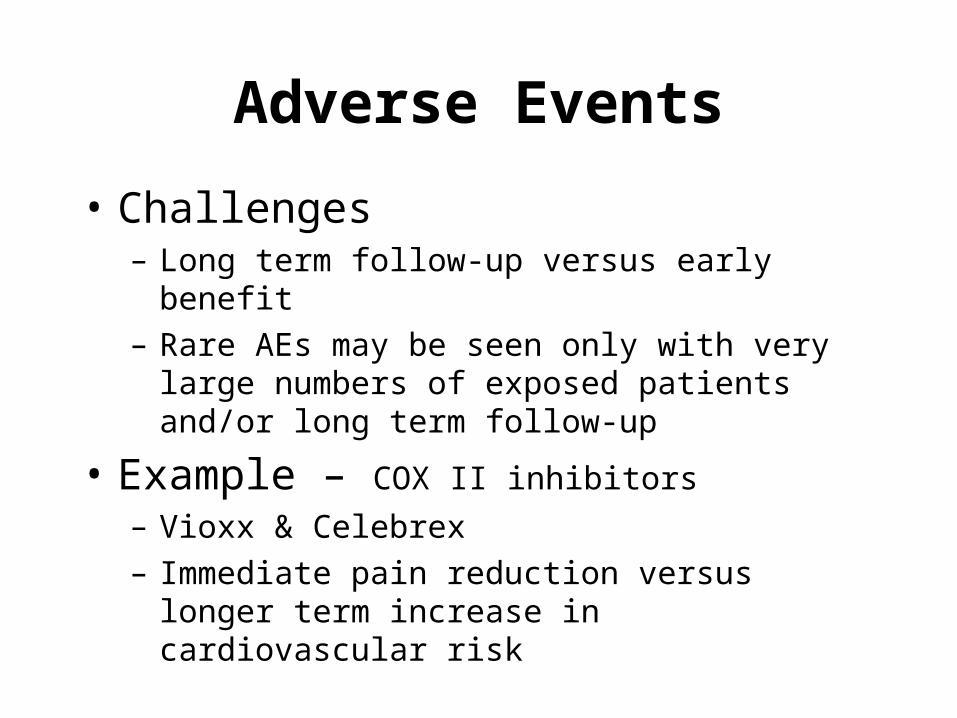
• Challenges– Long term follow-up versus early benefit– Rare AEs may be seen only with very large
numbers of exposed patients and/or long term follow-up
• Example – COX II inhibitors
– Vioxx & Celebrex– Immediate pain reduction versus longer term
increase in cardiovascular risk
Surrogate Endpoints
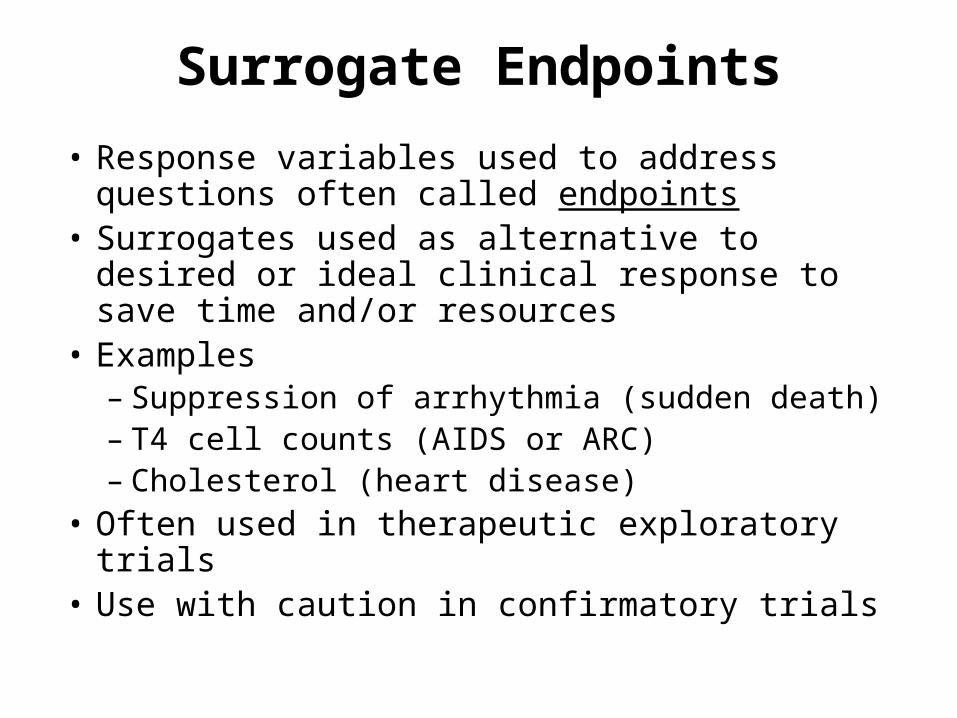
• Response variables used to address questions often called endpoints
• Surrogates used as alternative to desired or ideal clinical response to save time and/or resources
• Examples– Suppression of arrhythmia (sudden death)– T4 cell counts (AIDS or ARC)– Cholesterol (heart disease)
• Often used in therapeutic exploratory trials • Use with caution in confirmatory trials
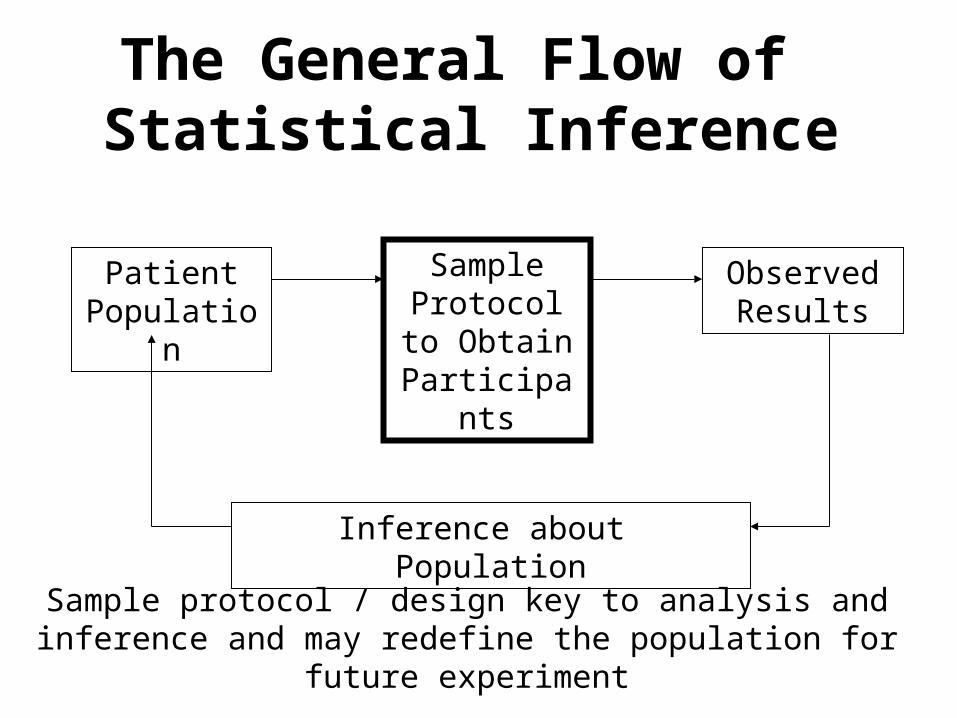
The General Flow of Statistical Inference
Patient Population
Sample Protocol to
Obtain Participants
Observed Results
Inference about Population
Sample protocol / design key to analysis and inference and may redefine the population for future experiment
Types of Clinical Trials
• Randomized
• Non-Randomized
• Single-Center
• Multi-Center
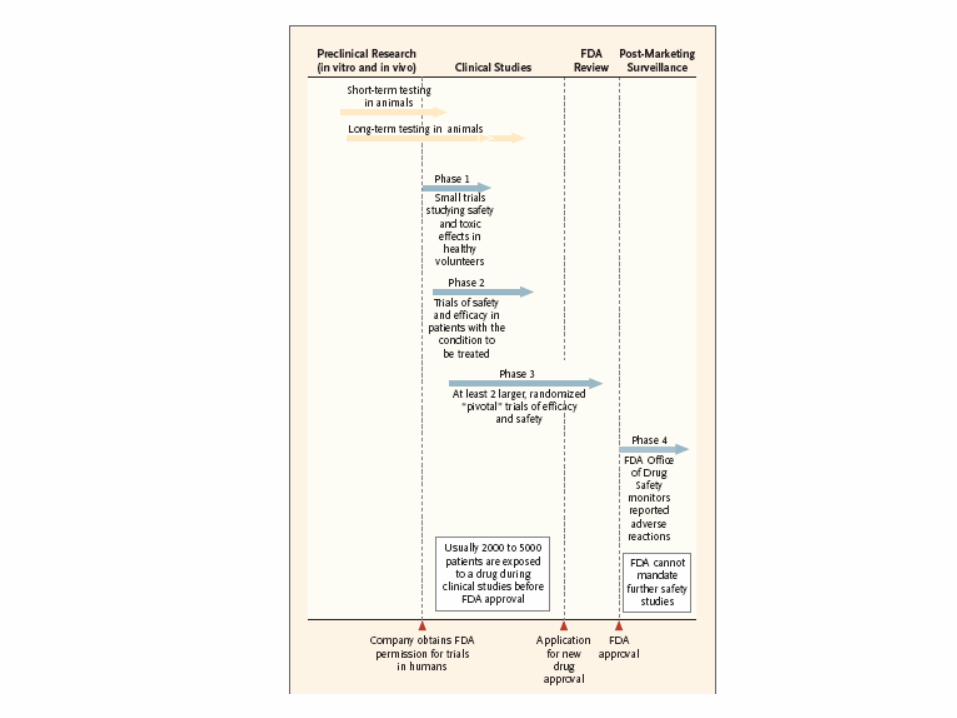
• Phase I, II, III, IV Trials
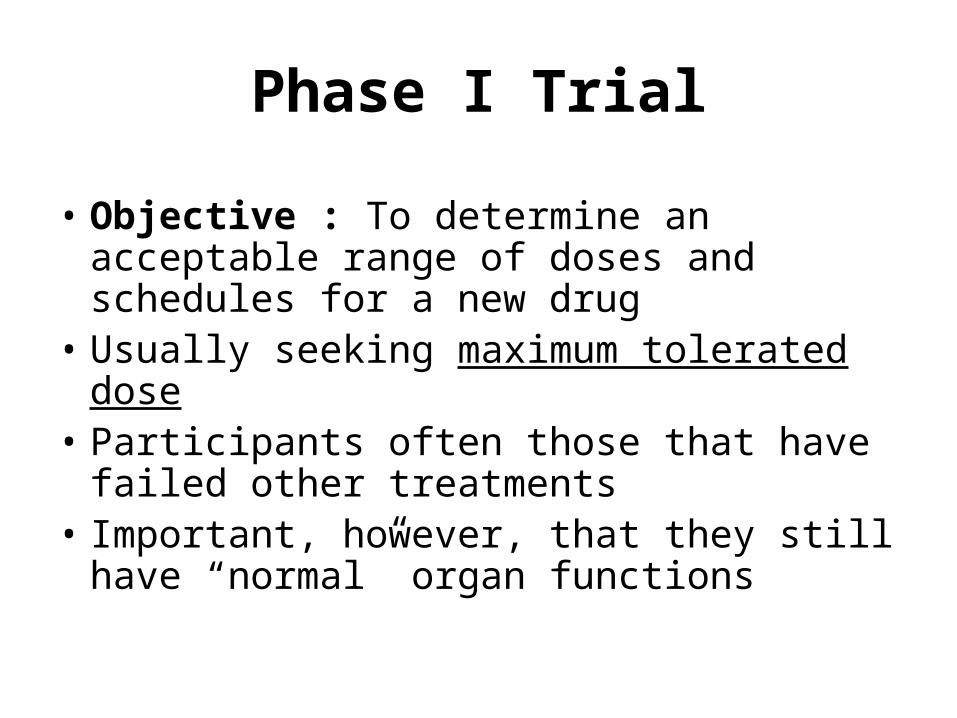
Phase I Trial
• Objective : To determine an acceptable range of doses and schedules for a new drug
• Usually seeking maximum tolerated dose• Participants often those that have failed
other treatments • Important, however, that they still have
“normal” organ functions
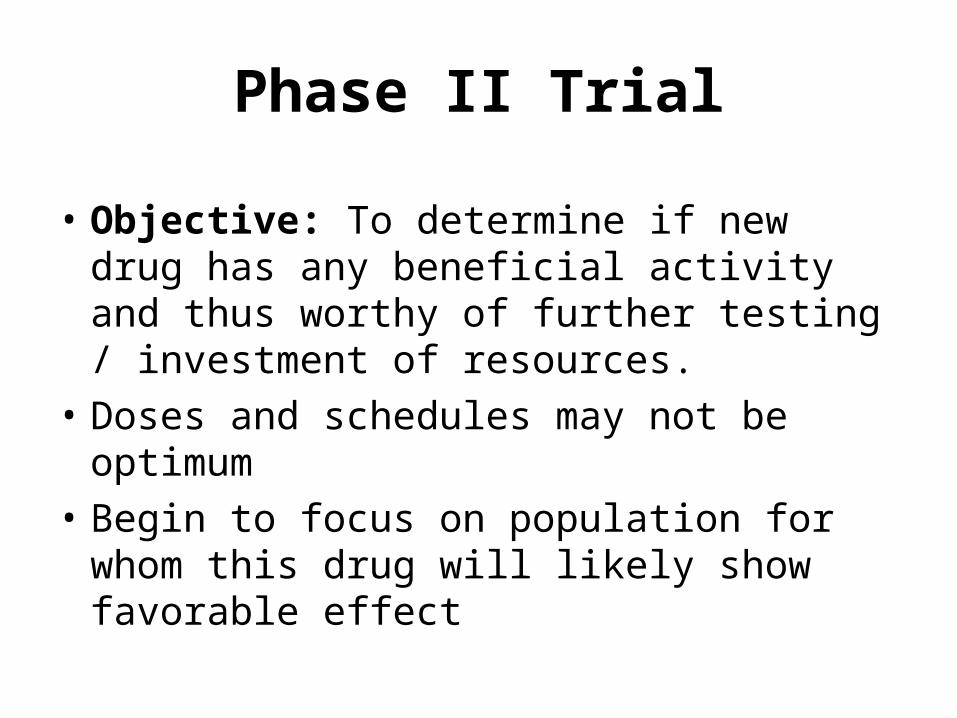
Phase II Trial
• Objective: To determine if new drug has any beneficial activity and thus worthy of further testing / investment of resources.
• Doses and schedules may not be optimum
• Begin to focus on population for whom this drug will likely show favorable effect
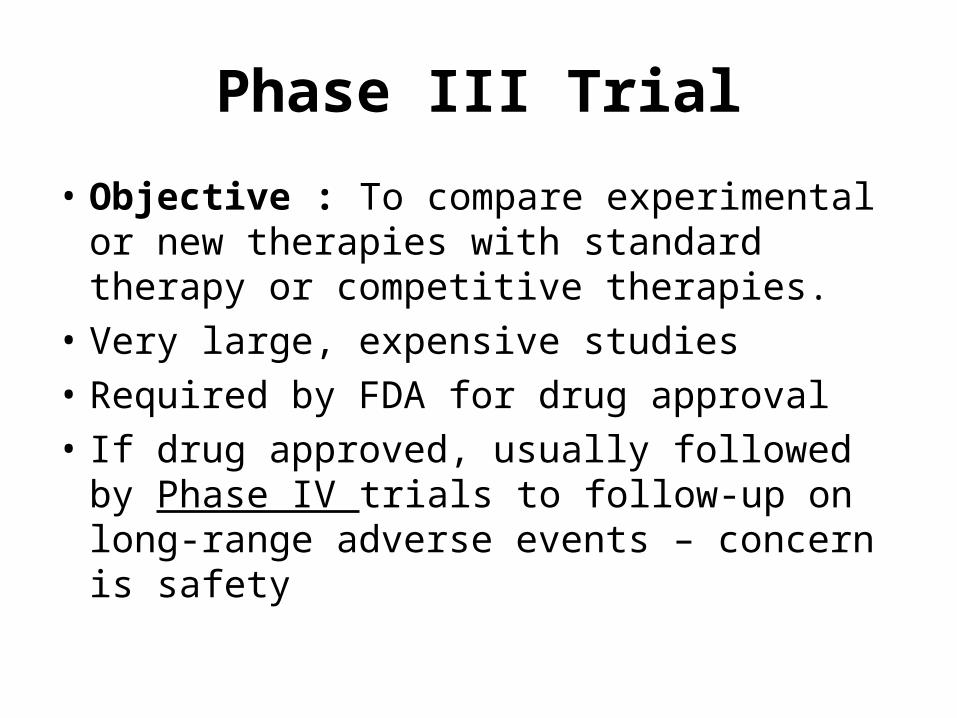
Phase III Trial
• Objective : To compare experimental or new therapies with standard therapy or competitive therapies.
• Very large, expensive studies
• Required by FDA for drug approval
• If drug approved, usually followed by Phase IV trials to follow-up on long-range adverse events – concern is safety
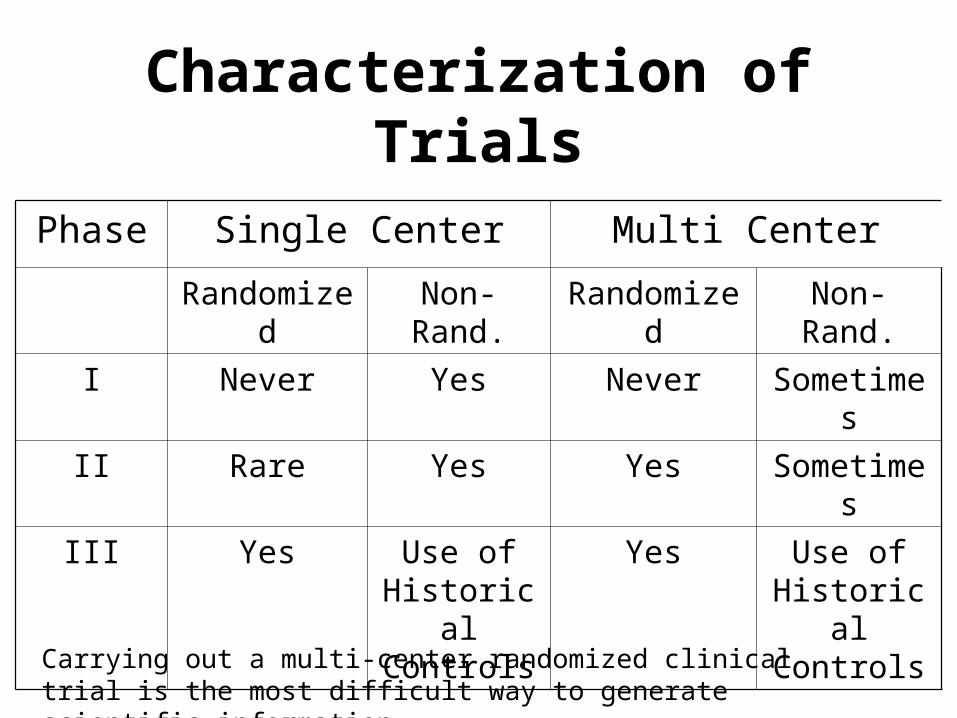
Characterization of Trials
Phase Single Center Multi Center
Randomized Non-Rand. Randomized Non-Rand.
I Never Yes Never Sometimes
II Rare Yes Yes Sometimes
III Yes Use of Historical Controls
Yes Use of Historical Controls
Carrying out a multi-center randomized clinical trial is the most difficult way to generate scientific information.
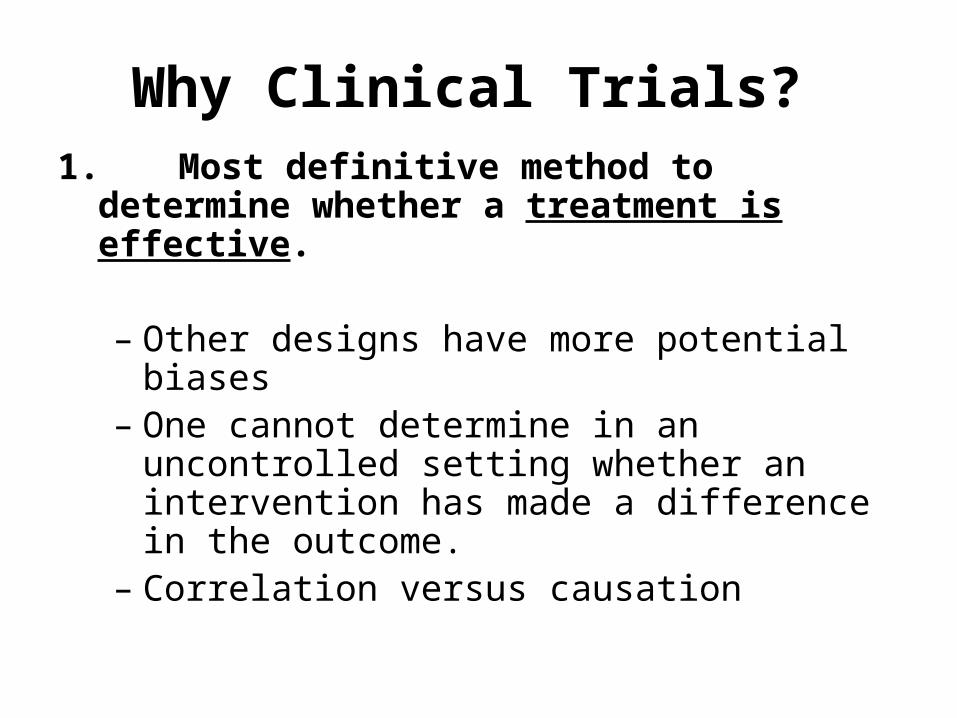
Why Clinical Trials?1. Most definitive method to determine
whether a treatment is effective.
– Other designs have more potential biases
– One cannot determine in an uncontrolled setting whether an intervention has made a difference in the outcome.
– Correlation versus causation
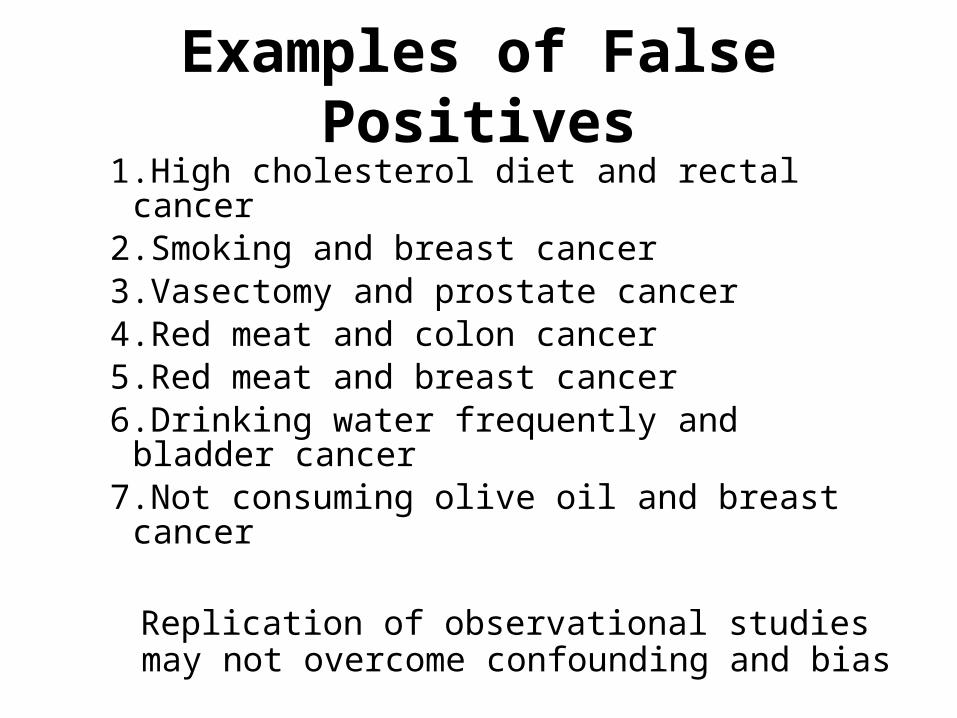
Examples of False Positives1.High cholesterol diet and rectal cancer2.Smoking and breast cancer3.Vasectomy and prostate cancer4.Red meat and colon cancer5.Red meat and breast cancer6.Drinking water frequently and bladder cancer7.Not consuming olive oil and breast cancer
Replication of observational studies may not overcome confounding and bias
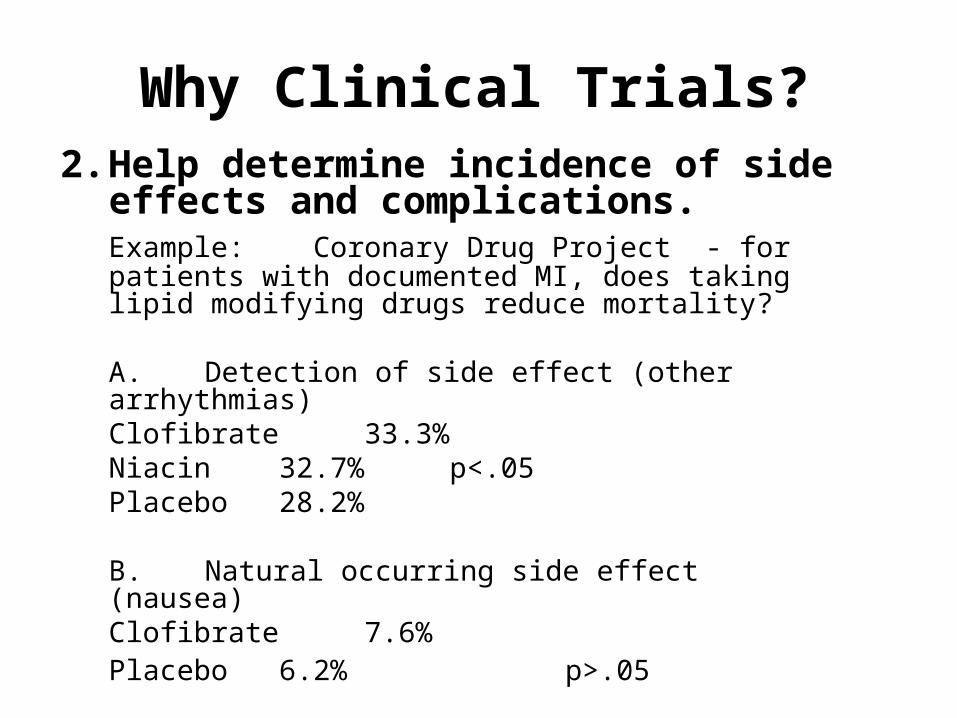
Why Clinical Trials?2. Help determine incidence of side
effects and complications.Example: Coronary Drug Project - for patients with documented MI, does taking lipid modifying drugs reduce mortality?
A. Detection of side effect (other arrhythmias)Clofibrate 33.3%Niacin 32.7% p<.05Placebo 28.2%
B. Natural occurring side effect (nausea)Clofibrate 7.6%Placebo 6.2% p>.05
Why Clinical Trials?
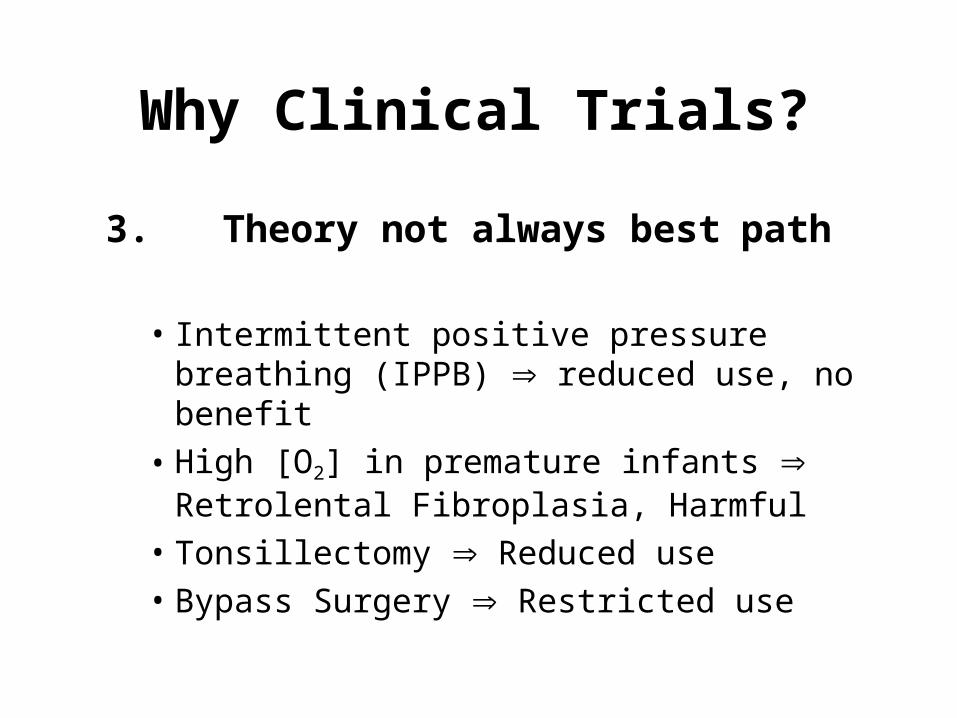
3.Theory not always best path
• Intermittent positive pressure breathing (IPPB) reduced use, no benefit
• High [O2] in premature infants Retrolental Fibroplasia, Harmful
• Tonsillectomy Reduced use• Bypass Surgery Restricted use
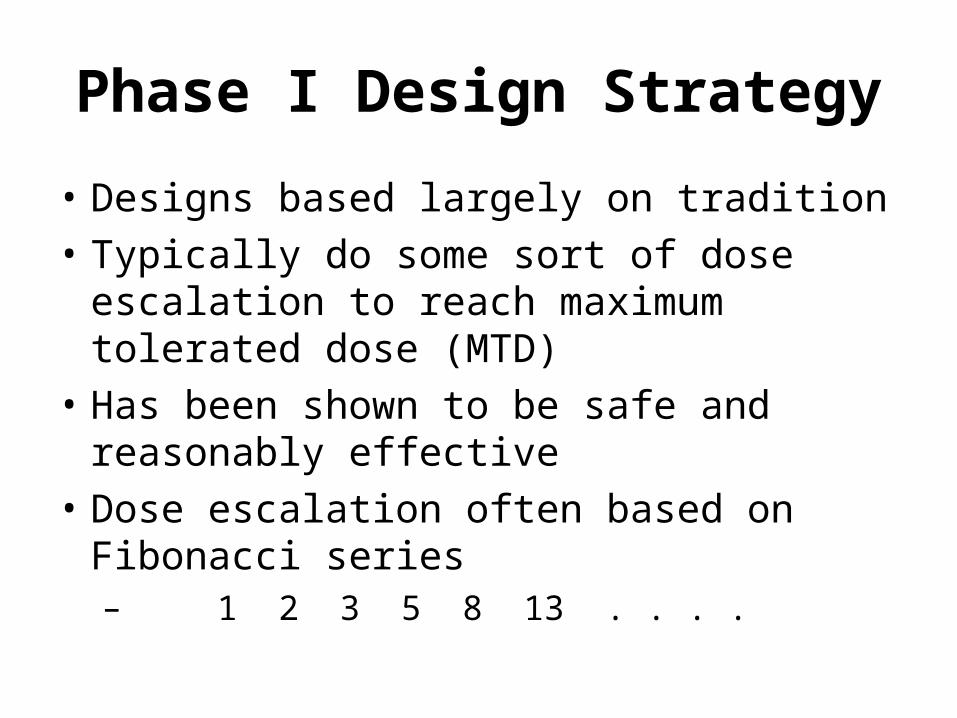
Phase I Design Strategy
• Designs based largely on tradition
• Typically do some sort of dose escalation to reach maximum tolerated dose (MTD)
• Has been shown to be safe and reasonably effective
• Dose escalation often based on Fibonacci series– 1 2 3 5 8 13 . . . .
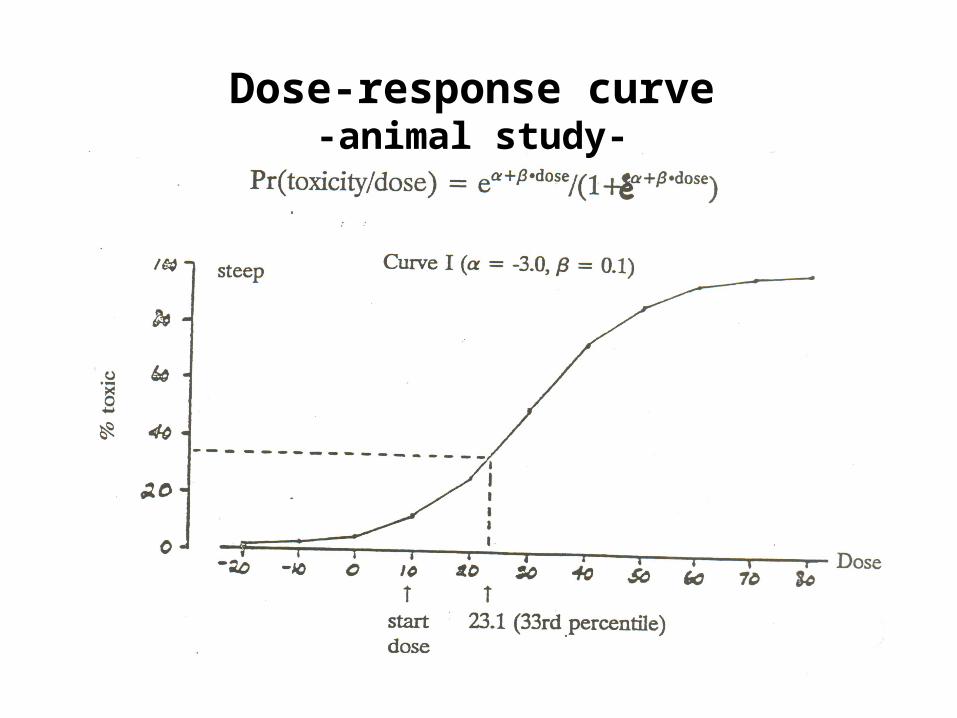
Dose-response curve-animal study-
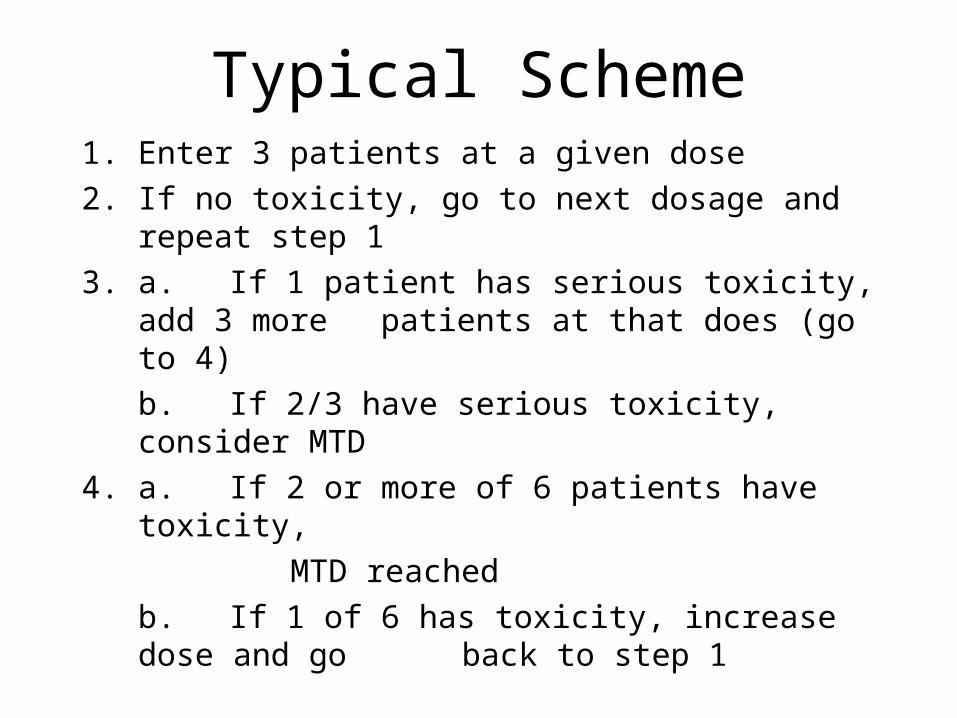
Typical Scheme1. Enter 3 patients at a given dose
2. If no toxicity, go to next dosage and repeat step 1
3. a. If 1 patient has serious toxicity, add 3 more patients at that does (go to 4)
b. If 2/3 have serious toxicity, consider MTD
4. a. If 2 or more of 6 patients have toxicity,
MTD reached
b. If 1 of 6 has toxicity, increase dose and go back to step 1
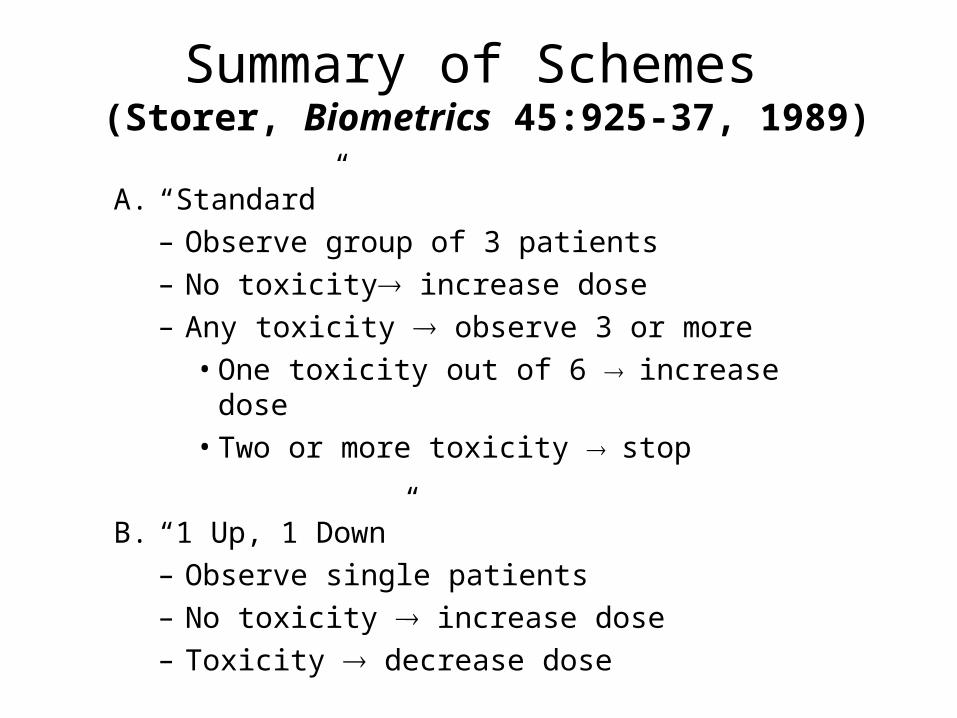
Summary of Schemes (Storer, Biometrics 45:925-37, 1989)
A. “Standard”– Observe group of 3 patients– No toxicity increase dose– Any toxicity observe 3 or more
• One toxicity out of 6 increase dose• Two or more toxicity stop
B. “1 Up, 1 Down”– Observe single patients– No toxicity increase dose– Toxicity decrease dose
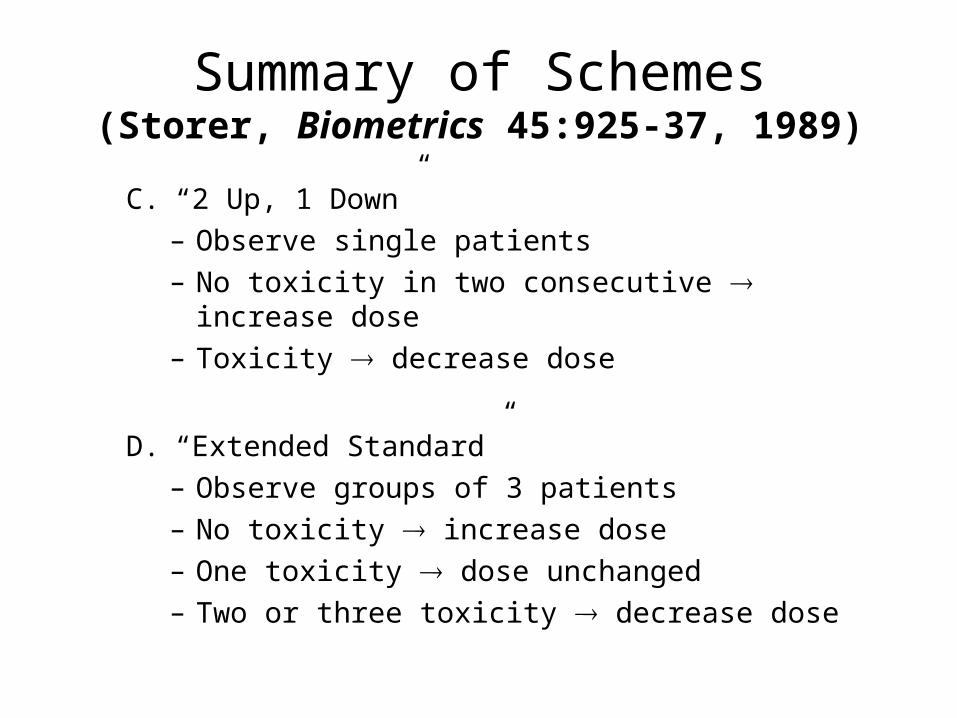
Summary of Schemes(Storer, Biometrics 45:925-37, 1989)
C. “2 Up, 1 Down”– Observe single patients– No toxicity in two consecutive increase dose– Toxicity decrease dose
D. “Extended Standard”– Observe groups of 3 patients– No toxicity increase dose– One toxicity dose unchanged– Two or three toxicity decrease dose
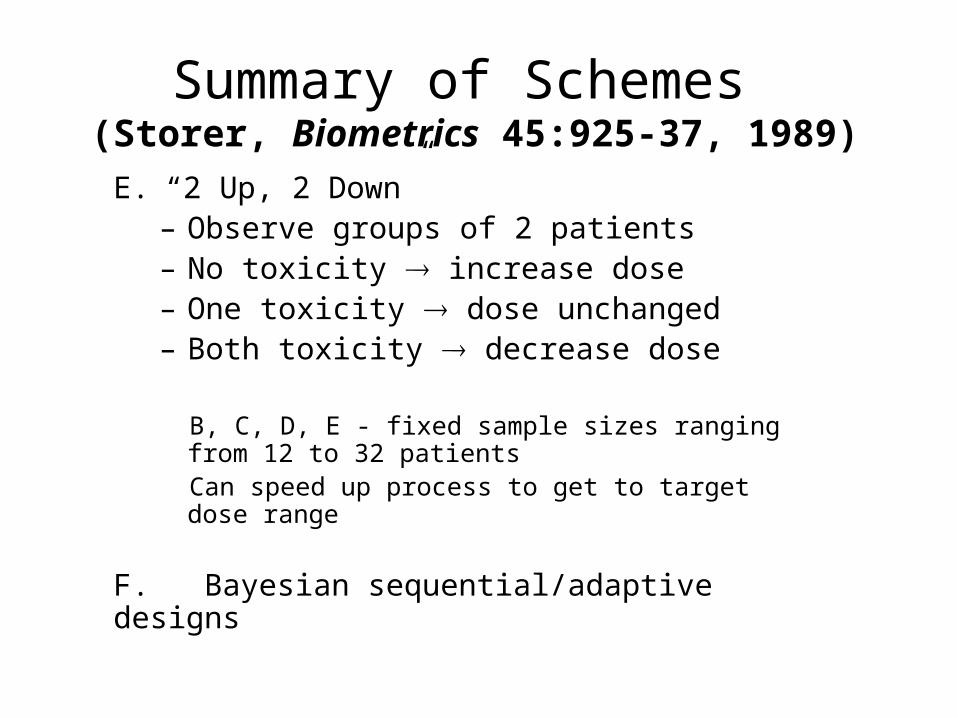
Summary of Schemes (Storer, Biometrics 45:925-37, 1989)
E. “2 Up, 2 Down”– Observe groups of 2 patients– No toxicity increase dose– One toxicity dose unchanged– Both toxicity decrease dose
B, C, D, E - fixed sample sizes ranging from 12 to 32 patients
Can speed up process to get to target dose range
F. Bayesian sequential/adaptive designs
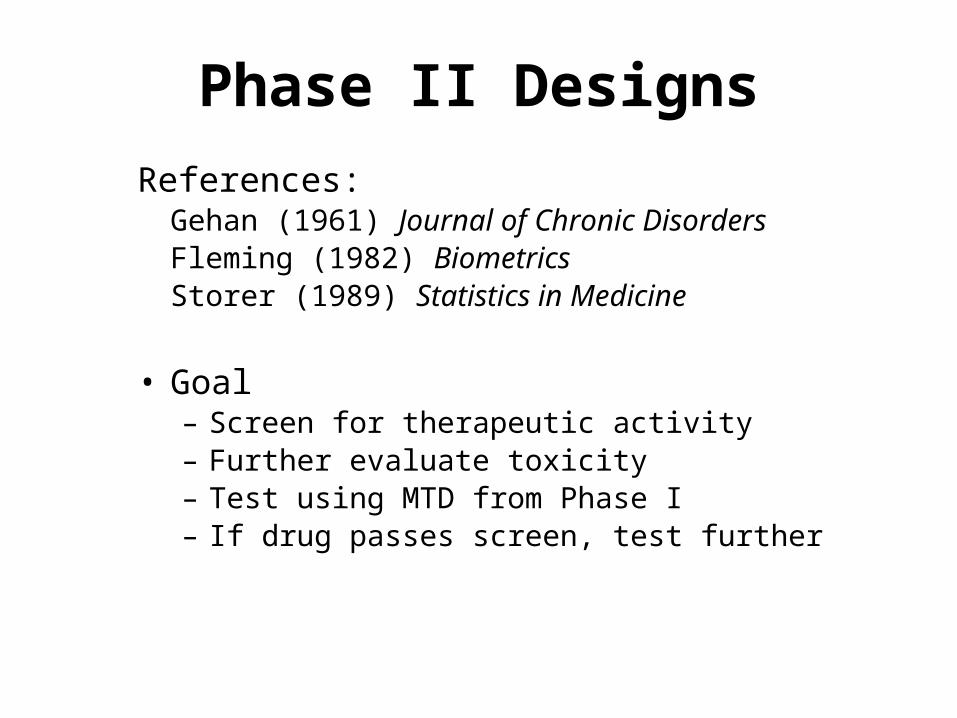
Phase II Designs
References:Gehan (1961) Journal of Chronic DisordersFleming (1982) BiometricsStorer (1989) Statistics in Medicine
• Goal– Screen for therapeutic activity– Further evaluate toxicity– Test using MTD from Phase I– If drug passes screen, test further
Phase II Design
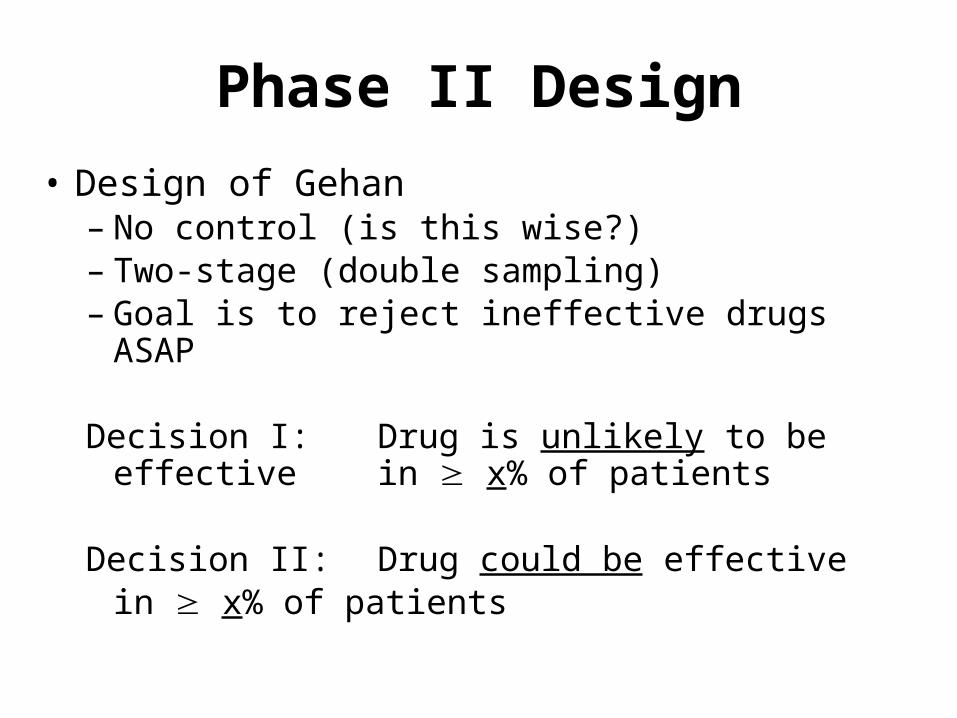
• Design of Gehan– No control (is this wise?)– Two-stage (double sampling)– Goal is to reject ineffective drugs ASAP
Decision I: Drug is unlikely to be effective in x% of patients
Decision II: Drug could be effective in x% of patients
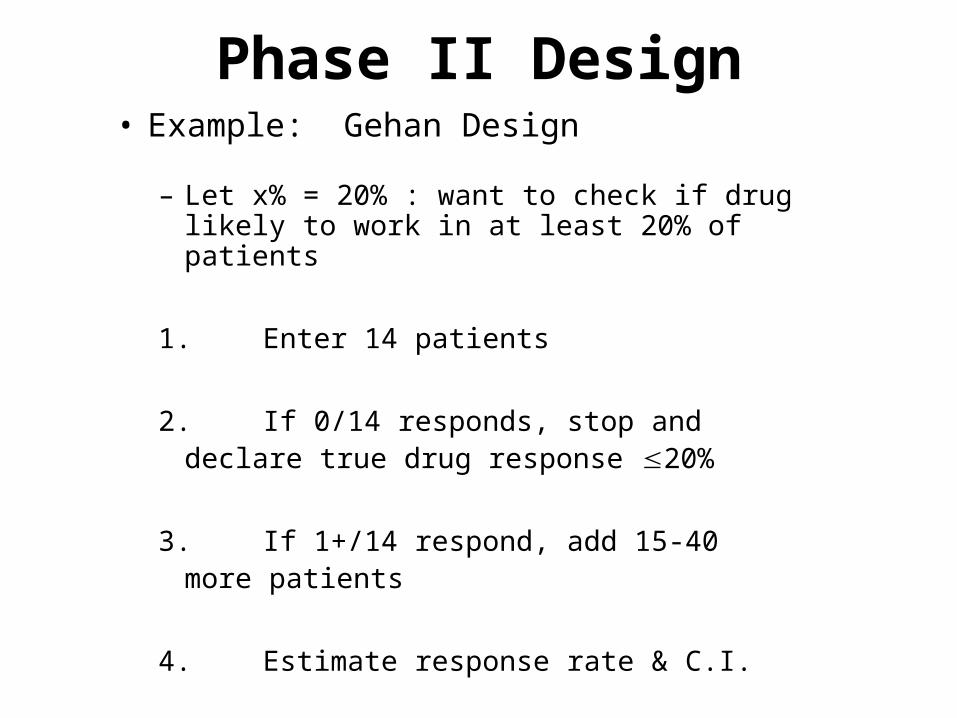
Phase II Design• Example: Gehan Design
– Let x% = 20% : want to check if drug likely to work in at least 20% of patients
1. Enter 14 patients
2. If 0/14 responds, stop anddeclare true drug response 20%
3. If 1+/14 respond, add 15-40 more patients
4. Estimate response rate & C.I.
Gehan Design
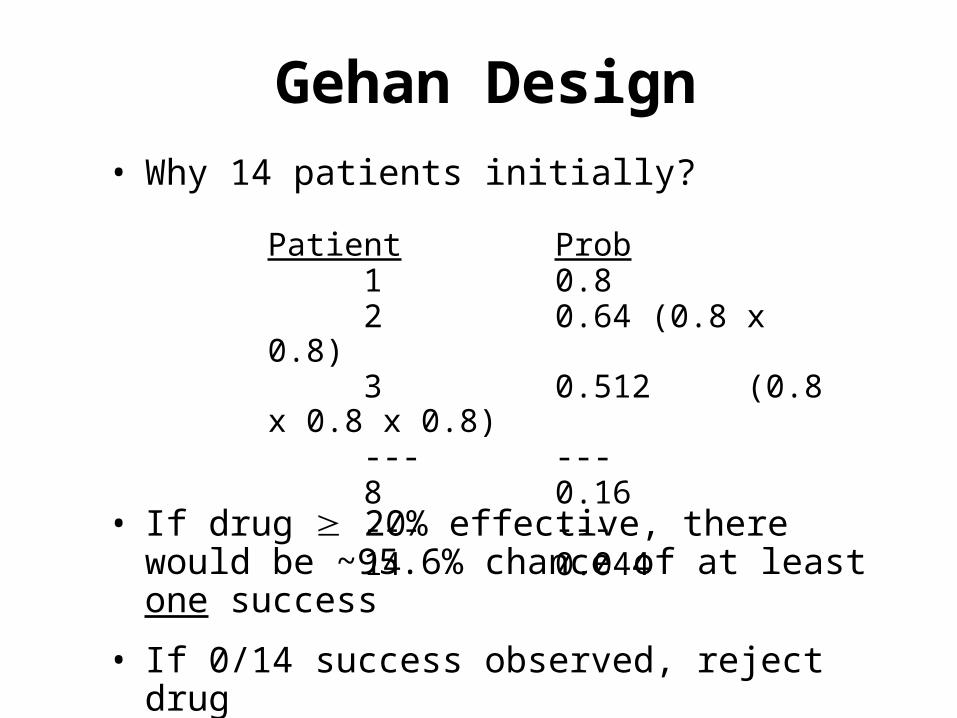
• Why 14 patients initially?
• If drug 20% effective, there would be ~95.6% chance of at least one success
• If 0/14 success observed, reject drug
Patient Prob1 0.82 0.64 (0.8 x 0.8)3 0.512 (0.8 x 0.8 x
0.8)--- ---8 0.16--- ---14 0.044
Phase II Design
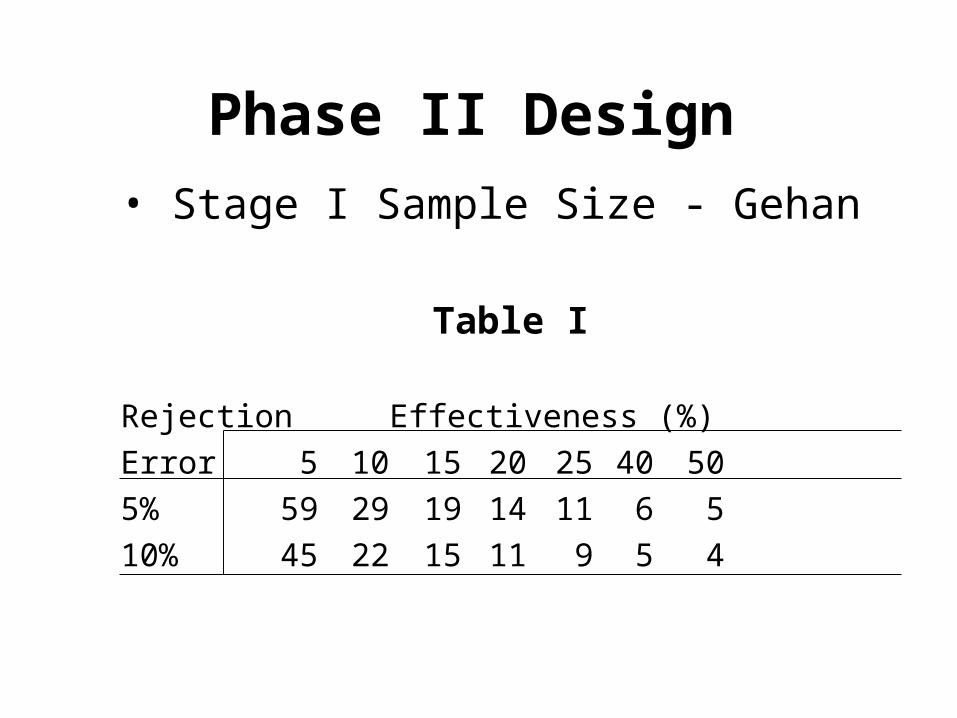
• Stage I Sample Size - Gehan
Table I
Rejection Effectiveness (%)
Error 5 10 15 20 25 40 50
5% 59 29 19 14 11 6 5
10% 45 22 15 11 9 5 4
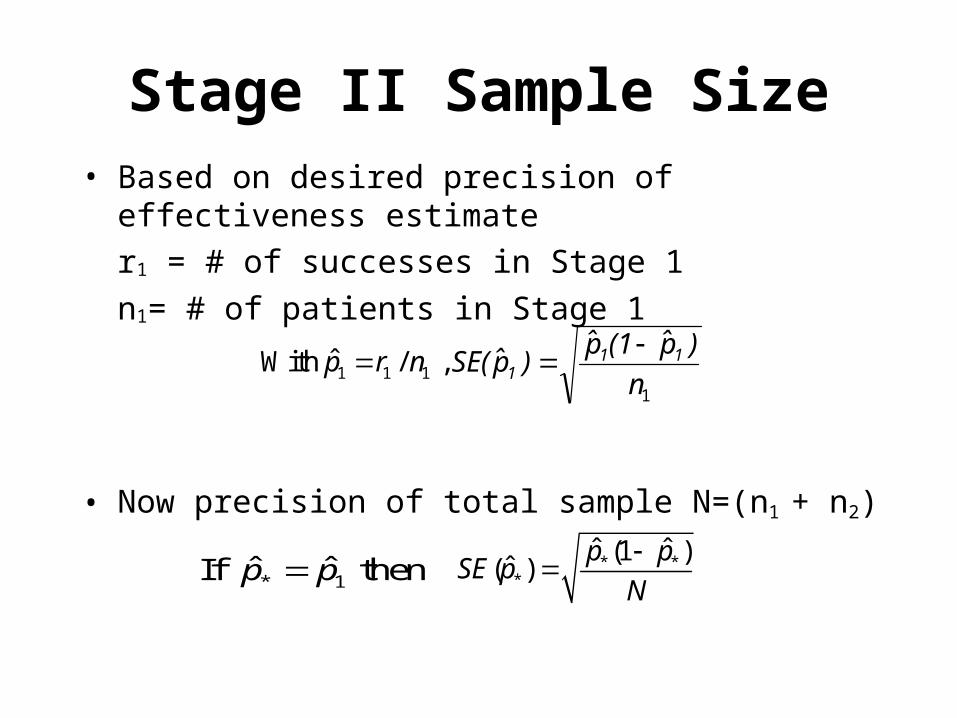
Stage II Sample Size• Based on desired precision of effectiveness estimate
r1 = # of successes in Stage 1
n1= # of patients in Stage 1
• Now precision of total sample N=(n1 + n2)
1 1 1ˆWith / , p r n1n
)p̂(1p̂)p̂SE( 11
1
* **
ˆ ˆ(1 )ˆ( )
p pSE p
N
* 1ˆ ˆIf then p p
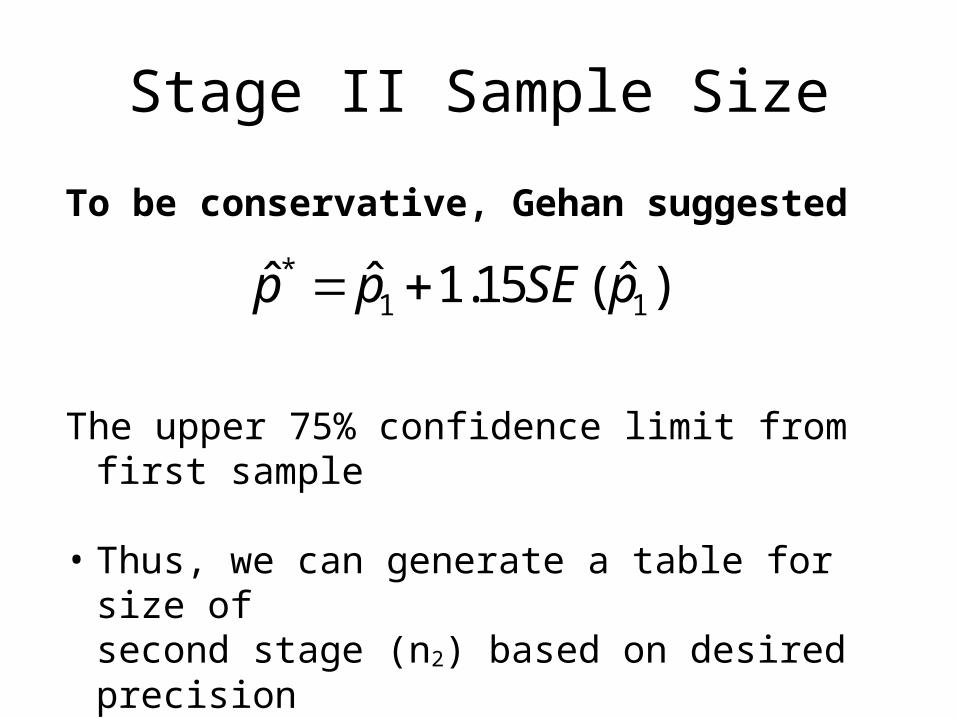
Stage II Sample Size
*1 1ˆ ˆ ˆ1.15 ( )p p SE p
To be conservative, Gehan suggested
The upper 75% confidence limit from first sample
• Thus, we can generate a table for size ofsecond stage (n2) based on desired precision
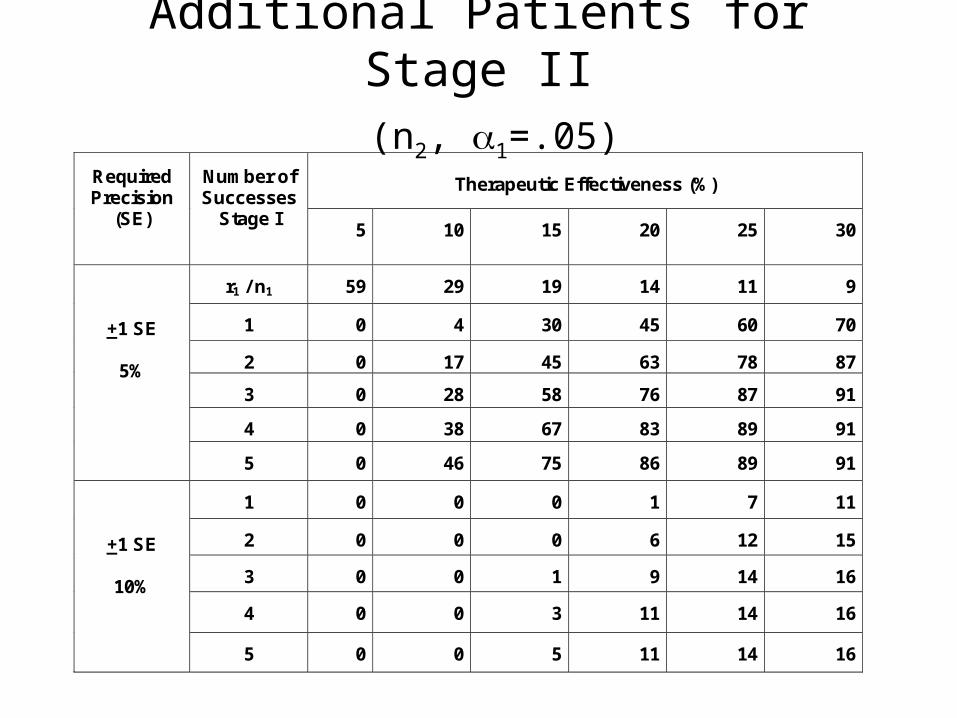
Additional Patients for Stage II (n2, 1=.05)
Therapeutic Effectiveness (%)
Required Precision
(SE)
Number of Successes
Stage I 5
10
15
20
25
30
r1 / n1
59
29
19
14
11
9
1
0
4
30
45
60
70
2
0
17
45
63
78
87
3
0
28
58
76
87
91
4
0
38
67
83
89
91
+1 SE
5%
5
0
46
75
86
89
91
1
0
0
0
1
7
11
2
0
0
0
6
12
15
3
0
0
1
9
14
16
4
0
0
3
11
14
16
+1 SE
10%
5
0
0
5
11
14
16
Phase II Trial Designs
• Many cancer Phase II trials follow Gehan design• Many other diseases could – there seems to be
no standard non-cancer Phase II design• Might also randomize patients into multiple arms
each with a different dose – can then get a dose response curve
• Other two-stage designs based on determining p1-p0 > x% where p0 is the standard care combination
• The foundation for the design of controlled experiments established for agricultural experiments
• The need for control groups in clinical studies recognized, but not widely accepted until 1950s
• No comparison groups needed when results dramatic:– Penicillin for pneumococcal pneumonia– Rabies vaccine
• Use of proper control group necessary due to:– Natural history of most diseases– Variability of a patient's response to intervention
Phase III Trial Designs
Phase III Design
• Comparative Studies• Experimental Group vs. Control Group• Establishing a Control
1. Historical
2. Concurrent
3. Randomized
• Randomized Control Trial (RCT) is the gold standard– Eliminates several sources of bias
Purpose of Control Group
• To allow discrimination of patient outcomes caused by test treatment from those caused by other factors– Natural progression of disease– Observer/patient expectations– Other treatment
• Fair comparisons– Necessary to be informative
Goals of Phase III Clinical Trial
• Superiority Trials– A controlled trial may demonstrate
efficacy of the test treatment by showing that it is superior to the control• No treatment• Best standard of care
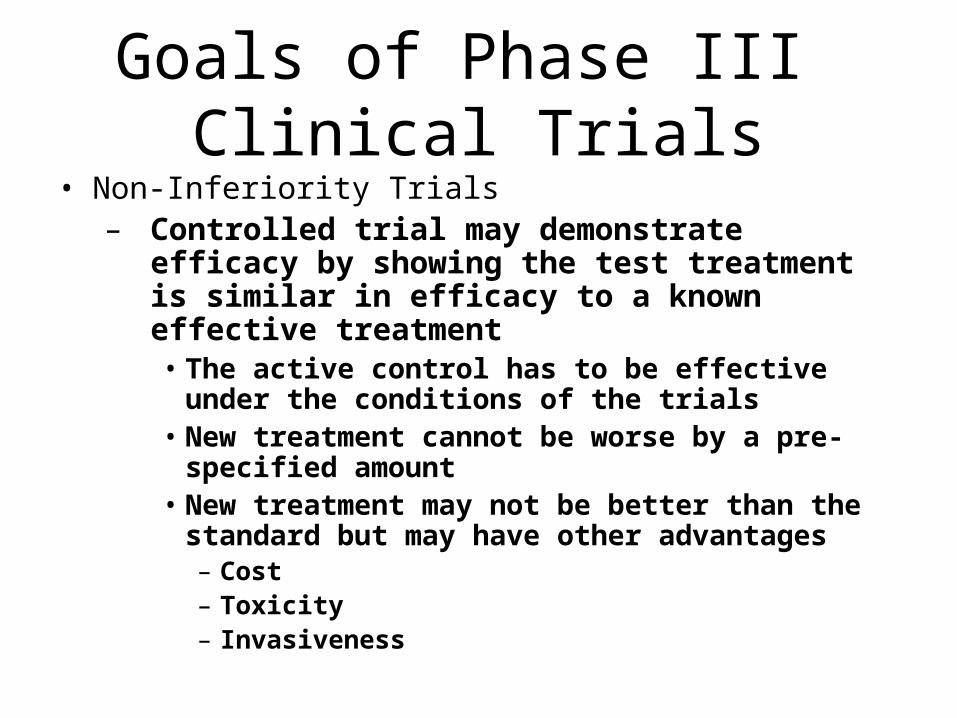
Goals of Phase III Clinical Trials
• Non-Inferiority Trials– Controlled trial may demonstrate efficacy by
showing the test treatment is similar in efficacy to a known effective treatment• The active control has to be effective under the
conditions of the trials• New treatment cannot be worse by a pre-specified
amount• New treatment may not be better than the standard
but may have other advantages– Cost– Toxicity– Invasiveness
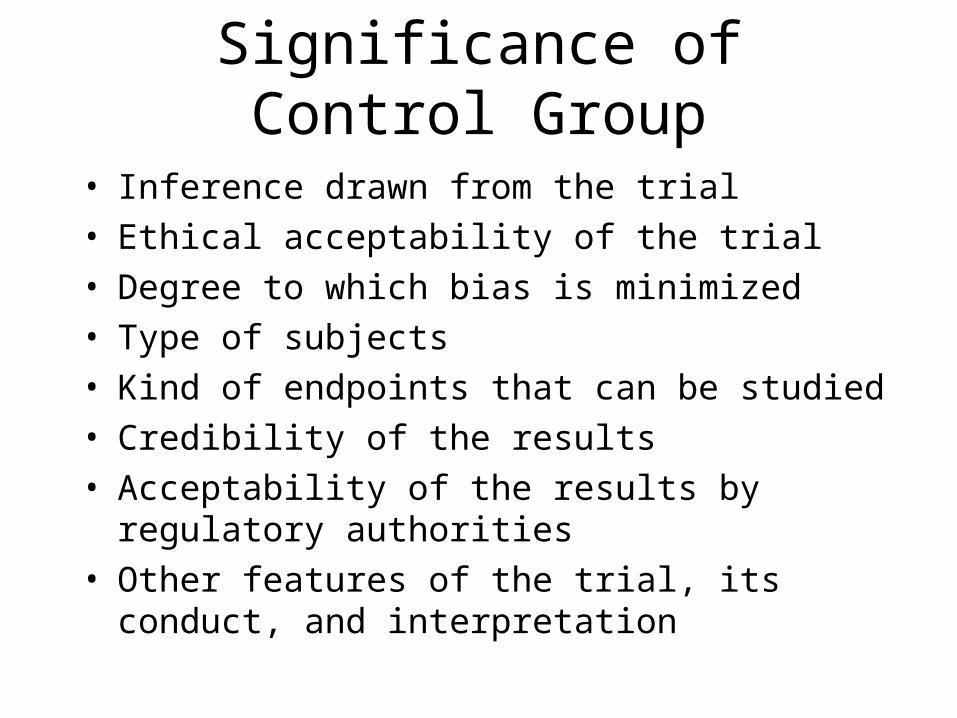
Significance of Control Group
• Inference drawn from the trial
• Ethical acceptability of the trial
• Degree to which bias is minimized
• Type of subjects
• Kind of endpoints that can be studied
• Credibility of the results
• Acceptability of the results by regulatory authorities
• Other features of the trial, its conduct, and interpretation
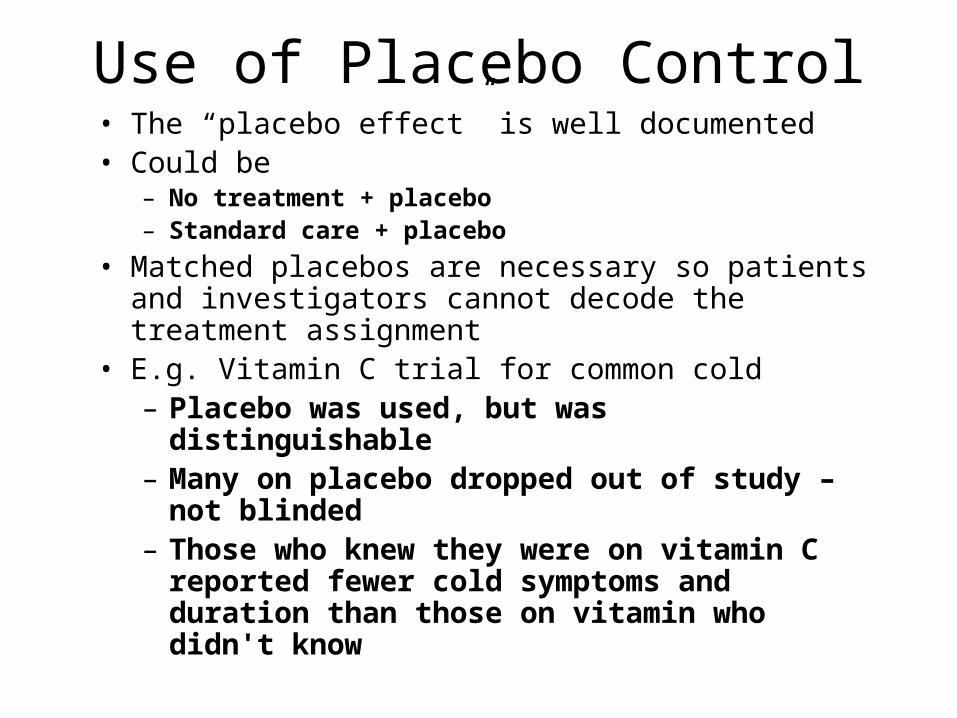
Use of Placebo Control• The “placebo effect” is well documented• Could be
– No treatment + placebo– Standard care + placebo
• Matched placebos are necessary so patients and investigators cannot decode the treatment assignment
• E.g. Vitamin C trial for common cold– Placebo was used, but was distinguishable– Many on placebo dropped out of study – not
blinded– Those who knew they were on vitamin C
reported fewer cold symptoms and duration than those on vitamin who didn't know
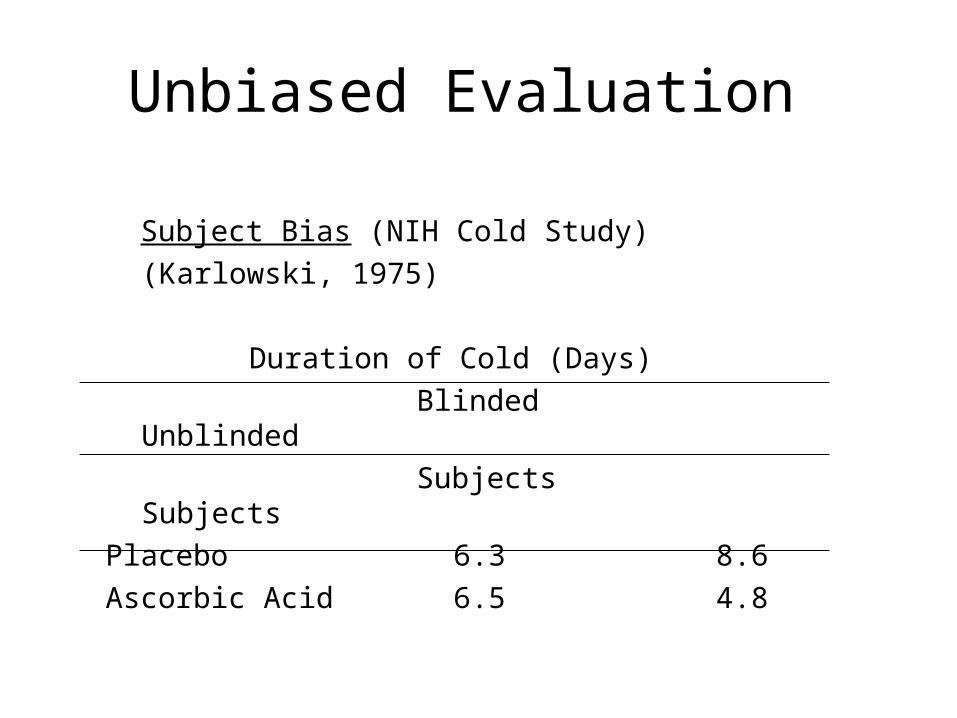
Unbiased Evaluation
Subject Bias (NIH Cold Study)
(Karlowski, 1975)
Duration of Cold (Days)
Blinded Unblinded
Subjects Subjects
Placebo 6.3 8.6
Ascorbic Acid 6.5 4.8
• A new treatment used in a series of subjects• Outcome compared with previous series of
comparable subjects
• Non-randomized• Rapid, inexpensive, good for initial testing of new
treatments
• Vulnerable to biasesDifferent underlying populationsCriteria for selecting patientsPatient careDiagnostic or evaluating criteria
Historical Control Study
Randomized ControlClinical Trial
• Reference: Byar et al. (1976)
New England Journal of Medicine
• Patients assigned at random to either treatment(s) or control
• Considered to be “Gold Standard”

Disadvantages of Randomized Control Clinical Trial
1. Generalizable Results?– Subjects may not represent general
patient population – volunteer effect
2. Recruitment– Twice as many new patients
3. Acceptability of Randomization Process– Some physicians will refuse– Some patients will refuse
4. Administrative Complexity
Ethics of Randomization• Statistician/clinical trialist must sell benefits of randomization
• Ethics MD should do what he thinks is best for his patient– Two MD's might ethically treat same patient quite differently
• Chalmers & Shaw (1970) Annals New York Academy of Science
1. If MD "knows" best treatment, should not participate in trial
2. If in doubt, randomization gives each patient equal chance to
receive one of therapies (i.e. best)
3. More ethical way of practicing medicine• Bayesian Adaptive designs More likely assign “better” treatment
Comparing Treatments• Fundamental principle
• Groups must be alike in all important aspects and only differ in the treatment each group receives
• In practical terms, “comparable treatment groups” means“alike on the average”
• Randomization• Each patient has the same chance of receiving any of the
treatments under study• Allocation of treatments to participants is carried out using a
chance mechanism so that neither the patient nor the physician know in advance which therapy will be assigned
• Blinding• Avoidance of psychological influence• Fair evaluation of outcomes
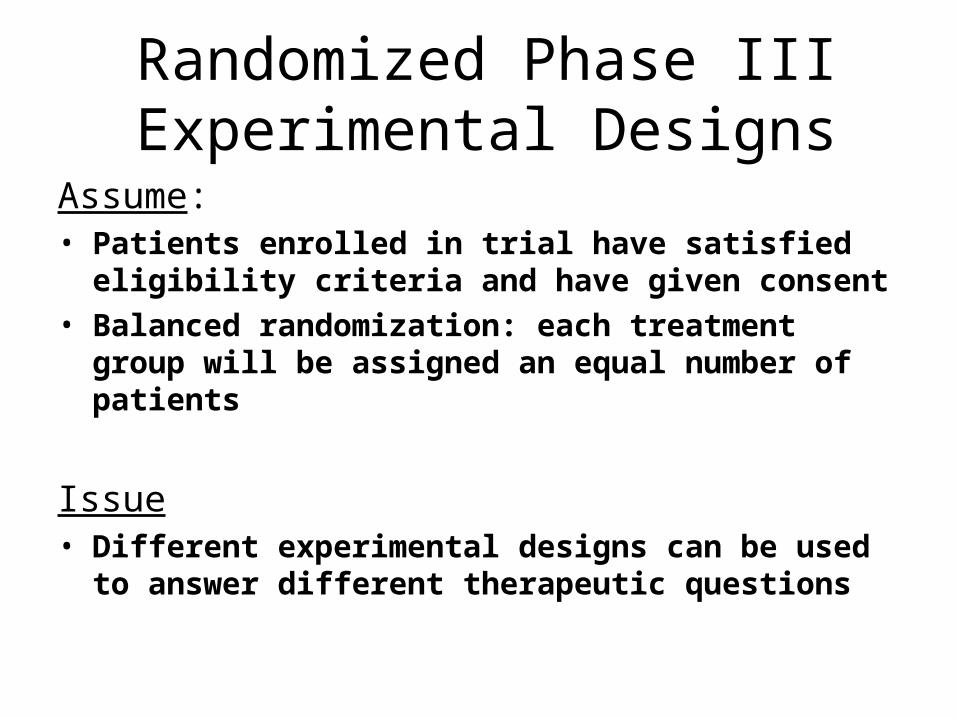
Randomized Phase III Experimental Designs
Assume:• Patients enrolled in trial have satisfied eligibility
criteria and have given consent• Balanced randomization: each treatment group will
be assigned an equal number of patients
Issue• Different experimental designs can be used to
answer different therapeutic questions
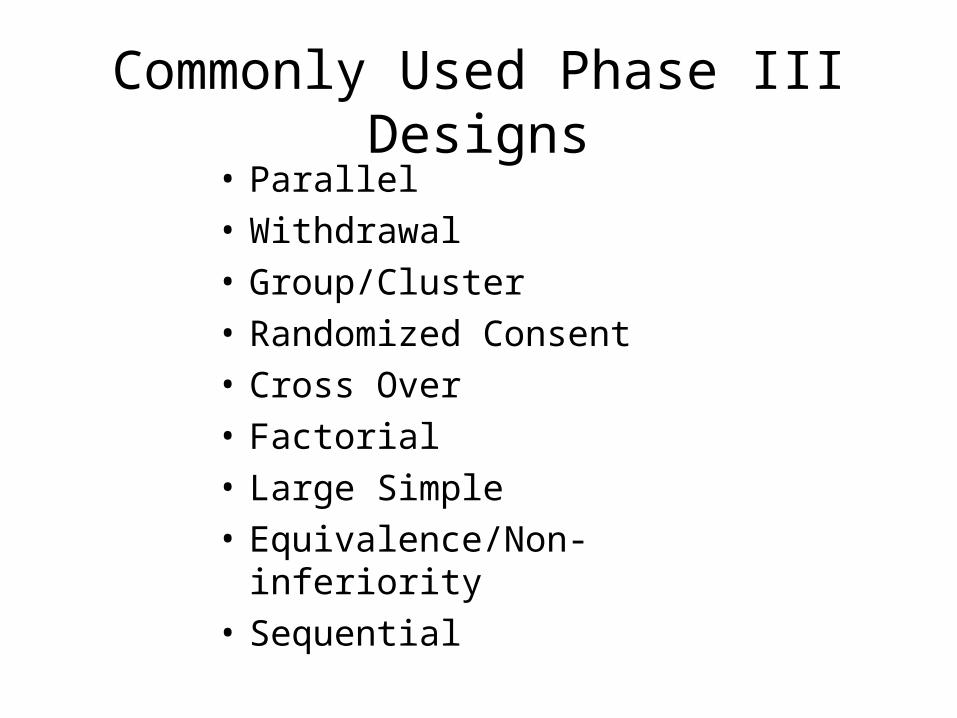
Commonly Used Phase III Designs
• Parallel
• Withdrawal
• Group/Cluster
• Randomized Consent
• Cross Over
• Factorial
• Large Simple
• Equivalence/Non-inferiority
• Sequential
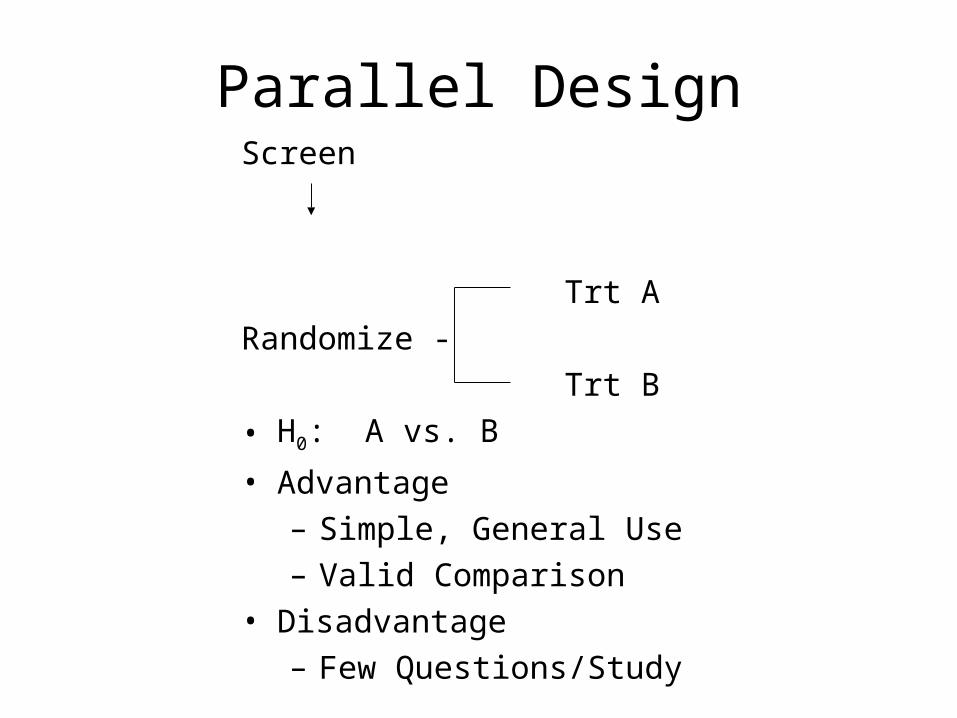
Parallel DesignScreen
Trt A
Randomize -
Trt B
• H0: A vs. B
• Advantage– Simple, General Use– Valid Comparison
• Disadvantage– Few Questions/Study
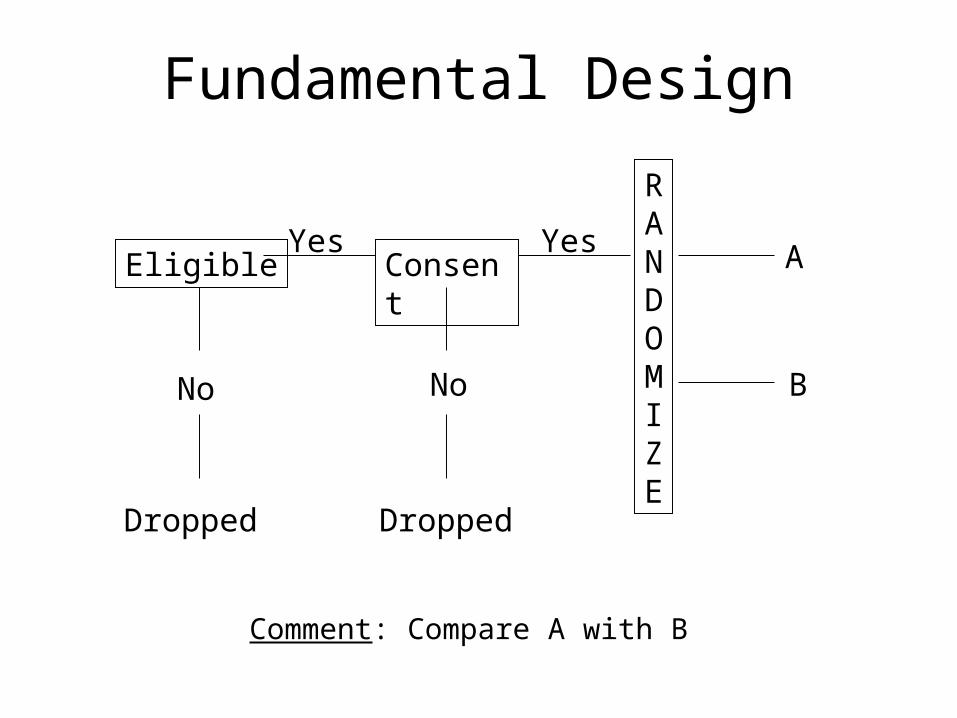
Fundamental Design
Eligible Consent
RANDOMIZE
No No
DroppedDropped
Yes Yes
B
A
Comment: Compare A with B
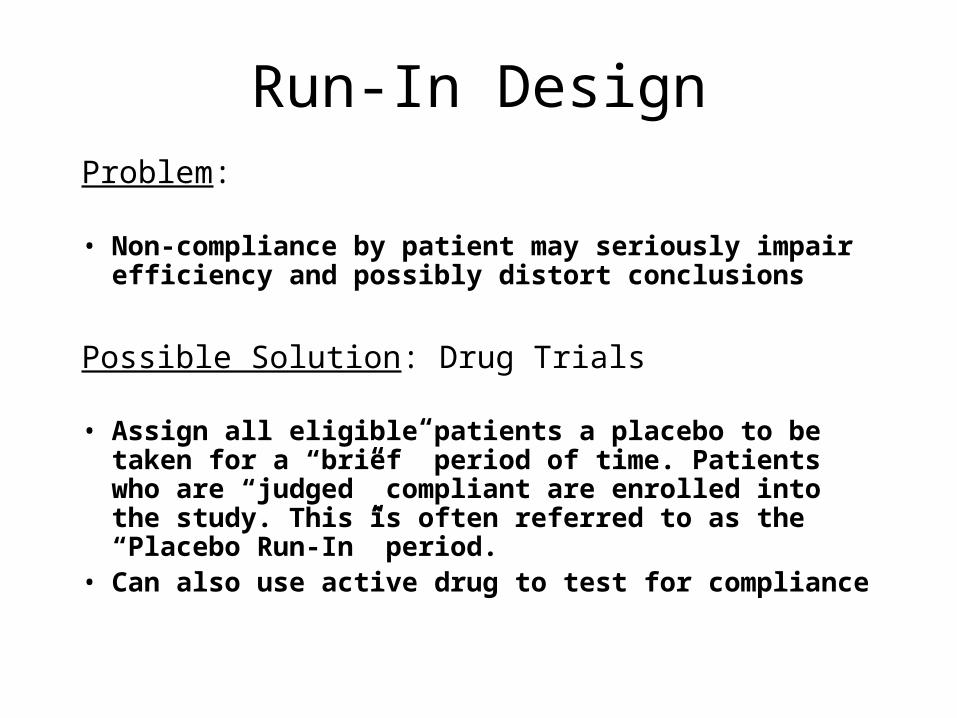
Run-In DesignProblem:
• Non-compliance by patient may seriously impair efficiency and possibly distort conclusions
Possible Solution: Drug Trials
• Assign all eligible patients a placebo to be taken for a “brief” period of time. Patients who are “judged” compliant are enrolled into the study. This is often referred to as the “Placebo Run-In” period.
• Can also use active drug to test for compliance
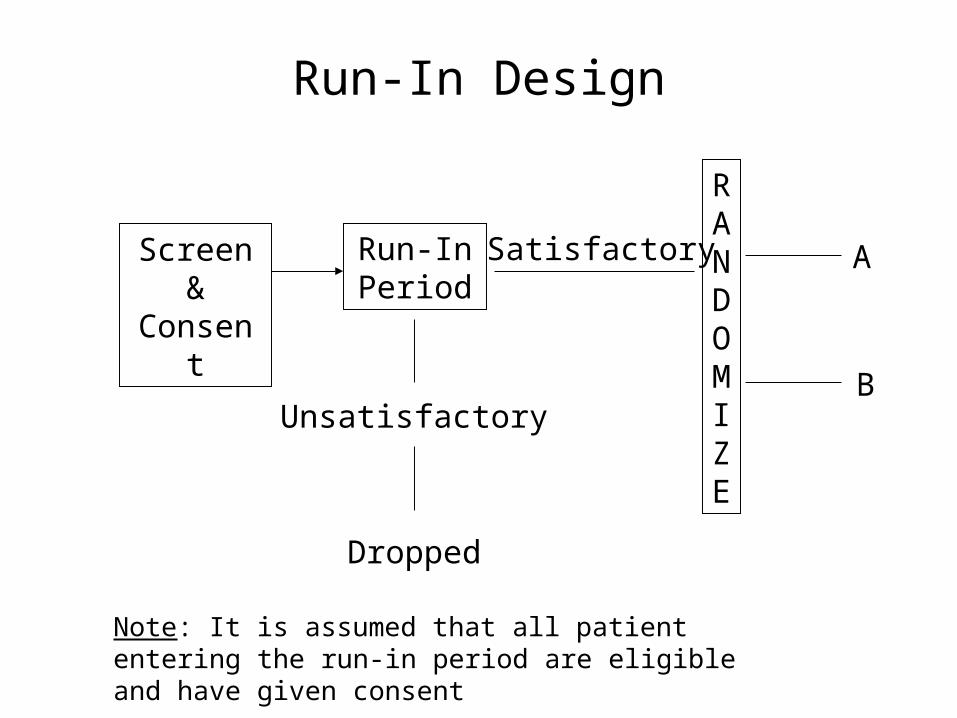
Run-In Design
Screen & Consent
Run-In Period
RANDOMIZE
Unsatisfactory
Dropped
B
A
Note: It is assumed that all patient entering the run-in period are eligible and have given consent
Satisfactory
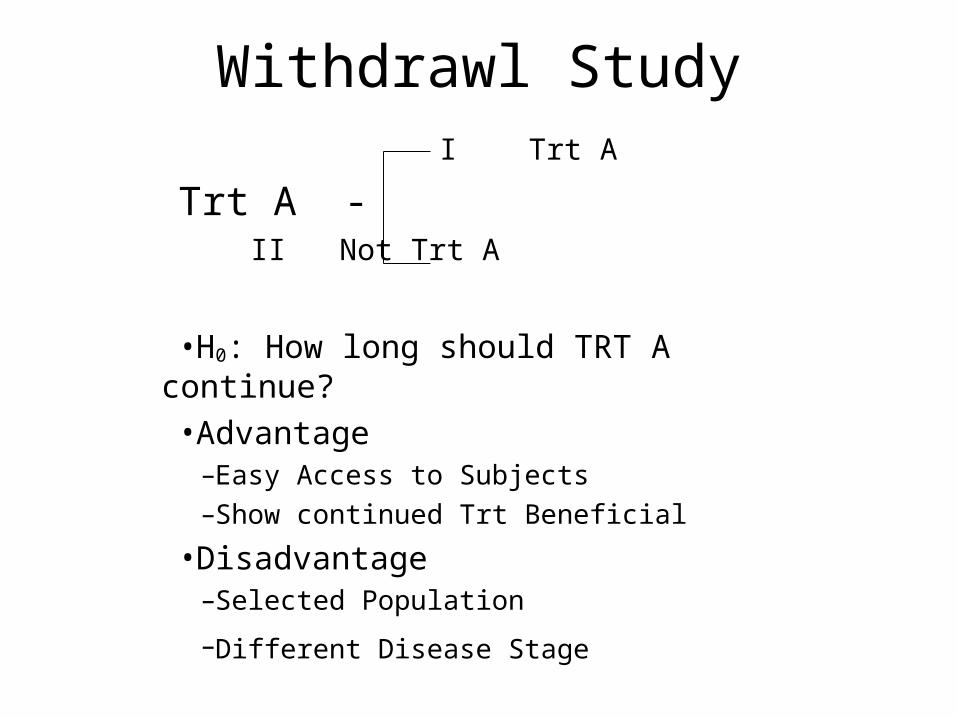
Withdrawl Study I Trt A
Trt A -II Not Trt A
•H0: How long should TRT A continue?
•Advantage–Easy Access to Subjects
–Show continued Trt Beneficial
•Disadvantage–Selected Population
–Different Disease Stage
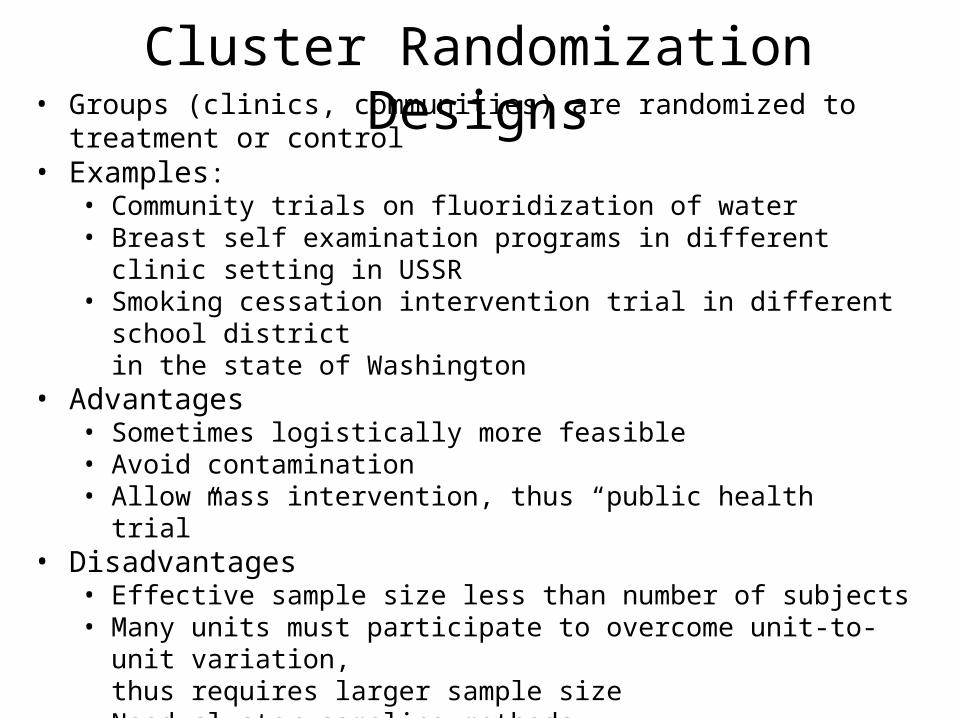
Cluster Randomization Designs
• Groups (clinics, communities) are randomized to treatment or control• Examples:
• Community trials on fluoridization of water• Breast self examination programs in different clinic setting in USSR• Smoking cessation intervention trial in different school district
in the state of Washington• Advantages
• Sometimes logistically more feasible• Avoid contamination• Allow mass intervention, thus “public health trial”
• Disadvantages• Effective sample size less than number of subjects• Many units must participate to overcome unit-to-unit variation,
thus requires larger sample size• Need cluster sampling methods
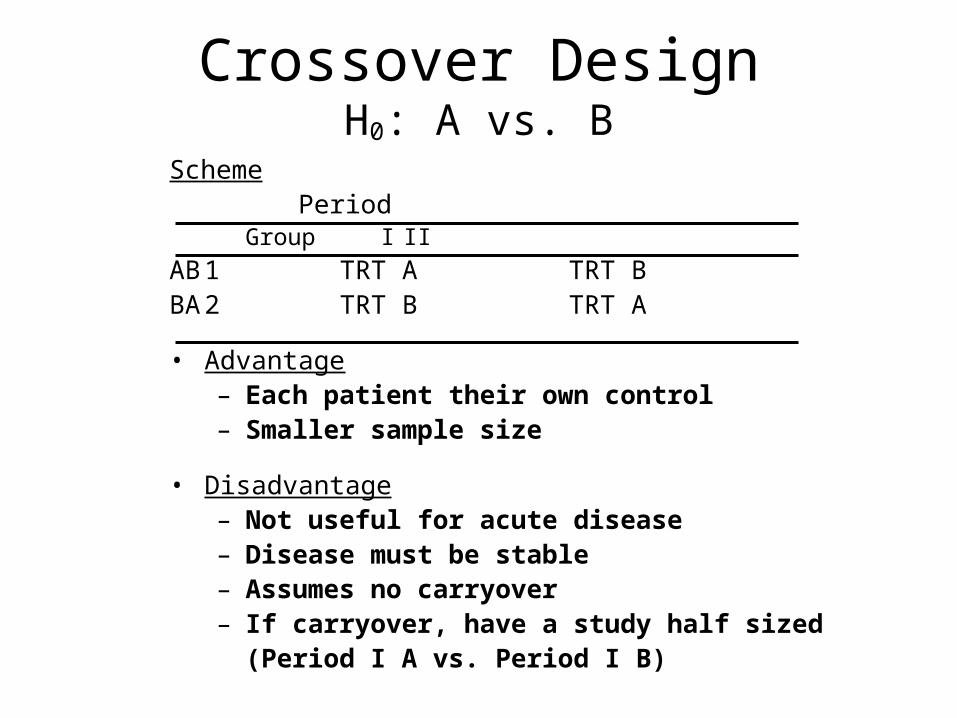
Crossover DesignH0: A vs. B
Scheme Period
Group I II
AB 1 TRT A TRT BBA 2 TRT B TRT A
• Advantage– Each patient their own control– Smaller sample size
• Disadvantage– Not useful for acute disease– Disease must be stable– Assumes no carryover– If carryover, have a study half sized
(Period I A vs. Period I B)
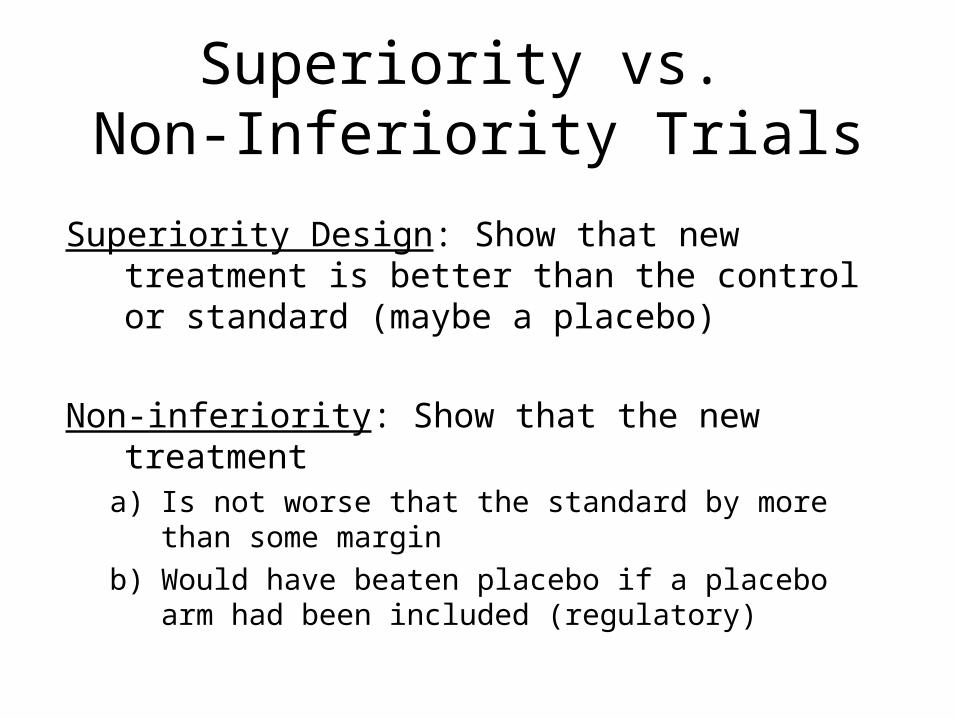
Superiority vs. Non-Inferiority Trials
Superiority Design: Show that new treatment is better than the control or standard (maybe a placebo)
Non-inferiority: Show that the new treatmenta) Is not worse that the standard by more than some
margin
b) Would have beaten placebo if a placebo arm had been included (regulatory)
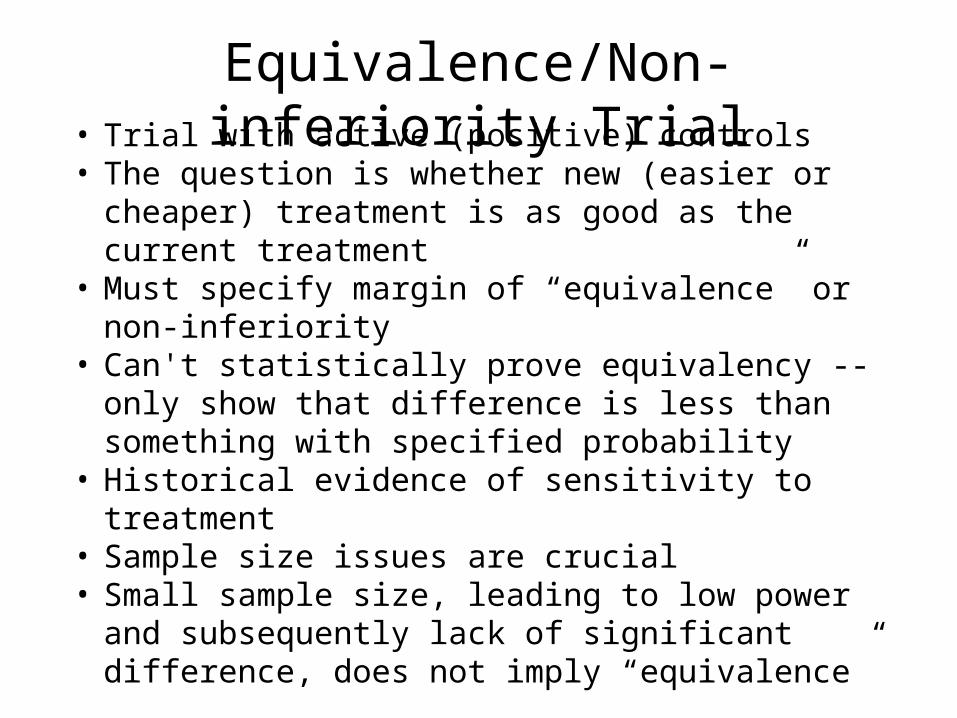
Equivalence/Non-inferiority Trial
• Trial with active (positive) controls• The question is whether new (easier or cheaper)
treatment is as good as the current treatment• Must specify margin of “equivalence” or non-inferiority• Can't statistically prove equivalency -- only show that
difference is less than something with specified probability
• Historical evidence of sensitivity to treatment• Sample size issues are crucial• Small sample size, leading to low power and
subsequently lack of significant difference, does not imply “equivalence”
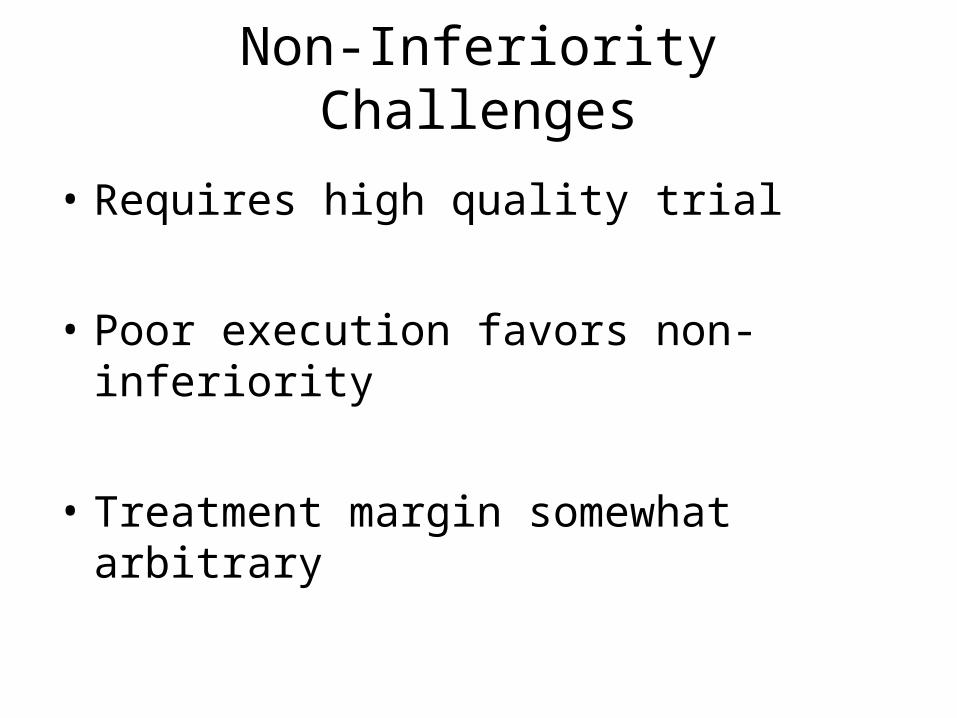
Non-Inferiority Challenges
• Requires high quality trial
• Poor execution favors non-inferiority
• Treatment margin somewhat arbitrary
Sequential Design
• Continue to randomize subjects until H0 is either rejected or “accepted”
• A large statistical literature for classical sequential designs
• Developed for industrial setting
• Modified for clinical trials
(e.g. Armitage 1975, Sequential Medical Trials)
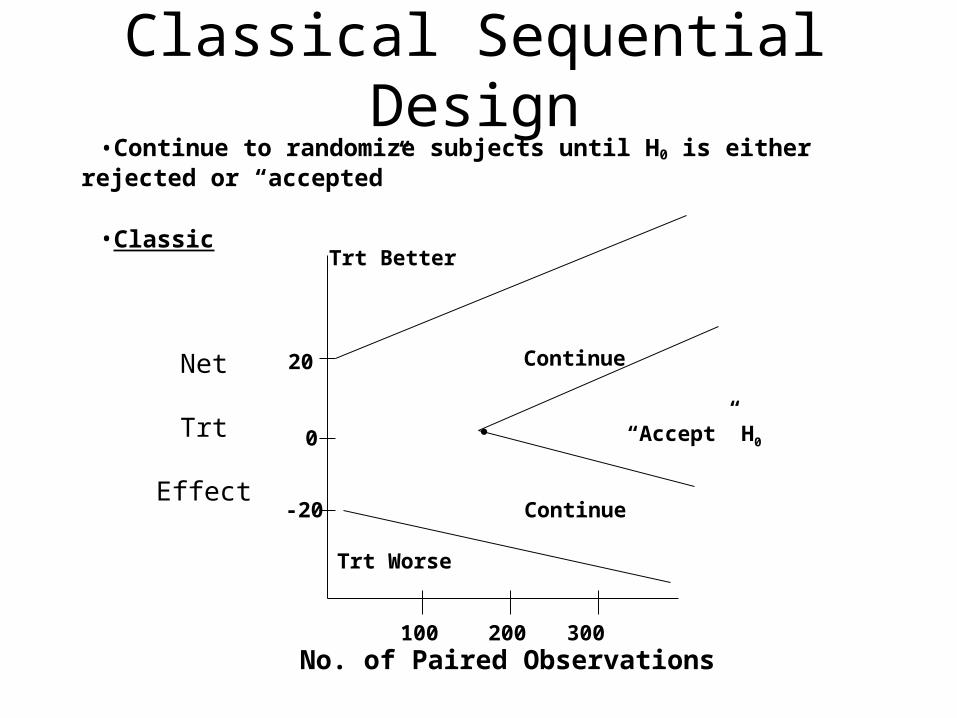
Classical Sequential Design•Continue to randomize subjects until H0 is either rejected or “accepted”
•Classic
Net
Trt
Effect
100 200 300No. of Paired Observations
Trt Worse
Continue
“Accept” H0
Trt Better
Continue
-20
0
20
Sample Size Considerations
Comparing Time to Event Distributions
• Primary endpoint is the time to an event
• Compare the survival distributions
• Measure of treatment effect is the ratio of the hazard rates
• Must also consider the length of follow-up
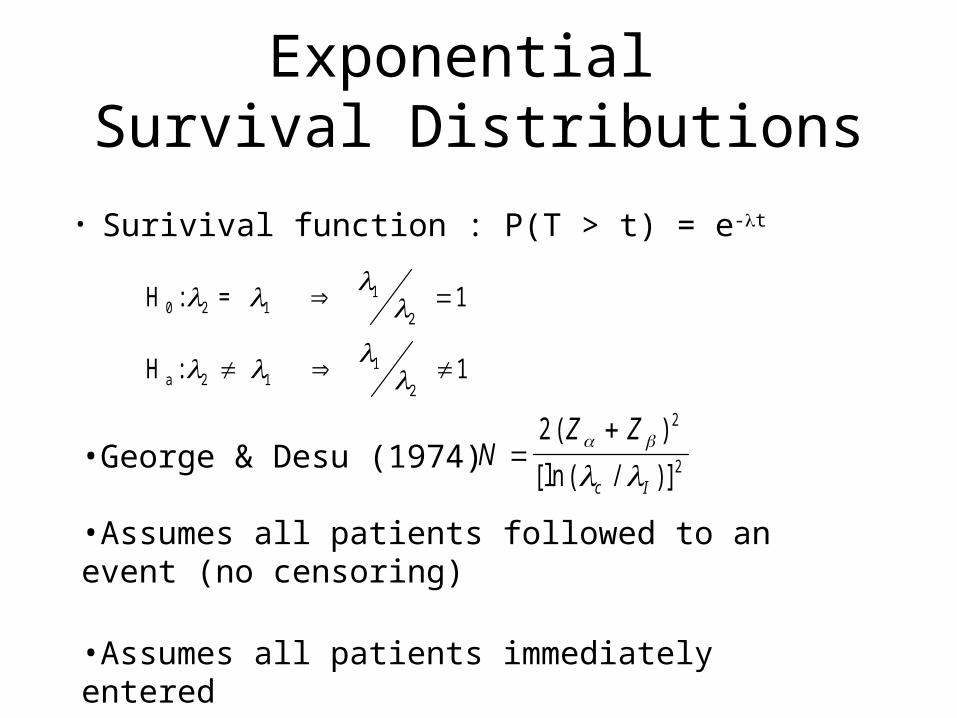
Exponential Survival Distributions
H : =
10 11
2
2
H :
1a 11
2
2
• Surivival function : P(T > t) = e-t
NZ Z
c I
2 2
2
( )
[ln ( / )]
•George & Desu (1974)
•Assumes all patients followed to an event (no censoring)
•Assumes all patients immediately entered
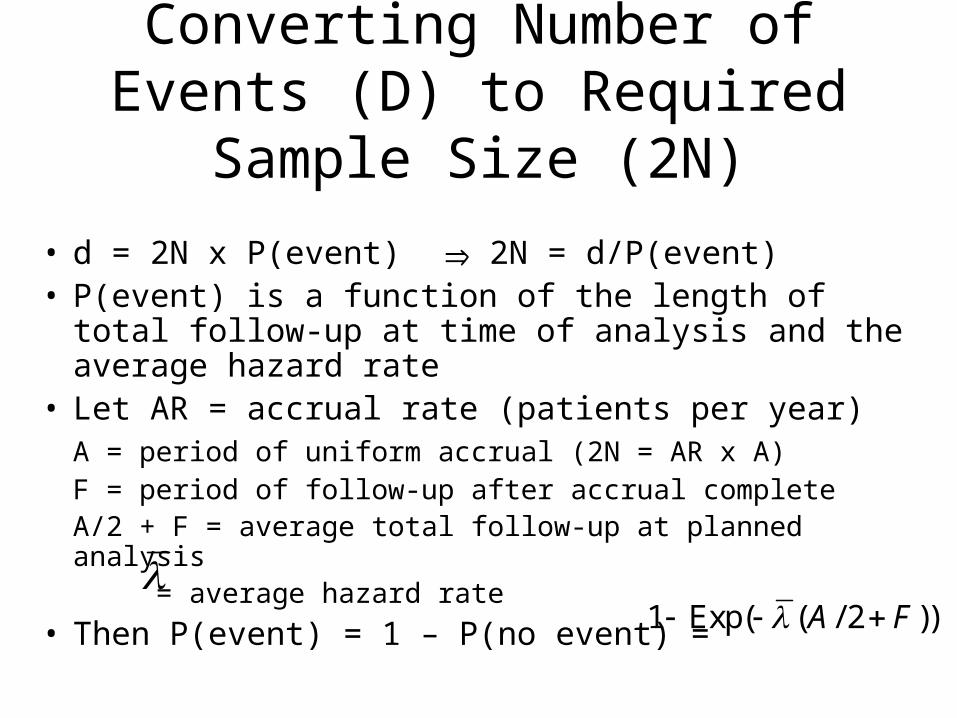
Converting Number of Events (D) to Required Sample Size (2N)
• d = 2N x P(event) 2N = d/P(event)• P(event) is a function of the length of total follow-
up at time of analysis and the average hazard rate• Let AR = accrual rate (patients per year)
A = period of uniform accrual (2N = AR x A)F = period of follow-up after accrual completeA/2 + F = average total follow-up at planned
analysis = average hazard rate
• Then P(event) = 1 – P(no event) =
1 Exp( ( / 2 ))A F
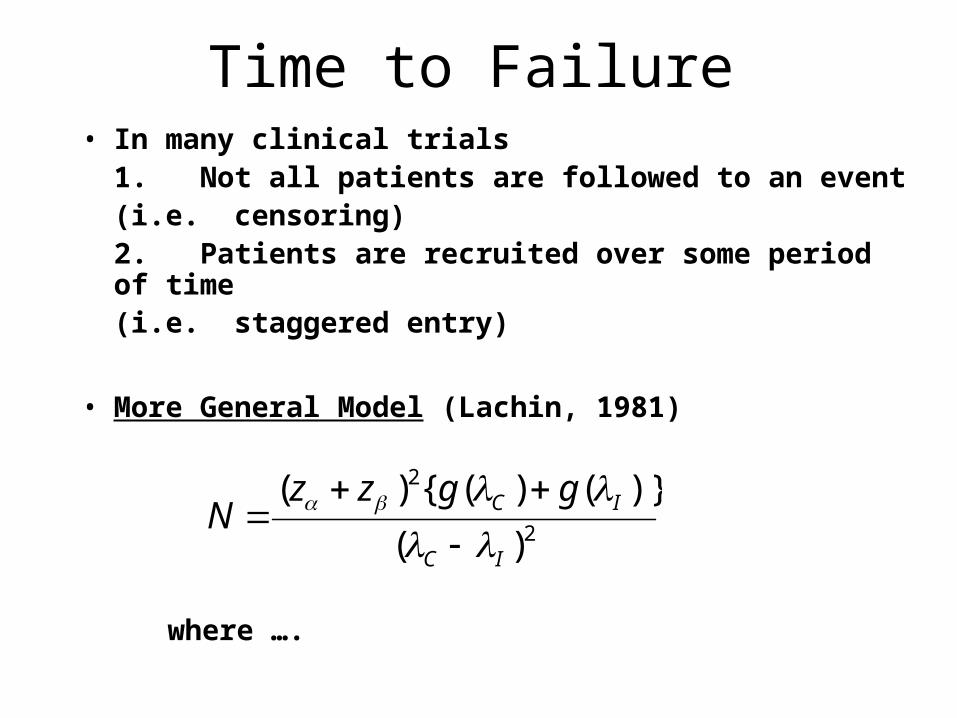
Time to Failure• In many clinical trials
1. Not all patients are followed to an event(i.e. censoring)
2. Patients are recruited over some period of time
(i.e. staggered entry)
• More General Model (Lachin, 1981)
where ….
2
2
)(
)}()({)(
IC
IC ggzzN
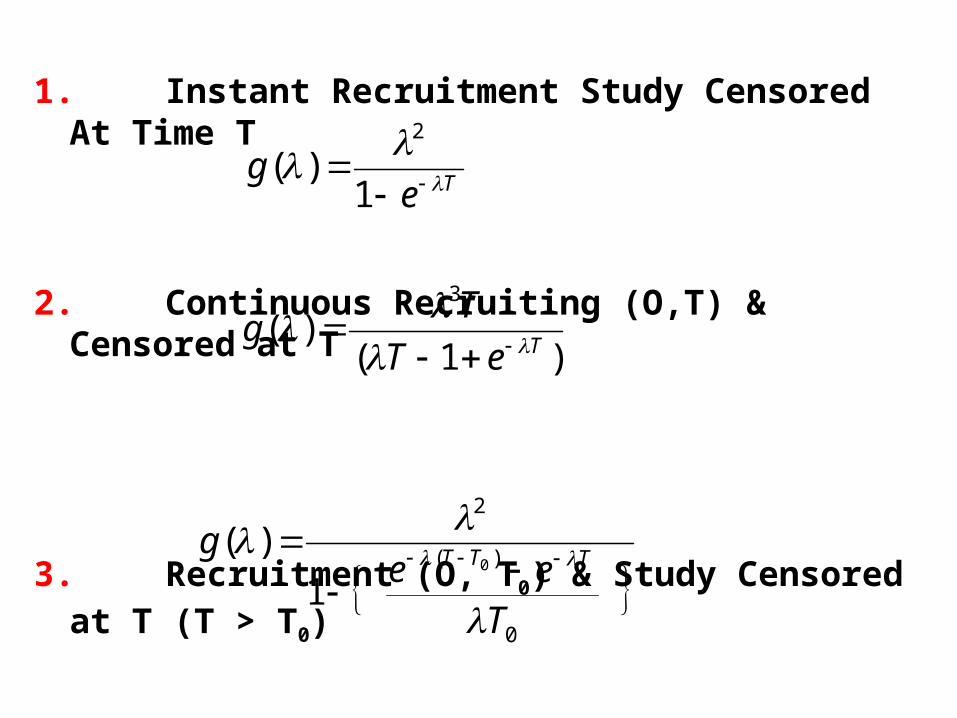
1. Instant Recruitment Study Censored At Time T
2. Continuous Recruiting (O,T) & Censored at T
3. Recruitment (O, T0) & Study Censored at T (T > T0)
Teg
1)(
2
)1()(
3
TeT
Tg
0
)(
2
0
1
)(
Tee
gTTT
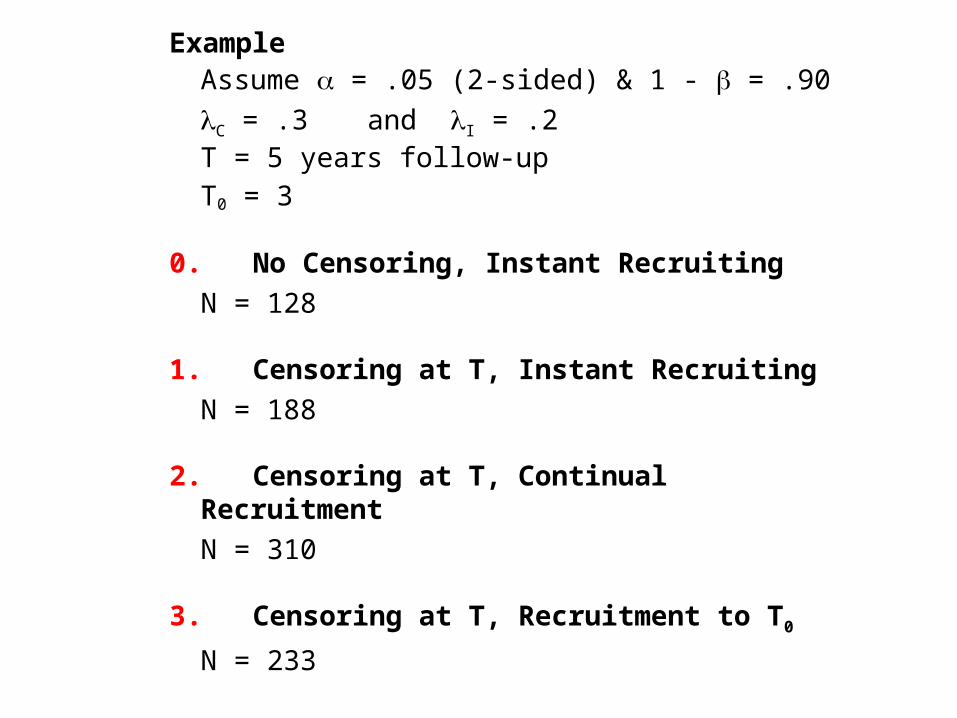
ExampleAssume = .05 (2-sided) & 1 - = .90
C = .3 and I = .2T = 5 years follow-upT0 = 3
0. No Censoring, Instant Recruiting
N = 128
1. Censoring at T, Instant Recruiting
N = 188
2. Censoring at T, Continual Recruitment
N = 310
3. Censoring at T, Recruitment to T0
N = 233
Sample Size Adjustment for Non-Compliance
• References:1. Shork & Remington (1967) Journal of Chronic Disease
2. Halperin et al (1968) Journal of Chronic Disease
3. Wu, Fisher & DeMets (1988) Controlled Clinical Trials
• Problem
Some patients may not adhere to treatment protocol
• Impact
Dilute whatever true treatment effect exists
Sample Size Adjustment for Non-Compliance
• Fundamental PrincipleAnalyze All Subjects Randomized
• Called Intent-to-Treat (ITT) Principle– Noncompliance will dilute treatment effect
• A SolutionAdjust sample size to compensate for dilution effect (reduced power)
• Definitions of Noncompliance– Dropout: Patient in treatment group stops taking
therapy– Dropin: Patient in control group starts taking
experimental therapy
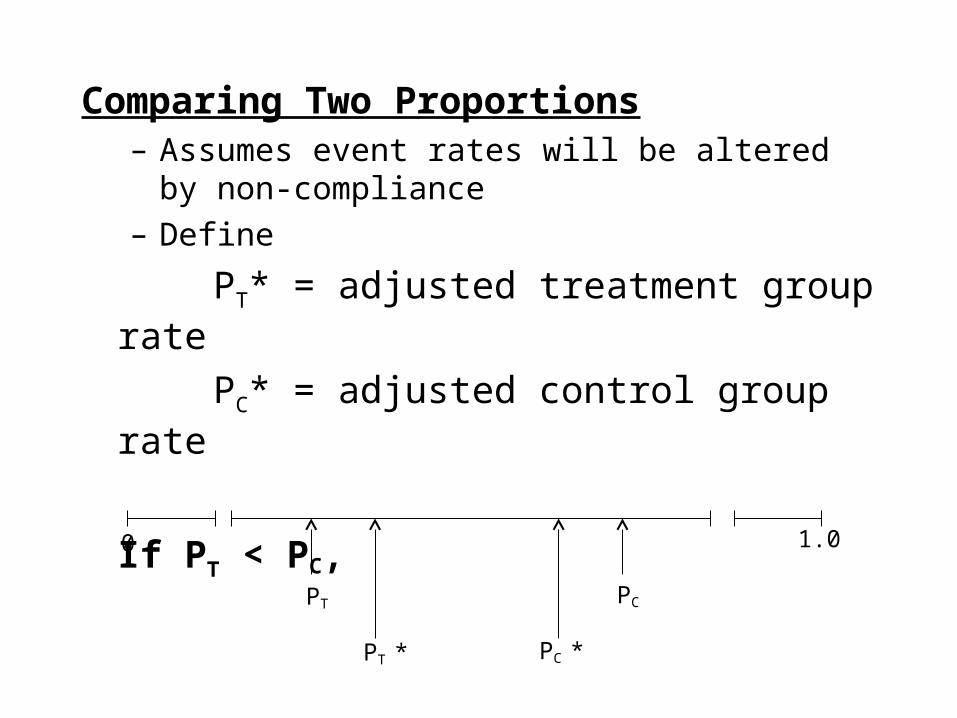
Comparing Two Proportions– Assumes event rates will be altered by
non‑compliance– Define
PT* = adjusted treatment group rate
PC* = adjusted control group rate
If PT < PC,
0
PT PC
PT * PC *
1.0
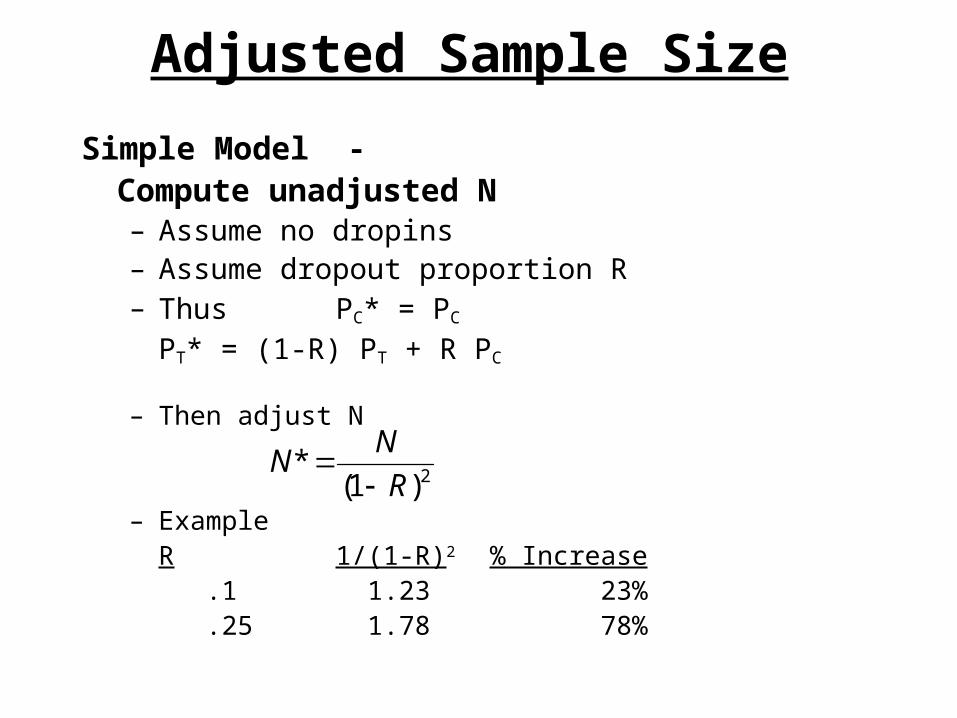
Simple Model - Compute unadjusted N– Assume no dropins– Assume dropout proportion R– Thus PC* = PC
PT* = (1-R) PT + R PC
– Then adjust N
– ExampleR 1/(1-R)2 % Increase
.1 1.23 23% .25 1.78 78%
2)1(*
R
NN
Adjusted Sample Size
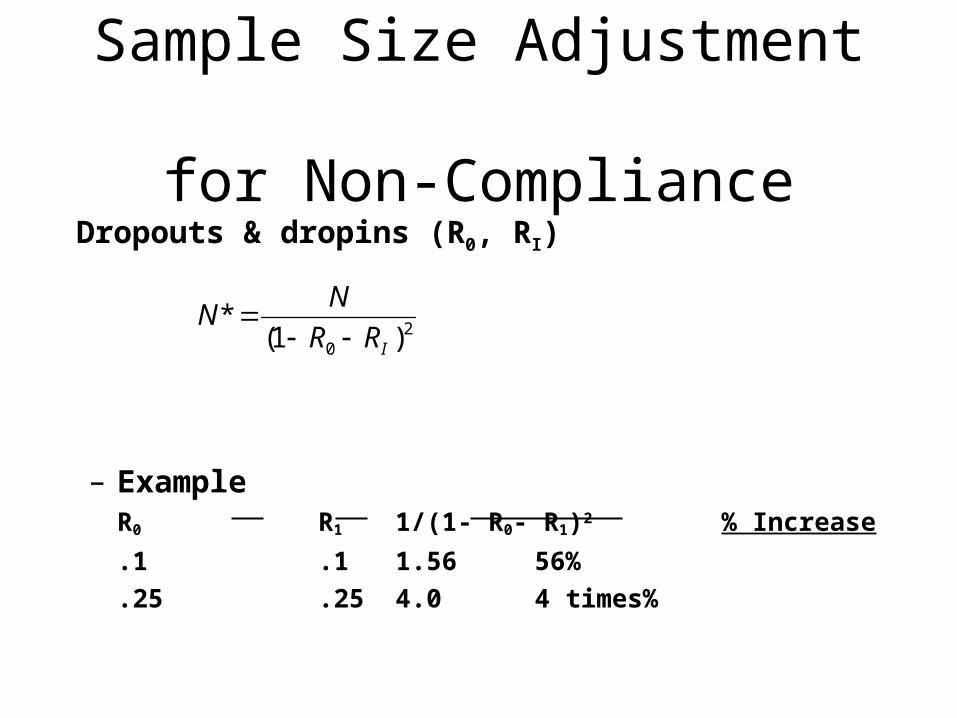
Sample Size Adjustment for Non-Compliance
Dropouts & dropins (R0, RI)
– ExampleR0 R1 1/(1- R0- R1)2 % Increase
.1 .1 1.56 56%
.25 .25 4.0 4 times%
20 )1(
*IRR
NN
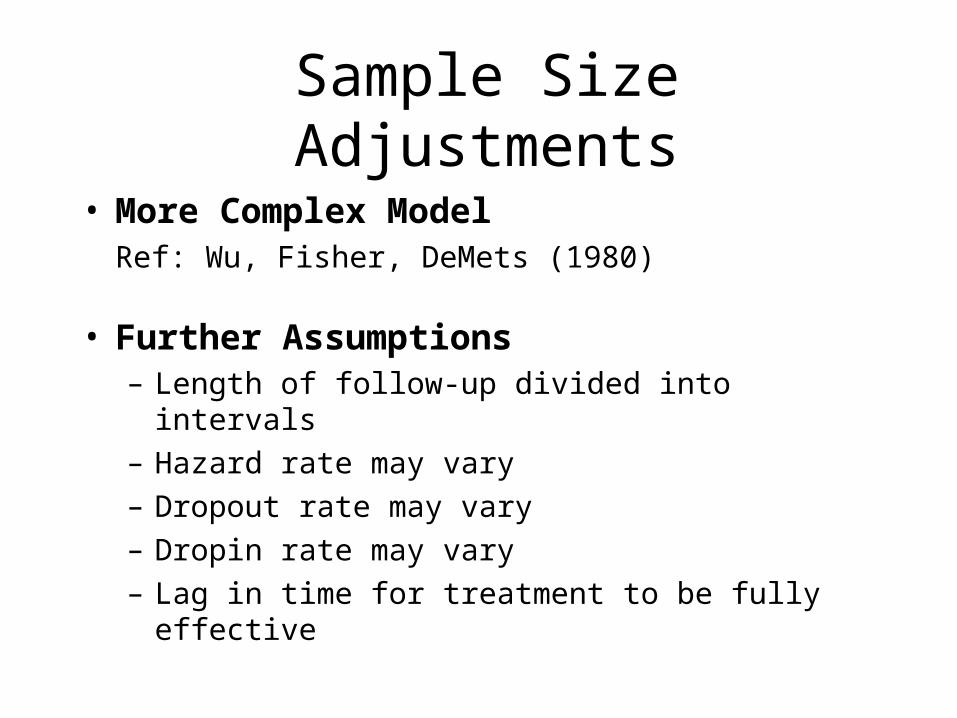
• More Complex ModelRef: Wu, Fisher, DeMets (1980)
• Further Assumptions– Length of follow-up divided into intervals– Hazard rate may vary– Dropout rate may vary– Dropin rate may vary– Lag in time for treatment to be fully effective
Sample Size Adjustments
Sample Size Summary
• Ethically, the size of the study must be large enough to achieve the stated goals with reasonable probability (power)
• Sample size estimates are only approximate due to uncertainty in assumptions
• Need to be conservative but realistic