Embed Size (px)
Citation preview
SUPPLEMENTARY INFORMATION
Clinical Insights from Metagenomic Analysis of Cystic Fibrosis Sputum
Yan Wei Lim1, Jose S. Evangelista III 2, Robert Schmieder3, Barbara Bailey4, Matthew Haynes5, Mike Furlan1, Heather Maughan6, Robert Edwards3,7, Forest Rohwer1, and Douglas Conrad2
1Department of Biology, San Diego State University, San Diego, California, USA 2Department of Medicine, University of California San Diego, La Jolla, California, USA 3Computational Science Research Center, San Diego State University, San Diego, California, USA
4Department of Mathematics and Statistics, San Diego State University, San Diego, California, USA 5Current location, DOE Joint Genome Institute, Walnut Creek, California, USA 6Ronin Institute, Montclair, New Jersey, USA 7Mathematics and Computer Science Division, Argonne National Laboratory, Argonne, Illinois, USA
Running Head: Clinical insights from metagenomics
Correspondence should be addressed to Yan Wei Lim, [email protected]
Supplementary Notes
Protocol defined exacerbation
A protocol-‐defined exacerbation is an event when the patient:
1) Meets four or more of the Fuchs criteria ((Fuchs 1994). Fuchs criteria are most commonly used to evaluate exacerbation events in adult CF individuals. It has also been extensively used in several clinical trials to define a CF exacerbation. We have added the missed days of school/work as an additional criterion.
2) The patient must have a physiologic drop in FEV1 of at least 15% or more compared to the best FEV1 in the previous 12 months.
Patient is assigned as clinical responder when the patient shows:
1) Improvement in all of the Fuchs symptoms/signs that declined from the baseline value at the onset of the exacerbation.
2) Improvement in FEV1 to within 90% and 250 cc of their greatest FEV1 achieved in the past 12 months.
3) Improvement in the subjective CFQR and UCSD SOBQ surveys. These are validated disease specific questionnaires. A minimally clinically important difference of greater than 5 (MCID>5) was used as a cut off for level of significance. All others who do not meet these criteria were considered as non-‐responders.
Sample description, collection and processing
Each sample was given a unique patient ID (CF<number>) followed by the time point when the sample was collected (represented by a letter, <A-‐Z>). A patient’s clinical status, designated by the clinician, was based on the commonly used Fuch’s criteria, lung function tests, and the patient’s reported outcome. Sputum samples were collected in the clinic during the patient’s visit. The sample was then syringe-‐homogenized and split into 5 aliquots for metagenomic (2) and metatranscriptomic (1) studies, culturing (1), and storage (1). Immediately after homogenization, each homogenate for microbial metatranscriptomic study was transferred to a 15 ml falcon tube containing 1 volume of 0.1 mm zirconia beads and 3 volumes of Trizol LS and was immediately vortexed for 10 minutes at medium speed to mechanically lyse microbial cells while maintaining the RNA intact. All samples were then transported on ice to the lab.
Detailed standard protocols can be downloaded from www.coralandphage.com. The protocols include initial sample pre-‐processing and pre-‐treatment prior to microbial cell and virus enrichment. Due to the large files describing every method, and possible deviations from the SOP, the website allows researchers to choose the sample type and procedure to be done, and automatically generates an appropriate corresponding workflow.
Bioinformatics
All samples were sequenced using the GS-‐FLX Titanium chemistry system. Multiplexed SFF sequence data files were separated according to their unique identifiers, and FASTA formatted sequences and
corresponding quality scores were extracted using the GS-‐SFF tools software package (Roche: Brandord, CT).
Data Preprocessing
All datasets were preprocessed using PRINSEQ to remove low quality reads, reads shorter than 60 bp, duplicate reads, and low complexity reads. The command used was:
perl prinseq-‐lite.pl -‐verbose -‐log -‐fastq file.fastq -‐derep 1245 -‐lc_method entropy -‐lc_threshold 50 -‐trim_qual_right 15 -‐trim_qual_left 15 -‐trim_qual_type mean -‐trim_qual_rule lt -‐trim_qual_rule lt -‐trim_qual_window 2 -‐trim_tail_left 5 -‐trim_tail_right 5 -‐min_len 60 -‐min_qual_mean 15 -‐ns_max_p 1 -‐rm_header
Viral and microbial metagenomes were further processed using DeconSeq to remove all human-‐like sequences with at least 90% query length coverage and 90% identity. This was done using the web version available at http://edwards.sdsu.edu/deconseq
Reference Databases
The NCBI non-‐redundant protein (hereafter NR) database (version Feb 14, 2012) was downloaded from the NCBI FTP server: ftp://ftp.ncbi.nih.gov/blast/db/
The NCBI non-‐redundant nucleotide (hereafter NT) database (version Feb 14, 2012) was downloaded from the NCBI FTP server: ftp://ftp.ncbi.nih.gov/blast/db/
The viral database (created Feb 23, 2012) includes: 4,019 unique viral genomes downloaded from the NCBI FTP server: ftp://ftp.ncbi.nlm.nih.gov/genomes/Viruses/ and ftp://ftp.ncbi.nih.gov/refseq/release/viral/
The Anitbiotic Resistance Genes Database (ARDB) (version 1.1, July 3, 2009) includes 23,137 antibiotic resistant-‐associated protein sequences downloaded from http://ardb.cbcb.umd.edu. In order to normalize the number of hits against the size of the metagenomes (total number of reads per metagenome), as well as the total number of base pairs in the database, we assume an average of 1000 bp per gene.
Database searches
Database searches were performed using the BLAST program. Unless specified, the default command-‐line options were used. Fine-‐tuning of the options based on the characteristics of the input data may yield better performance and/or results. Analysis of the BLAST output was performed using in-‐house Perl scripts. BLAST version 2.2.24 was downloaded from: ftp://ftp.ncbi.nih.gov/blast/executables/release/LATEST/
Data Analysis
rRNA-‐like and non-‐rRNA reads were identified from the preprocessed metatranscriptomes using BLASTn against the SILVA database (threshold of 50% query coverage and 75% alignment identity). Non-‐rRNA reads were annotated using BLASTx against the NCBI non-‐redundant protein database (threshold of 40% identity over at least 60% of the query sequence).
The preprocessed metagenomes were annotated using BLASTn against the NCBI nucleotide database (threshold of 40% identity over at least 60% of the query sequence). Sequences assigned to the phylum Chordata and to vector or synthetic sequences were identified and removed. Virome
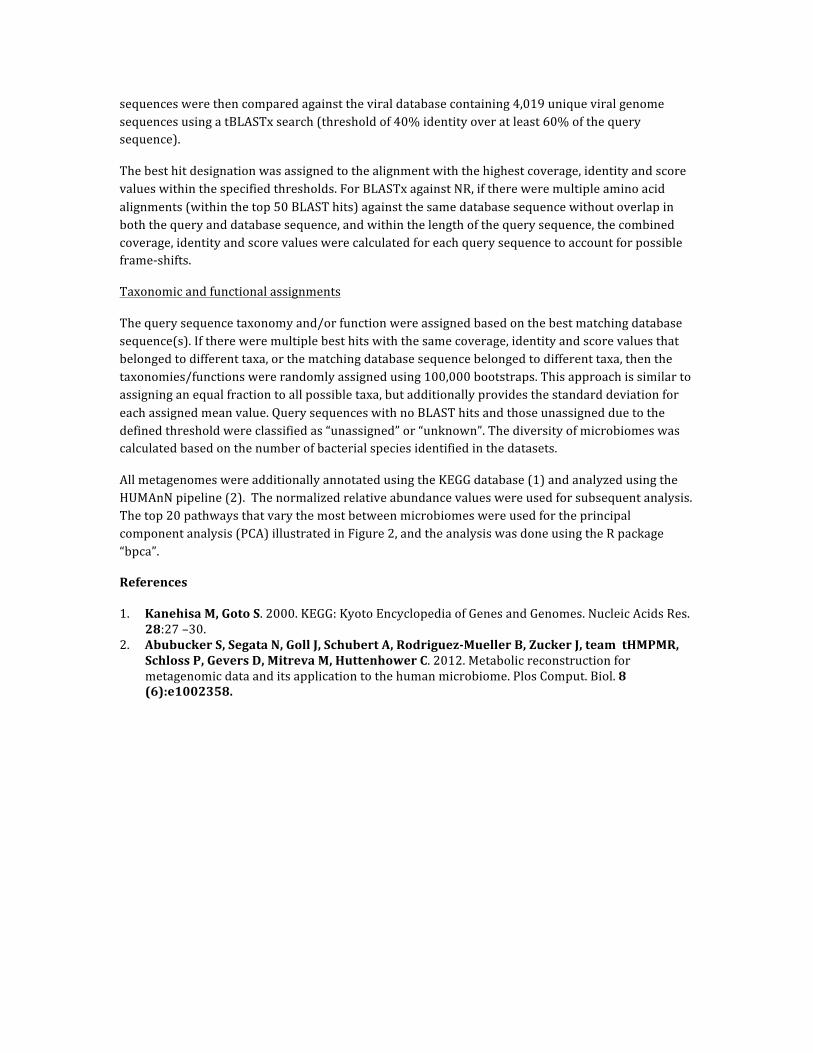
sequences were then compared against the viral database containing 4,019 unique viral genome sequences using a tBLASTx search (threshold of 40% identity over at least 60% of the query sequence).
The best hit designation was assigned to the alignment with the highest coverage, identity and score values within the specified thresholds. For BLASTx against NR, if there were multiple amino acid alignments (within the top 50 BLAST hits) against the same database sequence without overlap in both the query and database sequence, and within the length of the query sequence, the combined coverage, identity and score values were calculated for each query sequence to account for possible frame-‐shifts.
Taxonomic and functional assignments
The query sequence taxonomy and/or function were assigned based on the best matching database sequence(s). If there were multiple best hits with the same coverage, identity and score values that belonged to different taxa, or the matching database sequence belonged to different taxa, then the taxonomies/functions were randomly assigned using 100,000 bootstraps. This approach is similar to assigning an equal fraction to all possible taxa, but additionally provides the standard deviation for each assigned mean value. Query sequences with no BLAST hits and those unassigned due to the defined threshold were classified as “unassigned” or “unknown”. The diversity of microbiomes was calculated based on the number of bacterial species identified in the datasets.
All metagenomes were additionally annotated using the KEGG database (1) and analyzed using the HUMAnN pipeline (2). The normalized relative abundance values were used for subsequent analysis. The top 20 pathways that vary the most between microbiomes were used for the principal component analysis (PCA) illustrated in Figure 2, and the analysis was done using the R package “bpca”.
References
1. Kanehisa M, Goto S. 2000. KEGG: Kyoto Encyclopedia of Genes and Genomes. Nucleic Acids Res. 28:27 –30.
2. Abubucker S, Segata N, Goll J, Schubert A, Rodriguez-‐Mueller B, Zucker J, team tHMPMR, Schloss P, Gevers D, Mitreva M, Huttenhower C. 2012. Metabolic reconstruction for metagenomic data and its application to the human microbiome. Plos Comput. Biol. 8 (6):e1002358.
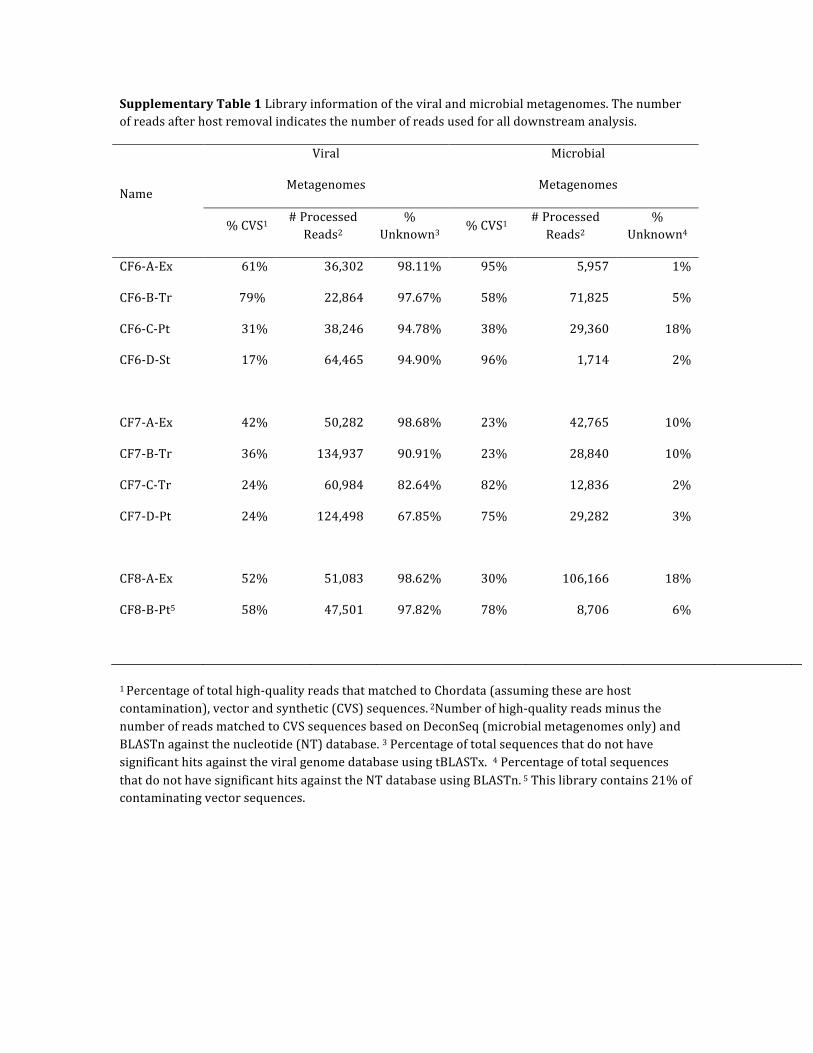
Supplementary Table 1 Library information of the viral and microbial metagenomes. The number of reads after host removal indicates the number of reads used for all downstream analysis.
Name
Viral
Metagenomes
Microbial
Metagenomes
% CVS1 # Processed Reads2
% Unknown3
% CVS1 # Processed Reads2
% Unknown4
CF6-‐A-‐Ex 61% 36,302 98.11% 95% 5,957 1%
CF6-‐B-‐Tr 79% 22,864 97.67% 58% 71,825 5%
CF6-‐C-‐Pt 31% 38,246 94.78% 38% 29,360 18%
CF6-‐D-‐St 17% 64,465 94.90% 96% 1,714 2%
CF7-‐A-‐Ex 42% 50,282 98.68% 23% 42,765 10%
CF7-‐B-‐Tr 36% 134,937 90.91% 23% 28,840 10%
CF7-‐C-‐Tr 24% 60,984 82.64% 82% 12,836 2%
CF7-‐D-‐Pt 24% 124,498 67.85% 75% 29,282 3%
CF8-‐A-‐Ex 52% 51,083 98.62% 30% 106,166 18%
CF8-‐B-‐Pt5 58% 47,501 97.82% 78% 8,706 6%
1 Percentage of total high-‐quality reads that matched to Chordata (assuming these are host contamination), vector and synthetic (CVS) sequences. 2Number of high-‐quality reads minus the number of reads matched to CVS sequences based on DeconSeq (microbial metagenomes only) and BLASTn against the nucleotide (NT) database. 3 Percentage of total sequences that do not have significant hits against the viral genome database using tBLASTx. 4 Percentage of total sequences that do not have significant hits against the NT database using BLASTn. 5 This library contains 21% of contaminating vector sequences.
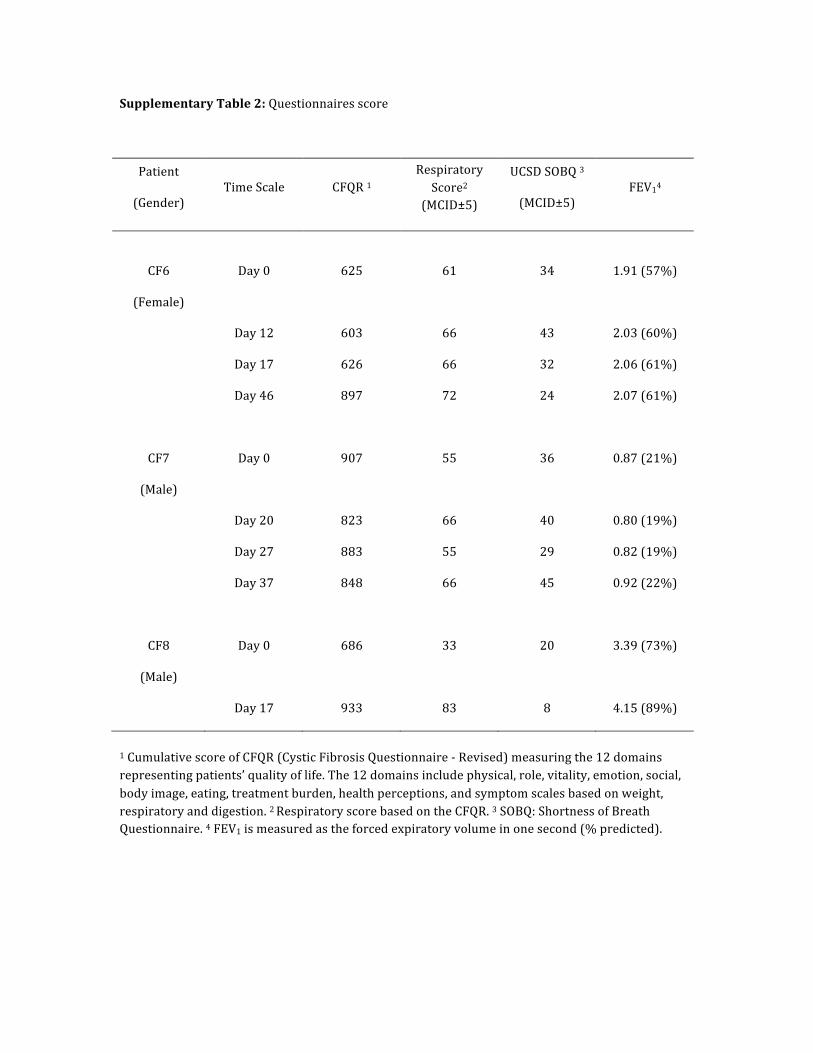
Supplementary Table 2: Questionnaires score
Patient
(Gender) Time Scale CFQR 1
Respiratory Score2
(MCID±5)
UCSD SOBQ 3
(MCID±5) FEV14
CF6
(Female)
Day 0 625 61 34 1.91 (57%)
Day 12 603 66 43 2.03 (60%)
Day 17 626 66 32 2.06 (61%)
Day 46 897 72 24 2.07 (61%)
CF7
(Male)
Day 0 907 55 36 0.87 (21%)
Day 20 823 66 40 0.80 (19%)
Day 27 883 55 29 0.82 (19%)
Day 37 848 66 45 0.92 (22%)
CF8
(Male)
Day 0 686 33 20 3.39 (73%)
Day 17 933 83 8 4.15 (89%)
1 Cumulative score of CFQR (Cystic Fibrosis Questionnaire -‐ Revised) measuring the 12 domains representing patients’ quality of life. The 12 domains include physical, role, vitality, emotion, social, body image, eating, treatment burden, health perceptions, and symptom scales based on weight, respiratory and digestion. 2 Respiratory score based on the CFQR. 3 SOBQ: Shortness of Breath Questionnaire. 4 FEV1 is measured as the forced expiratory volume in one second (% predicted).
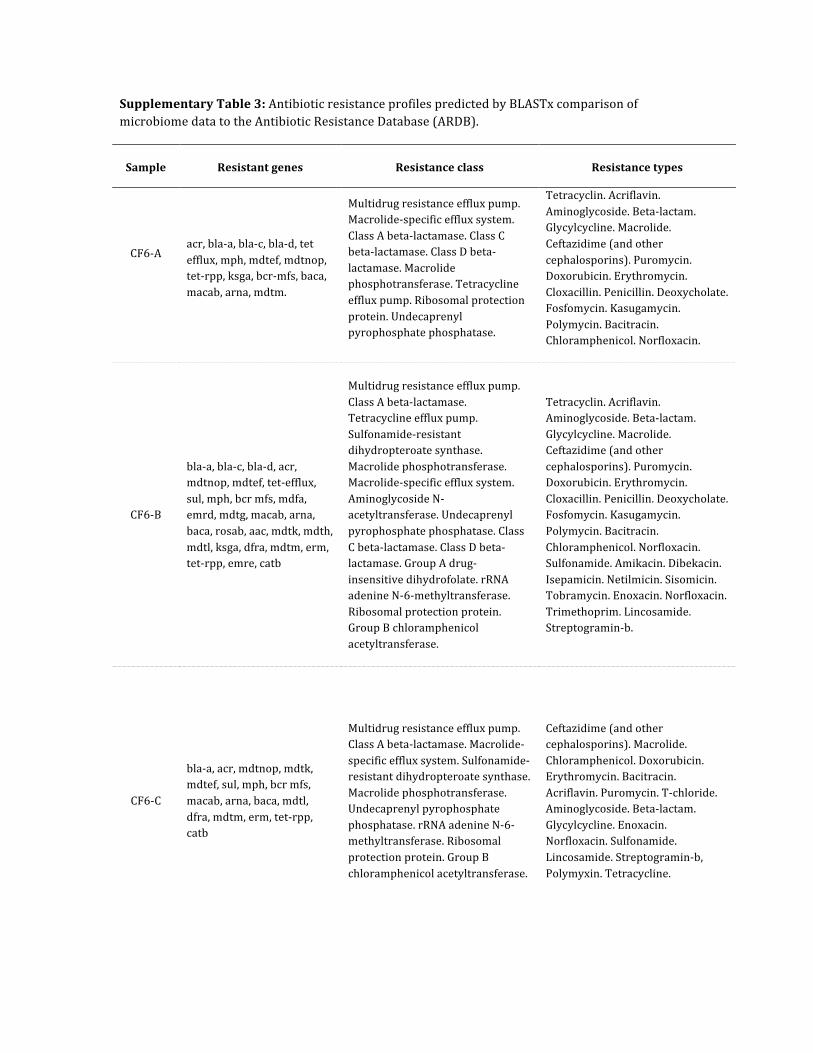
Supplementary Table 3: Antibiotic resistance profiles predicted by BLASTx comparison of microbiome data to the Antibiotic Resistance Database (ARDB).
Sample Resistant genes Resistance class Resistance types
CF6-‐A
acr, bla-‐a, bla-‐c, bla-‐d, tet efflux, mph, mdtef, mdtnop, tet-‐rpp, ksga, bcr-‐mfs, baca, macab, arna, mdtm.
Multidrug resistance efflux pump. Macrolide-‐specific efflux system. Class A beta-‐lactamase. Class C beta-‐lactamase. Class D beta-‐lactamase. Macrolide phosphotransferase. Tetracycline efflux pump. Ribosomal protection protein. Undecaprenyl pyrophosphate phosphatase.
Tetracyclin. Acriflavin. Aminoglycoside. Beta-‐lactam. Glycylcycline. Macrolide. Ceftazidime (and other cephalosporins). Puromycin. Doxorubicin. Erythromycin. Cloxacillin. Penicillin. Deoxycholate. Fosfomycin. Kasugamycin. Polymycin. Bacitracin. Chloramphenicol. Norfloxacin.
CF6-‐B
bla-‐a, bla-‐c, bla-‐d, acr, mdtnop, mdtef, tet-‐efflux, sul, mph, bcr mfs, mdfa, emrd, mdtg, macab, arna, baca, rosab, aac, mdtk, mdth, mdtl, ksga, dfra, mdtm, erm, tet-‐rpp, emre, catb
Multidrug resistance efflux pump. Class A beta-‐lactamase. Tetracycline efflux pump. Sulfonamide-‐resistant dihydropteroate synthase. Macrolide phosphotransferase. Macrolide-‐specific efflux system. Aminoglycoside N-‐acetyltransferase. Undecaprenyl pyrophosphate phosphatase. Class C beta-‐lactamase. Class D beta-‐lactamase. Group A drug-‐insensitive dihydrofolate. rRNA adenine N-‐6-‐methyltransferase. Ribosomal protection protein. Group B chloramphenicol acetyltransferase.
Tetracyclin. Acriflavin. Aminoglycoside. Beta-‐lactam. Glycylcycline. Macrolide. Ceftazidime (and other cephalosporins). Puromycin. Doxorubicin. Erythromycin. Cloxacillin. Penicillin. Deoxycholate. Fosfomycin. Kasugamycin. Polymycin. Bacitracin. Chloramphenicol. Norfloxacin. Sulfonamide. Amikacin. Dibekacin. Isepamicin. Netilmicin. Sisomicin. Tobramycin. Enoxacin. Norfloxacin. Trimethoprim. Lincosamide. Streptogramin-‐b.
CF6-‐C
bla-‐a, acr, mdtnop, mdtk, mdtef, sul, mph, bcr mfs, macab, arna, baca, mdtl, dfra, mdtm, erm, tet-‐rpp, catb
Multidrug resistance efflux pump. Class A beta-‐lactamase. Macrolide-‐specific efflux system. Sulfonamide-‐resistant dihydropteroate synthase. Macrolide phosphotransferase. Undecaprenyl pyrophosphate phosphatase. rRNA adenine N-‐6-‐methyltransferase. Ribosomal protection protein. Group B chloramphenicol acetyltransferase.
Ceftazidime (and other cephalosporins). Macrolide. Chloramphenicol. Doxorubicin. Erythromycin. Bacitracin. Acriflavin. Puromycin. T-‐chloride. Aminoglycoside. Beta-‐lactam. Glycylcycline. Enoxacin. Norfloxacin. Sulfonamide. Lincosamide. Streptogramin-‐b, Polymyxin. Tetracycline.
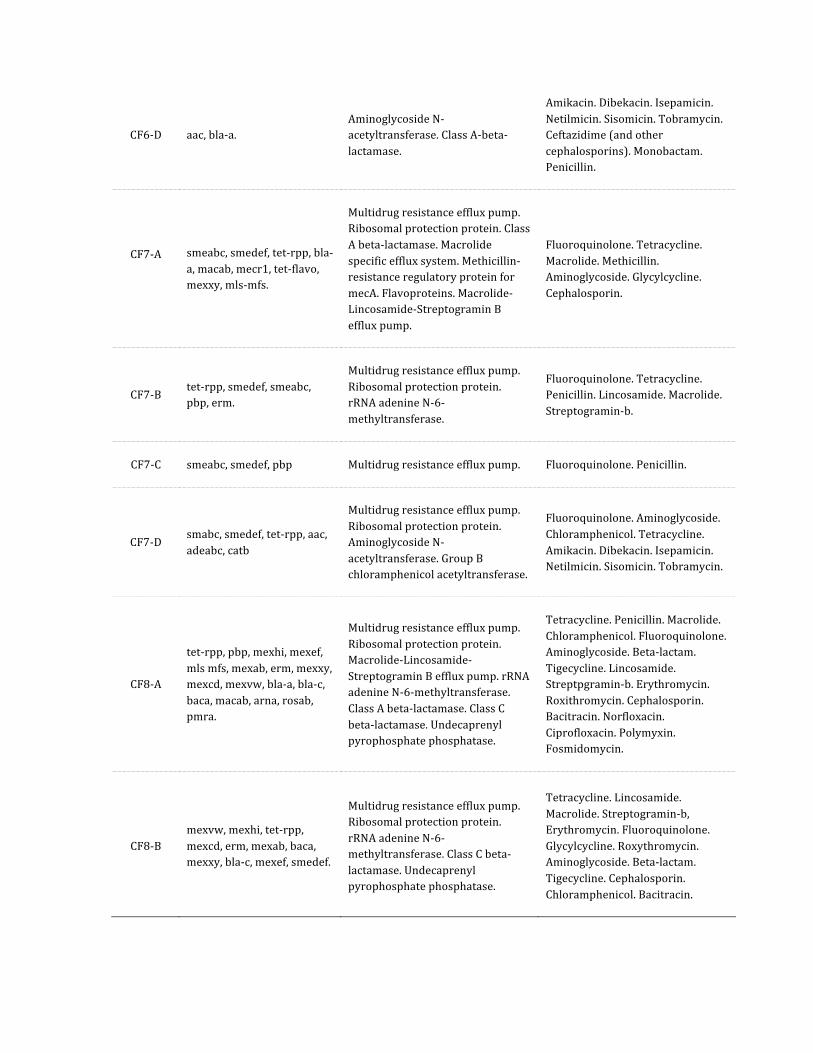
CF6-‐D aac, bla-‐a. Aminoglycoside N-‐acetyltransferase. Class A-‐beta-‐lactamase.
Amikacin. Dibekacin. Isepamicin. Netilmicin. Sisomicin. Tobramycin. Ceftazidime (and other cephalosporins). Monobactam. Penicillin.
CF7-‐A
smeabc, smedef, tet-‐rpp, bla-‐a, macab, mecr1, tet-‐flavo, mexxy, mls-‐mfs.
Multidrug resistance efflux pump. Ribosomal protection protein. Class A beta-‐lactamase. Macrolide specific efflux system. Methicillin-‐resistance regulatory protein for mecA. Flavoproteins. Macrolide-‐Lincosamide-‐Streptogramin B efflux pump.
Fluoroquinolone. Tetracycline. Macrolide. Methicillin. Aminoglycoside. Glycylcycline. Cephalosporin.
CF7-‐B tet-‐rpp, smedef, smeabc, pbp, erm.
Multidrug resistance efflux pump. Ribosomal protection protein. rRNA adenine N-‐6-‐methyltransferase.
Fluoroquinolone. Tetracycline. Penicillin. Lincosamide. Macrolide. Streptogramin-‐b.
CF7-‐C smeabc, smedef, pbp Multidrug resistance efflux pump. Fluoroquinolone. Penicillin.
CF7-‐D smabc, smedef, tet-‐rpp, aac, adeabc, catb
Multidrug resistance efflux pump. Ribosomal protection protein. Aminoglycoside N-‐acetyltransferase. Group B chloramphenicol acetyltransferase.
Fluoroquinolone. Aminoglycoside. Chloramphenicol. Tetracycline. Amikacin. Dibekacin. Isepamicin. Netilmicin. Sisomicin. Tobramycin.
CF8-‐A
tet-‐rpp, pbp, mexhi, mexef, mls mfs, mexab, erm, mexxy, mexcd, mexvw, bla-‐a, bla-‐c, baca, macab, arna, rosab, pmra.
Multidrug resistance efflux pump. Ribosomal protection protein. Macrolide-‐Lincosamide-‐Streptogramin B efflux pump. rRNA adenine N-‐6-‐methyltransferase. Class A beta-‐lactamase. Class C beta-‐lactamase. Undecaprenyl pyrophosphate phosphatase.
Tetracycline. Penicillin. Macrolide. Chloramphenicol. Fluoroquinolone. Aminoglycoside. Beta-‐lactam. Tigecycline. Lincosamide. Streptpgramin-‐b. Erythromycin. Roxithromycin. Cephalosporin. Bacitracin. Norfloxacin. Ciprofloxacin. Polymyxin. Fosmidomycin.
CF8-‐B mexvw, mexhi, tet-‐rpp, mexcd, erm, mexab, baca, mexxy, bla-‐c, mexef, smedef.
Multidrug resistance efflux pump. Ribosomal protection protein. rRNA adenine N-‐6-‐methyltransferase. Class C beta-‐lactamase. Undecaprenyl pyrophosphate phosphatase.
Tetracycline. Lincosamide. Macrolide. Streptogramin-‐b, Erythromycin. Fluoroquinolone. Glycylcycline. Roxythromycin. Aminoglycoside. Beta-‐lactam. Tigecycline. Cephalosporin. Chloramphenicol. Bacitracin.
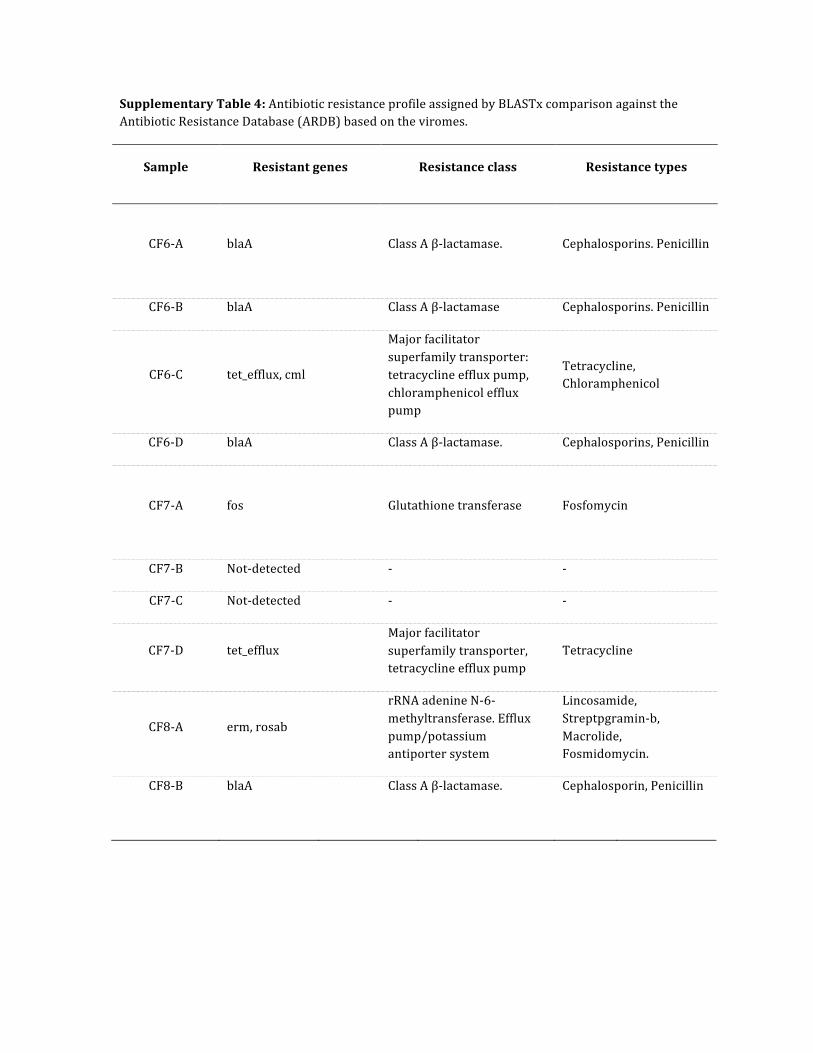
Supplementary Table 4: Antibiotic resistance profile assigned by BLASTx comparison against the Antibiotic Resistance Database (ARDB) based on the viromes.
Sample Resistant genes Resistance class Resistance types
CF6-‐A
blaA Class A β-‐lactamase. Cephalosporins. Penicillin
CF6-‐B blaA Class A β-‐lactamase Cephalosporins. Penicillin
CF6-‐C tet_efflux, cml
Major facilitator superfamily transporter: tetracycline efflux pump, chloramphenicol efflux pump
Tetracycline, Chloramphenicol
CF6-‐D blaA Class A β-‐lactamase. Cephalosporins, Penicillin
CF7-‐A
fos Glutathione transferase Fosfomycin
CF7-‐B Not-‐detected -‐ -‐
CF7-‐C Not-‐detected -‐ -‐
CF7-‐D tet_efflux Major facilitator superfamily transporter, tetracycline efflux pump
Tetracycline
CF8-‐A erm, rosab
rRNA adenine N-‐6-‐methyltransferase. Efflux pump/potassium antiporter system
Lincosamide, Streptpgramin-‐b, Macrolide, Fosmidomycin.
CF8-‐B blaA Class A β-‐lactamase. Cephalosporin, Penicillin
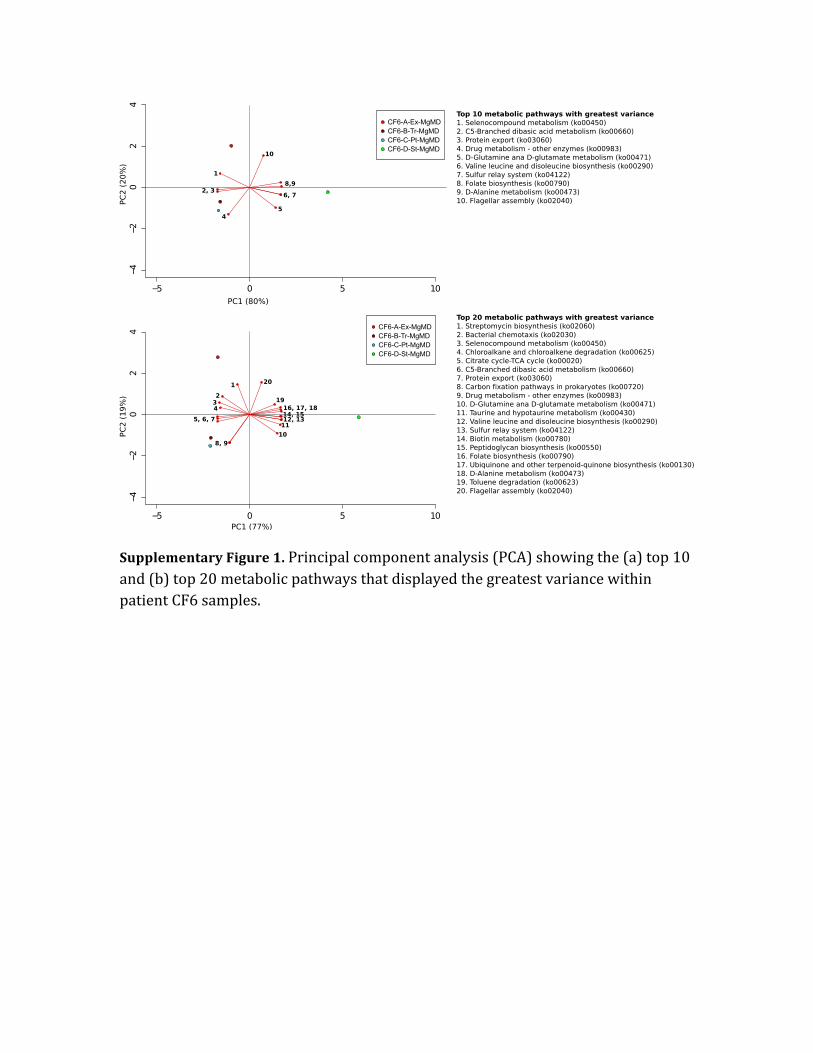
Supplementary Figure 1. Principal component analysis (PCA) showing the (a) top 10 and (b) top 20 metabolic pathways that displayed the greatest variance within patient CF6 samples.
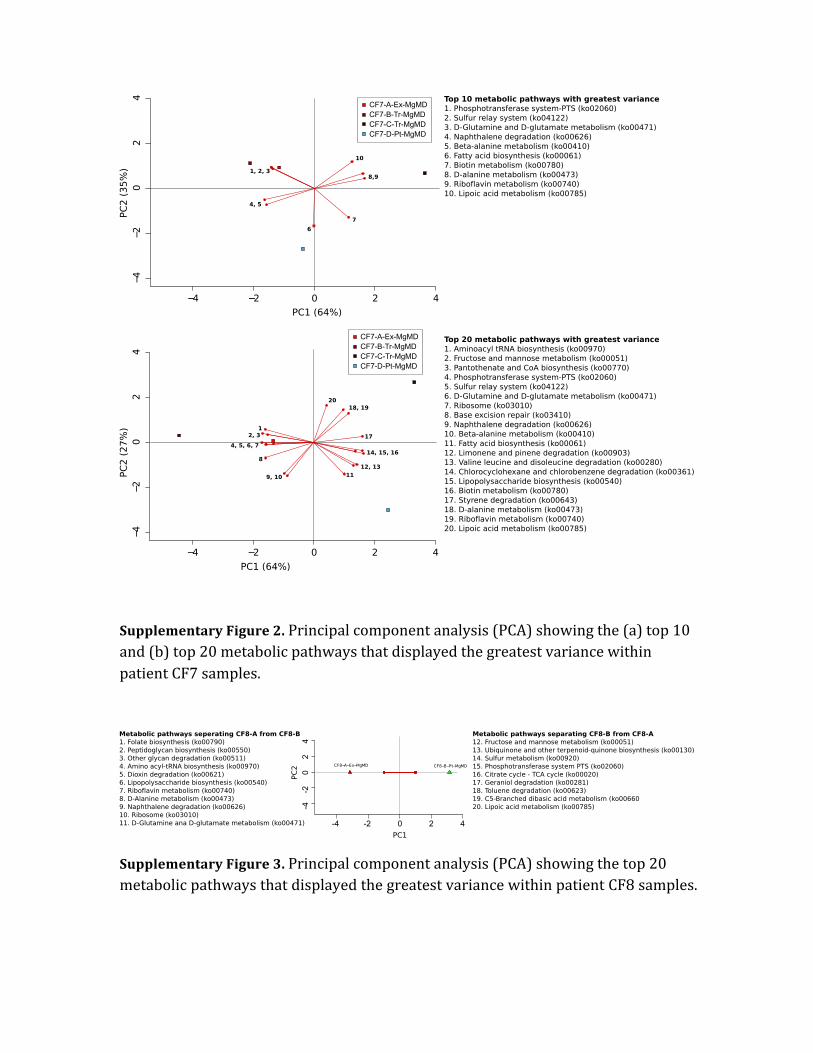
Supplementary Figure 2. Principal component analysis (PCA) showing the (a) top 10 and (b) top 20 metabolic pathways that displayed the greatest variance within patient CF7 samples.
Supplementary Figure 3. Principal component analysis (PCA) showing the top 20 metabolic pathways that displayed the greatest variance within patient CF8 samples.
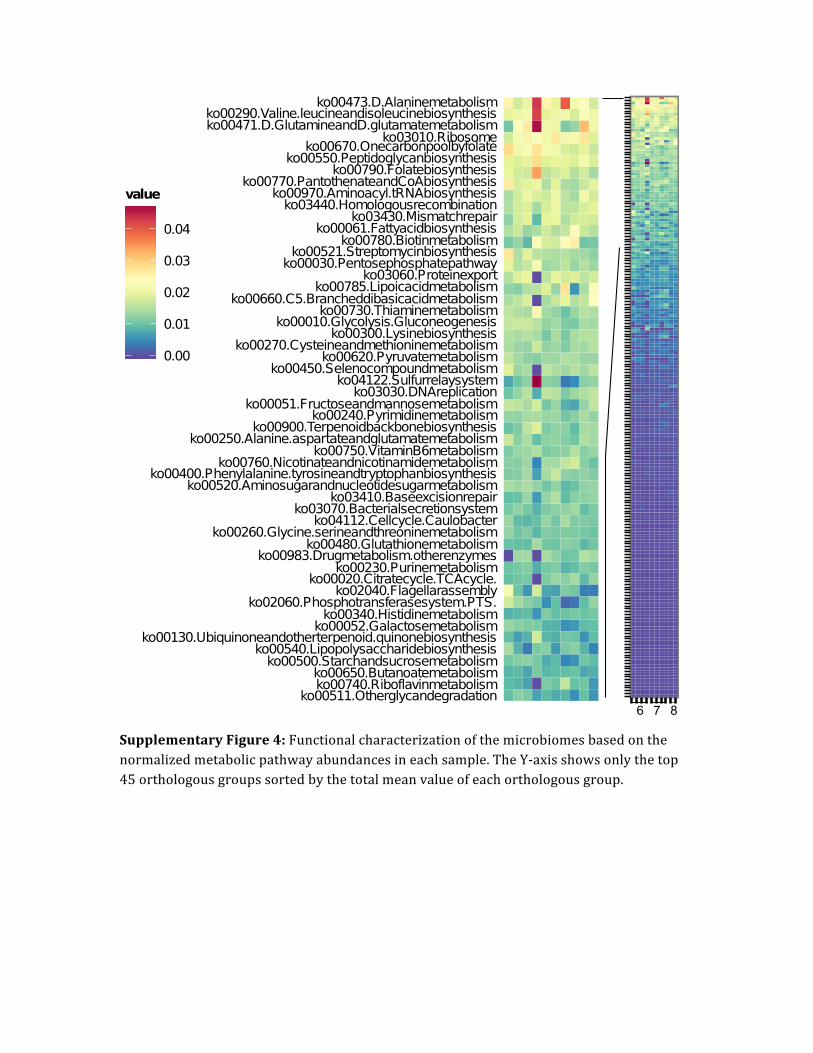
Supplementary Figure 4: Functional characterization of the microbiomes based on the normalized metabolic pathway abundances in each sample. The Y-‐axis shows only the top 45 orthologous groups sorted by the total mean value of each orthologous group.