Embed Size (px)
Citation preview
CLINICIAN PERSPECTIVES ON CURRENT IMPLEMENTATION OF DIGITALLY FABRICATED COMPLETE DENTURES: A SURVEY OF PROSTHODONTISTS
Christine Castelin
A thesis submitted to the faculty at the University of North Carolina at Chapel Hill in partial fulfillment of the requirements for the degree of Master of Science in the Prosthodontics
Department in the Adams School of Dentistry.
Chapel Hill 2020
Approved by:
Ingeborg J. De Kok
Jane A. Weintraub
Wendy A. Clark
Alexandra B. Yarborough
Alexander B. White

ii
© 2020
Christine Castelin ALL RIGHTS RESERVED
iii
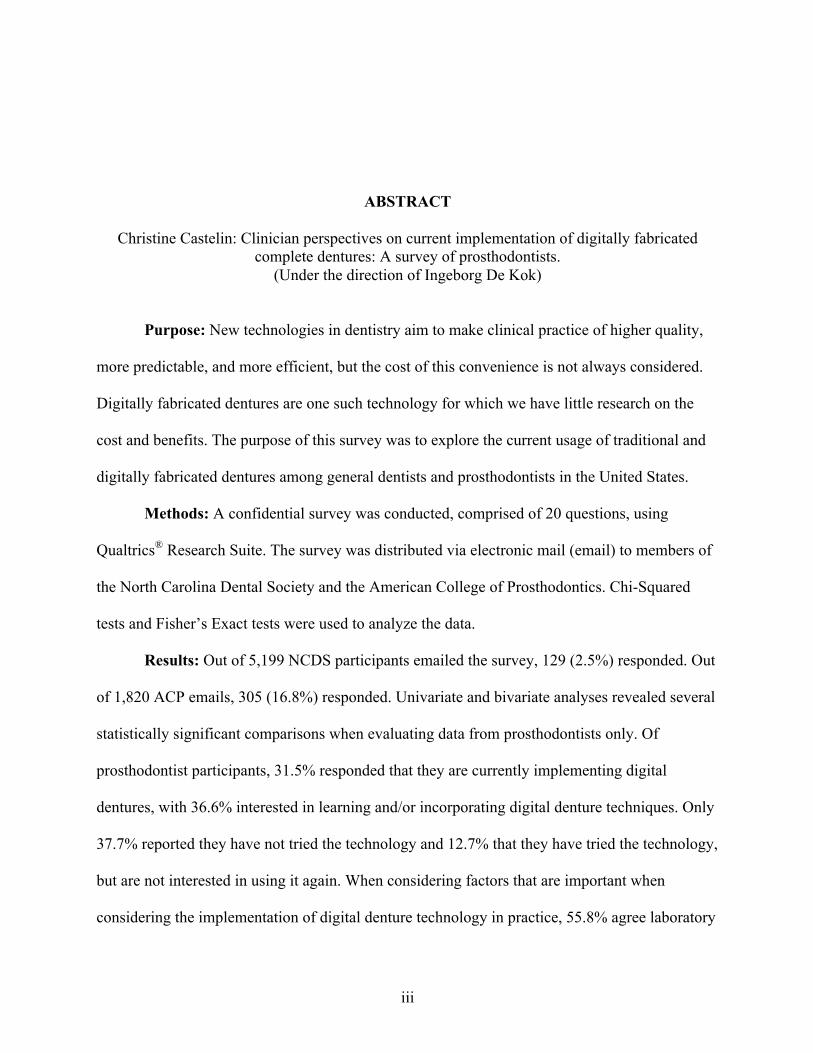
ABSTRACT
Christine Castelin: Clinician perspectives on current implementation of digitally fabricated complete dentures: A survey of prosthodontists.
(Under the direction of Ingeborg De Kok)
Purpose: New technologies in dentistry aim to make clinical practice of higher quality,
more predictable, and more efficient, but the cost of this convenience is not always considered.
Digitally fabricated dentures are one such technology for which we have little research on the
cost and benefits. The purpose of this survey was to explore the current usage of traditional and
digitally fabricated dentures among general dentists and prosthodontists in the United States.
Methods: A confidential survey was conducted, comprised of 20 questions, using
Qualtrics® Research Suite. The survey was distributed via electronic mail (email) to members of
the North Carolina Dental Society and the American College of Prosthodontics. Chi-Squared
tests and Fisher’s Exact tests were used to analyze the data.
Results: Out of 5,199 NCDS participants emailed the survey, 129 (2.5%) responded. Out
of 1,820 ACP emails, 305 (16.8%) responded. Univariate and bivariate analyses revealed several
statistically significant comparisons when evaluating data from prosthodontists only. Of
prosthodontist participants, 31.5% responded that they are currently implementing digital
dentures, with 36.6% interested in learning and/or incorporating digital denture techniques. Only
37.7% reported they have not tried the technology and 12.7% that they have tried the technology,
but are not interested in using it again. When considering factors that are important when
considering the implementation of digital denture technology in practice, 55.8% agree laboratory
iv
costs matter, 72.1% agree total chair time spent matters, and 81.9% agree patient satisfaction
matters. About 12 respondents added comments specifically about unacceptable esthetics of
digitally fabricated dentures compared with conventional dentures as a drawback to the
technology.
Conclusion: The survey results demonstrated that prosthodontists are implementing
digitally fabricated dentures in their clinical practice as well as in educational settings, but not at
the rate that might be expected of a technology that has been available for 8 or more years.
Prosthodontists who graduated from dental school after about 1991 seem most interested in
learning about and incorporating these newer technologies. Considering the factors that matter to
implementing this newer technology, time, cost, and patient satisfaction seem to be important.
v
ACKNOWLEDGEMENTS
I would like to personally thank my dedicated and diverse research committee for
offering me a great deal of their time and attention during this project. Their individual
experiences and expertise have allowed for a rich collaboration, culminating in this paper. This
process has taught me not only about the research process but also the importance of challenging
your own notions. Their dedication to perfection, leaving no detail ignored, has encouraged me
to continue to question processes and results. I believe that most growth occurs when you are
uncomfortable. During this project, this committee has supported me while also encouraging me
to push myself and experience the unique challenges involved in a survey study.
Our statistical assistance was graciously provided by Dr. Ceib Phillips and her team of
graduate students. I am thankful for their willingness to work with such a large data set, in
addition to many extra responsibilities during this school-wide closure due to the Covid-19
pandemic.
This Graduate Prosthodontics residency program has been an incredible experience, but
also one of the most difficult undertakings I could have chosen. Without a support network of
my family, fiancée, and friends, I would have been much more miserable over the past three
years. My co-residents and program faculty have become a second family, and I am grateful for
the inspiration they offer me, even on the longest days.
vi
TABLE OF CONTENTS
LIST OF TABLES ......................................................................................................................... ix
LIST OF FIGURES ........................................................................................................................ x
LIST OF ABBREVIATIONS ........................................................................................................ xi
CHAPTER 1: REVIEW OF THE LITERATURE ......................................................................... 1
1. Introduction ............................................................................................................................. 1
2. Literature Review .................................................................................................................... 2
2.1 History of Digitally Fabricated Dentures .......................................................................... 2
2.2 Classification of Digitally Fabricated Dentures ................................................................ 6
2.2.A. Additive Manufacturing: 3D Printing .......................................................................... 6
2.3 Digital Workflow Process ................................................................................................. 7
2.4 Benefits of digital dentures ............................................................................................... 9
2.4.A. Fit and Retention .......................................................................................................... 9
2.4.B. Biocompatibility ......................................................................................................... 10
2.4.C Accuracy ...................................................................................................................... 11
2.4.D Material strength ......................................................................................................... 12
2.4.E Patient Satisfaction ...................................................................................................... 12
2.4.F Reproducibility ............................................................................................................ 13
2.5 Treatment Time ............................................................................................................... 13
2.6 Post-Treatment Adjustments ........................................................................................... 14
vii
2.7 Educational Opportunities .............................................................................................. 15
2.8 Time and Cost ................................................................................................................. 16
2.9 Available Studies on cost and benefit ............................................................................. 20
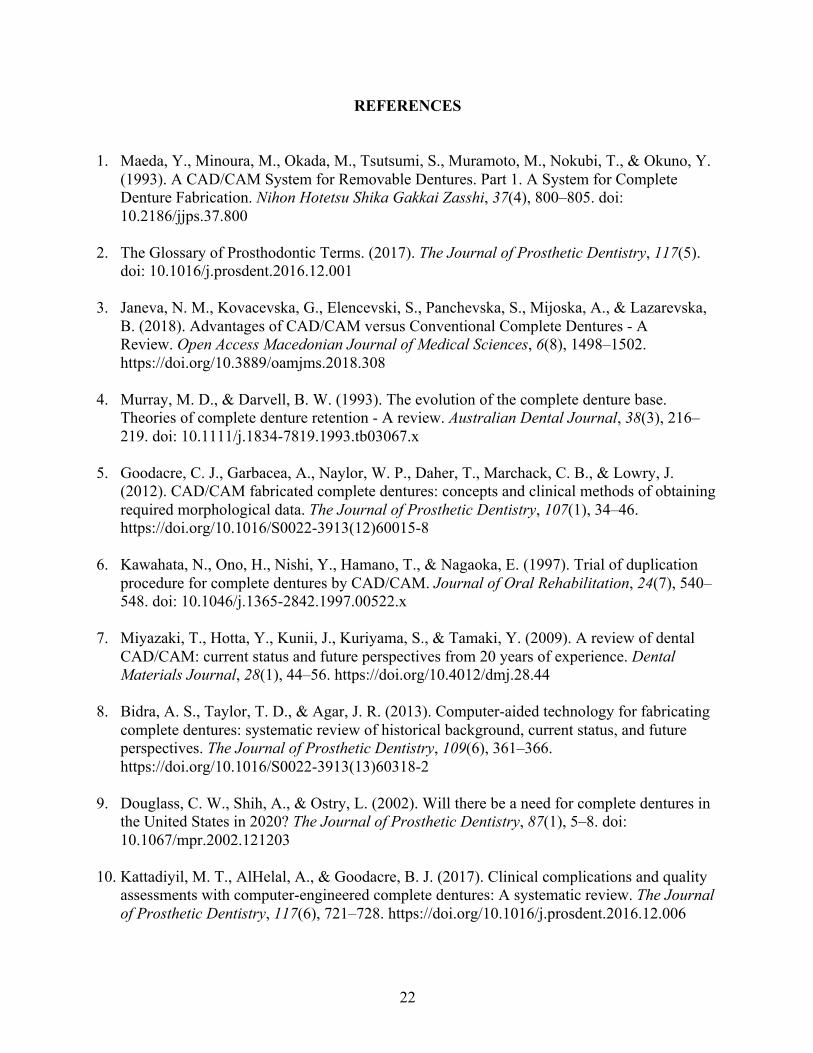
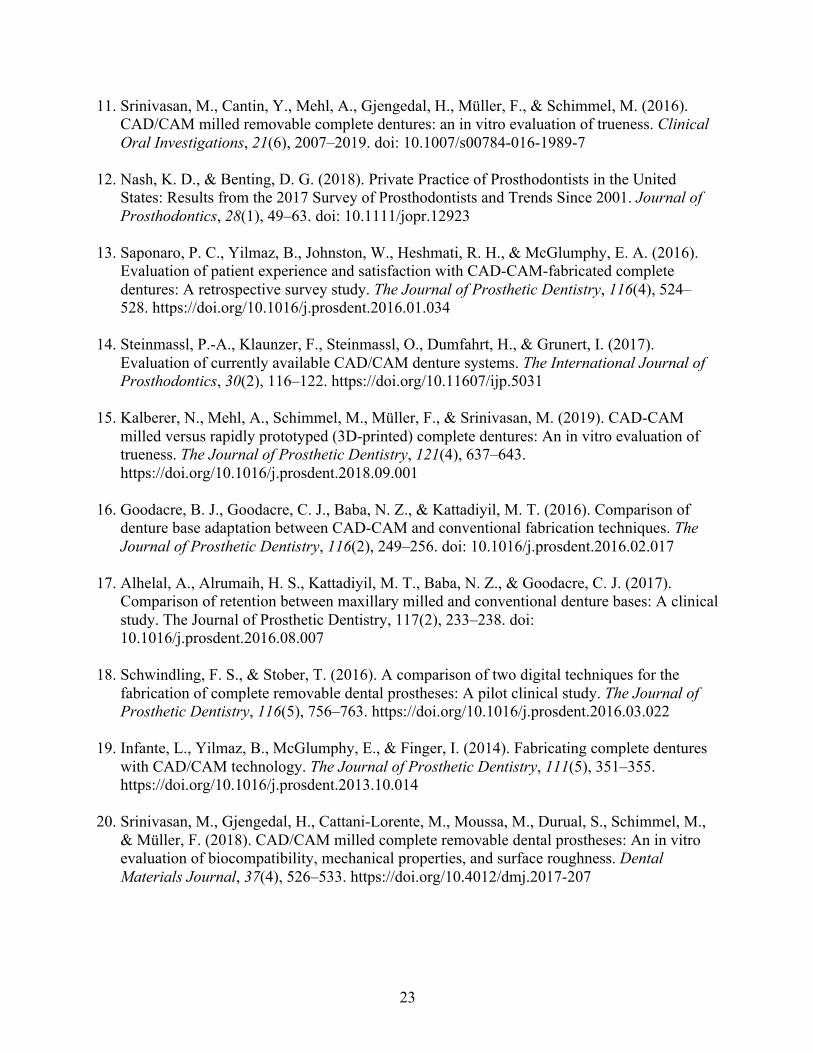
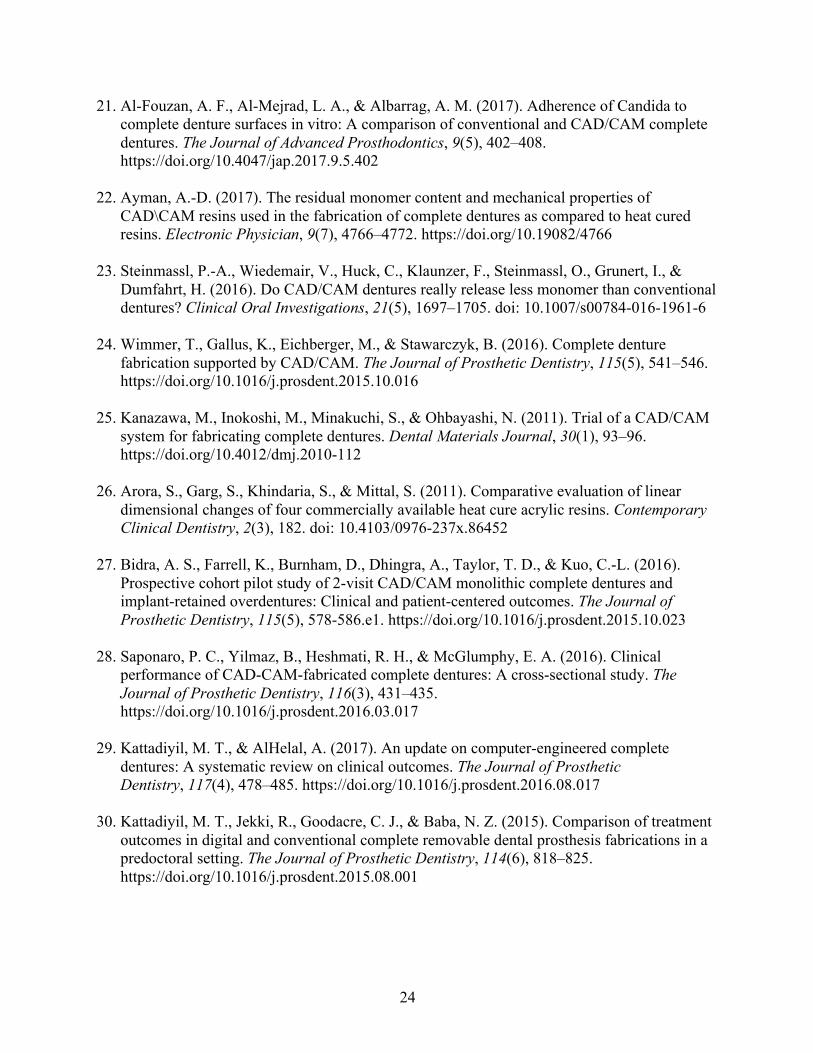
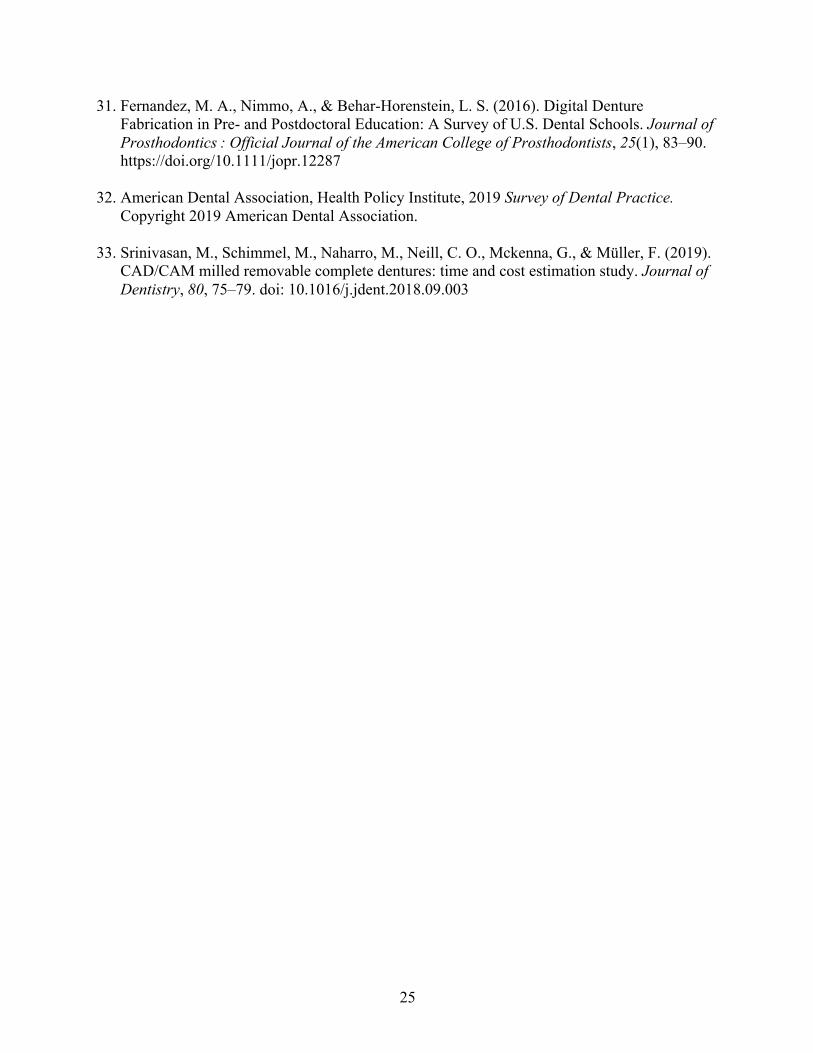
REFERENCES ............................................................................................................................. 22
CHAPTER 2: MANUSCRIPT ..................................................................................................... 26
1. Introduction ........................................................................................................................... 26
2. Materials and Methods ......................................................................................................... 29
3. Statistical Analysis ................................................................................................................ 32
4. Results ................................................................................................................................... 33
4a. Response Rates ................................................................................................................ 33
4b. Characteristics of Prosthodontic Participants ................................................................. 33
4c. Characteristics of Prosthodontic Practices ...................................................................... 33
4d. Univariate Analyses ........................................................................................................ 34
4e. Bivariate Analyses .......................................................................................................... 35
4e1. Gender ........................................................................................................................... 35
4e2. Dental School Graduation Year .................................................................................... 36
4e3. Number of Providers in Practice Setting Treating Complete Denture Patients ............ 37
4e4. Geographic classification .............................................................................................. 37
4f. Bivariate Analyses ........................................................................................................... 38
4f1. Experience with digitally fabricated dentures ............................................................... 38
4f2. Factors that matter when considering implementing dentures ...................................... 40
4f3. Reasons why digitally fabricated dentures are not used in practice .............................. 41
4g. Qualitative Analyses ....................................................................................................... 42

viii
5. Discussion ............................................................................................................................. 45
6. Conclusion ............................................................................................................................ 51
REFERENCES ......................................................................................................................... 52
APPENDIX ................................................................................................................................. 127
ix
LIST OF TABLES
Table 1. Primary and Secondary Outcome Measures ................................................................... 30
Table 2. Qualitative Analysis Themes .......................................................................................... 42
Table 3-13. Univariate Analyses ................................................................................................... 54
Table 4-89. Bivariate Analyses ..................................................................................................... 65
x
LIST OF FIGURES
Figure 1. Timeline of digitally fabricated dentures from first development until present .............. 4
Figure 2. Conventional denture workflow ...................................................................................... 8
Figure 3. Digitally fabricated denture workflow ............................................................................ 8
Figure 4. Traditional complete denture workflow time and cost estimations ............................... 18
Figure 5. Digitally fabricated complete denture workflow time and cost estimations ................. 18
Figure 6. Cost comparisons between traditional methods and digital methods ............................ 19
Figure 7. Formula for estimated hourly labor cost implemented by Srinivasan et al. (33) .......... 20
xi
LIST OF ABBREVIATIONS
CAD Computer-aided Design
CAM Computer-aided Manufacturing
NCDS North Carolina Dental Society
ACP American College of Prosthodontics
PMMA Poly(methyl methacrylate)
1
CHAPTER 1: REVIEW OF THE LITERATURE 1. Introduction
Complete dentures have been a treatment for edentulous patients to restore form,
function, esthetics, and phonetics, for centuries and offer many functional and psychosocial
benefits. While the importance of complete dentures in current prosthodontics cannot be
overstated, technological advances of this particular treatment have only recently grown. Over
the past 20 years, a new method of fabricating complete dentures has been developed. (1) A
“digitally fabricated denture” otherwise known as a “CAD/CAM (Computer-aided
Design/Computer-aided manufacturing) denture” is a removable complete denture created by
using CAD, CAM processes rather than traditional fabrication methods”. (2) These dentures are
designed and created using new technology rather than traditional laboratory techniques and
boast improvements to the entire complete denture process for patients, clinicians, and laboratory
technicians.
Claims of the benefits of digital dentures include many improvements upon the
traditional techniques including: increased retention, strength, and wear resistance due to
superior material properties, fewer clinical appointments for patients, fast and simple
reproducibility, potentially more sustainable material practices, the ease of storing patient
information digitally, and the opportunity to improve communication and speed between
clinicians and laboratory technicians. Ultimately, digitally fabricated dentures could potentially
2
offer patients and clinicians a time and cost-efficient alternative to traditionally fabricated
complete dentures.
Considering these multiple benefits for clinicians who have adopted these techniques, and
patients potentially requesting this treatment method, the question remains whether or not digital
dentures are currently worth implementing in educational, private practice, or public health
settings. At the crux of this decision for providers, like most business decisions, is the cost versus
the benefit. While patient and individual provider perspectives have been assessed in other
studies, we have little evidence on how general dentists and specialists are incorporating digital
denture technology into practice. In this paper, we will evaluate the potential costs and benefits
to determine if digital dentures are a feasible, or potentially better, treatment for edentulous
patients. Due to the novelty of the technique and high laboratory costs currently in place, do the
reported time savings balance out the additional costs that come along with a new technology?
2. Literature Review 2.1 History of Digitally Fabricated Dentures Dentures have been used for centuries as a treatment for edentulous patients to restore
form, function, and esthetics. More than 80 years ago, dentures were fabricated with various
materials and methods to imitate oral structures in both daily activities such as mastication,
speech, and muscular control, as well as to improve esthetics. (3) It was not until 1936 when the
currently-used resin material, poly(methyl methacrylate) (PMMA) became commonplace for
removable complete denture fabrication and has been used since due to its favorable material
properties, biocompatibility, and appearance. (4) This acrylic resin depends on heat
3
polymerization to harden into a prosthesis that can then be polished and adjusted for a patient to
wear and use. While the material itself might be the same today, techniques and modifications to
the methods have certainly improved complete denture quality.
Digital advances in dentistry have allowed for these improved material qualities and
methods of fabrication. Crown and bridge dentistry has benefitted first and foremost from the
digital dentistry age. The first CAD/CAM crown was designed and milled from a computer file
in the year 1990. (5) Milling became more commonplace in dentistry by 1997 and has since
replaced nearly all traditional crown and bridge laboratory methodologies today. (6) Advantages
of CAD/CAM techniques for crown and bridge workflows include the ability to use improved
materials, reduced overall labor, cost effectiveness, and the increase in quality control efforts –
the same principles can be applied to digital dentures, which in the past have included a vast
range of quality, fabrication techniques, and human error. (7)
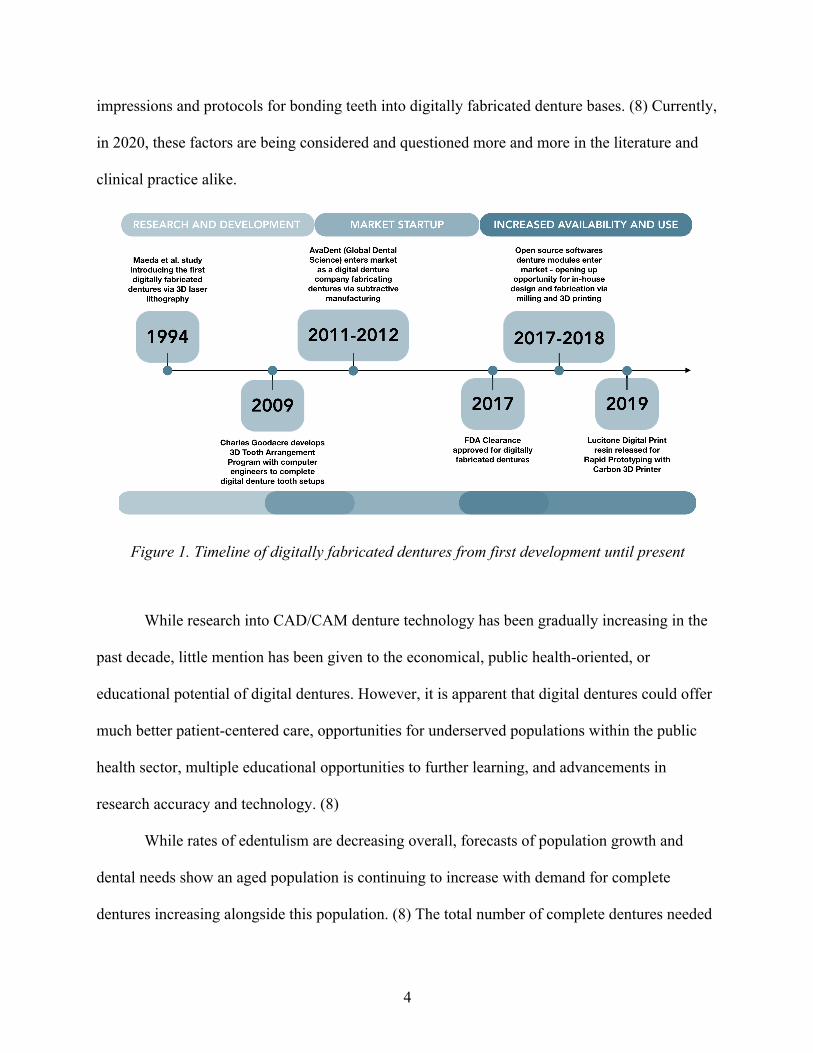
During this technological period, dentistry has been experimenting with fabricating
removable prostheses digitally as well. Digitally fabricated dentures were first developed as early
as 1994 by Japanese researchers implementing rapid prototyping. (1) Since then, multiple
companies and laboratories have entered the digital dental market, which continues to evolve
rapidly. In 2009, Goodacre developed the 3D Tooth Arrangement Program with the help of
computer programmers for dental student education. This software allows for tooth arrangement
digitally to view occlusal schemes, setups, and allows for faculty to assess competency with a
measured approach. (5) Shortly after, multiple proprietary tooth arrangement software programs
were developed and are now available for providers or laboratory technicians to create denture
tooth setups and festooning with the click of a mouse. As of 2013, a systematic review indicated
that two aspects of CAD/CAM dentures needing more research and development were digital
4
impressions and protocols for bonding teeth into digitally fabricated denture bases. (8) Currently,
in 2020, these factors are being considered and questioned more and more in the literature and
clinical practice alike.
Figure 1. Timeline of digitally fabricated dentures from first development until present
While research into CAD/CAM denture technology has been gradually increasing in the
past decade, little mention has been given to the economical, public health-oriented, or
educational potential of digital dentures. However, it is apparent that digital dentures could offer
much better patient-centered care, opportunities for underserved populations within the public
health sector, multiple educational opportunities to further learning, and advancements in
research accuracy and technology. (8)
While rates of edentulism are decreasing overall, forecasts of population growth and
dental needs show an aged population is continuing to increase with demand for complete
dentures increasing alongside this population. (8) The total number of complete dentures needed
5
in the United States is still increasing. Estimates of 61 million dentures to be made in the US in
the year 2020 were published two decades ago. (9) Even despite further advances in dental
implant therapies for edentulous patients, complete dentures are still projected to be in high
demand and to experience increases in coming years. (10) With the option of easy
reproducibility and dentures made with fewer appointments, CAD/CAM dentures could assist
elderly populations who have trouble with accessing care. Dentures can easily be reproduced if
lost or damaged in nursing homes or during hospital visits. (11)
Along with an aging edentulous population, there is currently a shortage of dental
laboratory technicians, which means there is a great need for efficiency in laboratory workflow
processes. (8) With less laboratory support, dental providers might need to become more
involved in the laboratory design work itself. In 2010, about 9 million complete dentures were
provided to patients in the United States. Only about 5% were made by specialists in
prosthodontists. (12) As demand for complete dentures continues to increase, general dentists
will be expected to bridge this gap. All of these factors could impact access to dental care and,
possibly, the difficulties public health programs face with fewer resources based on their
geographic locations and fewer dental laboratories available. (8) Public health considerations
could pressure faster adoption of this newer dental technology.
Economics also impact how quickly a new technology is adopted. As dental providers
seek to make treatment as efficient as possible to combat the high costs of overhead, technology
is often relied upon. Offering conventional complete dentures as a treatment includes
disadvantages related to operator chair time, laboratory expenses for multiple steps in treatment,
and potential for increased number of patient visits both during and after treatment. These
disadvantages may discourage clinicians from offering complete dentures in their practices.
6
Many dentists offer fixed implant treatments that gross more profit to offset high operative costs,
however not all patients can afford implant-assisted complete dentures or fixed prostheses. The
costs can range from 5 to 12 times more than conventional complete dentures. For these
populations, it is important to have a highly functional and esthetic treatment option for patients
with edentulism. (10) To assist general dentists and specialists in providing this important
treatment for edentulous patients, efficient techniques should be available. (13)
2.2 Classification of Digitally Fabricated Dentures
Digital dentures can be fabricated in either additive or subtractive methods. Additive
manufacturing, including rapid prototyping or 3D printing, is the newest method of fabricating
definitive prostheses, although it has been used in prototyping and other areas of dentistry for
years. Alternatively, subtractive manufacturing, milling or machining, constitutes the most
common manufacturing method outlined in most dental literature surrounding digital dentures.
(14) Currently, milling is the most reliable and accepted means of fabricating a digitally
fabricated complete denture. While 3D printing is becoming increasingly popular among dental
laboratories due to its lower production costs, there is scarce literature available regarding the
materials recently released for 3D printing dentures.
2.2.A. Additive Manufacturing: 3D Printing While subtractive manufacturing, or milling from a pre-polymerized block of PMMA, is
the current standard in CAD/CAM dentures due to its larger and longer term anecdotal and
scientific evidence base, rapid prototyping, 3D printing resin, is beginning to gain traction. While
7
clinical research on additive manufactured final prostheses is in its infancy, there is literature
available to support adjunctive roles in digital denture record making.
An in vitro study to compare trueness between milled and 3D printed complete dentures
found that the trueness of milled prostheses was significantly better than 3D printed dentures
when evaluating the intaglio, the side in contact with the oral mucosa, surfaces. (15) While 3D
printing with light-polymerizing resin is more sustainable, as there is less wasting of material,
and it could be more affordable for laboratories compared to milling materials and machines, we
do not yet have enough research on biomaterials and their interactions with oral biological
structures and other dental materials to draw any conclusions or recommendations for use. (15)
With flexibilities in design and prototyping, 3D printing is a helpful digital adjunct to traditional
record-making methods although not yet a predictable method of digital denture fabrication.
2.3 Digital Workflow Process
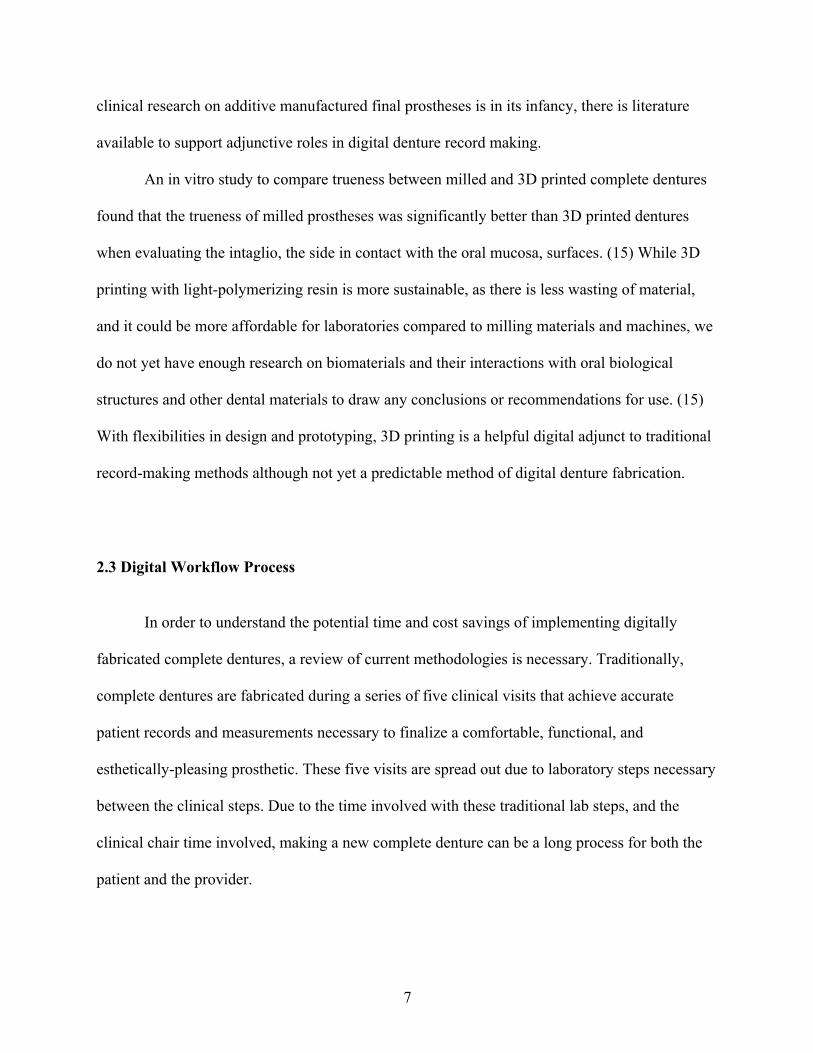
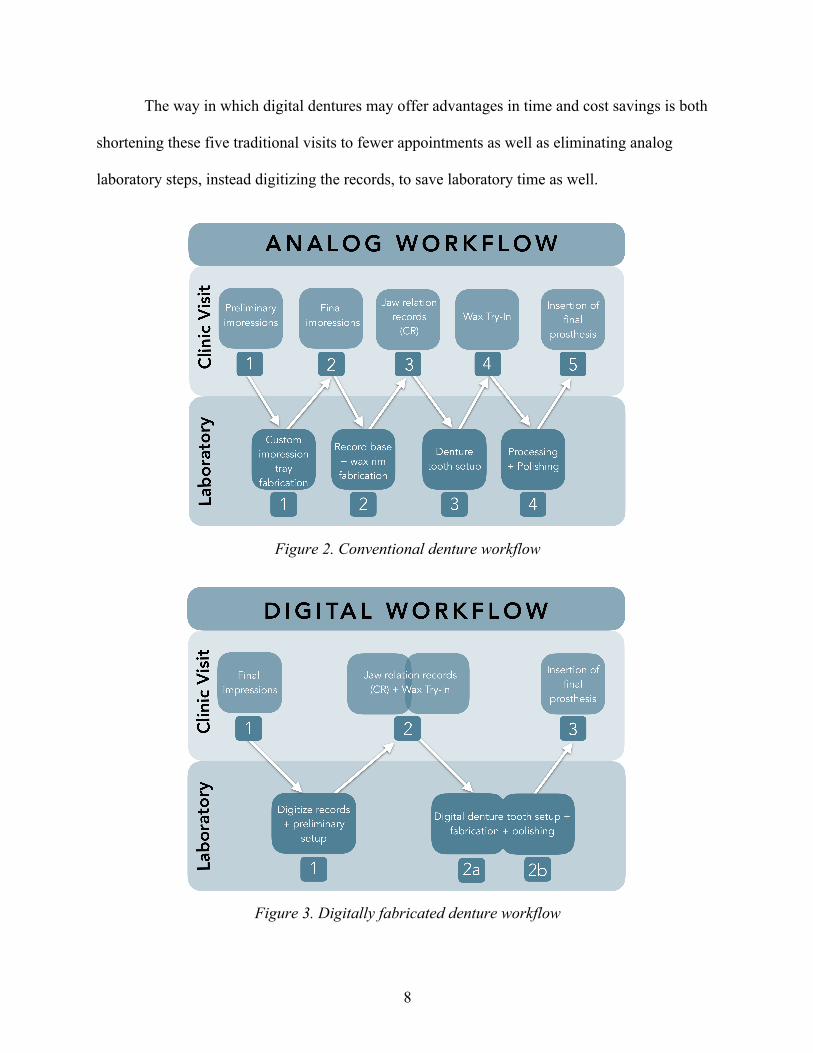
In order to understand the potential time and cost savings of implementing digitally
fabricated complete dentures, a review of current methodologies is necessary. Traditionally,
complete dentures are fabricated during a series of five clinical visits that achieve accurate
patient records and measurements necessary to finalize a comfortable, functional, and
esthetically-pleasing prosthetic. These five visits are spread out due to laboratory steps necessary
between the clinical steps. Due to the time involved with these traditional lab steps, and the
clinical chair time involved, making a new complete denture can be a long process for both the
patient and the provider.
8
The way in which digital dentures may offer advantages in time and cost savings is both
shortening these five traditional visits to fewer appointments as well as eliminating analog
laboratory steps, instead digitizing the records, to save laboratory time as well.
Figure 2. Conventional denture workflow
Figure 3. Digitally fabricated denture workflow
9
2.4 Benefits of digital dentures While some dentists believe the methods and materials involved in conventional
complete dentures have been working well for the past 80 years, many providers, laboratories,
and researchers are focused on developing a digital way of making dentures due to some possible
improvements. The proposed benefits of digital dentures include: reduced total number of
appointments and, therefore, chair time, digital archiving and communication capabilities, a
more favorable fit with increased comfort and retention, and overall better patient-centered
outcomes with easier reproducibility. (3) Ultimately, these prostheses must offer improvements
over traditional methods of fabrication in multiple fields to be widely accepted by doctors,
laboratories, and patients alike.
2.4.A. Fit and Retention Traditional processing of PMMA from a liquid to a hardened state creates linear
distortion up to 0.9%, which impacts how the denture fits intraoral soft tissues. (16) Because
milled dentures are made from a block of PMMA that has been pre-polymerized, they are able to
have a more intimate soft tissue fit which could also increase retention.
Retention was found to be significantly superior in milled denture bases compared to heat
polymerized (traditional methods) in a clinical study that measured vertical displacement in vivo.
(17) However, a different small-scale clinical trial compared injection-molded complete dentures
and milled complete dentures for fit, retention, and occlusion. No major differences were
observed and, in fact, fit and retention was rated as very good for both study groups. (18)
Depending on the patient’s oral anatomy and methods of border molding and impression-
10
making, it is reasonable to assume that the claim of increased fit and retention may be difficult to
prove.
2.4.B. Biocompatibility
Another potential benefit of beginning with a pre-polymerized puck of PMMA includes
biocompatibility improvements. In theory, due to the pre-polymerization, milled PMMA could
have less porosities and processing errors, which could decrease bacterial biofilm and fungal
adherence. The pucks could also release less free monomer over time, which could in turn lessen
adverse sensitivity reactions in patients. (19) In the literature, however, few articles exist on
biocompatibility, and more research is necessary to defend these claims with confidence.
One study compared traditional flask pack and press PMMA to a pre-polymerized puck
of PMMA and found that biocompatibility assays demonstrated no significant difference in vitro.
(20) The conclusions they drew were that CAD/CAM pre-polymerized PMMA denture base
materials had equal biocompatible properties yet improved mechanical properties when
compared to traditional heat-cured PMMA denture material. (20) Another in vitro study found
that less candida was observed on pre-polymerized PMMA pucks compared to pack and press
fabricated acrylic samples which could indicate that fungal adherence is lessened. (21)
As far as observing free monomer leaching, it appears that initial claims have been tested
in several studies. In one in vitro study, gas chromatography was used to evaluate free monomer
release after processing the resin at 2 days and 7 days after. It was found that pre-polymerized
PMMA pucks showed less free monomer release at those time points. (22) Another study
concluded that no less free monomer was found in pre-polymerized PMMA digital dentures, but
suggested this could also be due to the bonding agents necessary to connect the denture teeth to
11
the milled bases. (23) If this were true, then only monolithic milled dentures (denture teeth and
base milled from the same puck of white and pink PMMA) would be considered to have less
monomer release.
2.4.C Accuracy Digital technology allows for incredibly precise design and manufacturing that can have
implications for the strength, longevity, and comfort of a prosthesis. Consistency in denture base
thickness can be designed and milled exactly through CAD/CAM systems. (24) This process can
maximize patient comfort while maintaining material strength and minimize flexural distortion.
Accuracy is paramount in not only the initial record-making steps but also during
prosthesis fabrication. One in vitro study fabricated digital dentures to determine the accuracy of
the fabrication process by comparing to the planned denture in the software. They found that the
occlusal surface was fabricated with slightly lower accuracy than the buccal surfaces. Average
deviation from planned was 0.50 mm for the teeth and 0.10 mm for the base. (25) Their protocol
used a CBCT system and 5-axis milling with denture teeth bonded in separately. The authors
suggest a weak point in the discrepancies is bonding teeth into sockets. (25) Another in vitro
study compared 4 fabrication techniques, using AvaDent milled as its digital denture sample, and
found that milled was the most accurate and reproducible fabrication technique, followed by
injection molding, pour, and pack and press. This could increase patient comfort and decrease
clinician chair time. (16) It is important that accuracy is just as high if not better than traditional
methods of denture fabrication, however, it is unknown at what point these measurements pose
true clinical significance.
12
2.4.D Material strength
Poly(methyl methacrylate) (PMMA) has been used for denture bases in the oral
environment since the year 1937. (26) No major changes have been made to the chemical
structure of this acrylic resin, but variations in processing methods overtime have improved the
outcomes from polymerization. When evaluated in vitro, milled denture bases were found to
exhibit increased toughness, ultimate strength, higher elastic modulus. (20) These improvements
could indicate that denture bases will be able to be milled with a decreased overall thickness
without increasing rates of fracture, which could improve patient speech and comfort. (20) While
an exhaustive list of milled denture base material properties has not been confirmed, there could
be additional benefits of pre-polymerized PMMA.
2.4.E Patient Satisfaction
Patients are directly impacted by a change in provider workflow, mostly due to the
impact it has on their personal time and comfort. If fewer visits are necessary and if the denture
could be delivered in a shorter amount of time than a traditional laboratory process, it could be
expected that most patients would prefer a digital workflow.
A retrospective survey sought to gain perspective on patient experiences of both the
digitally fabricated denture process as well as the final prosthesis. Questions asked related to
overall comfort, esthetics, speech, and satisfaction. Experienced denture wearers who received a
new set of dentures made by digital fabrication methods have reported high rates of satisfaction
with their final removable prostheses. (13) Bidra also found the overall absence of denture sore
spots and decreased treatment time was favorable from a patient perspective. (27) If patient
13
satisfaction remains high and the process can be more cost and time efficient, then it is
reasonable to assume digital dentures should be implemented for the benefit of both the
practitioner and patient. Because fewer appointments and shorter overall treatment time could
improve patient and provider satisfaction, digital dentures might become more accessible as a
treatment option. (13)
2.4.F Reproducibility
Many adults in the United States live in long-term care facilities with the possibility of
losing and misplacing dental prostheses. An added benefit of digitally fabricated dentures is the
ease of reproducibility. The ability to save a digital file and easily reproduce a denture could
assist geriatric populations with challenges in accessing transportation or dental care, especially
if their removable prostheses are lost or damaged in nursing homes or during hospital visits. (11)
The simple action of quickly replacing a denture by milling or 3D printing a new one can save
the patient additional costs and visits to a dental provider.
2.5 Treatment Time Treatment time becomes an important factor for clinicians deciding to implement digital
denture protocols into practice. This time can be sectioned into chair time, when the patient is in
the clinician’s operatory chair for an appointment, and administrative time spent communicating
with laboratories about active patient treatment.
Many studies have begun trials on the proposed two-appointment digital denture
protocol. Saponaro found that average appointments for the digital denture protocol equals 2.39
14
clinical visits. Schwindling and Stober found that the Weiland Dental System protocol intended
for 4 visits ended up being 5.4 total visits needed instead. One retrospective study evaluated
dental students and graduate prosthodontics residents implementing a 2-appointment complete
digital denture protocol to determine how many actual appointments it took until delivery, how
many post-insertion visits were necessary, and also chronicled prosthetic complications. They
found that 2.39 mean visits were needed until insertion, not the proposed 2 visits. (28)
Even experienced prosthodontic clinicians reported considerable time spent
communicating with the laboratory using both phone and email, which increased administrative
time spent outside of clinical hours. (27) A 2-visit digital denture protocol was tested in twenty
patients and, on average, 5 email communications were necessary to correspond with the lab
regarding treatment. (27) Other studies cite similar difficulties. Unique complications include the
difficulty of learning how to preview and manipulate a digital denture tooth setup. Provider
perspectives must be considered with regards to time, both during clinic time while seeing
patients and administratively completing laboratory communications.
2.6 Post-Treatment Adjustments Just as treatment time during the denture fabrication process is important when analyzing
a new technique, the amount of time spent in follow-up visits is also important for patient
acceptance and satisfaction, as well as provider operating costs. Due to the improved fit,
stability, and occlusion of the pre-polymerized acrylic denture, it can be expected that soft tissue
trauma would be reduced, resulting in less post-insertion adjustment visits. (19) Bidra found that,
on average, 3 visits for post-insertion adjustments were needed in the first year with digital
15
dentures. He also found the overall absence of denture sore spots and decreased treatment time
was favorable from a patient perspective. (27) Kattadiyil also suggests that 2-4 post-insertion
adjustment visits seems to be average when implementing digital dentures. (29) Compared to
conventional dentures, this may not be a large difference, although it is often listed as a potential
digital denture benefit.
2.7 Educational Opportunities If clinicians must learn new methods of implementing digital dentures in their practice,
should dental schools and graduate prosthodontics residency programs increase their instruction
of these digital methodologies?
A clinical study at Loma Linda University School of Dentistry was completed to assess
differences between traditionally fabricated in 5 appointments and CAD/CAM-fabricated in two
appointments complete dentures. Patient satisfaction was higher, prosthesis retention was
greater, and students preferred digital workflows over traditional. The conventional method also
included more clinical and laboratory time than the digital methods. (30) This study
demonstrates that dental students might be receptive to digital technologies applied to traditional
lessons in prosthodontics. Specific research into this idea would be necessary to develop digital
dentistry curriculum.
According to a survey of prosthodontic chairs and graduate program directors conducted
to assess the implementation and education of digital dentures in dental school and residency
programs, over half of all prosthodontic specialty residency programs were including digital
denture fabrication methods in their curriculum, and 12% reported including this method in pre-
doctoral education. (31) They also reported that cost of fabrication was a large difference in their
16
ability to provide this educational experience. (31) Upon even further examination, the survey
revealed that a very small proportion (less than 10%) of all complete dentures made in pre-
doctoral and residency programs are fabricated in a digital way. There was mention that 27-38%
of programs plan to implement this technology in their curriculums in the future. (31) Now that
open sourcing markets are available, this trend in education could change.
2.8 Time and Cost While the digitally fabricated denture workflow proposes shortening both the number of
total appointments and the length of appointments needed to fabricate a denture, it follows that
this should save the clinician and patient valuable time. If this digital workflow could save time,
that could also equate to saving opportunity cost.
The opportunities available include streamlining a more efficient treatment process,
improving the overall patient experience, and increasing overall business production. The digital
workflow allows for extensive personalization, dependent on what technologies the provider has
available, including intraoral scanners, laboratory scanners, 3D printers, and milling units.
The digitally fabricated denture market has also experienced changes that affect costs for
providers. Initially, in 2011 and 2012, only a few companies were available in the market for
fabricating digital dentures and charged specific laboratory fees that tended to be higher than
traditional denture laboratory fees. Now that open sourcing has increased the market capabilities
of digital dentures, laboratory costs seem to be decreasing as well. Many traditional dental
laboratories are beginning to offer digitally fabricated dentures as an available service along with
conventional removable prostheses. One laboratory used for the cost estimates provided in this
17
paper charges the same fee for conventional and digital dentures, an upcharge only in place for
“premium” materials or denture teeth.
Examining the time and costs associated with digitally fabricated dentures, certain
assumptions must be made to simplify a comparison. In the following example, several
assumptions include:
- Time and costs to fabricate an upper and lower complete denture
- Assuming no extra wax try-ins are necessary
- Assuming good patient compliance and acceptance
- Assuming an accurate centric relation record and tooth setup at the first try
- Appointments are one hour long for each step for both arches, whether it is conventional or
digital
- Overhead costs include: operatory materials and supplies, personal protective equipment,
fixed costs associating with running a private practice (rent, staff salaries, etc.)
- Variable costs only include laboratory fees for two arches. In this case, the laboratory
charges the same fee for both conventional or digital dentures.
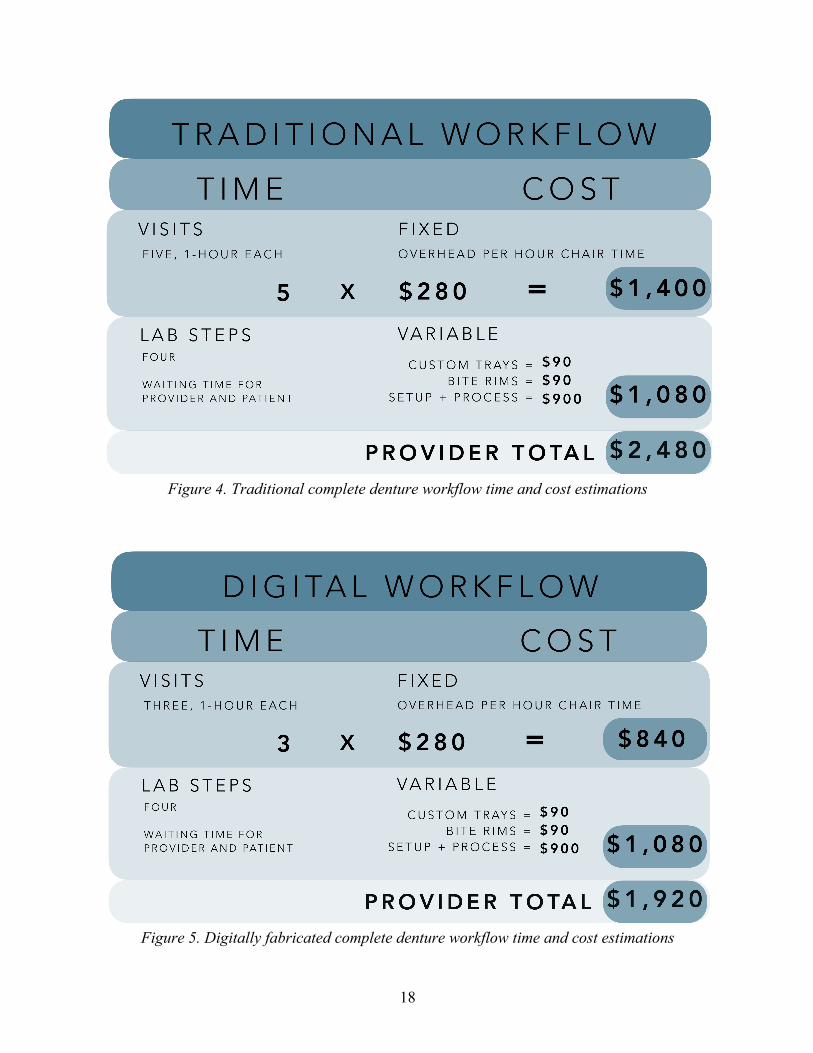
Data from the ADA Health Policy Institute 2018 average yearly expenses for a solo specialist was used to estimate overhead costs for about one hour of chair time in a private practice setting. (32) This number was confirmed by several private practice dentists and prosthodontists. Absolute Dental Lab (Durham, North Carolina) provided their cost estimates for complete denture work. Their charges are the same for traditional complete dentures or digitally fabricated dentures.
18
Figure 4. Traditional complete denture workflow time and cost estimations
Figure 5. Digitally fabricated complete denture workflow time and cost estimations
19
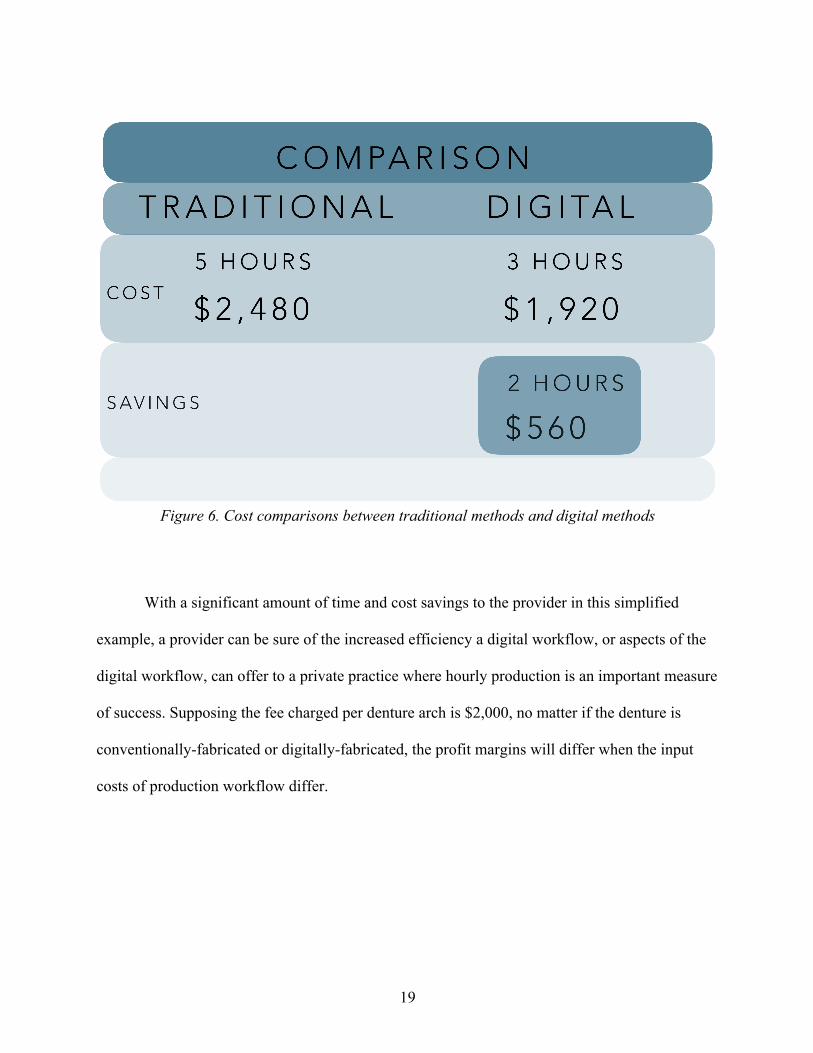
Figure 6. Cost comparisons between traditional methods and digital methods
With a significant amount of time and cost savings to the provider in this simplified
example, a provider can be sure of the increased efficiency a digital workflow, or aspects of the
digital workflow, can offer to a private practice where hourly production is an important measure
of success. Supposing the fee charged per denture arch is $2,000, no matter if the denture is
conventionally-fabricated or digitally-fabricated, the profit margins will differ when the input
costs of production workflow differ.
20
2.9 Available Studies on cost and benefit While theories and assumptions about cost and time savings of digital workflows abound,
there are few articles in the literature that discuss costs and benefits of digital dentures. This
literature review was conducted in PubMed, searching for articles in the English language from
the years 1990 to 2020. Keywords used in searches included: digital dentures, digitally fabricated
dentures, CAD/CAM dentures, cost, patient satisfaction, benefits. Only one study was found to
include the topic of digitally fabricated dentures and costs. No studies were found regarding
private practitioners and digitally fabricated dentures.
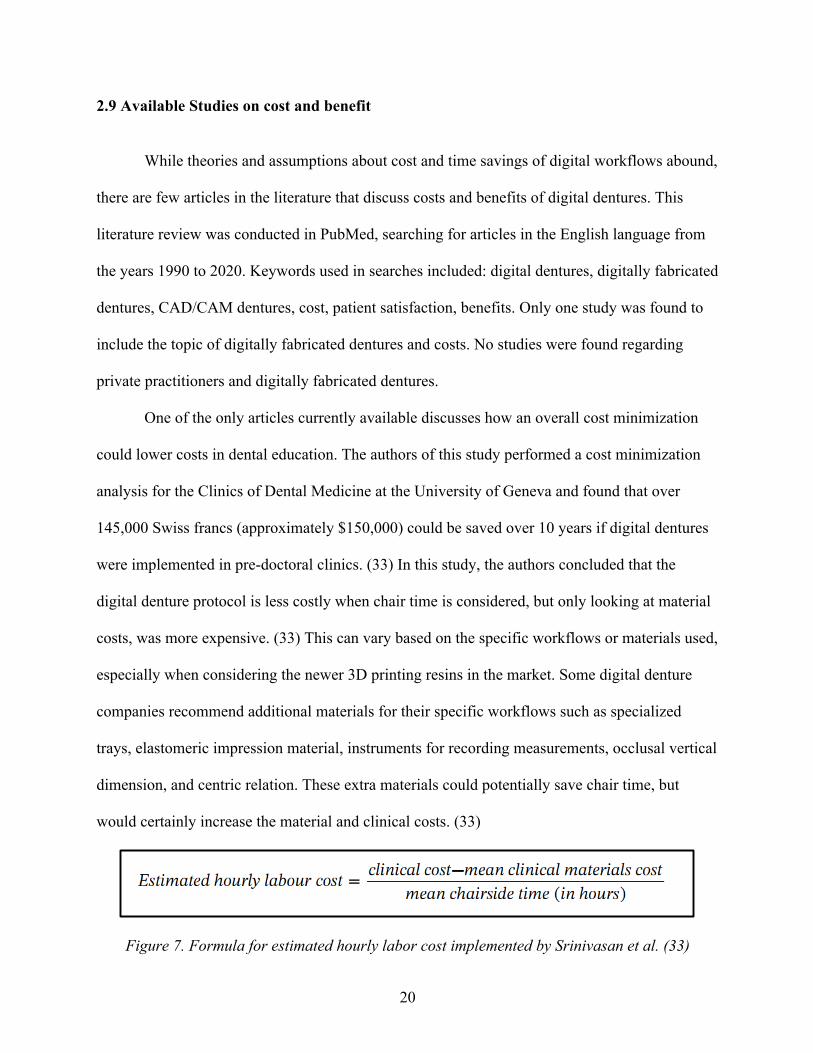
One of the only articles currently available discusses how an overall cost minimization
could lower costs in dental education. The authors of this study performed a cost minimization
analysis for the Clinics of Dental Medicine at the University of Geneva and found that over
145,000 Swiss francs (approximately $150,000) could be saved over 10 years if digital dentures
were implemented in pre-doctoral clinics. (33) In this study, the authors concluded that the
digital denture protocol is less costly when chair time is considered, but only looking at material
costs, was more expensive. (33) This can vary based on the specific workflows or materials used,
especially when considering the newer 3D printing resins in the market. Some digital denture
companies recommend additional materials for their specific workflows such as specialized
trays, elastomeric impression material, instruments for recording measurements, occlusal vertical
dimension, and centric relation. These extra materials could potentially save chair time, but
would certainly increase the material and clinical costs. (33)
Figure 7. Formula for estimated hourly labor cost implemented by Srinivasan et al. (33)
21
The authors did point out that the treatment burden to the patient, the number of total
appointments, could be much less with digital dentures and would be a benefit. This especially
applies to patients who would need to take off school or work to make appointments or those
with transportation and access to care challenges. As far as a public health improvement, being
able to increase access to care for challenged populations could lessen inequalities in restorative
care.
22
REFERENCES
1. Maeda, Y., Minoura, M., Okada, M., Tsutsumi, S., Muramoto, M., Nokubi, T., & Okuno, Y.
(1993). A CAD/CAM System for Removable Dentures. Part 1. A System for Complete Denture Fabrication. Nihon Hotetsu Shika Gakkai Zasshi, 37(4), 800–805. doi: 10.2186/jjps.37.800
2. The Glossary of Prosthodontic Terms. (2017). The Journal of Prosthetic Dentistry, 117(5).
doi: 10.1016/j.prosdent.2016.12.001
3. Janeva, N. M., Kovacevska, G., Elencevski, S., Panchevska, S., Mijoska, A., & Lazarevska, B. (2018). Advantages of CAD/CAM versus Conventional Complete Dentures - A Review. Open Access Macedonian Journal of Medical Sciences, 6(8), 1498–1502. https://doi.org/10.3889/oamjms.2018.308
4. Murray, M. D., & Darvell, B. W. (1993). The evolution of the complete denture base.
Theories of complete denture retention - A review. Australian Dental Journal, 38(3), 216–219. doi: 10.1111/j.1834-7819.1993.tb03067.x
5. Goodacre, C. J., Garbacea, A., Naylor, W. P., Daher, T., Marchack, C. B., & Lowry, J.
(2012). CAD/CAM fabricated complete dentures: concepts and clinical methods of obtaining required morphological data. The Journal of Prosthetic Dentistry, 107(1), 34–46. https://doi.org/10.1016/S0022-3913(12)60015-8
6. Kawahata, N., Ono, H., Nishi, Y., Hamano, T., & Nagaoka, E. (1997). Trial of duplication
procedure for complete dentures by CAD/CAM. Journal of Oral Rehabilitation, 24(7), 540–548. doi: 10.1046/j.1365-2842.1997.00522.x
7. Miyazaki, T., Hotta, Y., Kunii, J., Kuriyama, S., & Tamaki, Y. (2009). A review of dental
CAD/CAM: current status and future perspectives from 20 years of experience. Dental Materials Journal, 28(1), 44–56. https://doi.org/10.4012/dmj.28.44
8. Bidra, A. S., Taylor, T. D., & Agar, J. R. (2013). Computer-aided technology for fabricating
complete dentures: systematic review of historical background, current status, and future perspectives. The Journal of Prosthetic Dentistry, 109(6), 361–366. https://doi.org/10.1016/S0022-3913(13)60318-2
9. Douglass, C. W., Shih, A., & Ostry, L. (2002). Will there be a need for complete dentures in
the United States in 2020? The Journal of Prosthetic Dentistry, 87(1), 5–8. doi: 10.1067/mpr.2002.121203
10. Kattadiyil, M. T., AlHelal, A., & Goodacre, B. J. (2017). Clinical complications and quality
assessments with computer-engineered complete dentures: A systematic review. The Journal of Prosthetic Dentistry, 117(6), 721–728. https://doi.org/10.1016/j.prosdent.2016.12.006
23
11. Srinivasan, M., Cantin, Y., Mehl, A., Gjengedal, H., Müller, F., & Schimmel, M. (2016). CAD/CAM milled removable complete dentures: an in vitro evaluation of trueness. Clinical Oral Investigations, 21(6), 2007–2019. doi: 10.1007/s00784-016-1989-7
12. Nash, K. D., & Benting, D. G. (2018). Private Practice of Prosthodontists in the United
States: Results from the 2017 Survey of Prosthodontists and Trends Since 2001. Journal of Prosthodontics, 28(1), 49–63. doi: 10.1111/jopr.12923
13. Saponaro, P. C., Yilmaz, B., Johnston, W., Heshmati, R. H., & McGlumphy, E. A. (2016).
Evaluation of patient experience and satisfaction with CAD-CAM-fabricated complete dentures: A retrospective survey study. The Journal of Prosthetic Dentistry, 116(4), 524–528. https://doi.org/10.1016/j.prosdent.2016.01.034
14. Steinmassl, P.-A., Klaunzer, F., Steinmassl, O., Dumfahrt, H., & Grunert, I. (2017).
Evaluation of currently available CAD/CAM denture systems. The International Journal of Prosthodontics, 30(2), 116–122. https://doi.org/10.11607/ijp.5031
15. Kalberer, N., Mehl, A., Schimmel, M., Müller, F., & Srinivasan, M. (2019). CAD-CAM
milled versus rapidly prototyped (3D-printed) complete dentures: An in vitro evaluation of trueness. The Journal of Prosthetic Dentistry, 121(4), 637–643. https://doi.org/10.1016/j.prosdent.2018.09.001
16. Goodacre, B. J., Goodacre, C. J., Baba, N. Z., & Kattadiyil, M. T. (2016). Comparison of
denture base adaptation between CAD-CAM and conventional fabrication techniques. The Journal of Prosthetic Dentistry, 116(2), 249–256. doi: 10.1016/j.prosdent.2016.02.017
17. Alhelal, A., Alrumaih, H. S., Kattadiyil, M. T., Baba, N. Z., & Goodacre, C. J. (2017).
Comparison of retention between maxillary milled and conventional denture bases: A clinical study. The Journal of Prosthetic Dentistry, 117(2), 233–238. doi: 10.1016/j.prosdent.2016.08.007
18. Schwindling, F. S., & Stober, T. (2016). A comparison of two digital techniques for the
fabrication of complete removable dental prostheses: A pilot clinical study. The Journal of Prosthetic Dentistry, 116(5), 756–763. https://doi.org/10.1016/j.prosdent.2016.03.022
19. Infante, L., Yilmaz, B., McGlumphy, E., & Finger, I. (2014). Fabricating complete dentures
with CAD/CAM technology. The Journal of Prosthetic Dentistry, 111(5), 351–355. https://doi.org/10.1016/j.prosdent.2013.10.014
20. Srinivasan, M., Gjengedal, H., Cattani-Lorente, M., Moussa, M., Durual, S., Schimmel, M.,
& Müller, F. (2018). CAD/CAM milled complete removable dental prostheses: An in vitro evaluation of biocompatibility, mechanical properties, and surface roughness. Dental Materials Journal, 37(4), 526–533. https://doi.org/10.4012/dmj.2017-207
24
21. Al-Fouzan, A. F., Al-Mejrad, L. A., & Albarrag, A. M. (2017). Adherence of Candida to complete denture surfaces in vitro: A comparison of conventional and CAD/CAM complete dentures. The Journal of Advanced Prosthodontics, 9(5), 402–408. https://doi.org/10.4047/jap.2017.9.5.402
22. Ayman, A.-D. (2017). The residual monomer content and mechanical properties of
CAD\CAM resins used in the fabrication of complete dentures as compared to heat cured resins. Electronic Physician, 9(7), 4766–4772. https://doi.org/10.19082/4766
23. Steinmassl, P.-A., Wiedemair, V., Huck, C., Klaunzer, F., Steinmassl, O., Grunert, I., &
Dumfahrt, H. (2016). Do CAD/CAM dentures really release less monomer than conventional dentures? Clinical Oral Investigations, 21(5), 1697–1705. doi: 10.1007/s00784-016-1961-6
24. Wimmer, T., Gallus, K., Eichberger, M., & Stawarczyk, B. (2016). Complete denture
fabrication supported by CAD/CAM. The Journal of Prosthetic Dentistry, 115(5), 541–546. https://doi.org/10.1016/j.prosdent.2015.10.016
25. Kanazawa, M., Inokoshi, M., Minakuchi, S., & Ohbayashi, N. (2011). Trial of a CAD/CAM
system for fabricating complete dentures. Dental Materials Journal, 30(1), 93–96. https://doi.org/10.4012/dmj.2010-112
26. Arora, S., Garg, S., Khindaria, S., & Mittal, S. (2011). Comparative evaluation of linear
dimensional changes of four commercially available heat cure acrylic resins. Contemporary Clinical Dentistry, 2(3), 182. doi: 10.4103/0976-237x.86452
27. Bidra, A. S., Farrell, K., Burnham, D., Dhingra, A., Taylor, T. D., & Kuo, C.-L. (2016).
Prospective cohort pilot study of 2-visit CAD/CAM monolithic complete dentures and implant-retained overdentures: Clinical and patient-centered outcomes. The Journal of Prosthetic Dentistry, 115(5), 578-586.e1. https://doi.org/10.1016/j.prosdent.2015.10.023
28. Saponaro, P. C., Yilmaz, B., Heshmati, R. H., & McGlumphy, E. A. (2016). Clinical
performance of CAD-CAM-fabricated complete dentures: A cross-sectional study. The Journal of Prosthetic Dentistry, 116(3), 431–435. https://doi.org/10.1016/j.prosdent.2016.03.017
29. Kattadiyil, M. T., & AlHelal, A. (2017). An update on computer-engineered complete
dentures: A systematic review on clinical outcomes. The Journal of Prosthetic Dentistry, 117(4), 478–485. https://doi.org/10.1016/j.prosdent.2016.08.017
30. Kattadiyil, M. T., Jekki, R., Goodacre, C. J., & Baba, N. Z. (2015). Comparison of treatment
outcomes in digital and conventional complete removable dental prosthesis fabrications in a predoctoral setting. The Journal of Prosthetic Dentistry, 114(6), 818–825. https://doi.org/10.1016/j.prosdent.2015.08.001
25
31. Fernandez, M. A., Nimmo, A., & Behar-Horenstein, L. S. (2016). Digital Denture Fabrication in Pre- and Postdoctoral Education: A Survey of U.S. Dental Schools. Journal of Prosthodontics : Official Journal of the American College of Prosthodontists, 25(1), 83–90. https://doi.org/10.1111/jopr.12287
32. American Dental Association, Health Policy Institute, 2019 Survey of Dental Practice.
Copyright 2019 American Dental Association. 33. Srinivasan, M., Schimmel, M., Naharro, M., Neill, C. O., Mckenna, G., & Müller, F. (2019).
CAD/CAM milled removable complete dentures: time and cost estimation study. Journal of Dentistry, 80, 75–79. doi: 10.1016/j.jdent.2018.09.003
26
CHAPTER 2: MANUSCRIPT
1. Introduction Patients and dental providers alike are impacted by new dental technologies with respect
to quality, time, and cost of care. Offering increased predictability and efficiency, digital
dentistry has many benefits to traditional workflows, as long as conventional prosthodontic
concepts are maintained and applied. Digitally fabricated dentures, removable complete dentures
created by using computer-aided design and manufacturing processes, have the potential to offer
better patient-centered care with fewer appointments until a final prosthesis is inserted. (1) The
new technology also has the potential to improve removable prosthodontic for underserved
populations within the public health sector due to fewer appointments and the ability to send out
all laboratory work. (2) Multiple educational opportunities to further learning in a dental school
or residency setting are offered by this technology, as well as advancements in research accuracy
and technology. (2)
Clinical benefits of digital dentures include: fewer appointment visits, favorable patient-
centered outcomes, improved material properties retention, biocompatibility, and material
properties, simple reproducibility and digital archiving, and potentially less cost to dental
providers. (3) Likely due to the starting point of the poly(methyl methacrylate) (PMMA) denture
base resin, milled dentures that are cut out of a pre-polymerized puck of PMMA have a more
27
accurate fit than traditionally processed denture bases. (4) Retention has been shown to be
superior in milled denture bases when compared to heat polymerized acrylic bases. (5) When
traditionally processed denture bases have been compared to milled denture bases,
biocompatible properties have been equal while mechanical properties have been superior for
milled bases. (6) Consistency in denture base thickness can be designed and milled exactly
through CAD/CAM systems, allowing for a strong yet comfortable prosthesis. (7) Multiple
material benefits make digitally fabricated dentures a high-quality alternative to traditional
methods of fabrication.
Another factor when deciding on denture fabrication methods centers around the patient
experience. Experienced denture wearers who received a new set of dentures made by digital
fabrication methods have reported high rates of satisfaction with their final removable
prostheses. (8) Clinical advantages and patient satisfaction of milled dentures have demonstrated
that the quality of these prosthesis is equal, if not better than, traditionally fabricated complete
dentures.
While quality is improved, another consideration of implementing digitally fabricated
dentures into practice is time. The number of clinical visits, or chair time, greatly impacts both
operating costs for a dental provider as well as social costs for patients. Patients who must take
time off work, arrange for childcare, or plan for transportation if they are unable to travel on their
own could all benefit from fewer appointments. When surveyed on the digital denture process
with fewer clinical visits, patients respond favorably to decreased treatment time. (9) Digital
denture workflows have been developed to lessen the traditional five-appointment denture
fabrication process into only two clinical visits, at the minimum. In a study testing these claims,
2.39 mean visits were needed until insertion rather than the proposed two, and 2.08 mean post-
28
insertion adjustment visits were made. (10) Allowing for some variance, two or three clinical
visits is a great improvement from a traditional five with respect to both patient and provider
time.
The main consideration many business owners consider when deciding to implement
something new to practice are the costs versus the benefits. A literature review on PubMed, in
the English language, reviewing studies published from 1990 to 2020 revealed very few articles
involving the costs of implementing digitally fabricated denture workflows into practice. One
such study involved a cost minimization analysis for the Clinics of Dental Medicine at the
University of Geneva and found that over 145,000 Swiss francs (about $150,000) could be saved
over 10 years if digital dentures were implemented in pre-doctoral clinics. (11) While it is
reassuring to assume that costs to a provider can be lowered while implementing more efficient
digital technology, there is no evidence to currently support this claim.
Currently, no literature could be found on clinician implementation of digitally fabricated
dentures, private practice provider perspectives, or costs associated with this technology. The
current provider interest and implementation of the technique warranted assessment. As dentists
have a unique perspective on patient care, business expenses, and personal practice, their
opinions and experiences are valuable in assessing the implementation of a new dental
technology. The overall objective of this study is to explore the current perspectives of
prosthodontists on implementing digitally fabricated dentures into clinical practice and perceived
costs and benefits associated with this technology.
29
2. Materials and Methods
This study design was cross-sectional in nature and implemented to test the hypothesis:
compared to traditional dentures, providing digitally fabricated dentures saves provider time,
which equates to overhead cost savings and the ability to treat more patients with more chair
time available. The focus of this survey was the perceptions of clinicians on their current usage
of digital dentures in practice.
The research protocol received approval for exemption by the Institutional Review Board
at the University of North Carolina at Chapel Hill (IRB# 18-2926)
A survey was created and pilot-tested by Graduate Prosthodontic residents and faculty at
the University of North Carolina at Chapel Hill Adams School of Dentistry. The results of the
pilot test helped improve question clarity and determine response time.
The inclusion and exclusion criteria for survey participation were decided. Inclusion
criteria include prosthodontists and general dentists who treat patients with complete dentures.
Exclusion criteria include other dental specialists or general dentists who do not provide
complete dentures as a treatment. The appendix shows the survey instrument, consisting of 13
questions about current practices and experiences with digital dentures as well as 7
demographics questions about study participants with write-in response prompts for any
additional opinions the respondent was able to provide.
This survey was distributed to the membership of the North Carolina Dental Society
(NCDS) and the American College of Prosthodontics (ACP) with the aim of providing the
current status of digital denture implementation in practice and trends among an educated and
experienced body of clinicians. An email was sent to 5,199 members of the NCDS and 1,820
members of the ACP inviting them to participate in a 20-question online survey.
30
Informed consent was obtained in the email invitation for the Qualtrics® survey and
participation was voluntary.
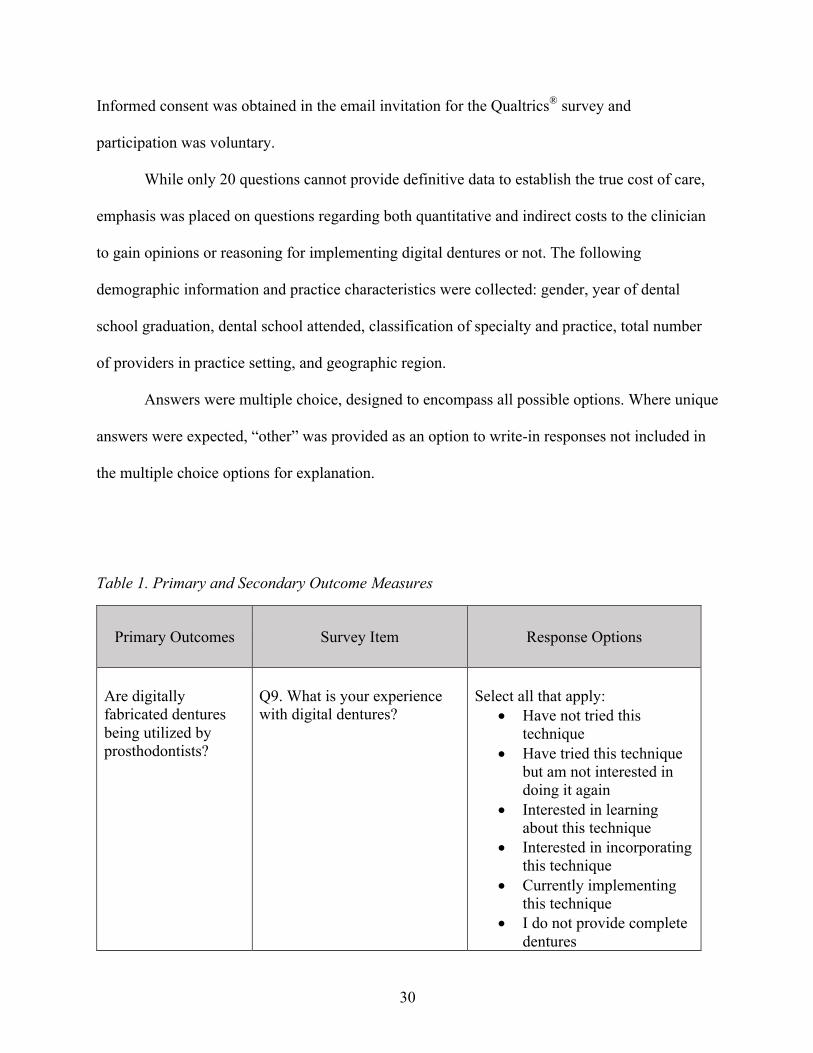
While only 20 questions cannot provide definitive data to establish the true cost of care,
emphasis was placed on questions regarding both quantitative and indirect costs to the clinician
to gain opinions or reasoning for implementing digital dentures or not. The following
demographic information and practice characteristics were collected: gender, year of dental
school graduation, dental school attended, classification of specialty and practice, total number
of providers in practice setting, and geographic region.
Answers were multiple choice, designed to encompass all possible options. Where unique
answers were expected, “other” was provided as an option to write-in responses not included in
the multiple choice options for explanation.
Table 1. Primary and Secondary Outcome Measures
Primary Outcomes Survey Item Response Options
Are digitally fabricated dentures being utilized by prosthodontists?
Q9. What is your experience with digital dentures?
Select all that apply:
• Have not tried this technique
• Have tried this technique but am not interested in doing it again
• Interested in learning about this technique
• Interested in incorporating this technique
• Currently implementing this technique
• I do not provide complete dentures
31
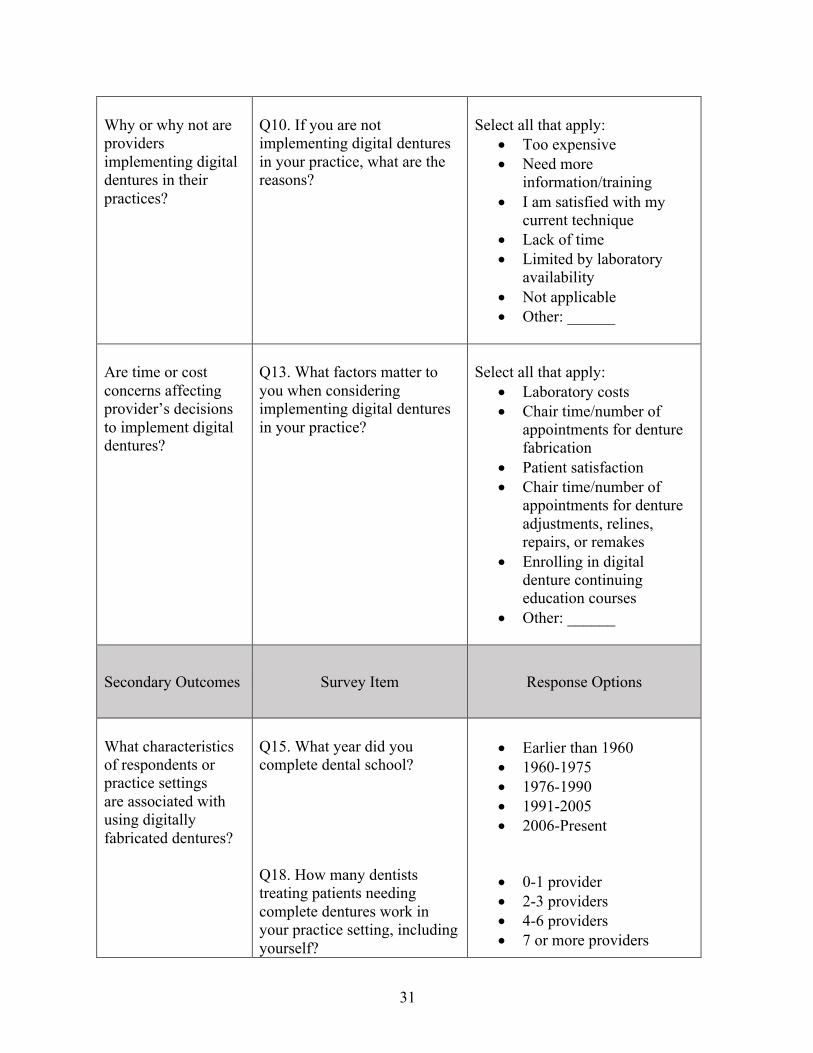
Why or why not are providers implementing digital dentures in their practices?
Q10. If you are not implementing digital dentures in your practice, what are the reasons?
Select all that apply:
• Too expensive • Need more
information/training • I am satisfied with my
current technique • Lack of time • Limited by laboratory
availability • Not applicable • Other: ______
Are time or cost concerns affecting provider’s decisions to implement digital dentures?
Q13. What factors matter to you when considering implementing digital dentures in your practice?
Select all that apply:
• Laboratory costs • Chair time/number of
appointments for denture fabrication
• Patient satisfaction • Chair time/number of
appointments for denture adjustments, relines, repairs, or remakes
• Enrolling in digital denture continuing education courses
• Other: ______
Secondary Outcomes Survey Item Response Options
What characteristics of respondents or practice settings are associated with using digitally fabricated dentures?
Q15. What year did you complete dental school? Q18. How many dentists treating patients needing complete dentures work in your practice setting, including yourself?
• Earlier than 1960 • 1960-1975 • 1976-1990 • 1991-2005 • 2006-Present
• 0-1 provider • 2-3 providers • 4-6 providers • 7 or more providers
32
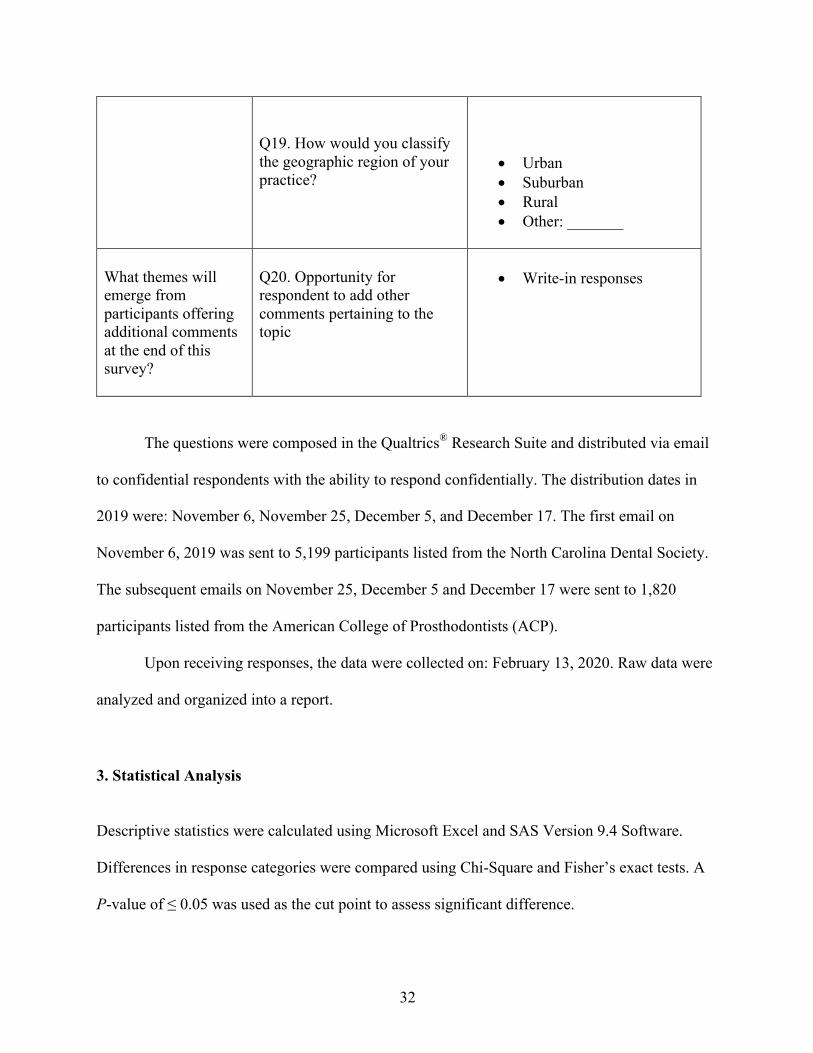
Q19. How would you classify the geographic region of your practice?
• Urban • Suburban • Rural • Other: _______
What themes will emerge from participants offering additional comments at the end of this survey?
Q20. Opportunity for respondent to add other comments pertaining to the topic
• Write-in responses
The questions were composed in the Qualtrics® Research Suite and distributed via email
to confidential respondents with the ability to respond confidentially. The distribution dates in
2019 were: November 6, November 25, December 5, and December 17. The first email on
November 6, 2019 was sent to 5,199 participants listed from the North Carolina Dental Society.
The subsequent emails on November 25, December 5 and December 17 were sent to 1,820
participants listed from the American College of Prosthodontists (ACP).
Upon receiving responses, the data were collected on: February 13, 2020. Raw data were
analyzed and organized into a report.
3. Statistical Analysis Descriptive statistics were calculated using Microsoft Excel and SAS Version 9.4 Software.
Differences in response categories were compared using Chi-Square and Fisher’s exact tests. A
P-value of ≤ 0.05 was used as the cut point to assess significant difference.
33
4. Results 4a. Response Rates
The same survey was sent to both study populations but with different response rates. Of
the 5,199 members of the North Carolina Dental Society (NCDS) sent the survey once, the
response rate was 2.5% (N=129).
Of the 1,820 members of the American College of Prosthodontics (ACP) sent the survey
with two follow-up electronic mailings, the response rate was 16.8% (N=305).
4b. Characteristics of Prosthodontic Participants
The demographics of prosthodontic respondents indicated the majority were male (78%,
n=231) compared to female (22%, n=65). When asked when they completed dental school, the
fewest respondents graduated before 1975 (5.3%, n=16), most graduated between 1976 and 1990
(37.9%, n=114), fewer between 1991 and 2005 (30.9%, n=93), and less from 2006 to the present
day (25.9%, n=78).
4c. Characteristics of Prosthodontic Practices
Of all prosthodontists, the largest percentages (38.5%, n=115 and 33.4%, n=100) work
with 0-1 or 2-3 other dental providers who also treat patients with complete dentures,
respectively, with the remainder in larger group practices. For the geographic region
classification of the practice setting, the greatest number of respondents reported working in an
34
urban geographic setting (48.2%, n=144) compared to suburban (43.5%, n=130) or rural (6.0%,
n=18).
4d. Univariate Analyses
Questions about their provision of denture care did not specify whether the denture was
fabricated in the traditional way or using digital denture technology. When asked to estimate the
number of complete denture patients they treat each month, 39.5% of participants (n=120)
responded 2-4 patients a month and 43.1% (n=131) treated 5 or more per month (Table 9). If a
prosthodontist in private practice is accepting 15 new patients a month, complete denture patients
would make up a large portion of these patients.
Excluding post-insertion adjustments, the majority of prosthodontists (54.2%, n=163)
usually take five or more clinical appointments to fabricate a complete denture (Table 3). When
asked the average length of denture fabrication appointments, the majority of participants
reported 1 hour each visit (53.1%, n=113) (Table 10). This number of visits and average length
of appointments is consistent with our time and cost estimations.
When considering denture adjustments in the first-year post-insertion of a new complete
denture (Table 5), most respondents reported 2-3 visits (75.5%, n = 228). These findings are
consistent with previously published studies (Bidra, Kattadiyil).
To draw a comparison between a variable laboratory cost of digital dentures being $200
more than a traditional denture laboratory cost, participants were asked how many hours of chair
time they suspect they would need to save in order to offset the cost. Responses were mixed.
Most participants (35.5%, n=93) noted about 1 hour of chair time would need to be saved in the
denture fabrication process for an increase of $200 in the laboratory fees to be worth it to the
35
provider. The next most common response was 2-3 hours of chair time (31.7%, n=83) followed
by respondents (27.9%, n=73) who reported chair time does not matter to them when considering
the increase in laboratory cost. Finally, very few (5.0%, n=13) reported that 4 or more hours of
chair time would be worth the increased costs.
4e. Bivariate Analyses Responses about provision of dentures were analyzed by provider characteristics to
understand the implementation and scope of digitally fabricated denture use. Overall, only 37.7%
of prosthodontists reported that they have not tried digital dentures (Table 38). Of all
prosthodontists that responded, 12.7% have tried digital dentures but are not interested in using
them again (Table 39). Whether or not they have tried them before, 36.6% are interested in
learning and/or incorporating digital denture techniques (Table 40). When asked about their
experience with digital dentures, 31.5% responded that they are currently implementing digital
denture techniques (Table 41).
4e1. Gender
There were several areas of similarity or agreement among female and male
prosthodontists. As seen in Table 14, the majority of female and male respondents both treat 2-4
complete denture patients per month. Both genders usually use five or more appointments to
fabricate a complete denture (Table 18). The majority of both females and males also reported
the average length of each appointment to fabricate and insert a complete denture is typically 1
hour (Table 22). There were no statistically significant differences in these characteristics by
36
gender. There were also subtle differences that were not statistically significant but may be
clinically meaningful. There were some differences between fees charged per denture arch. The
majority of female respondents (34.4%, n=21) charged $1,000-1,999 per arch while the majority
of males (34.7%, n=79) charged $2,000-2,999 per arch (Table 26).
4e2. Dental School Graduation Year When considering the year of graduation from dental school, comparisons were also
made to examine if years of experience as a dentist may impact clinical practices related to
complete dentures. When asked how many complete denture patients the prosthodontist treats in
a normal month, the majority of respondents from all graduation year groups reported 2-4
patients a month (Table 15). The majority responded that 5 or more appointments were used to
fabricate and insert a complete denture (Table 19). Most respondents in each era also reported
that the average length of each denture visit was one hour (Table 23), except graduates between
1991-2005 that reported 30 minutes or less were spent each visit. The fees that different era
graduates charge for a complete denture arch also varied. The group that graduated before 1975
charge $1,000-1,999, while the 1976-1990, 1991-2005, and 2006-Present groups charge $2,000-
2,999 (Table 27). None of these comparisons by graduation era were statistically significant.
37
4e3. Number of Providers in Practice Setting Treating Complete Denture Patients The number of providers in the practice setting was another question asked. Many of the
same general responses hold true when this variable is compared with key questions about
denture fabrication. The average length of complete denture appointments was reported at 1 hour
each for all practice settings with more than 3 providers (Table 24), but split between 1 hour long
and 30 minutes long for practices working solo or with only 1 other provider. The results for this
comparison are statistically significant (p < 0.05) with larger group practices of 7 or more
providers taking more time per appointment. The fee charged for one complete denture arch also
differs by the number of providers in a practice setting. In practices settings with 1 or 2 total
providers and in those with 2-3 additional providers, the fee charged is $2,000-2,999. In practices
with 4-6 additional providers or 7 or more providers, the most prevalent fees drop to $1,000-
1,999 per arch (Table 27). The results for this comparison are statistically significant (p < 0.05)
with larger practices charging less per arch.
4e4. Geographic classification The final demographic variable explored was geographic classification of the practice
setting. The majority of practices in rural, suburban, and urban settings all reported an average of
2-4 complete denture patients each month (Table 17). Rural respondents had a distribution of
responses different from other practice settings for both the usual number and average length of
denture appointments. All other settings reported 5 or more appointments to make a complete
denture while rural practices reported 4 appointments (Table 21). Most settings also reported the
average length of denture visits to be 1 hour each appointment, but rural was split between 30
38
minutes and 1 hour for the length of the average visit (Table 25). The fee charged per complete
denture arch also displayed variance. The majority of urban and rural respondents reported
charging $1,000-1,999 per arch (Table 29). The majority of suburban respondents reported
charging $2,000-2,999. Geographic region could potentially impact dental laboratory support
that is available. The majority of participants practicing in rural and suburban settings reported
that their normal dental laboratory did not offer digital dentures (Table 33). However, the
majority of urban participants reported their dental laboratories did offer digital dentures. None
of these differences were statistically significant.
4f. Bivariate Analyses 4f1. Experience with digitally fabricated dentures When asked “what is your experience with digital dentures?”, participants were asked to
“select all that apply.” This yielded results that could be compared per selection using bivariate
analyses. The majority of participants who graduated from dental school earlier than 1975
(53.3% n=8) indicated that they have not tried digital dentures yet (Table 38). The greatest
interest in learning about the technique and incorporating the technique were from the more
recent graduates: 43.2% (n=32) of 2006-Present graduates, 42.7% (n=35) of 1991-2005
graduates, 31.4% (n=33) of 1976-1990 graduates, and only 6.7% (n=1) from the earliest group
graduating before 1975 (Table 40). The same trend was seen with those who selected that they
are currently implementing the digital denture techniques: 32.9% (n=27) from the 1991-2005
group, 32.4% (n=24) from the 2006-Present group, 31.4% (n=33) from the 1976-1990 group and
20.0% (n=3) from the earliest group before 1975 (Table 41). None of these results were
statistically significant.
39
When comparing these responses by gender, similar results were shown. A slightly
greater percent of females (44.8% n=26) than males (35.7% n=76) reporting having not yet tried
the technique of digital dentures (Table 46). Nearly the same percentage of females and males
selected that they were either interested in learning about the technique or incorporating the
technique (Table 48). For those who indicated that they were currently implementing this
technique, 22.4% (n=13) of females and 34.3% (n=73) of males, were not in the majority for
either gender (Table 49). None of these results were statistically significant.
Specifically focusing on those who report that they currently implement digital denture
technology, it is not surprising that 62.8% of those whose usual dental laboratory offers digital
dentures indicate that they are currently implementing the technology (Table 63). It is surprising,
however, that more participants who indicated their usual laboratory does not offer digital
dentures did not also indicate they have not tried the newer technology (Table 60). It is unknown
if they have used a digital denture-specific company rather than a local laboratory. The results
for both of these comparisons were statistically significant (p < 0.05) with those who are
currently implementing this technique compared to whether or not the dental laboratory offers
the technology. Of those currently implementing digital dentures, most charge anywhere from
$1,000 to $3,000 or more per complete denture arch (Table 88).
Questions were developed to evaluate characteristics of those already adopting digital
denture technology. Of those who are currently implementing digital dentures in their practice, it
is a similar percentage of those who spend only 30 minutes or less per complete denture
appointment and those who spend 2 hours or more per visit (Table 45). When compared to the
distribution of number of providers in the practice setting, the largest set of those who currently
40
offer digital dentures are practices with 7 or more providers (Table 67). None of these results by
number of providers were statistically significant.
4f2. Factors that matter when considering implementing digitally fabricated dentures
Another comparison sought any relationship between the number of complete denture
patients treated in a normal month versus the factors that matter to a provider when considering
implementing digital dentures in their practice. Almost all groups (treating less than one
complete denture patient a month up to 5-10 a month) had a majority (55.8%) respond that
laboratory costs were a factor when considering using digital denture technology (Table 50). The
majority (72.1%) responded that chair time for denture fabrication and post-insertion
adjustments, relines, repairs, or remakes were a concern regardless of number of denture patients
seen per month (Table 51). Patient satisfaction also seems to be important with affirmative
responses (81.9% total) from all groups (Table 52). None of these results by number of patients
per month were statistically significant. Enrolling in digital denture continuing education courses
had large majorities that did not select this option as a factor when considering implementing
digital dentures (Table 53). The results for this comparison were statistically significant (p <
0.05) with providers seeing any number of complete denture patients per month compared to not
selecting continuing education courses as a factor that matters when considering implementing
digital denture technology.
To see if any association exists between how much is charged per denture arch and
factors that matter when a provider considers implementing digital dentures, a bivariate analysis
was completed. The majority of each group responded affirmatively that chair time for denture
fabrication or post-insertion adjustments, relines, repairs, or remakes mattered to them (Table
41
56). Patient satisfaction also mattered to the majority of all groups (Table 57). None of these
results by amount charged per denture arch were statistically significant.
4f3. Reasons why digitally fabricated dentures are not used in practice
In order to investigate some of the reasons providers are not using digital dentures in
practice, bivariate comparisons with those who have not tried the technique were made. The
majority of those who indicated they need more information or training on digital dentures and
those who are satisfied with their current technique, have not tried the technique (Tables 69, 70).
The majority who said they would need more information or training also indicated that they
were interested in learning about or incorporating the technique (Table 77). The majority who
are satisfied with their current technique did not indicate they were interested in learning about
digital denture techniques (Table 78). These findings are not surprising and could help to identify
providers who are interested or may benefit from digital dentures in practice.
The majority of respondents indicated chair time, both for the appointments for denture
fabrication and post-insertion adjustments, matters as a factor when considering implementing
digital dentures. The majority who think chair time matters also indicate that they need more
information or training when choosing reasons why they have not implemented digital dentures
(Table 89). The majority, 66%, of prosthodontists indicated that anywhere from 1-3 hours of
chair time would need to be saved in order to offset an increased laboratory cost of $200 for a
digitally fabricated denture vs. a conventional denture (Table 59).
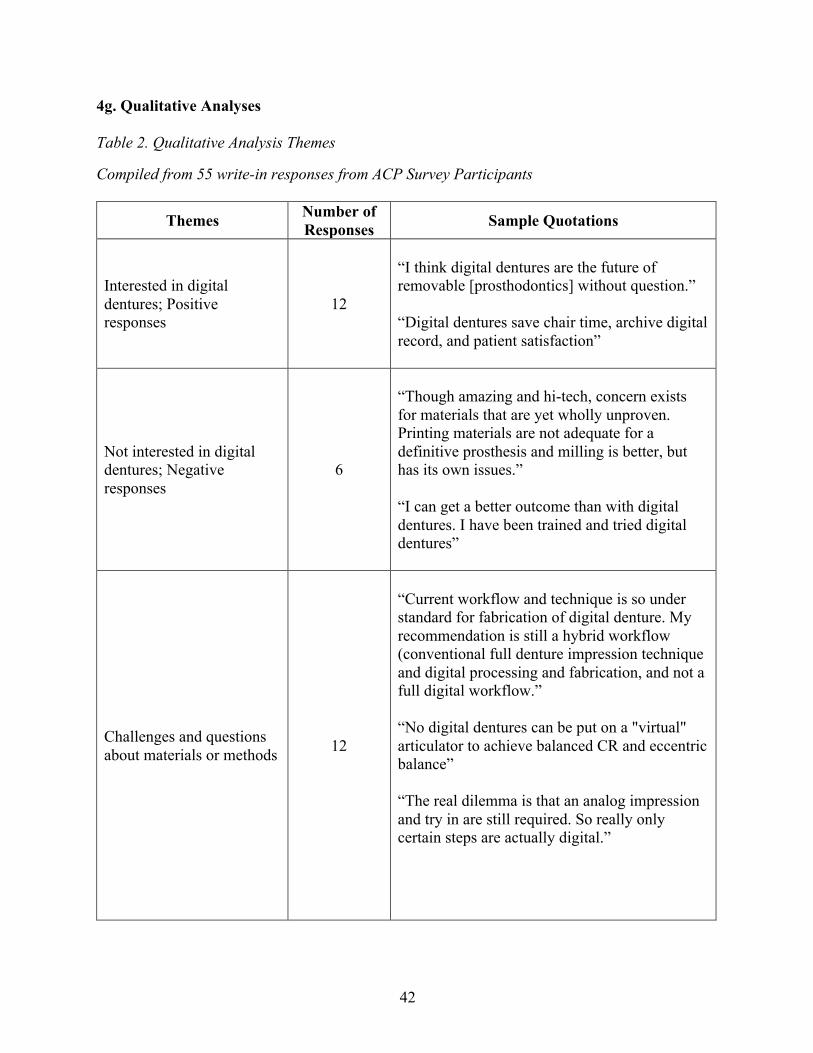
42
4g. Qualitative Analyses Table 2. Qualitative Analysis Themes
Compiled from 55 write-in responses from ACP Survey Participants
Themes Number of Responses Sample Quotations
Interested in digital dentures; Positive responses
12
“I think digital dentures are the future of removable [prosthodontics] without question.” “Digital dentures save chair time, archive digital record, and patient satisfaction”
Not interested in digital dentures; Negative responses
6
“Though amazing and hi-tech, concern exists for materials that are yet wholly unproven. Printing materials are not adequate for a definitive prosthesis and milling is better, but has its own issues.”
“I can get a better outcome than with digital dentures. I have been trained and tried digital dentures”
Challenges and questions about materials or methods 12
“Current workflow and technique is so under standard for fabrication of digital denture. My recommendation is still a hybrid workflow (conventional full denture impression technique and digital processing and fabrication, and not a full digital workflow.” “No digital dentures can be put on a "virtual" articulator to achieve balanced CR and eccentric balance” “The real dilemma is that an analog impression and try in are still required. So really only certain steps are actually digital.”
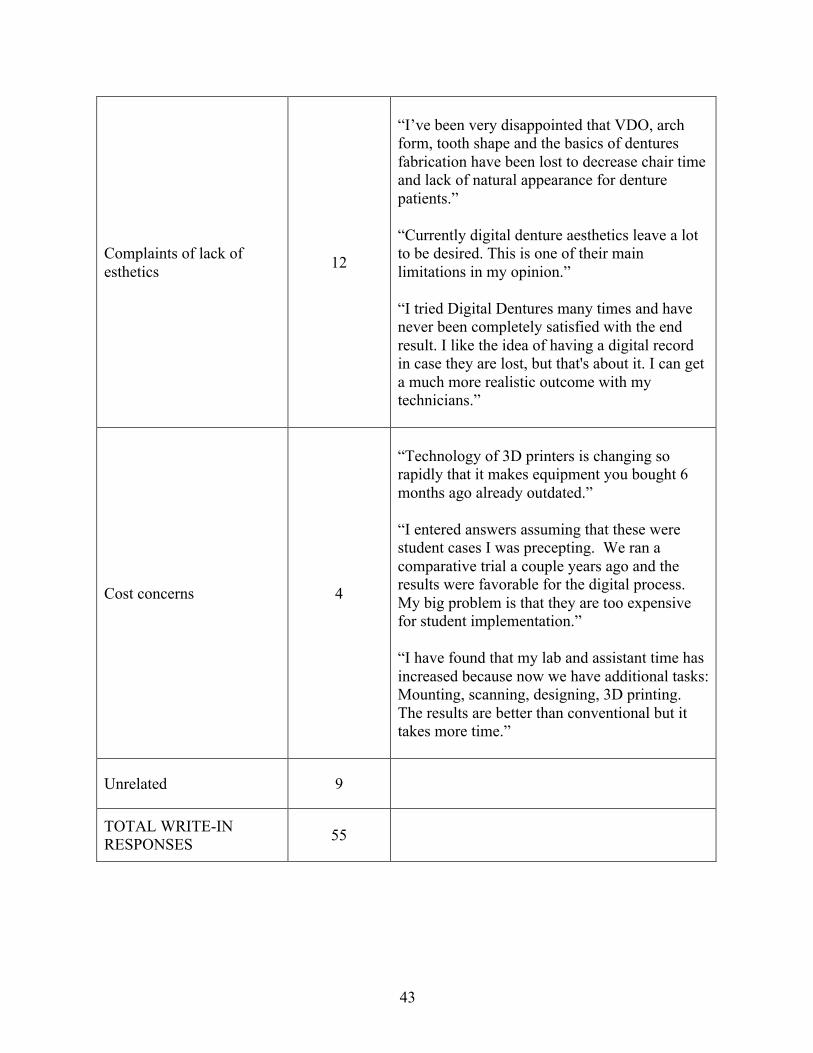
43
Complaints of lack of esthetics 12
“I’ve been very disappointed that VDO, arch form, tooth shape and the basics of dentures fabrication have been lost to decrease chair time and lack of natural appearance for denture patients.” “Currently digital denture aesthetics leave a lot to be desired. This is one of their main limitations in my opinion.” “I tried Digital Dentures many times and have never been completely satisfied with the end result. I like the idea of having a digital record in case they are lost, but that's about it. I can get a much more realistic outcome with my technicians.”
Cost concerns 4
“Technology of 3D printers is changing so rapidly that it makes equipment you bought 6 months ago already outdated.” “I entered answers assuming that these were student cases I was precepting. We ran a comparative trial a couple years ago and the results were favorable for the digital process. My big problem is that they are too expensive for student implementation.” “I have found that my lab and assistant time has increased because now we have additional tasks: Mounting, scanning, designing, 3D printing. The results are better than conventional but it takes more time.”
Unrelated 9
TOTAL WRITE-IN RESPONSES 55
44
Five major themes emerged when 55 write-in responses from ACP participants were
analyzed for categorization. Qualitative analysis revealed that some providers either are already
implementing digital dentures in practice or would like to incorporate them. These providers see
digital denture technology improving prosthodontics in the future and have benefits, including
educational opportunities, ease of methods for inexperienced dentists, saving chair time, and, the
most frequently mentioned benefit of easy reproducibility.
Another segment of write-in comments indicated that digital dentures are not yet ready
for widespread implementation and these responses held negativity toward the technology. Most
common was the mention that the provider’s current methods of complete denture fabrication
were efficient for them and they saw no need to change their methods, especially for a
technology that is in its infancy with little literature supporting benefits. Other mentions included
the lack of laboratory support to implement digital dentures in their area and not enough
scientific literature to convince them to attempt the workflows.
One theme that emerged included the challenges associated with incorporating new
methods and materials. Providers in this category offered their opinions on the various
challenges that arise with digital dentures, notably from personal experience with the technology.
These valuable insights demonstrate what providers are considering when implementing this
technology in practice. Further organized into categories, these concerns include: workflow
challenges, equipment expenses and frequent replacement, occlusion, logistics in private
practice.
Among prosthodontists, esthetics of digitally fabricated dentures was a large concern.
Overwhelmingly, these responses all indicate that these providers have tried digital dentures and
are not pleased with the esthetics of the wax try-in stage or the final prostheses. Several
45
providers focused on the cost of digital dentures being too high or the time learning the digital
workflow efficiently being too great. Other mentions included the cost of scanners or lab
equipment to implement the workflow in the office to be too great. Another response indicated
the cost is currently too great to implement in a dental school clinic setting. Overall, these write-
in comments were informative and complimentary to the survey data, helping make sense of the
themes.
Overall, write-in responses showed that prosthodontists are mixed on both positive and
negative comments regarding digitally fabricated dentures. While about a third of participants
who chose to write in additional information are confident in the improvements the digital
workflow can make for providers, patients, and the profession, the majority are wary of the new
technology’s lack of scientific literature, suboptimal esthetic outcomes, and overall workflow
logistics and costs. Many agree that laboratory costs (55.8%) (Table 50), total chair time for
complete denture appointments and post-insertion adjustments (72.1%) (Table 51), and patient
satisfaction (81.9%) (Table 52) are important factors in considering using digital denture
workflows. It seems that prosthodontists are rightfully critical of this new technology and
continue to question how digitally fabricated dentures might perform relative to a high treatment
standard.
5. Discussion Literature regarding the implementation of digitally fabricated dentures and the costs
associated is sparse and very few studies have sought the clinician’s perspectives in the
incorporation of this technology into practice and business. While many comparative statistics
completed in this study did not yield statistically significant results, some responses indicated the
46
need for further investigation and consideration of responses can still yield recommendations for
clinical practice.
Determining if this study has results that are generalizable to prosthodontists, we
compared basic demographics to another survey of ACP prosthodontists completed in 2017. In
the ACP-conducted survey, the response rate was 17.4% (N=659) with ours being 16.8%
(N=305). The ACP survey showed 21.7% of respondents were female, averaging 43.6 years old
and 78.3% were male, averaging 53.3 years old. Our gender demographic was almost identical
with 22% female and 78% male participants. The other demographic in common, the year
graduated from dental school, showed similarities. Our survey showed about 5% graduated
earlier than 1975 while the ACP-conducted survey showed 17% earlier than about 1977. For the
range of 1976-1990, our results showed 38% while the ACP-conducted results show 23% from
1977 and 1987. We had 31% from 1991-2005 while the ACP-conducted survey had 40% from
1987-2007. The most recent graduates from about 2006 to present day made up 26% of our
responses and about 20% of the ACP-conducted survey. It is evidenced by these close
similarities that our survey is at least comparable to responses from a similar survey of American
College of Prosthodontics member prosthodontists. (12)
Responses that support current published literature included basic workflows of complete
dentures also indicate the results could be meaningful. The majority of prosthodontists take five
or more clinical appointments to fabricate a complete denture, responded that these visits each
take about 1 hour, and reported, on average, 2-3 post-insertion adjustment visits in the first year.
This is consistent with information from other studies by both Bidra and Kattadiyil. (9)(13)
Other supportive findings were about esthetics. At least 12 prosthodontists chose to write-in
additional complaints regarding dissatisfaction with esthetics of digital dentures. This supports
47
other studies, one of which found the most common complications of digital dentures to include
patient dissatisfaction with fit or esthetics, lack of retention, and esthetic issues. (14) These
supportive results are reassuring and could encourage future surveys comparing specific digital
workflows and methods.
As the results appear generalizable for prosthodontists, several comparisons found to be
statistically significant should be discussed. Group practices with more than 3 providers treating
complete denture patients reported longer average denture appointments than practices with only
1 or 2 providers (Table 24). Of all responses, 52.9% indicated each visit for a complete denture
is, on average, one hour (Table 24). With the workflows unknown, there could be opportunities
for group practices to increase efficiency in complete denture visits. Larger practices of 4 or
more providers also reported charging lower fees for complete dentures (Table 28). This could
illustrate differences in fee schedules when multiple dentists are able to share the load of
overhead, indicate differences if group practices are employee-owned or corporate offices, or
could indicate differences in price due to provider competition with surrounding offices. Finally,
when considering factors that mattered to providers when considering implementing digital
denture technology into practice, digital denture continuing education courses were not a factor,
no matter how many complete denture patients they treat per month (Table 53). This result could
indicate that prosthodontists are confident self-learning digital denture technology and
workflows. Result distributions with possible relationships indicates that we have some
meaningful results that could answer questions posed regarding the adoption of digital denture
technology.
Several primary outcome variables were investigated and may now be analyzed more
closely. Firstly, digitally fabricated dentures are currently being utilized by 31.5% of
48
prosthodontists and have been tried by others, but these numbers do not indicate the widespread
adoption we might expect from a newer technology meant to increase efficiency. Second, there
seem to be good reasons why providers have not implemented the technique or have stopped
using them, as indicated in write-in responses. Providers seem to be actively considering what is
preventing them from implementing digital dentures. This demonstrates both awareness of and
critical consideration of this new technology. Thirdly, time and cost concerns might be affecting
provider’s decisions to implement digital dentures. The majority agree that laboratory costs, total
chair time for complete denture appointments and post-insertion adjustments, and patient
satisfaction are the most important factors in considering using digital denture workflows. These
findings support our predictions that time, cost, and quality are the most important factors in the
adoption of a newer dental technology and help to answer the questions posed at the beginning of
this project.
Secondary outcome variables may also initiate further discussion around provider
perspectives on adoption of digital denture technology. When looking at populations most
involved in digital dentures, it was not surprising that providers who graduated most recently
from dental school were most eager to learn about and implement digital dentures in their
practice or are already doing so. Having laboratory support offering digital denture technology
could also be an important factor, if a provider is unable to establish a relationship or pay
additional costs to a dedicated digital denture company. The last outcome variable considered,
accessory information from optional write-in responses yielded the most common single
complaint to be inadequate esthetics, while many interesting opinions were shared, some
supportive of digital denture technology and some critical of the methods. These secondary
49
variables gave context to other responses as well as informed future study ideas that may
investigate challenges in digital denture implementation.
Discussing other noticeable responses that were surprising could indicate gaps in the
knowledge of digital denture adoption. It is clear that many prosthodontists are already educated
in these new technological advances, their potential benefits, and their shortcomings. As digital
denture companies have been in the prosthetic market for over 8 years and open sourcing and
dental laboratories have been available for the past 3 years, the gaps in digital denture uptake
should be investigated. While digital fabrication technologies for fixed prosthetic restorations
have already taken over a majority of the market, digital dentures have not followed. Identifying
the factors that are impeding the growth of this newer, yet possibly more efficient technology,
could be interesting for providers, educators, and laboratories alike. When only considering
prosthodontists perspectives, as in this study, considerations for patient care, treatment quality,
and practice efficiency were investigated. Many respondents suggested that more information or
training on digital denture methods and a better-substantiated workflow is necessary to
encourage their adoption of the technology. Perhaps streamlined digital learning tools, available
to providers directly as well as their local dental laboratories, could help them to establish a
workflow that saves time and costs without sacrificing patient satisfaction and esthetics.
While a complete cost and benefit analysis of digital dentures would be difficult, some
conclusions can be drawn from the data in this survey. From a survey on ACP prosthodontists in
2017, complete dentures were reported as the fifth most frequent procedure – estimated at taking
up a mean of 12.3% of all procedure time for a prosthodontist. The percent revenue was 12.2%
compared to 12.3% of time taken. (12) This indicates that complete dentures workflows that may
increase efficiency could increase the difference between revenue and the costs of chair time
50
while the total time spent on the procedure is decreased. In our study, most prosthodontists chose
either 1 hour or 2 to 3 hours as the overall chair time they would need to save in order to offset
an increased laboratory cost of $200 for a digitally fabricated denture versus a conventional
denture. This question aimed to explore what costs providers might associate to their clinical
time, which is critical to balancing overhead fees with profit in a private practice. It seems like
the rough estimate of $280 per hour of chair time as overhead, our rudimentary estimate using
ADA Health Policy Institute average yearly expenses, might be consistent with this response
(Figures 4, 5, and 6). (15) By examining perspectives on time and cost that these prosthodontic
participants held, it could be appreciated some of what matters when considering changes to
current methods and systems.
There were several limitations of note in this study. The response rate for the NCDS
survey was too low and thus not representative; therefore, statistical analysis was not completed
for responses from general dentists. Comparing responses from general dentists and specialists in
prosthodontics could indicate where in the dental market digital denture technology is being
utilized the most. Including non-specialists could make findings more meaningful for the general
dental community. The response rate of 16.8% for an optional electronic survey distributed via
four separate email distributions could be improved. Health professionals tend to respond to
surveys at lower rates than the general public, which makes organizational research more
difficult. (16) This low overall sample size (N=305) could also indicate a low statistical power,
which could indicate a Type II error in statistical analysis. A larger sample size could improve
the possibility of finding statistical significance if it existed. As is typical with optional electronic
surveys and no incentive for completion, responses could also be biased by participants who are
either engaged in or strongly opposed to a survey topic. These limitations can encourage us to
51
expand the study design with more focused surveys to various providers to gain a wider and
more meaningful scope of understanding about digitally fabricated dentures and their
implementation.
6. Conclusion
Within the limitations of this study the following conclusions were drawn:
• 31.5% of prosthodontists are currently implementing digital denture techniques in
practice. 36.6% are interested in learning and/or incorporating digital denture technology.
37.7% report they have not tried digital dentures and only 12.7% indicate that they have
tried digital dentures but are not interested in using them again.
• Prosthodontists currently implementing digital dentures tend to be those who graduated
dental school after the year 1991 and those most interested in learning about and
incorporating these newer technologies graduated after 2006.
• Some disadvantages of digitally fabricated dentures were reported. The main complaint
appeared to be that the digitally fabricated dentures are not as esthetic compared to
conventionally fabricated dentures. Other complaints provided were logistics with the
workflow, the inability to treat complex patients, occlusion, and costs of technology.
• When considering various factors of digitally fabricated denture adoption, 55.8% of
providers agree that laboratory costs, 72.1% indicate chair time, and 81.9% select patient
satisfaction, are important considerations when implementing this new technology in
their practice setting.
•
52
REFERENCES 1. The Glossary of Prosthodontic Terms. (2017). The Journal of Prosthetic Dentistry, 117(5).
doi: 10.1016/j.prosdent.2016.12.001
2. Bidra, A. S., Taylor, T. D., & Agar, J. R. (2013). Computer-aided technology for fabricating complete dentures: systematic review of historical background, current status, and future perspectives. The Journal of Prosthetic Dentistry, 109(6), 361–366. https://doi.org/10.1016/S0022-3913(13)60318-2
3. Janeva, N. M., Kovacevska, G., Elencevski, S., Panchevska, S., Mijoska, A., & Lazarevska,
B. (2018). Advantages of CAD/CAM versus Conventional Complete Dentures - A Review. Open Access Macedonian Journal of Medical Sciences, 6(8), 1498–1502. https://doi.org/10.3889/oamjms.2018.308
4. Brian J. Goodacre, DDS,a Charles J. Goodacre, DDS, MSD,b Nadim Z. Baba, DMD, MSD,
and Mathew T. Kattadiyil, DDS, MDS, MSd (August 2016) Comparison of denture base adaptation between CAD-CAM and conventional fabrication techniques. J Prosthetic Dentistry Volume 116 Issue 2: 248-256.
5. Alhelal, A., Alrumaih, H. S., Kattadiyil, M. T., Baba, N. Z., & Goodacre, C. J. (2017).
Comparison of retention between maxillary milled and conventional denture bases: A clinical study. The Journal of Prosthetic Dentistry, 117(2), 233–238. doi: 10.1016/j.prosdent.2016.08.00
6. Srinivasan, M., Gjengedal, H., Cattani-Lorente, M., Moussa, M., Durual, S., Schimmel, M.,
& Müller, F. (2018). CAD/CAM milled complete removable dental prostheses: An in vitro evaluation of biocompatibility, mechanical properties, and surface roughness. Dental Materials Journal, 37(4), 526–533. https://doi.org/10.4012/dmj.2017-207
7. Wimmer, T., Gallus, K., Eichberger, M., & Stawarczyk, B. (2016). Complete denture
fabrication supported by CAD/CAM. The Journal of Prosthetic Dentistry, 115(5), 541–546. https://doi.org/10.1016/j.prosdent.2015.10.016
8. Saponaro, P. C., Yilmaz, B., Johnston, W., Heshmati, R. H., & McGlumphy, E. A. (2016).
Evaluation of patient experience and satisfaction with CAD-CAM-fabricated complete dentures: A retrospective survey study. The Journal of Prosthetic Dentistry, 116(4), 524–528. https://doi.org/10.1016/j.prosdent.2016.01.034
9. Bidra, A. S., Farrell, K., Burnham, D., Dhingra, A., Taylor, T. D., & Kuo, C.-L. (2016).
Prospective cohort pilot study of 2-visit CAD/CAM monolithic complete dentures and implant-retained overdentures: Clinical and patient-centered outcomes. The Journal of Prosthetic Dentistry, 115(5), 578-586.e1. https://doi.org/10.1016/j.prosdent.2015.10.023
53
10. Saponaro, P. C., Yilmaz, B., Heshmati, R. H., & McGlumphy, E. A. (2016). Clinical performance of CAD-CAM-fabricated complete dentures: A cross-sectional study. The Journal of Prosthetic Dentistry, 116(3), 431–435. https://doi.org/10.1016/j.prosdent.2016.03.017
11. Srinivasan, M., Schimmel, M., Naharro, M., Neill, C. O., Mckenna, G., & Müller, F. (2019).
CAD/CAM milled removable complete dentures: time and cost estimation study. Journal of Dentistry, 80, 75–79. doi: 10.1016/j.jdent.2018.09.003
12. Nash, K. D., & Benting, D. G. (2018). Private Practice of Prosthodontists in the United
States: Results from the 2017 Survey of Prosthodontists and Trends Since 2001. Journal of Prosthodontics, 28(1), 49–63. doi: 10.1111/jopr.12923
13. Kattadiyil, M. T., Jekki, R., Goodacre, C. J., & Baba, N. Z. (2015). Comparison of treatment
outcomes in digital and conventional complete removable dental prosthesis fabrications in a predoctoral setting. The Journal of Prosthetic Dentistry, 114(6), 818–825. https://doi.org/10.1016/j.prosdent.2015.08.001
14. Kattadiyil, M. T., AlHelal, A., & Goodacre, B. J. (2017). Clinical complications and quality
assessments with computer-engineered complete dentures: A systematic review. The Journal of Prosthetic Dentistry, 117(6), 721–728. https://doi.org/10.1016/j.prosdent.2016.12.006
15. American Dental Association, Health Policy Institute, 2019 Survey of Dental Practice.
Copyright 2019 American Dental Association. 16. Funkhouser, E., Vellala, K., Baltuck, C., Cacciato, R., Durand, E., McEdward, D., Sowell,
E., Theisen, S. E., Gilbert, G. H., & National Dental PBRN Collaborative Group (2017). Survey Methods to Optimize Response Rate in the National Dental Practice-Based Research Network. Evaluation & the health professions, 40(3), 332–358. https://doi.org/10.1177/0163278715625738
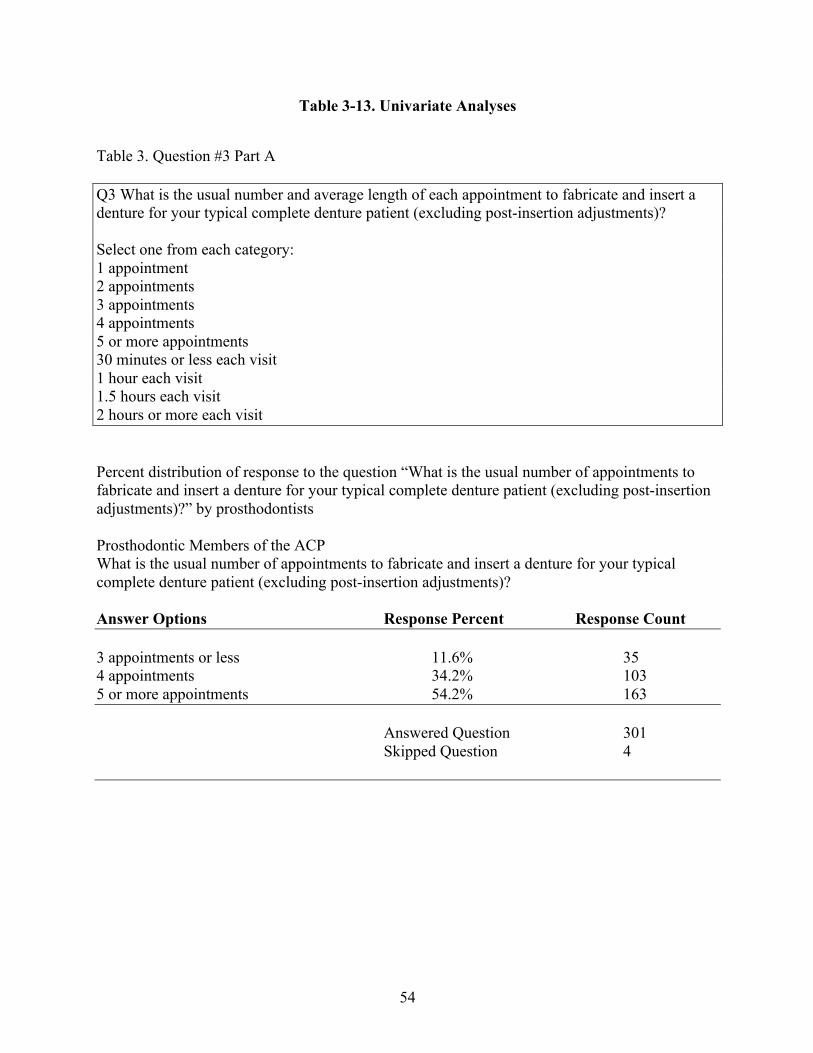
54
Table 3-13. Univariate Analyses
Table 3. Question #3 Part A Q3 What is the usual number and average length of each appointment to fabricate and insert a denture for your typical complete denture patient (excluding post-insertion adjustments)? Select one from each category: 1 appointment 2 appointments 3 appointments 4 appointments 5 or more appointments 30 minutes or less each visit 1 hour each visit 1.5 hours each visit 2 hours or more each visit Percent distribution of response to the question “What is the usual number of appointments to fabricate and insert a denture for your typical complete denture patient (excluding post-insertion adjustments)?” by prosthodontists Prosthodontic Members of the ACP What is the usual number of appointments to fabricate and insert a denture for your typical complete denture patient (excluding post-insertion adjustments)? Answer Options Response Percent Response Count 3 appointments or less 11.6% 35 4 appointments 34.2% 103 5 or more appointments 54.2% 163 Answered Question 301 Skipped Question 4
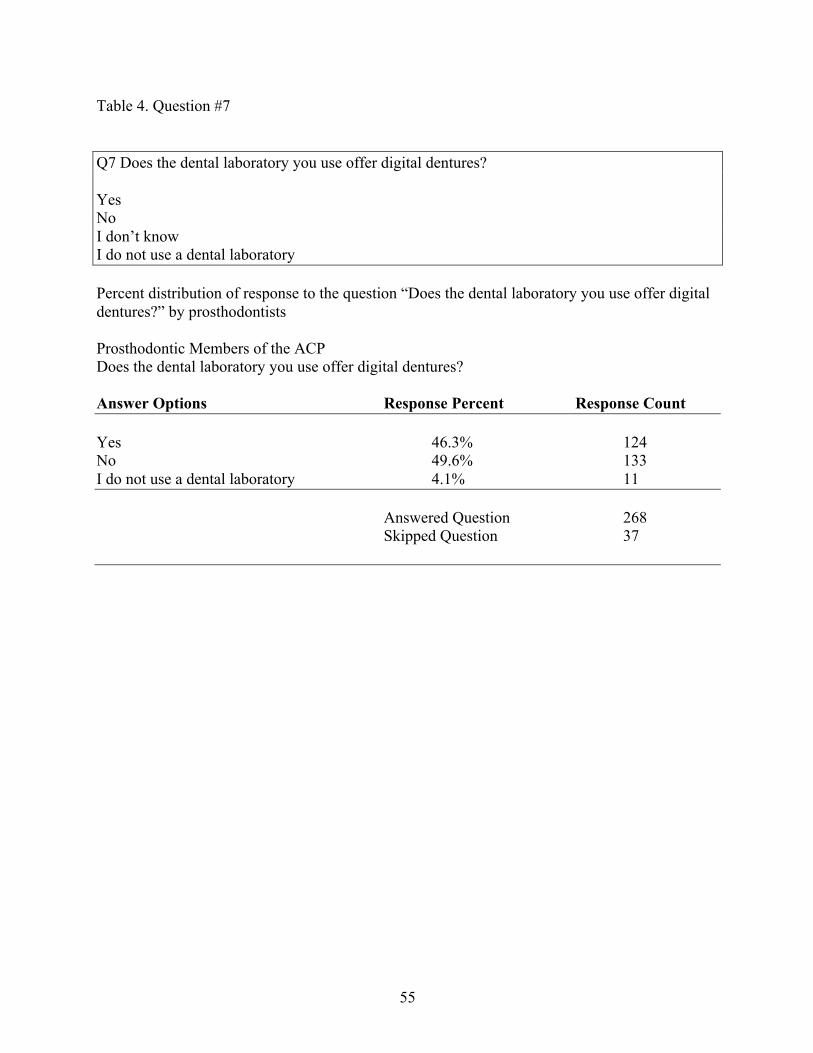
55
Table 4. Question #7 Q7 Does the dental laboratory you use offer digital dentures? Yes No I don’t know I do not use a dental laboratory Percent distribution of response to the question “Does the dental laboratory you use offer digital dentures?” by prosthodontists Prosthodontic Members of the ACP Does the dental laboratory you use offer digital dentures? Answer Options Response Percent Response Count Yes 46.3% 124 No 49.6% 133 I do not use a dental laboratory 4.1% 11 Answered Question 268 Skipped Question 37
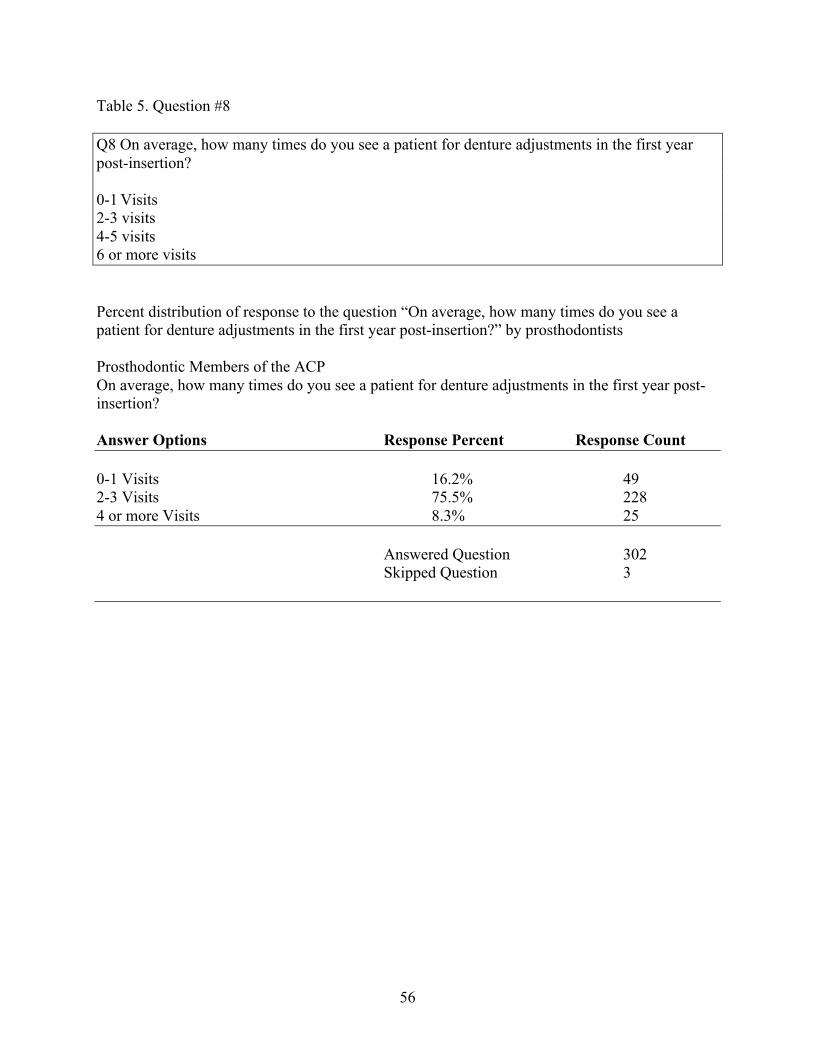
56
Table 5. Question #8 Q8 On average, how many times do you see a patient for denture adjustments in the first year post-insertion? 0-1 Visits 2-3 visits 4-5 visits 6 or more visits Percent distribution of response to the question “On average, how many times do you see a patient for denture adjustments in the first year post-insertion?” by prosthodontists Prosthodontic Members of the ACP On average, how many times do you see a patient for denture adjustments in the first year post-insertion? Answer Options Response Percent Response Count 0-1 Visits 16.2% 49 2-3 Visits 75.5% 228 4 or more Visits 8.3% 25 Answered Question 302 Skipped Question 3
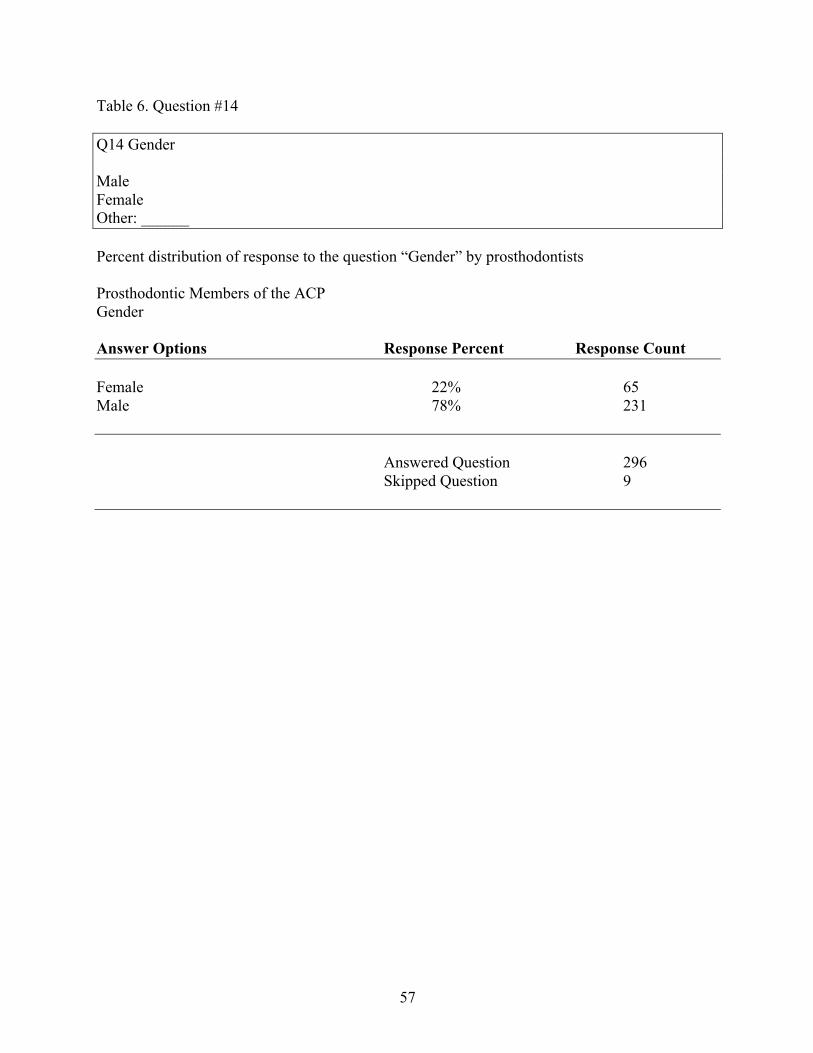
57
Table 6. Question #14 Q14 Gender Male Female Other: ______ Percent distribution of response to the question “Gender” by prosthodontists Prosthodontic Members of the ACP Gender Answer Options Response Percent Response Count Female 22% 65 Male 78% 231 Answered Question 296 Skipped Question 9
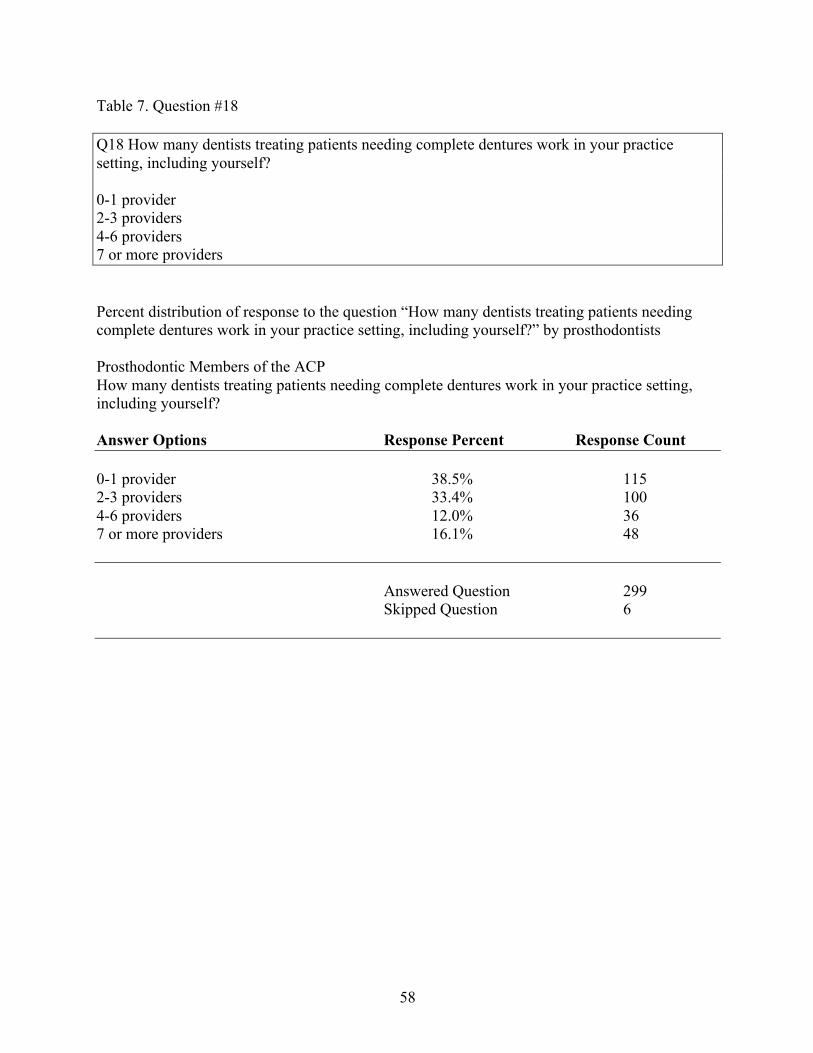
58
Table 7. Question #18 Q18 How many dentists treating patients needing complete dentures work in your practice setting, including yourself? 0-1 provider 2-3 providers 4-6 providers 7 or more providers Percent distribution of response to the question “How many dentists treating patients needing complete dentures work in your practice setting, including yourself?” by prosthodontists Prosthodontic Members of the ACP How many dentists treating patients needing complete dentures work in your practice setting, including yourself? Answer Options Response Percent Response Count 0-1 provider 38.5% 115 2-3 providers 33.4% 100 4-6 providers 12.0% 36 7 or more providers 16.1% 48 Answered Question 299 Skipped Question 6
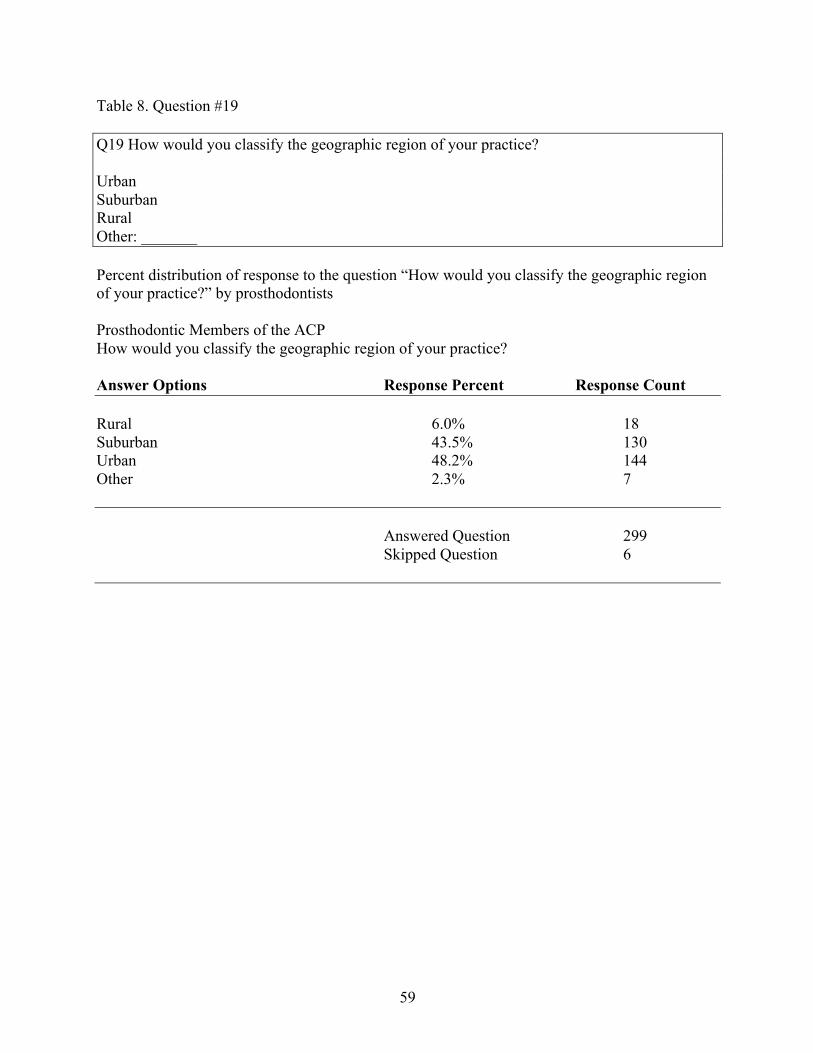
59
Table 8. Question #19 Q19 How would you classify the geographic region of your practice? Urban Suburban Rural Other: _______ Percent distribution of response to the question “How would you classify the geographic region of your practice?” by prosthodontists Prosthodontic Members of the ACP How would you classify the geographic region of your practice? Answer Options Response Percent Response Count Rural 6.0% 18 Suburban 43.5% 130 Urban 48.2% 144 Other 2.3% 7 Answered Question 299 Skipped Question 6
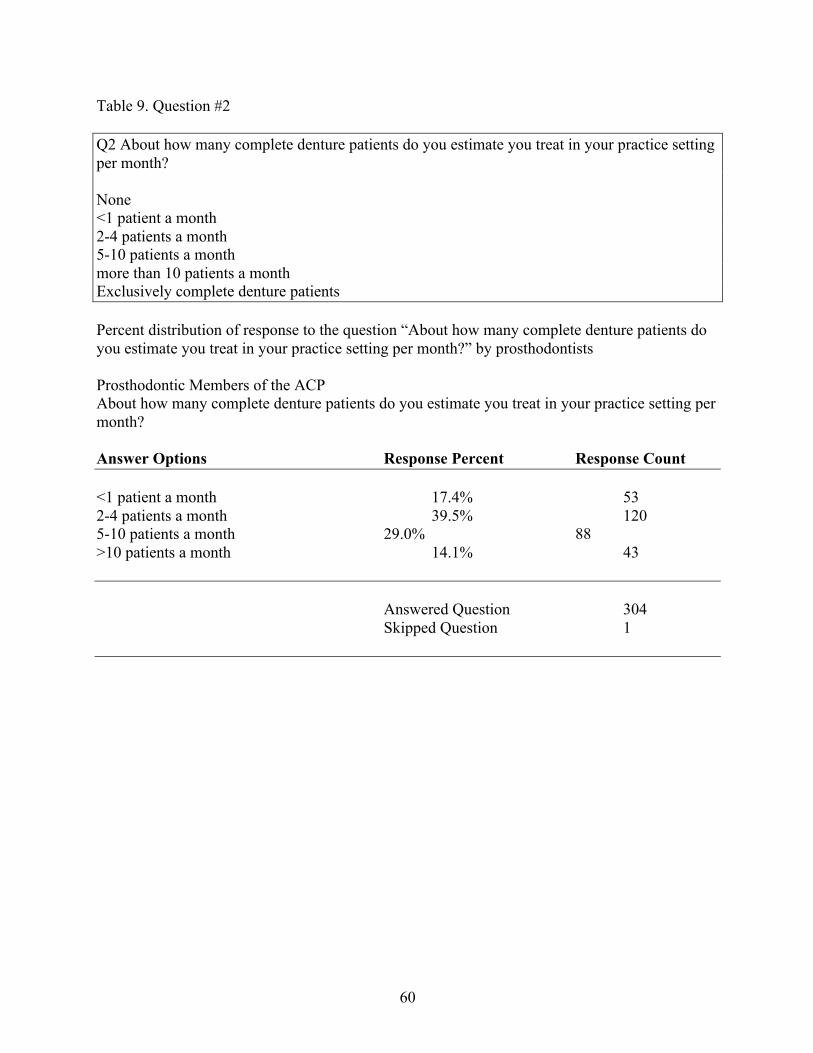
60
Table 9. Question #2 Q2 About how many complete denture patients do you estimate you treat in your practice setting per month? None <1 patient a month 2-4 patients a month 5-10 patients a month more than 10 patients a month Exclusively complete denture patients Percent distribution of response to the question “About how many complete denture patients do you estimate you treat in your practice setting per month?” by prosthodontists Prosthodontic Members of the ACP About how many complete denture patients do you estimate you treat in your practice setting per month? Answer Options Response Percent Response Count <1 patient a month 17.4% 53 2-4 patients a month 39.5% 120 5-10 patients a month 29.0% 88 >10 patients a month 14.1% 43 Answered Question 304 Skipped Question 1
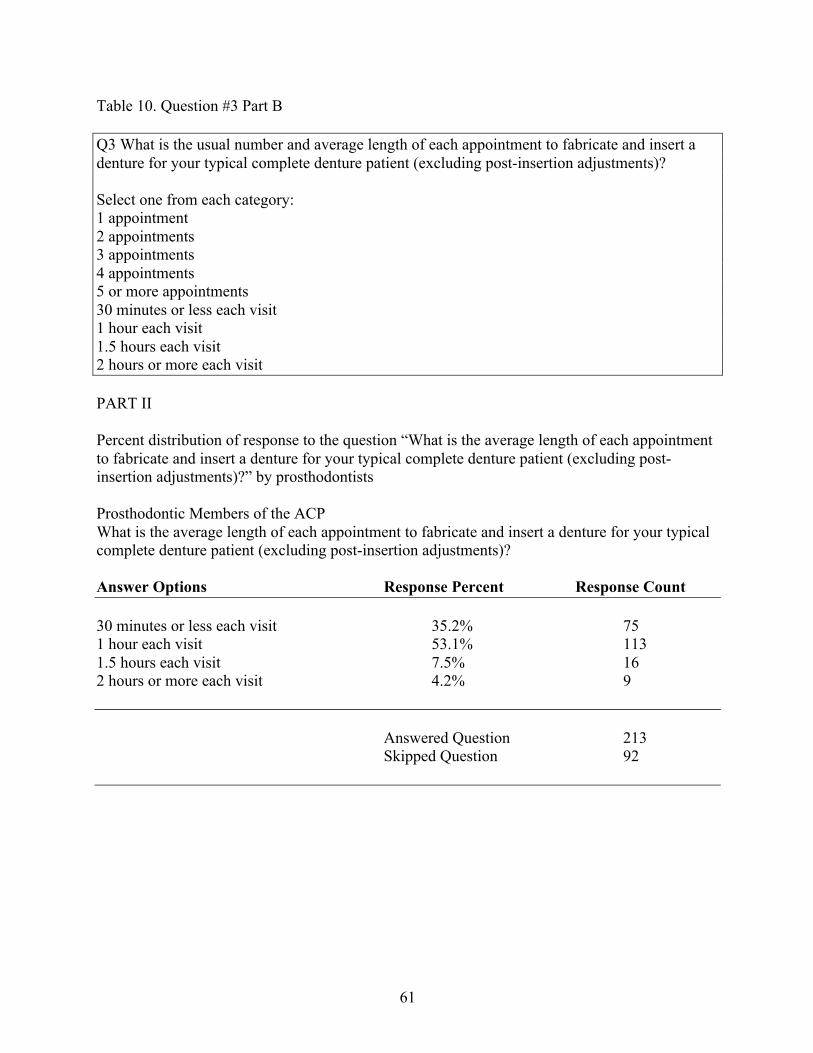
61
Table 10. Question #3 Part B Q3 What is the usual number and average length of each appointment to fabricate and insert a denture for your typical complete denture patient (excluding post-insertion adjustments)? Select one from each category: 1 appointment 2 appointments 3 appointments 4 appointments 5 or more appointments 30 minutes or less each visit 1 hour each visit 1.5 hours each visit 2 hours or more each visit PART II Percent distribution of response to the question “What is the average length of each appointment to fabricate and insert a denture for your typical complete denture patient (excluding post-insertion adjustments)?” by prosthodontists Prosthodontic Members of the ACP What is the average length of each appointment to fabricate and insert a denture for your typical complete denture patient (excluding post-insertion adjustments)? Answer Options Response Percent Response Count 30 minutes or less each visit 35.2% 75 1 hour each visit 53.1% 113 1.5 hours each visit 7.5% 16 2 hours or more each visit 4.2% 9 Answered Question 213 Skipped Question 92
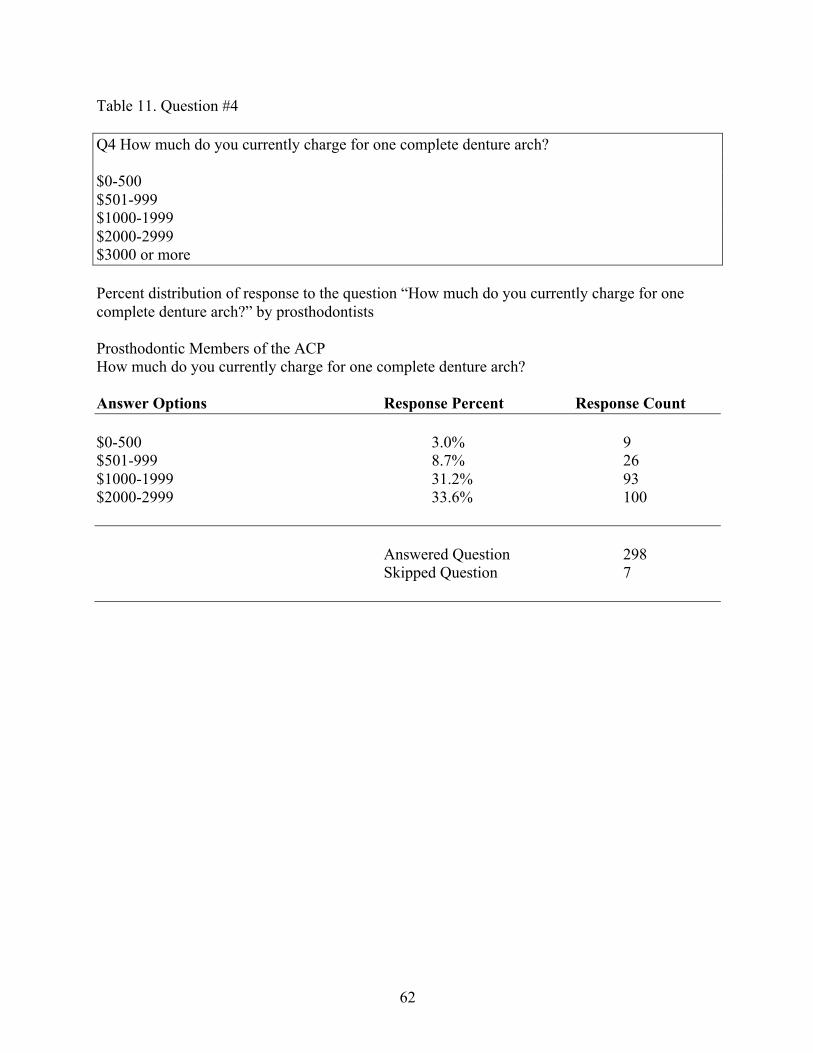
62
Table 11. Question #4 Q4 How much do you currently charge for one complete denture arch? $0-500 $501-999 $1000-1999 $2000-2999 $3000 or more Percent distribution of response to the question “How much do you currently charge for one complete denture arch?” by prosthodontists Prosthodontic Members of the ACP How much do you currently charge for one complete denture arch? Answer Options Response Percent Response Count $0-500 3.0% 9 $501-999 8.7% 26 $1000-1999 31.2% 93 $2000-2999 33.6% 100 Answered Question 298 Skipped Question 7
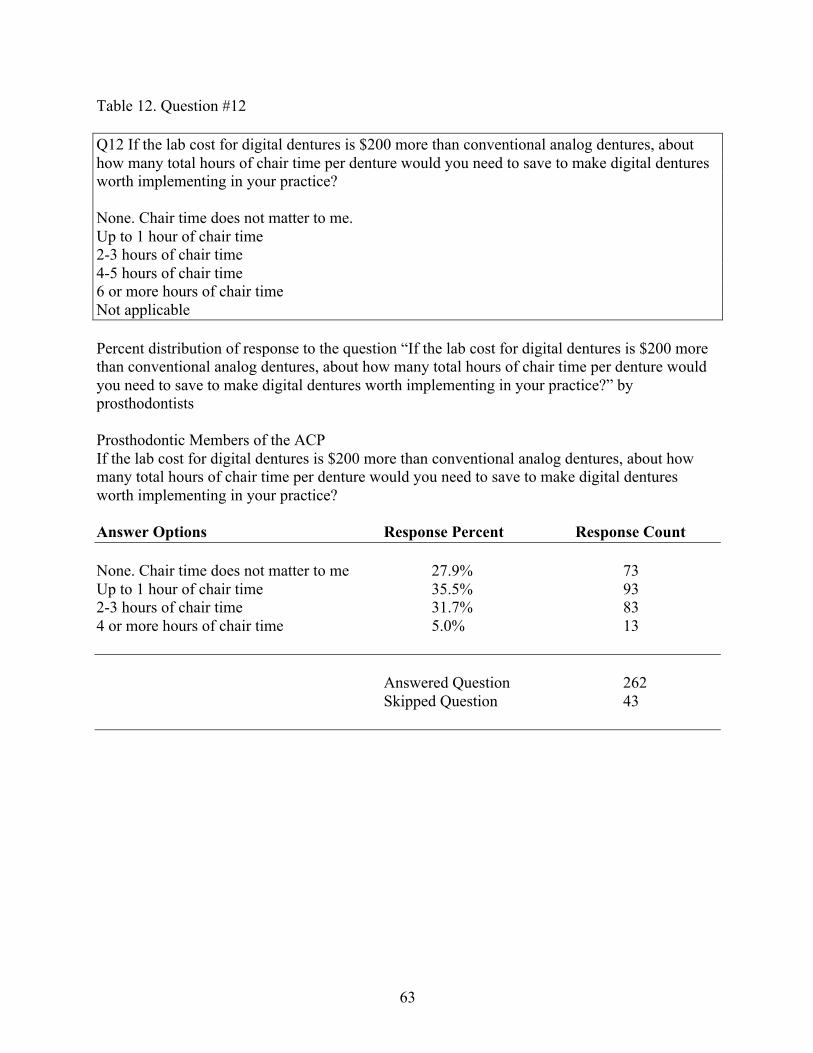
63
Table 12. Question #12 Q12 If the lab cost for digital dentures is $200 more than conventional analog dentures, about how many total hours of chair time per denture would you need to save to make digital dentures worth implementing in your practice? None. Chair time does not matter to me. Up to 1 hour of chair time 2-3 hours of chair time 4-5 hours of chair time 6 or more hours of chair time Not applicable Percent distribution of response to the question “If the lab cost for digital dentures is $200 more than conventional analog dentures, about how many total hours of chair time per denture would you need to save to make digital dentures worth implementing in your practice?” by prosthodontists Prosthodontic Members of the ACP If the lab cost for digital dentures is $200 more than conventional analog dentures, about how many total hours of chair time per denture would you need to save to make digital dentures worth implementing in your practice? Answer Options Response Percent Response Count None. Chair time does not matter to me 27.9% 73 Up to 1 hour of chair time 35.5% 93 2-3 hours of chair time 31.7% 83 4 or more hours of chair time 5.0% 13 Answered Question 262 Skipped Question 43
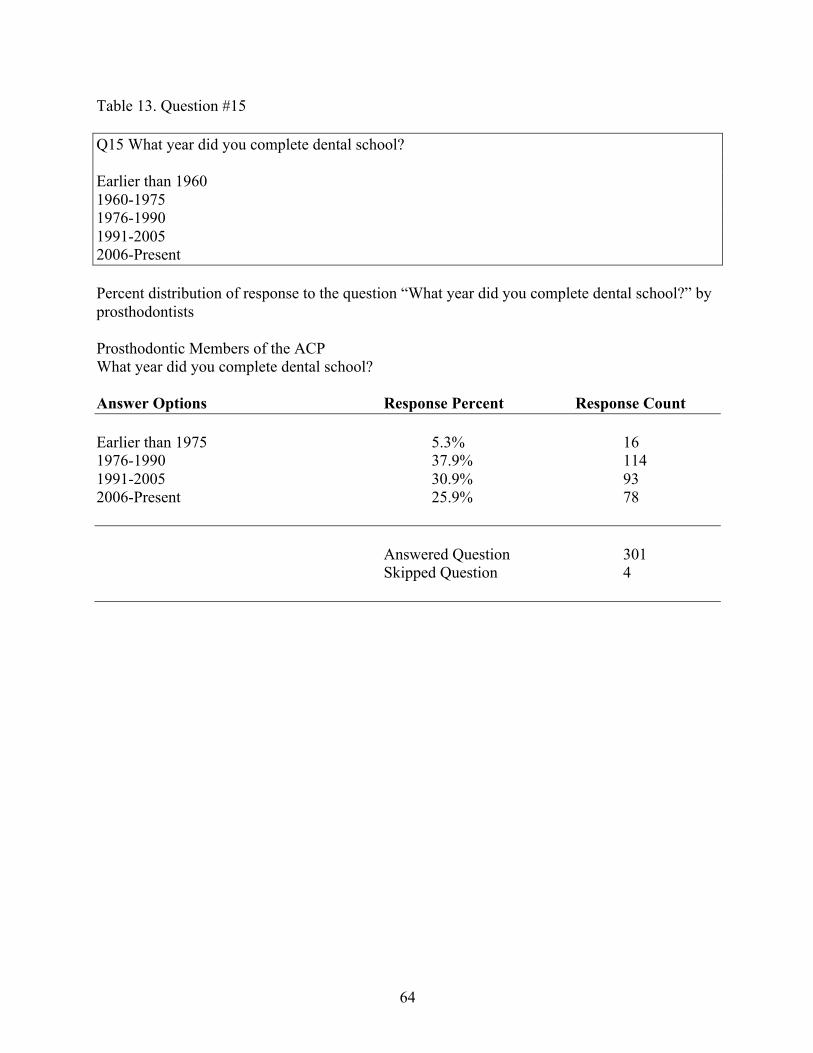
64
Table 13. Question #15 Q15 What year did you complete dental school? Earlier than 1960 1960-1975 1976-1990 1991-2005 2006-Present Percent distribution of response to the question “What year did you complete dental school?” by prosthodontists Prosthodontic Members of the ACP What year did you complete dental school? Answer Options Response Percent Response Count Earlier than 1975 5.3% 16 1976-1990 37.9% 114 1991-2005 30.9% 93 2006-Present 25.9% 78 Answered Question 301 Skipped Question 4
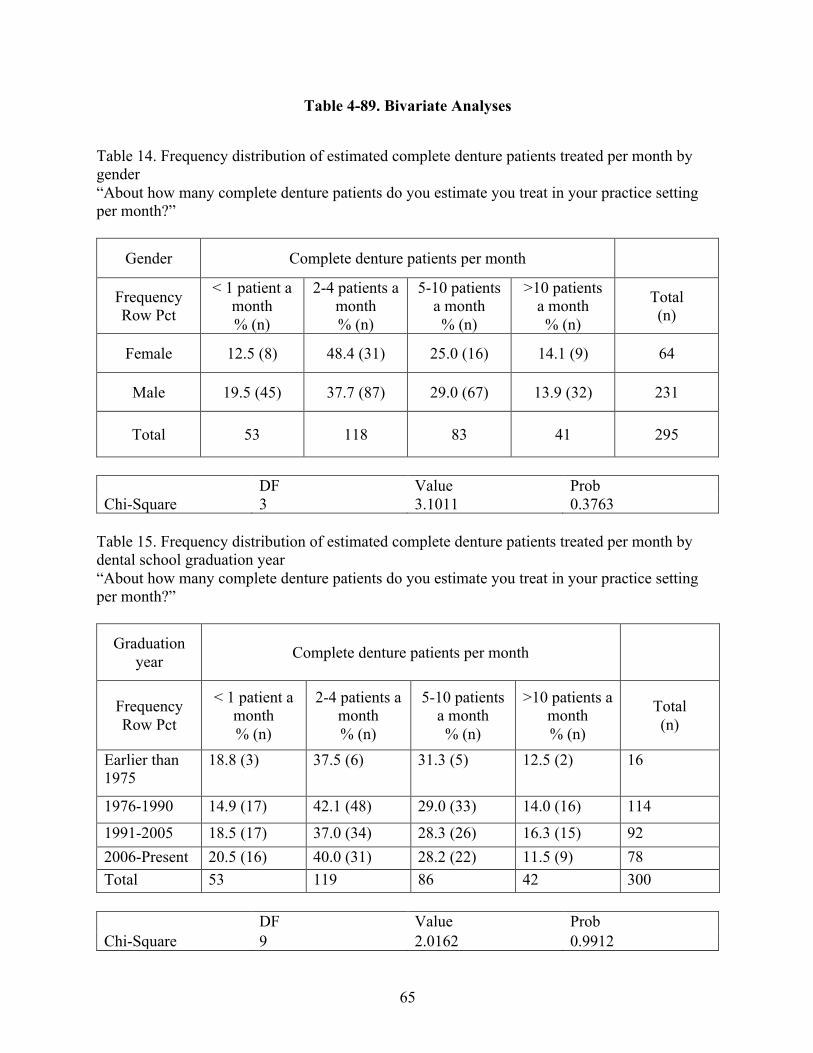
65
Table 4-89. Bivariate Analyses
Table 14. Frequency distribution of estimated complete denture patients treated per month by gender “About how many complete denture patients do you estimate you treat in your practice setting per month?”
Gender Complete denture patients per month
Frequency Row Pct
< 1 patient a month % (n)
2-4 patients a month % (n)
5-10 patients a month
% (n)
>10 patients a month
% (n)
Total (n)
Female 12.5 (8) 48.4 (31) 25.0 (16) 14.1 (9) 64
Male 19.5 (45) 37.7 (87) 29.0 (67) 13.9 (32) 231
Total 53 118 83 41 295
DF Value Prob Chi-Square 3 3.1011 0.3763
Table 15. Frequency distribution of estimated complete denture patients treated per month by dental school graduation year “About how many complete denture patients do you estimate you treat in your practice setting per month?”
Graduation year Complete denture patients per month
Frequency Row Pct
< 1 patient a month % (n)
2-4 patients a month % (n)
5-10 patients a month
% (n)
>10 patients a month % (n)
Total (n)
Earlier than 1975
18.8 (3)
37.5 (6) 31.3 (5) 12.5 (2) 16
1976-1990 14.9 (17) 42.1 (48) 29.0 (33) 14.0 (16) 114
1991-2005 18.5 (17) 37.0 (34) 28.3 (26) 16.3 (15) 92 2006-Present 20.5 (16) 40.0 (31) 28.2 (22) 11.5 (9) 78 Total 53 119 86 42 300
DF Value Prob Chi-Square 9 2.0162 0.9912
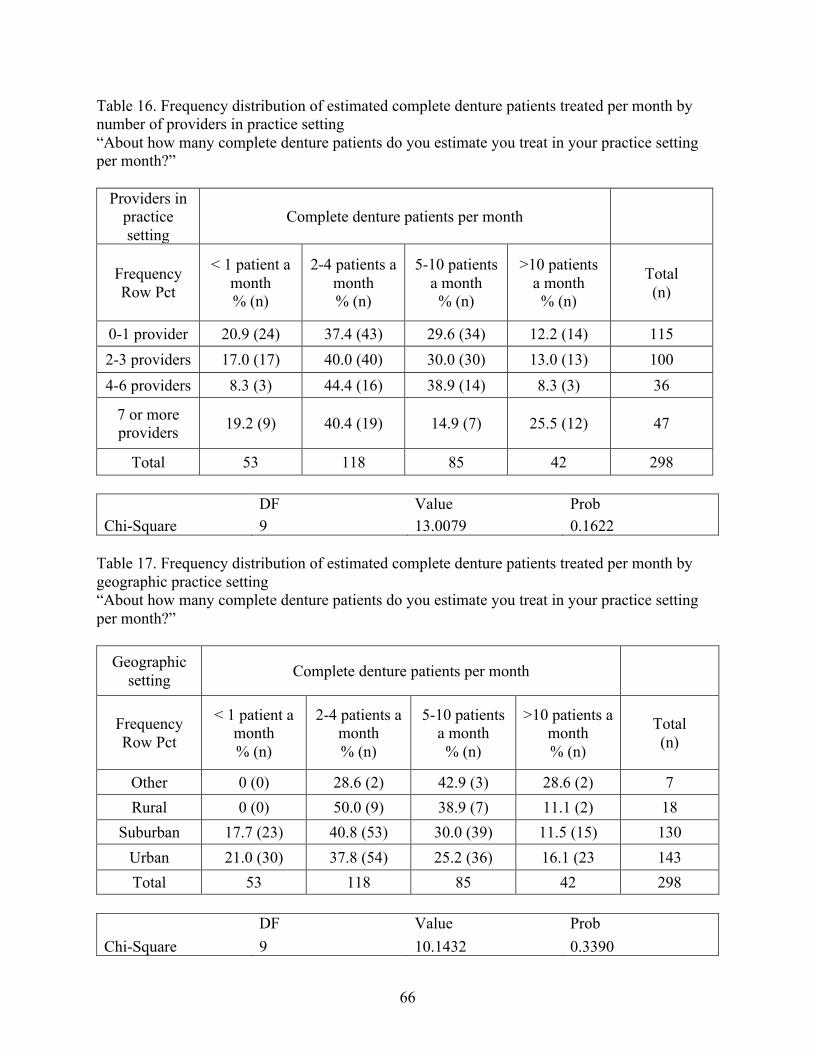
66
Table 16. Frequency distribution of estimated complete denture patients treated per month by number of providers in practice setting “About how many complete denture patients do you estimate you treat in your practice setting per month?”
Providers in practice setting
Complete denture patients per month
Frequency Row Pct
< 1 patient a month % (n)
2-4 patients a month % (n)
5-10 patients a month
% (n)
>10 patients a month
% (n)
Total (n)
0-1 provider 20.9 (24) 37.4 (43) 29.6 (34) 12.2 (14) 115 2-3 providers 17.0 (17) 40.0 (40) 30.0 (30) 13.0 (13) 100 4-6 providers 8.3 (3) 44.4 (16) 38.9 (14) 8.3 (3) 36
7 or more providers 19.2 (9) 40.4 (19) 14.9 (7) 25.5 (12) 47
Total 53 118 85 42 298 DF Value Prob Chi-Square 9 13.0079 0.1622
Table 17. Frequency distribution of estimated complete denture patients treated per month by geographic practice setting “About how many complete denture patients do you estimate you treat in your practice setting per month?”
Geographic setting Complete denture patients per month
Frequency Row Pct
< 1 patient a month % (n)
2-4 patients a month % (n)
5-10 patients a month
% (n)
>10 patients a month % (n)
Total (n)
Other 0 (0) 28.6 (2) 42.9 (3) 28.6 (2) 7 Rural 0 (0) 50.0 (9) 38.9 (7) 11.1 (2) 18
Suburban 17.7 (23) 40.8 (53) 30.0 (39) 11.5 (15) 130 Urban 21.0 (30) 37.8 (54) 25.2 (36) 16.1 (23 143 Total 53 118 85 42 298
DF Value Prob Chi-Square 9 10.1432 0.3390
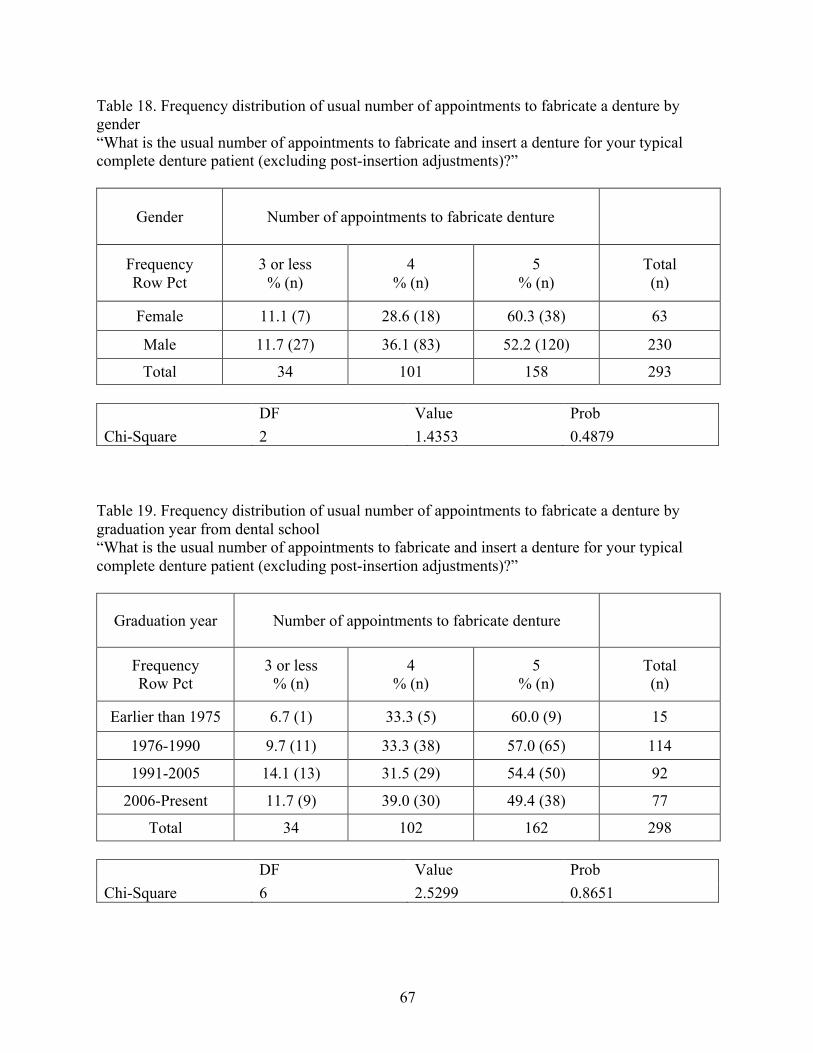
67
Table 18. Frequency distribution of usual number of appointments to fabricate a denture by gender “What is the usual number of appointments to fabricate and insert a denture for your typical complete denture patient (excluding post-insertion adjustments)?”
Gender Number of appointments to fabricate denture
Frequency Row Pct
3 or less % (n)
4 % (n)
5 % (n)
Total (n)
Female 11.1 (7) 28.6 (18) 60.3 (38) 63
Male 11.7 (27) 36.1 (83) 52.2 (120) 230
Total 34 101 158 293 DF Value Prob Chi-Square 2 1.4353 0.4879
Table 19. Frequency distribution of usual number of appointments to fabricate a denture by graduation year from dental school “What is the usual number of appointments to fabricate and insert a denture for your typical complete denture patient (excluding post-insertion adjustments)?”
Graduation year Number of appointments to fabricate denture
Frequency Row Pct
3 or less % (n)
4 % (n)
5 % (n)
Total (n)
Earlier than 1975 6.7 (1) 33.3 (5) 60.0 (9) 15
1976-1990 9.7 (11) 33.3 (38) 57.0 (65) 114
1991-2005 14.1 (13) 31.5 (29) 54.4 (50) 92
2006-Present 11.7 (9) 39.0 (30) 49.4 (38) 77
Total 34 102 162 298 DF Value Prob Chi-Square 6 2.5299 0.8651
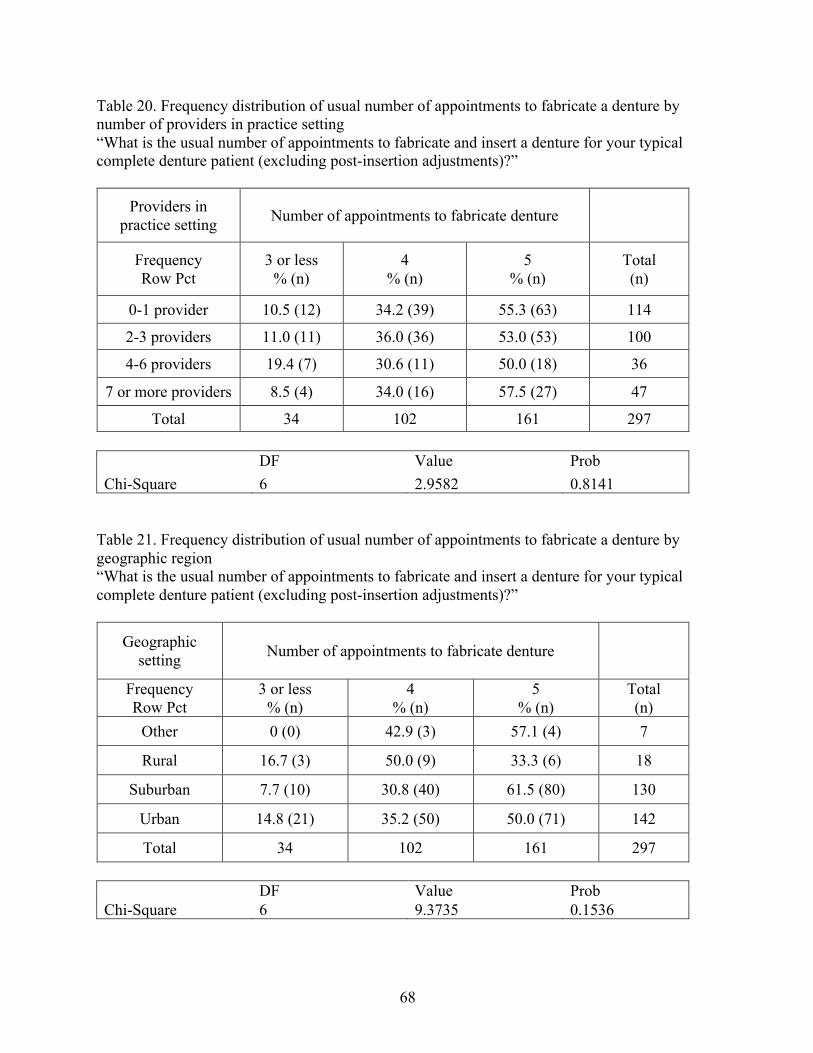
68
Table 20. Frequency distribution of usual number of appointments to fabricate a denture by number of providers in practice setting “What is the usual number of appointments to fabricate and insert a denture for your typical complete denture patient (excluding post-insertion adjustments)?”
Providers in practice setting Number of appointments to fabricate denture
Frequency Row Pct
3 or less % (n)
4 % (n)
5 % (n)
Total (n)
0-1 provider 10.5 (12) 34.2 (39) 55.3 (63) 114
2-3 providers 11.0 (11) 36.0 (36) 53.0 (53) 100
4-6 providers 19.4 (7) 30.6 (11) 50.0 (18) 36
7 or more providers 8.5 (4) 34.0 (16) 57.5 (27) 47
Total 34 102 161 297 DF Value Prob Chi-Square 6 2.9582 0.8141
Table 21. Frequency distribution of usual number of appointments to fabricate a denture by geographic region “What is the usual number of appointments to fabricate and insert a denture for your typical complete denture patient (excluding post-insertion adjustments)?”
Geographic setting Number of appointments to fabricate denture
Frequency Row Pct
3 or less % (n)
4 % (n)
5 % (n)
Total (n)
Other 0 (0) 42.9 (3) 57.1 (4) 7
Rural 16.7 (3) 50.0 (9) 33.3 (6) 18
Suburban 7.7 (10) 30.8 (40) 61.5 (80) 130
Urban 14.8 (21) 35.2 (50) 50.0 (71) 142
Total 34 102 161 297 DF Value Prob Chi-Square 6 9.3735 0.1536
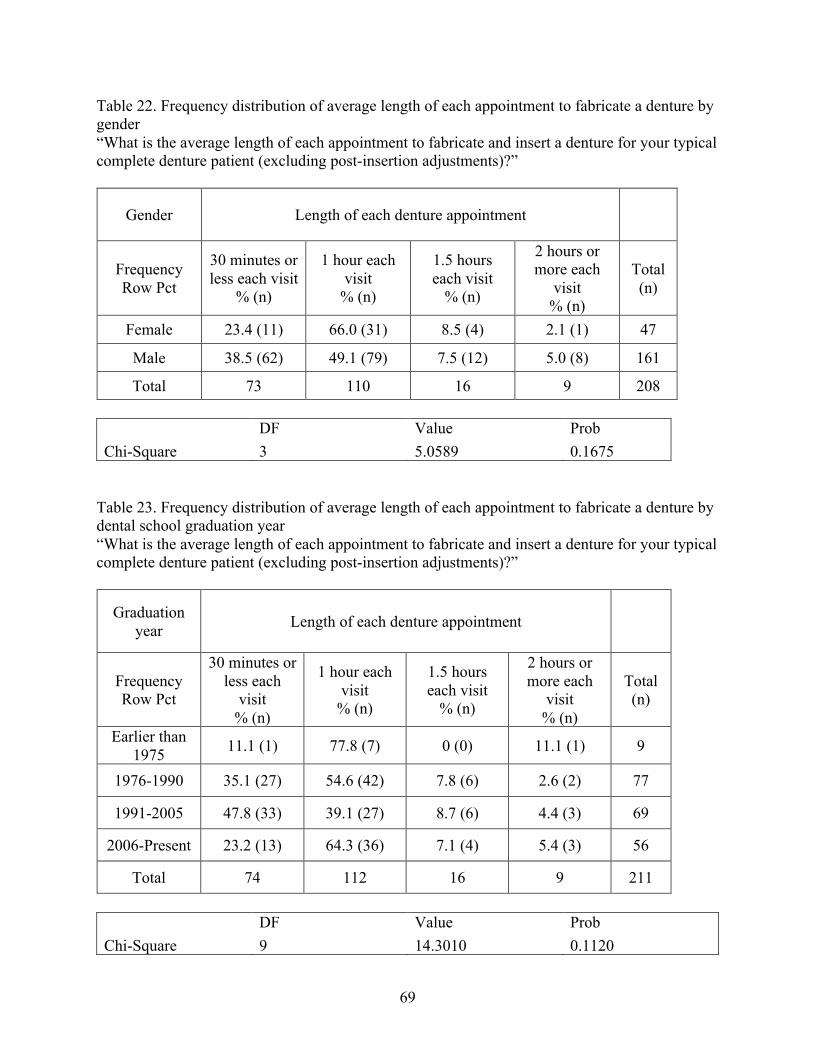
69
Table 22. Frequency distribution of average length of each appointment to fabricate a denture by gender “What is the average length of each appointment to fabricate and insert a denture for your typical complete denture patient (excluding post-insertion adjustments)?”
Gender Length of each denture appointment
Frequency Row Pct
30 minutes or less each visit
% (n)
1 hour each visit
% (n)
1.5 hours each visit
% (n)
2 hours or more each
visit % (n)
Total (n)
Female 23.4 (11) 66.0 (31) 8.5 (4) 2.1 (1) 47
Male 38.5 (62) 49.1 (79) 7.5 (12) 5.0 (8) 161
Total 73 110 16 9 208 DF Value Prob Chi-Square 3 5.0589 0.1675
Table 23. Frequency distribution of average length of each appointment to fabricate a denture by dental school graduation year “What is the average length of each appointment to fabricate and insert a denture for your typical complete denture patient (excluding post-insertion adjustments)?”
Graduation year Length of each denture appointment
Frequency Row Pct
30 minutes or less each
visit % (n)
1 hour each visit
% (n)
1.5 hours each visit
% (n)
2 hours or more each
visit % (n)
Total (n)
Earlier than 1975 11.1 (1) 77.8 (7) 0 (0) 11.1 (1) 9
1976-1990 35.1 (27) 54.6 (42) 7.8 (6) 2.6 (2) 77
1991-2005 47.8 (33) 39.1 (27) 8.7 (6) 4.4 (3) 69
2006-Present 23.2 (13) 64.3 (36) 7.1 (4) 5.4 (3) 56
Total 74 112 16 9 211 DF Value Prob Chi-Square 9 14.3010 0.1120
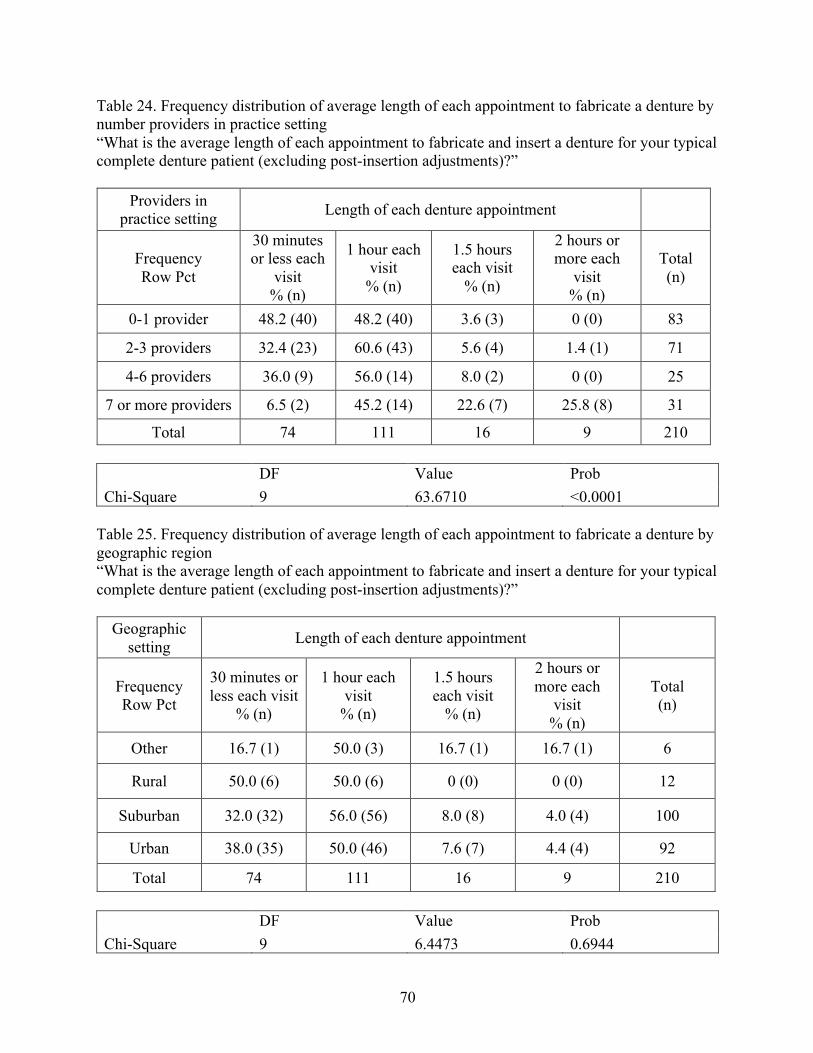
70
Table 24. Frequency distribution of average length of each appointment to fabricate a denture by number providers in practice setting “What is the average length of each appointment to fabricate and insert a denture for your typical complete denture patient (excluding post-insertion adjustments)?”
Providers in practice setting Length of each denture appointment
Frequency Row Pct
30 minutes or less each
visit % (n)
1 hour each visit
% (n)
1.5 hours each visit
% (n)
2 hours or more each
visit % (n)
Total (n)
0-1 provider 48.2 (40) 48.2 (40) 3.6 (3) 0 (0) 83
2-3 providers 32.4 (23) 60.6 (43) 5.6 (4) 1.4 (1) 71
4-6 providers 36.0 (9) 56.0 (14) 8.0 (2) 0 (0) 25
7 or more providers 6.5 (2) 45.2 (14) 22.6 (7) 25.8 (8) 31
Total 74 111 16 9 210 DF Value Prob Chi-Square 9 63.6710 <0.0001
Table 25. Frequency distribution of average length of each appointment to fabricate a denture by geographic region “What is the average length of each appointment to fabricate and insert a denture for your typical complete denture patient (excluding post-insertion adjustments)?”
Geographic setting Length of each denture appointment
Frequency Row Pct
30 minutes or less each visit
% (n)
1 hour each visit
% (n)
1.5 hours each visit
% (n)
2 hours or more each
visit % (n)
Total (n)
Other 16.7 (1) 50.0 (3) 16.7 (1) 16.7 (1) 6
Rural 50.0 (6) 50.0 (6) 0 (0) 0 (0) 12
Suburban 32.0 (32) 56.0 (56) 8.0 (8) 4.0 (4) 100
Urban 38.0 (35) 50.0 (46) 7.6 (7) 4.4 (4) 92
Total 74 111 16 9 210 DF Value Prob Chi-Square 9 6.4473 0.6944
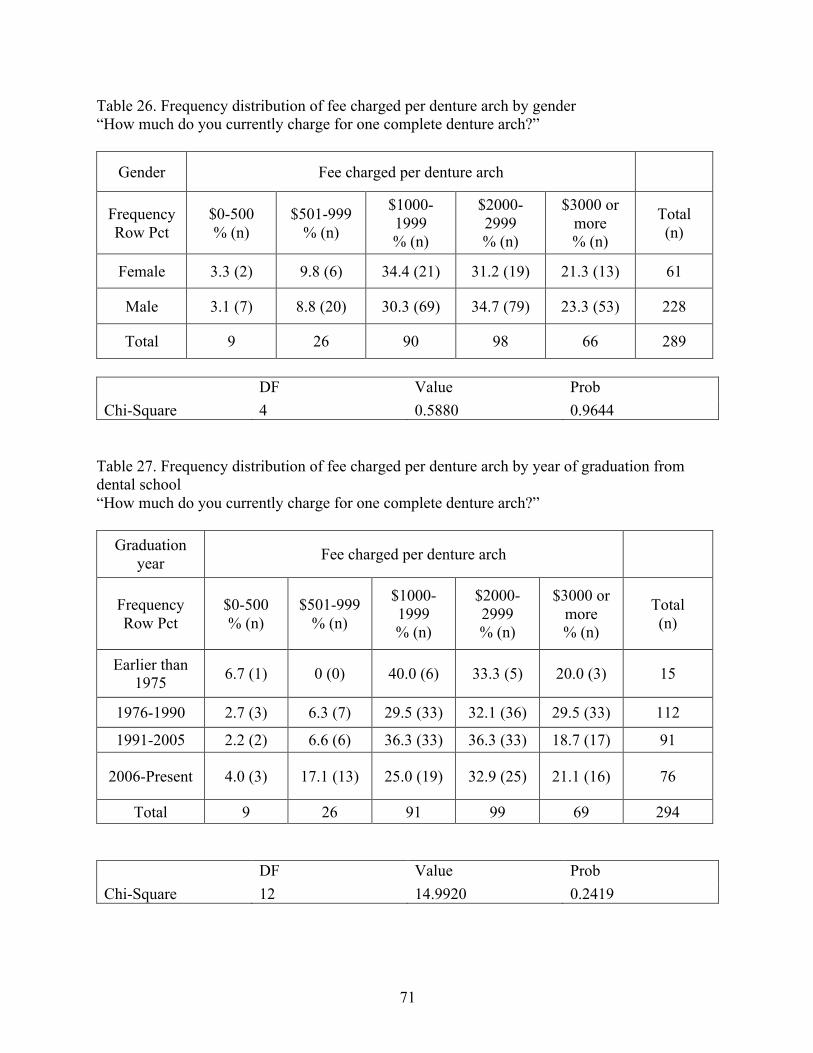
71
Table 26. Frequency distribution of fee charged per denture arch by gender “How much do you currently charge for one complete denture arch?”
Gender Fee charged per denture arch
Frequency Row Pct
$0-500 % (n)
$501-999 % (n)
$1000-1999 % (n)
$2000-2999 % (n)
$3000 or more % (n)
Total (n)
Female 3.3 (2) 9.8 (6) 34.4 (21) 31.2 (19) 21.3 (13) 61
Male 3.1 (7) 8.8 (20) 30.3 (69) 34.7 (79) 23.3 (53) 228
Total 9 26 90 98 66 289
DF Value Prob Chi-Square 4 0.5880 0.9644
Table 27. Frequency distribution of fee charged per denture arch by year of graduation from dental school “How much do you currently charge for one complete denture arch?”
Graduation year Fee charged per denture arch
Frequency Row Pct
$0-500 % (n)
$501-999 % (n)
$1000-1999 % (n)
$2000-2999 % (n)
$3000 or more % (n)
Total (n)
Earlier than 1975 6.7 (1) 0 (0) 40.0 (6) 33.3 (5) 20.0 (3) 15
1976-1990 2.7 (3) 6.3 (7) 29.5 (33) 32.1 (36) 29.5 (33) 112
1991-2005 2.2 (2) 6.6 (6) 36.3 (33) 36.3 (33) 18.7 (17) 91
2006-Present 4.0 (3) 17.1 (13) 25.0 (19) 32.9 (25) 21.1 (16) 76
Total 9 26 91 99 69 294 DF Value Prob Chi-Square 12 14.9920 0.2419
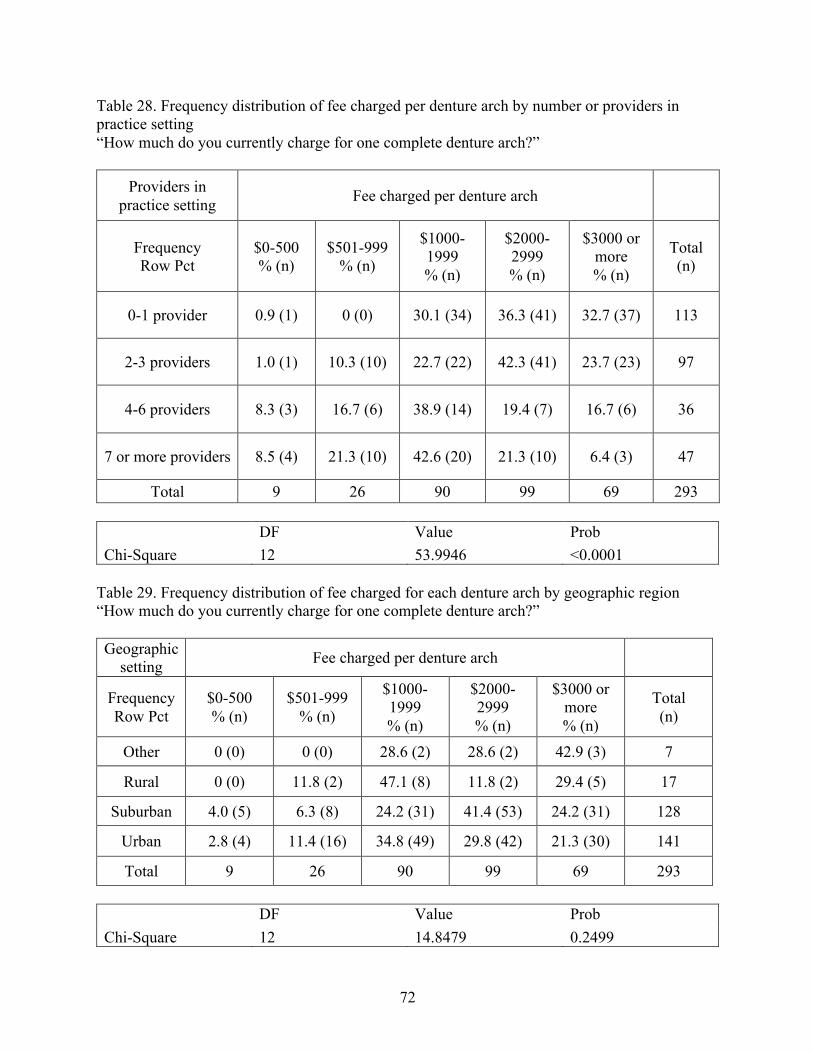
72
Table 28. Frequency distribution of fee charged per denture arch by number or providers in practice setting “How much do you currently charge for one complete denture arch?”
Providers in practice setting Fee charged per denture arch
Frequency Row Pct
$0-500 % (n)
$501-999 % (n)
$1000-1999 % (n)
$2000-2999 % (n)
$3000 or more % (n)
Total (n)
0-1 provider 0.9 (1) 0 (0) 30.1 (34) 36.3 (41) 32.7 (37) 113
2-3 providers 1.0 (1) 10.3 (10) 22.7 (22) 42.3 (41) 23.7 (23) 97
4-6 providers 8.3 (3) 16.7 (6) 38.9 (14) 19.4 (7) 16.7 (6) 36
7 or more providers 8.5 (4) 21.3 (10) 42.6 (20) 21.3 (10) 6.4 (3) 47
Total 9 26 90 99 69 293 DF Value Prob Chi-Square 12 53.9946 <0.0001
Table 29. Frequency distribution of fee charged for each denture arch by geographic region “How much do you currently charge for one complete denture arch?” Geographic
setting Fee charged per denture arch
Frequency Row Pct
$0-500 % (n)
$501-999 % (n)
$1000-1999 % (n)
$2000-2999 % (n)
$3000 or more % (n)
Total (n)
Other 0 (0) 0 (0) 28.6 (2) 28.6 (2) 42.9 (3) 7
Rural 0 (0) 11.8 (2) 47.1 (8) 11.8 (2) 29.4 (5) 17
Suburban 4.0 (5) 6.3 (8) 24.2 (31) 41.4 (53) 24.2 (31) 128
Urban 2.8 (4) 11.4 (16) 34.8 (49) 29.8 (42) 21.3 (30) 141
Total 9 26 90 99 69 293 DF Value Prob Chi-Square 12 14.8479 0.2499
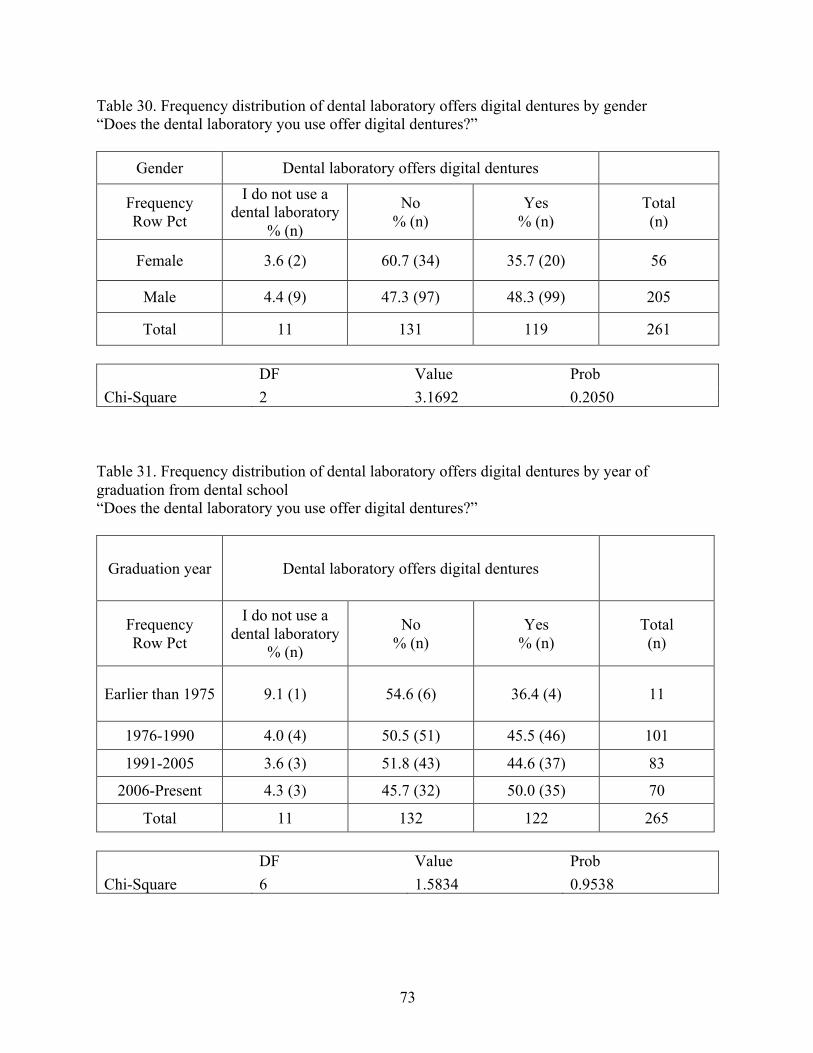
73
Table 30. Frequency distribution of dental laboratory offers digital dentures by gender “Does the dental laboratory you use offer digital dentures?”
Gender Dental laboratory offers digital dentures
Frequency Row Pct
I do not use a dental laboratory
% (n)
No % (n)
Yes % (n)
Total (n)
Female 3.6 (2) 60.7 (34) 35.7 (20) 56
Male 4.4 (9) 47.3 (97) 48.3 (99) 205
Total 11 131 119 261 DF Value Prob Chi-Square 2 3.1692 0.2050
Table 31. Frequency distribution of dental laboratory offers digital dentures by year of graduation from dental school “Does the dental laboratory you use offer digital dentures?”
Graduation year Dental laboratory offers digital dentures
Frequency Row Pct
I do not use a dental laboratory
% (n)
No % (n)
Yes % (n)
Total (n)
Earlier than 1975 9.1 (1) 54.6 (6) 36.4 (4) 11
1976-1990 4.0 (4) 50.5 (51) 45.5 (46) 101
1991-2005 3.6 (3) 51.8 (43) 44.6 (37) 83
2006-Present 4.3 (3) 45.7 (32) 50.0 (35) 70
Total 11 132 122 265 DF Value Prob Chi-Square 6 1.5834 0.9538
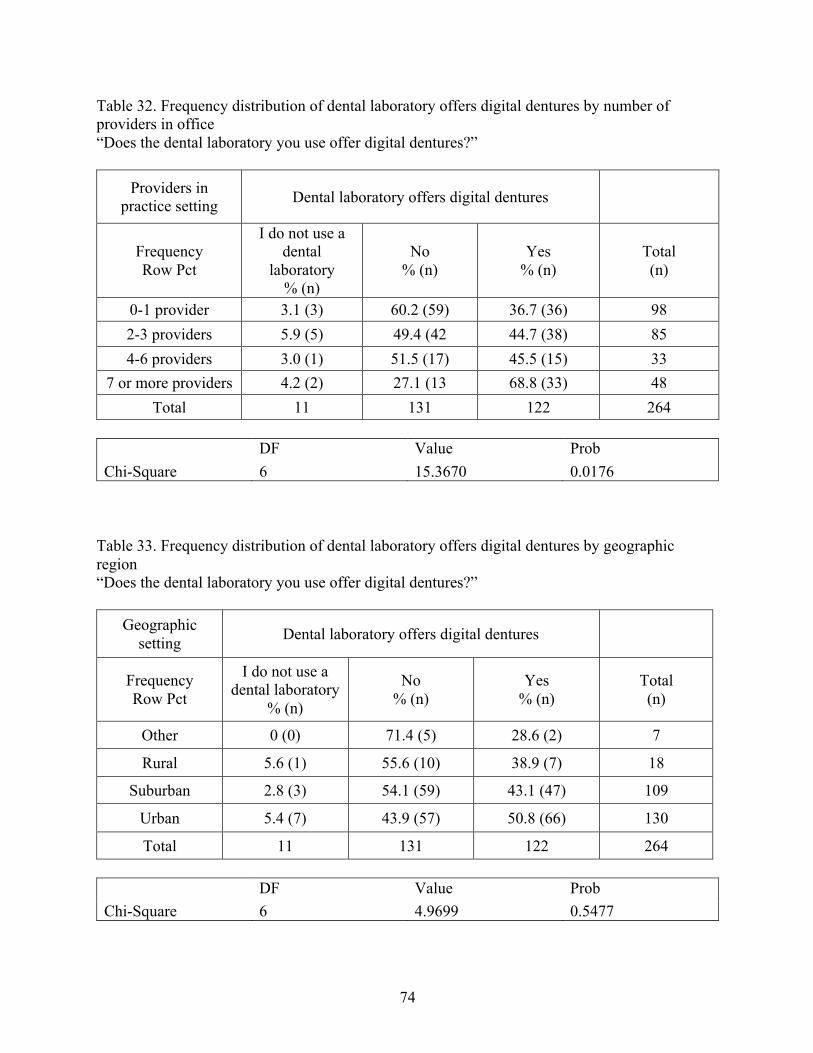
74
Table 32. Frequency distribution of dental laboratory offers digital dentures by number of providers in office “Does the dental laboratory you use offer digital dentures?”
Providers in practice setting Dental laboratory offers digital dentures
Frequency Row Pct
I do not use a dental
laboratory % (n)
No % (n)
Yes % (n)
Total (n)
0-1 provider 3.1 (3) 60.2 (59) 36.7 (36) 98 2-3 providers 5.9 (5) 49.4 (42 44.7 (38) 85 4-6 providers 3.0 (1) 51.5 (17) 45.5 (15) 33
7 or more providers 4.2 (2) 27.1 (13 68.8 (33) 48 Total 11 131 122 264
DF Value Prob Chi-Square 6 15.3670 0.0176
Table 33. Frequency distribution of dental laboratory offers digital dentures by geographic region “Does the dental laboratory you use offer digital dentures?”
Geographic setting Dental laboratory offers digital dentures
Frequency Row Pct
I do not use a dental laboratory
% (n)
No % (n)
Yes % (n)
Total (n)
Other 0 (0) 71.4 (5) 28.6 (2) 7
Rural 5.6 (1) 55.6 (10) 38.9 (7) 18
Suburban 2.8 (3) 54.1 (59) 43.1 (47) 109
Urban 5.4 (7) 43.9 (57) 50.8 (66) 130
Total 11 131 122 264 DF Value Prob Chi-Square 6 4.9699 0.5477
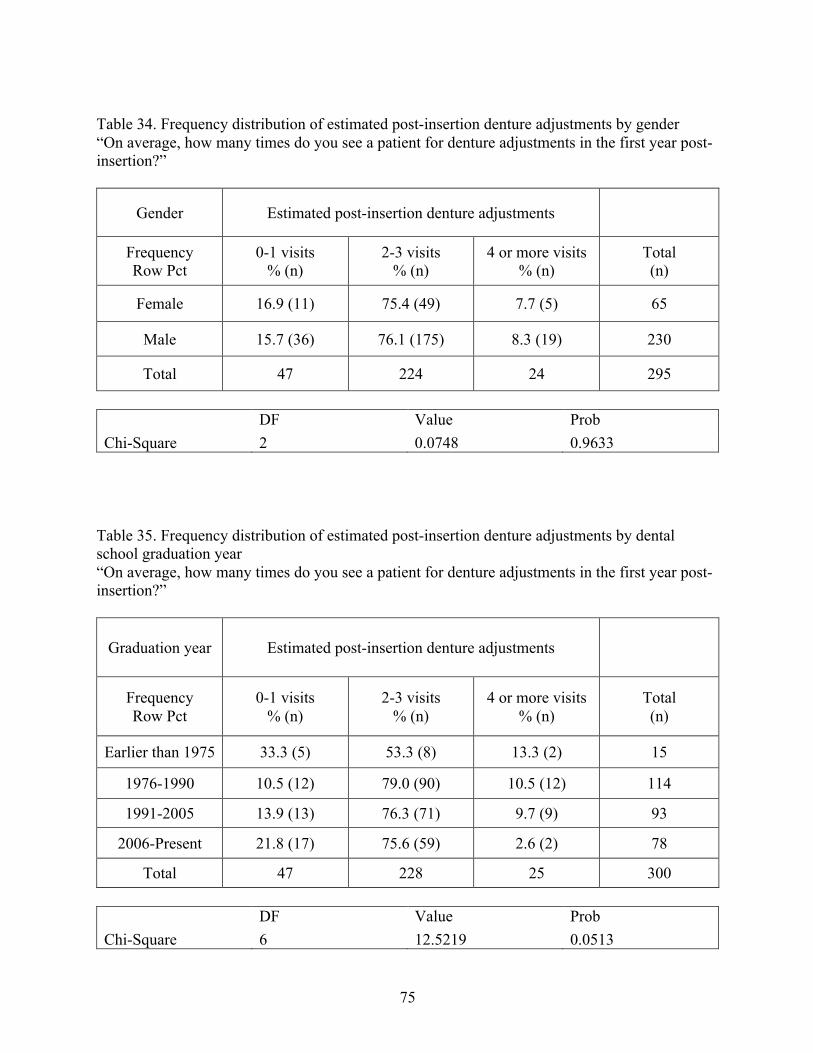
75
Table 34. Frequency distribution of estimated post-insertion denture adjustments by gender “On average, how many times do you see a patient for denture adjustments in the first year post-insertion?”
Gender Estimated post-insertion denture adjustments
Frequency Row Pct
0-1 visits % (n)
2-3 visits % (n)
4 or more visits % (n)
Total (n)
Female 16.9 (11) 75.4 (49) 7.7 (5) 65
Male 15.7 (36) 76.1 (175) 8.3 (19) 230
Total 47 224 24 295
DF Value Prob Chi-Square 2 0.0748 0.9633
Table 35. Frequency distribution of estimated post-insertion denture adjustments by dental school graduation year “On average, how many times do you see a patient for denture adjustments in the first year post-insertion?”
Graduation year Estimated post-insertion denture adjustments
Frequency Row Pct
0-1 visits % (n)
2-3 visits % (n)
4 or more visits % (n)
Total (n)
Earlier than 1975 33.3 (5) 53.3 (8) 13.3 (2) 15
1976-1990 10.5 (12) 79.0 (90) 10.5 (12) 114
1991-2005 13.9 (13) 76.3 (71) 9.7 (9) 93
2006-Present 21.8 (17) 75.6 (59) 2.6 (2) 78
Total 47 228 25 300 DF Value Prob Chi-Square 6 12.5219 0.0513
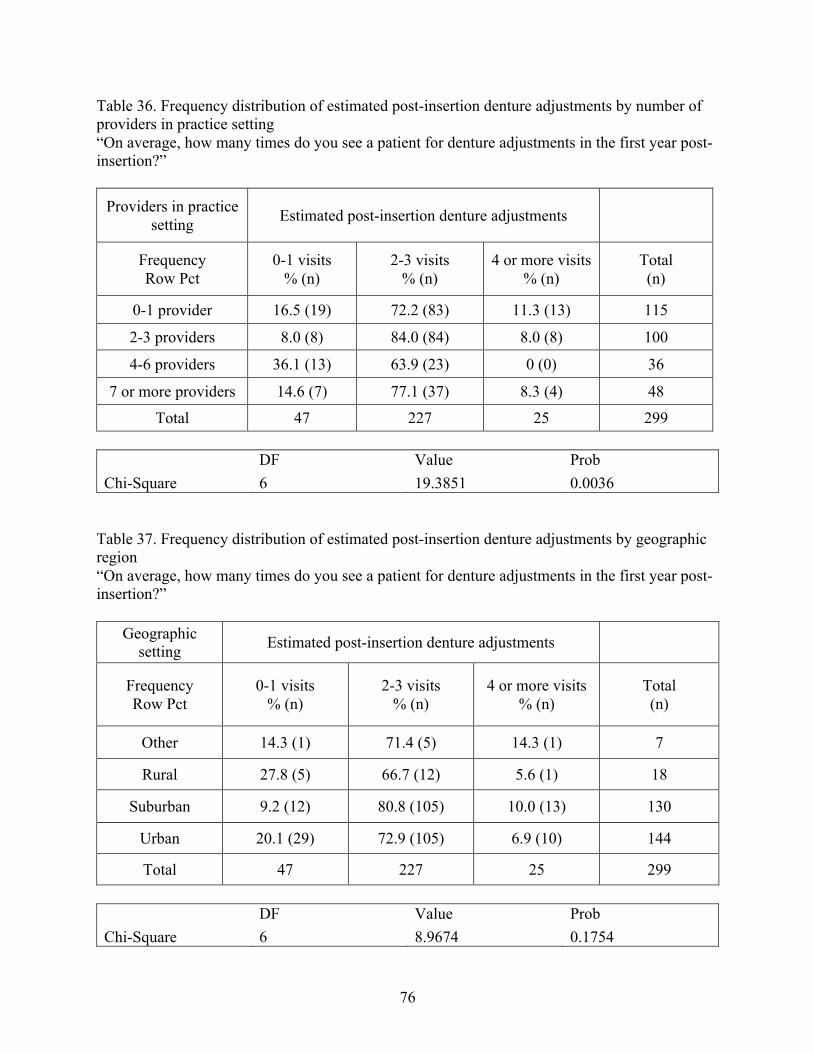
76
Table 36. Frequency distribution of estimated post-insertion denture adjustments by number of providers in practice setting “On average, how many times do you see a patient for denture adjustments in the first year post-insertion?”
Providers in practice setting Estimated post-insertion denture adjustments
Frequency Row Pct
0-1 visits % (n)
2-3 visits % (n)
4 or more visits % (n)
Total (n)
0-1 provider 16.5 (19) 72.2 (83) 11.3 (13) 115
2-3 providers 8.0 (8) 84.0 (84) 8.0 (8) 100
4-6 providers 36.1 (13) 63.9 (23) 0 (0) 36
7 or more providers 14.6 (7) 77.1 (37) 8.3 (4) 48
Total 47 227 25 299 DF Value Prob Chi-Square 6 19.3851 0.0036
Table 37. Frequency distribution of estimated post-insertion denture adjustments by geographic region “On average, how many times do you see a patient for denture adjustments in the first year post-insertion?”
Geographic setting Estimated post-insertion denture adjustments
Frequency Row Pct
0-1 visits % (n)
2-3 visits % (n)
4 or more visits % (n)
Total (n)
Other 14.3 (1) 71.4 (5) 14.3 (1) 7
Rural 27.8 (5) 66.7 (12) 5.6 (1) 18
Suburban 9.2 (12) 80.8 (105) 10.0 (13) 130
Urban 20.1 (29) 72.9 (105) 6.9 (10) 144
Total 47 227 25 299 DF Value Prob Chi-Square 6 8.9674 0.1754
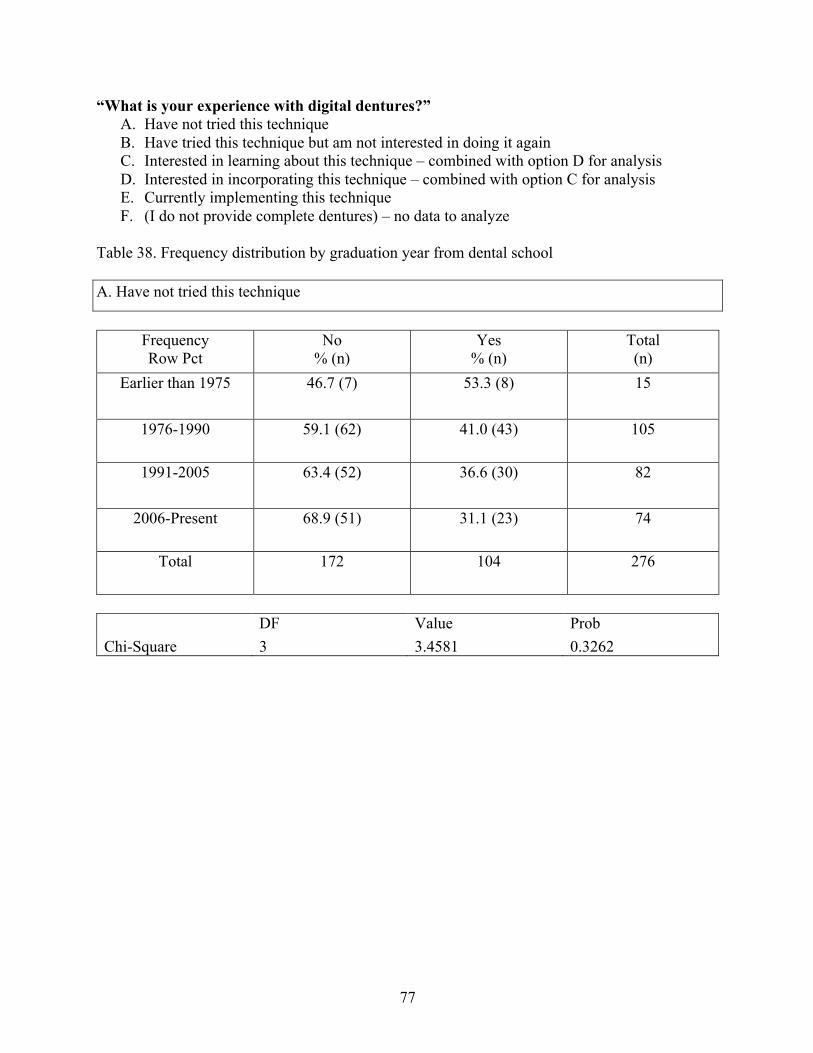
77
“What is your experience with digital dentures?” A. Have not tried this technique B. Have tried this technique but am not interested in doing it again C. Interested in learning about this technique – combined with option D for analysis D. Interested in incorporating this technique – combined with option C for analysis E. Currently implementing this technique F. (I do not provide complete dentures) – no data to analyze
Table 38. Frequency distribution by graduation year from dental school A. Have not tried this technique
Frequency Row Pct
No % (n)
Yes % (n)
Total (n)
Earlier than 1975 46.7 (7) 53.3 (8) 15
1976-1990 59.1 (62) 41.0 (43) 105
1991-2005 63.4 (52) 36.6 (30) 82
2006-Present 68.9 (51) 31.1 (23) 74
Total 172 104 276
DF Value Prob Chi-Square 3 3.4581 0.3262
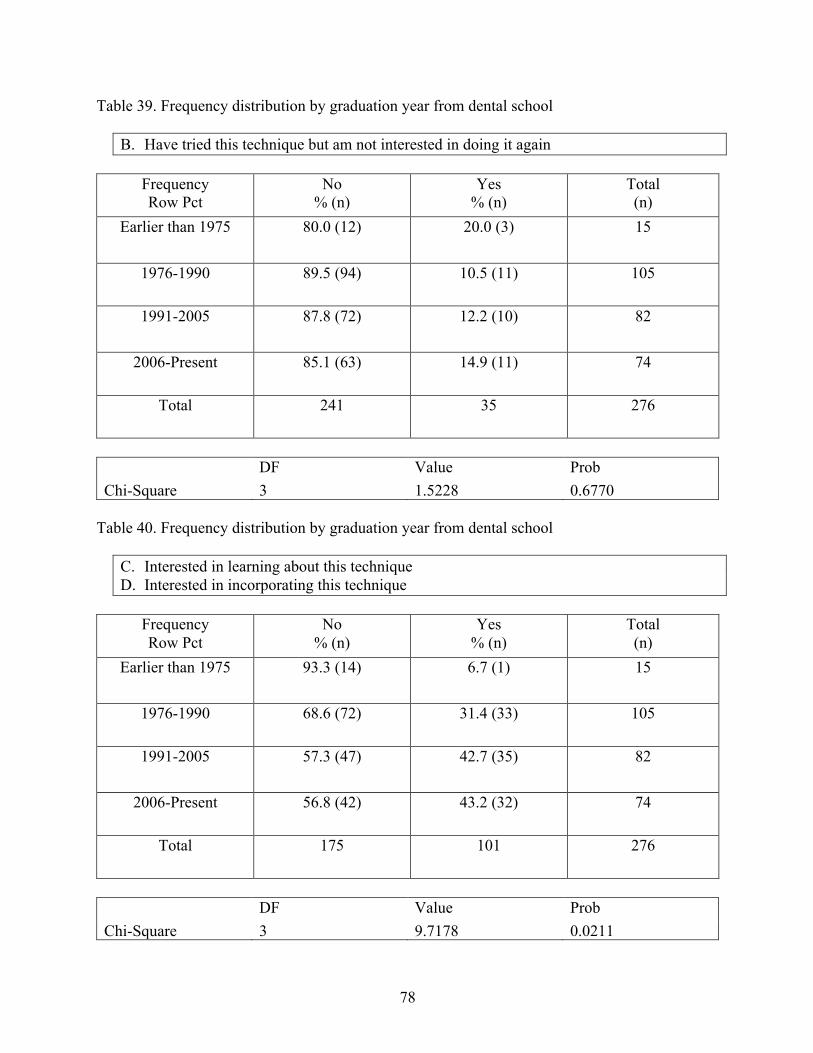
78
Table 39. Frequency distribution by graduation year from dental school
B. Have tried this technique but am not interested in doing it again
Frequency Row Pct
No % (n)
Yes % (n)
Total (n)
Earlier than 1975 80.0 (12) 20.0 (3) 15
1976-1990 89.5 (94) 10.5 (11) 105
1991-2005 87.8 (72) 12.2 (10) 82
2006-Present 85.1 (63) 14.9 (11) 74
Total 241 35 276
DF Value Prob Chi-Square 3 1.5228 0.6770
Table 40. Frequency distribution by graduation year from dental school
C. Interested in learning about this technique D. Interested in incorporating this technique
Frequency Row Pct
No % (n)
Yes % (n)
Total (n)
Earlier than 1975 93.3 (14) 6.7 (1) 15
1976-1990 68.6 (72) 31.4 (33) 105
1991-2005 57.3 (47) 42.7 (35) 82
2006-Present 56.8 (42) 43.2 (32) 74
Total 175 101 276
DF Value Prob Chi-Square 3 9.7178 0.0211
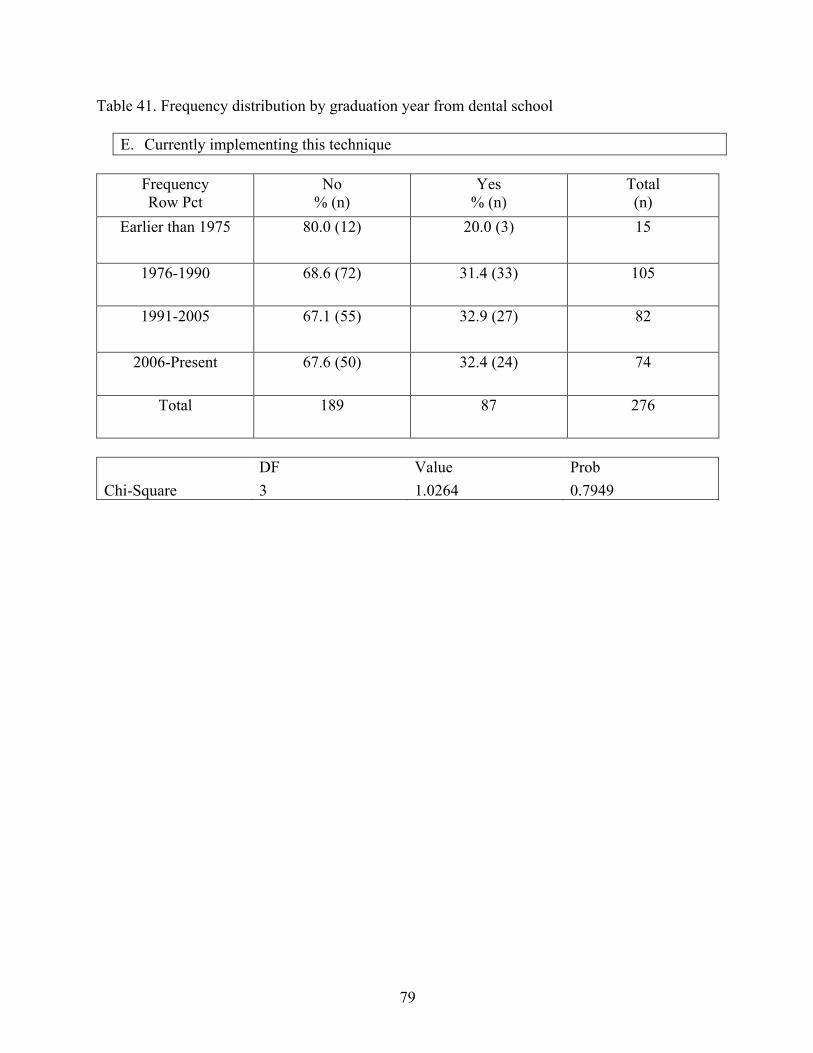
79
Table 41. Frequency distribution by graduation year from dental school
E. Currently implementing this technique
Frequency Row Pct
No % (n)
Yes % (n)
Total (n)
Earlier than 1975 80.0 (12) 20.0 (3) 15
1976-1990 68.6 (72) 31.4 (33) 105
1991-2005 67.1 (55) 32.9 (27) 82
2006-Present 67.6 (50) 32.4 (24) 74
Total 189 87 276
DF Value Prob Chi-Square 3 1.0264 0.7949

80
Table 42. Frequency distribution of experience with digital dentures by average length of complete denture appointments
A. Have not tried this technique
Average appointment length Have not tried this technique
Frequency Row Pct
No % (n)
Yes % (n)
Total (n)
30 minutes or less 65.2 (43) 34.9 (23) 66
1 hour 54.7 (58) 45.3 (48) 106
1.5 hours 68.8 (11) 31.3 (5) 16
2 or more hours 75.0 (6) 25.0 (2) 8
Total 118 78 196
DF Value Prob Chi-Square 3 3.2251 0.3582
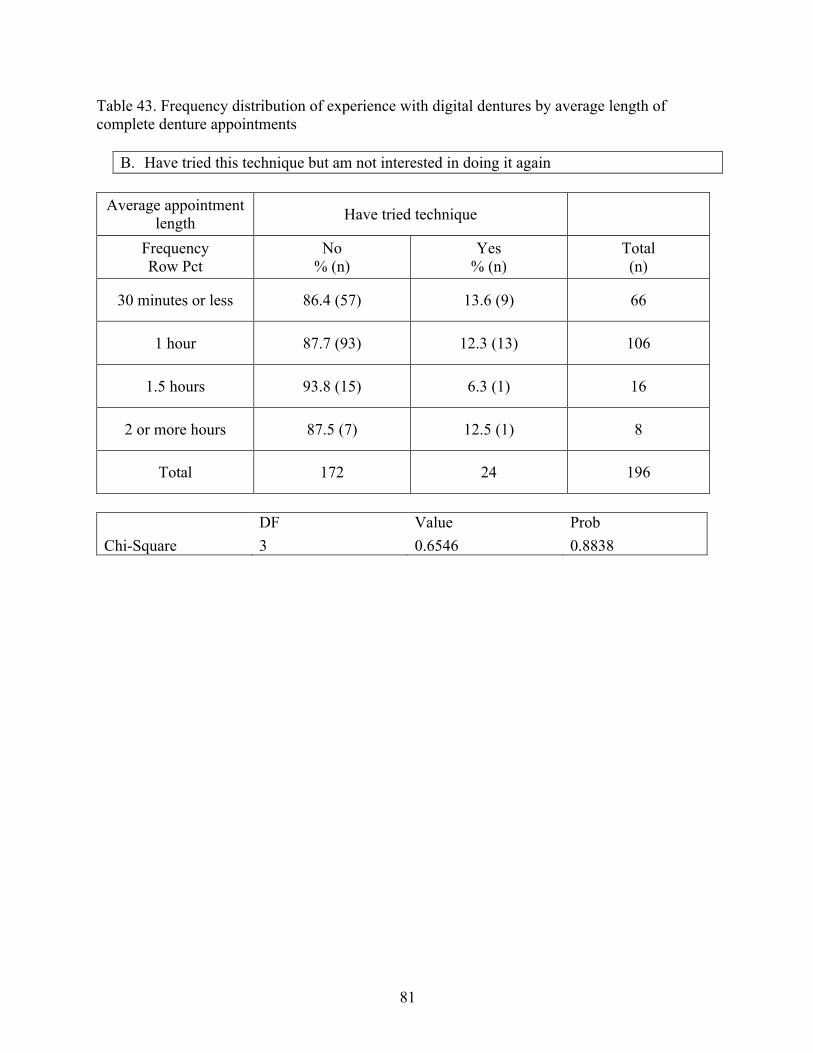
81
Table 43. Frequency distribution of experience with digital dentures by average length of complete denture appointments
B. Have tried this technique but am not interested in doing it again
Average appointment length Have tried technique
Frequency Row Pct
No % (n)
Yes % (n)
Total (n)
30 minutes or less 86.4 (57) 13.6 (9) 66
1 hour 87.7 (93) 12.3 (13) 106
1.5 hours 93.8 (15) 6.3 (1) 16
2 or more hours 87.5 (7) 12.5 (1) 8
Total 172 24 196
DF Value Prob Chi-Square 3 0.6546 0.8838
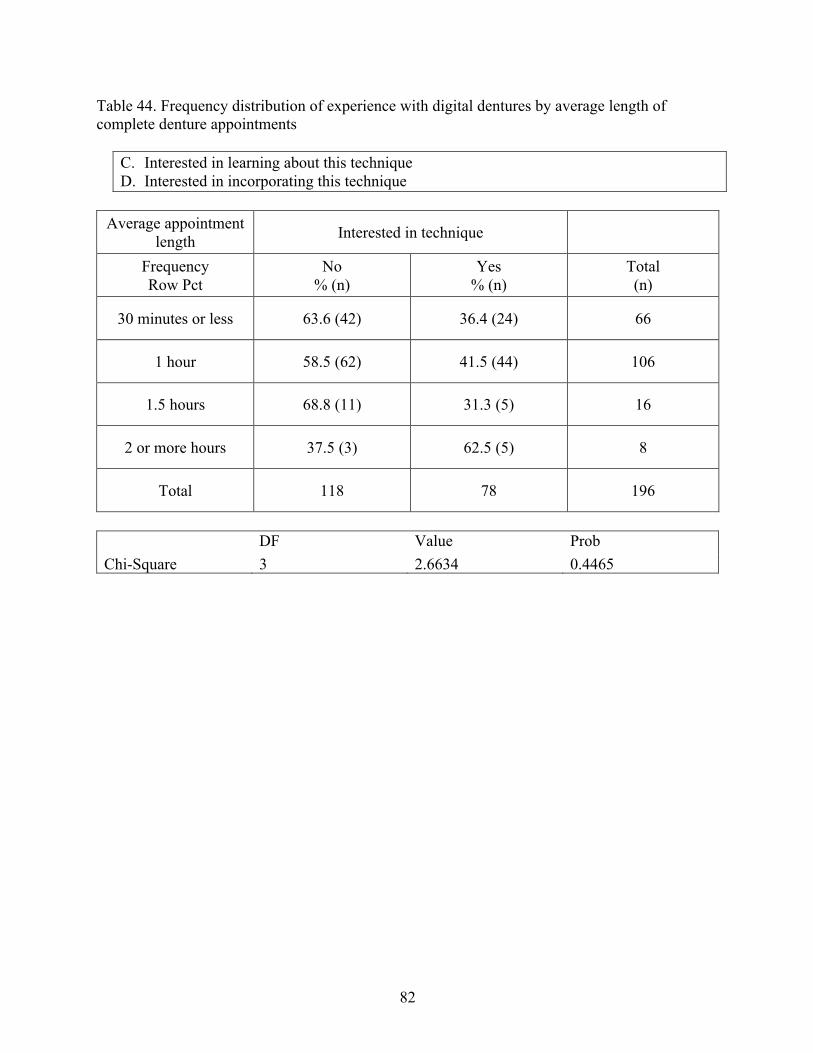
82
Table 44. Frequency distribution of experience with digital dentures by average length of complete denture appointments
C. Interested in learning about this technique D. Interested in incorporating this technique
Average appointment
length Interested in technique
Frequency Row Pct
No % (n)
Yes % (n)
Total (n)
30 minutes or less 63.6 (42) 36.4 (24) 66
1 hour 58.5 (62) 41.5 (44) 106
1.5 hours 68.8 (11) 31.3 (5) 16
2 or more hours 37.5 (3) 62.5 (5) 8
Total 118 78 196
DF Value Prob Chi-Square 3 2.6634 0.4465
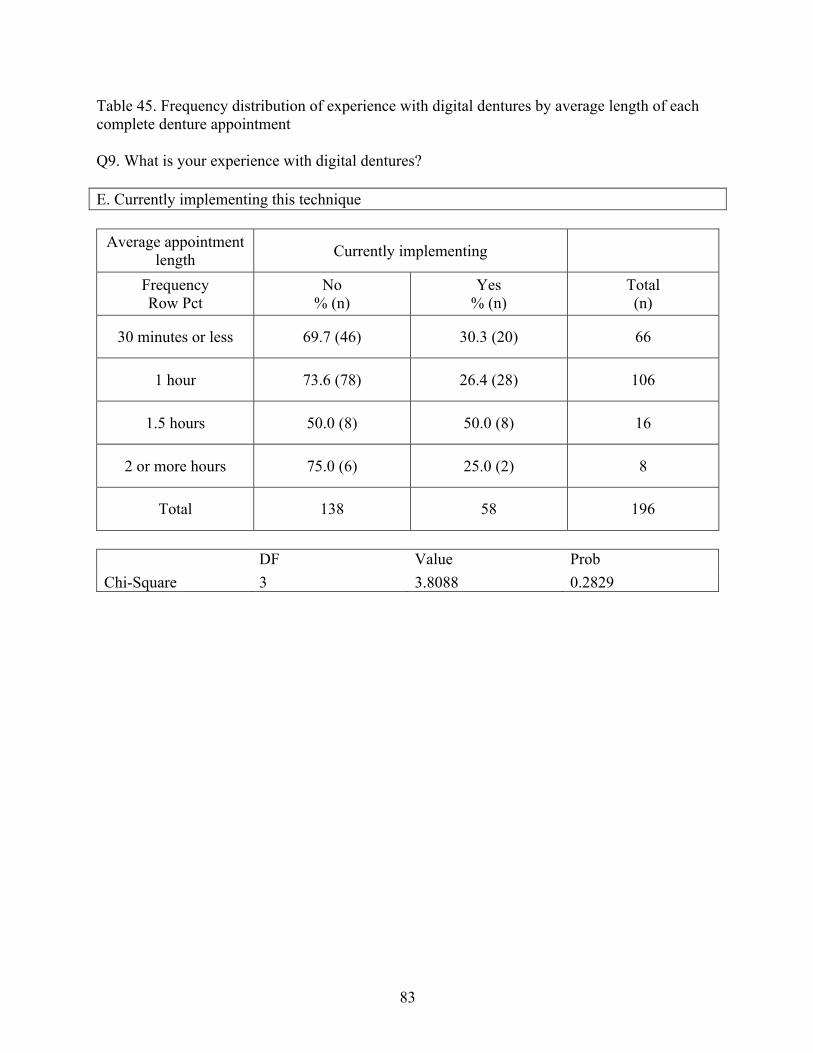
83
Table 45. Frequency distribution of experience with digital dentures by average length of each complete denture appointment Q9. What is your experience with digital dentures? E. Currently implementing this technique
Average appointment
length Currently implementing
Frequency Row Pct
No % (n)
Yes % (n)
Total (n)
30 minutes or less 69.7 (46) 30.3 (20) 66
1 hour 73.6 (78) 26.4 (28) 106
1.5 hours 50.0 (8) 50.0 (8) 16
2 or more hours 75.0 (6) 25.0 (2) 8
Total 138 58 196
DF Value Prob Chi-Square 3 3.8088 0.2829
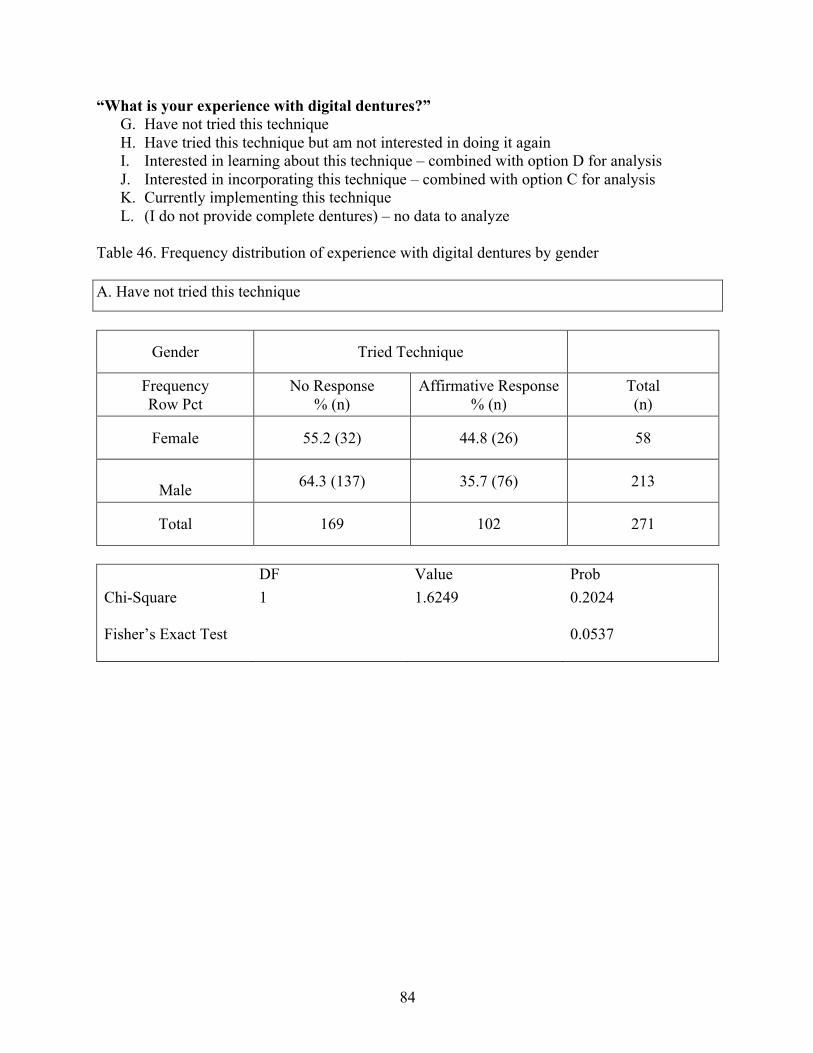
84
“What is your experience with digital dentures?” G. Have not tried this technique H. Have tried this technique but am not interested in doing it again I. Interested in learning about this technique – combined with option D for analysis J. Interested in incorporating this technique – combined with option C for analysis K. Currently implementing this technique L. (I do not provide complete dentures) – no data to analyze
Table 46. Frequency distribution of experience with digital dentures by gender A. Have not tried this technique
Gender Tried Technique
Frequency Row Pct
No Response % (n)
Affirmative Response % (n)
Total (n)
Female 55.2 (32) 44.8 (26) 58
Male 64.3 (137) 35.7 (76) 213
Total 169 102 271
DF Value Prob Chi-Square Fisher’s Exact Test
1 1.6249 0.2024 0.0537
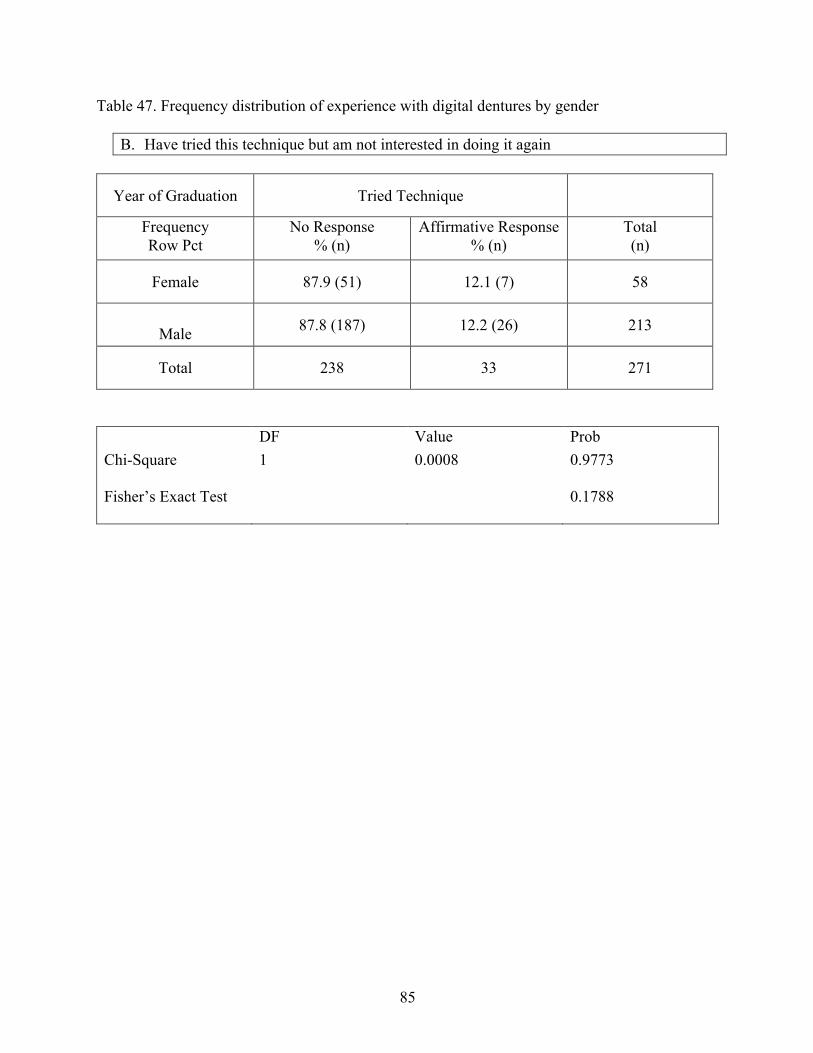
85
Table 47. Frequency distribution of experience with digital dentures by gender
B. Have tried this technique but am not interested in doing it again
Year of Graduation Tried Technique
Frequency Row Pct
No Response % (n)
Affirmative Response % (n)
Total (n)
Female 87.9 (51) 12.1 (7) 58
Male 87.8 (187) 12.2 (26) 213
Total 238 33 271
DF Value Prob Chi-Square Fisher’s Exact Test
1 0.0008 0.9773 0.1788
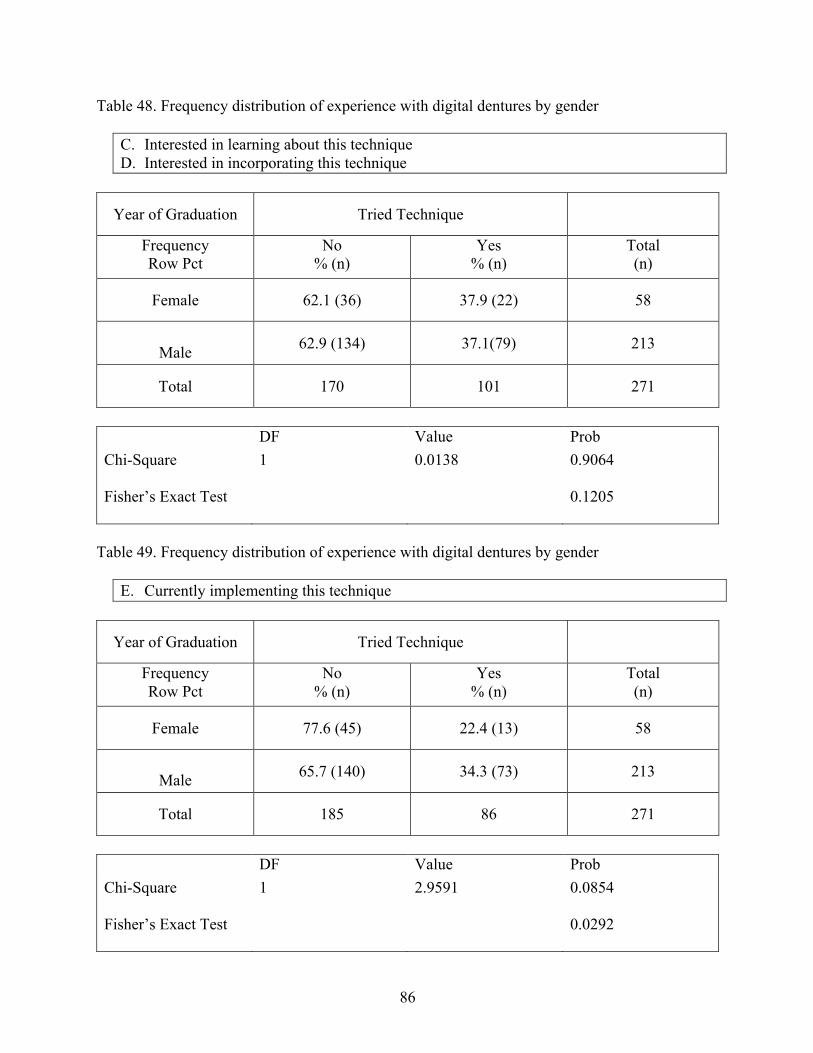
86
Table 48. Frequency distribution of experience with digital dentures by gender
C. Interested in learning about this technique D. Interested in incorporating this technique
Year of Graduation Tried Technique
Frequency Row Pct
No % (n)
Yes % (n)
Total (n)
Female 62.1 (36) 37.9 (22) 58
Male 62.9 (134) 37.1(79) 213
Total 170 101 271
DF Value Prob Chi-Square Fisher’s Exact Test
1 0.0138 0.9064 0.1205
Table 49. Frequency distribution of experience with digital dentures by gender
E. Currently implementing this technique
Year of Graduation Tried Technique
Frequency Row Pct
No % (n)
Yes % (n)
Total (n)
Female 77.6 (45) 22.4 (13) 58
Male 65.7 (140) 34.3 (73) 213
Total 185 86 271
DF Value Prob Chi-Square Fisher’s Exact Test
1 2.9591 0.0854 0.0292
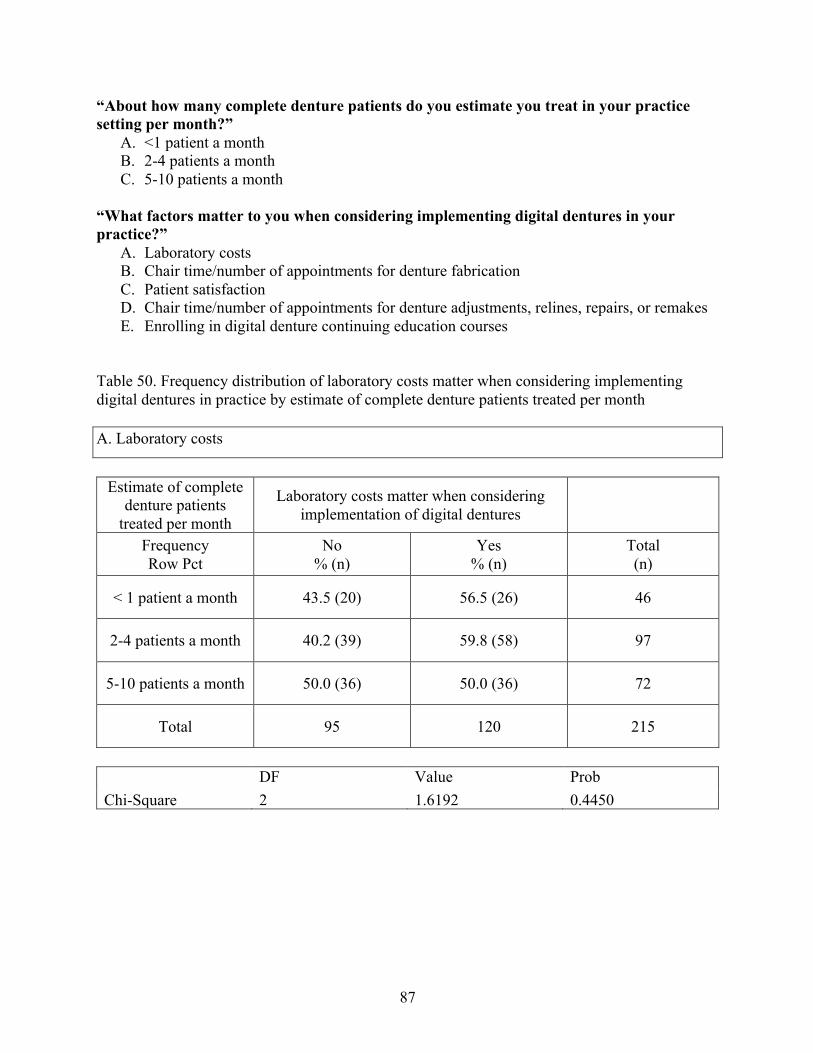
87
“About how many complete denture patients do you estimate you treat in your practice setting per month?”
A. <1 patient a month B. 2-4 patients a month C. 5-10 patients a month
“What factors matter to you when considering implementing digital dentures in your practice?”
A. Laboratory costs B. Chair time/number of appointments for denture fabrication C. Patient satisfaction D. Chair time/number of appointments for denture adjustments, relines, repairs, or remakes E. Enrolling in digital denture continuing education courses
Table 50. Frequency distribution of laboratory costs matter when considering implementing digital dentures in practice by estimate of complete denture patients treated per month A. Laboratory costs
Estimate of complete
denture patients treated per month
Laboratory costs matter when considering implementation of digital dentures
Frequency Row Pct
No % (n)
Yes % (n)
Total (n)
< 1 patient a month 43.5 (20) 56.5 (26) 46
2-4 patients a month 40.2 (39) 59.8 (58) 97
5-10 patients a month 50.0 (36) 50.0 (36) 72
Total 95 120 215
DF Value Prob Chi-Square 2 1.6192 0.4450
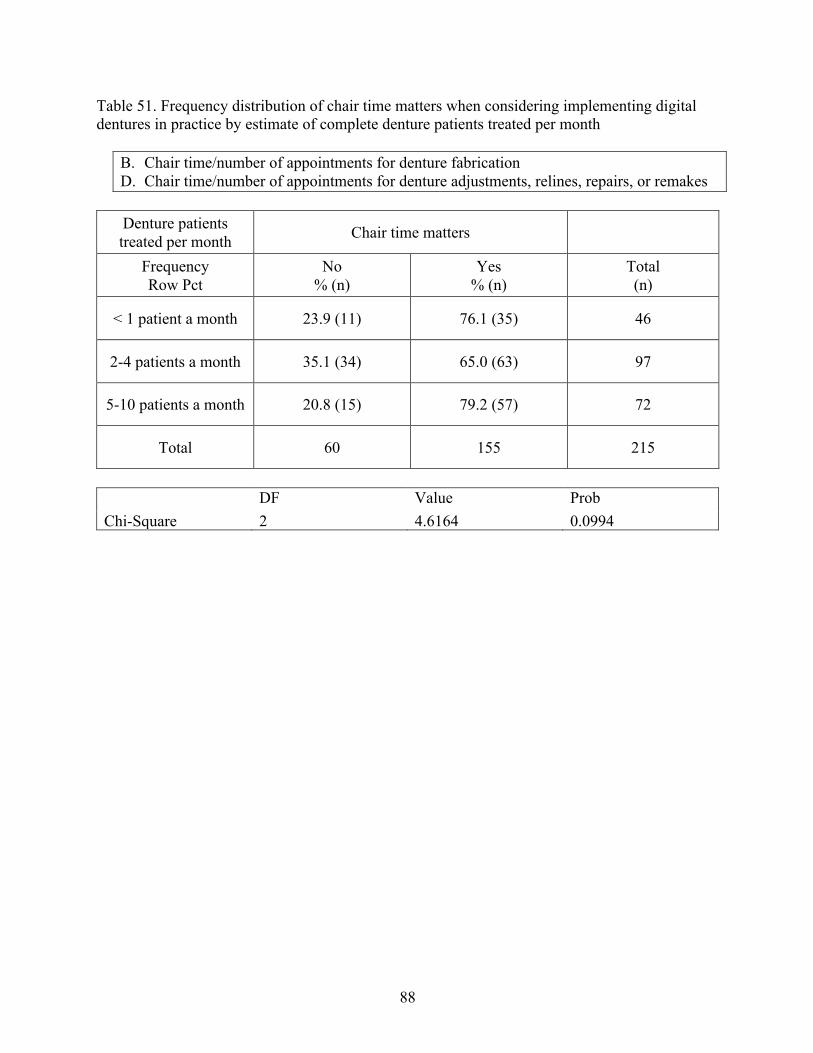
88
Table 51. Frequency distribution of chair time matters when considering implementing digital dentures in practice by estimate of complete denture patients treated per month
B. Chair time/number of appointments for denture fabrication D. Chair time/number of appointments for denture adjustments, relines, repairs, or remakes
Denture patients treated per month Chair time matters
Frequency Row Pct
No % (n)
Yes % (n)
Total (n)
< 1 patient a month 23.9 (11) 76.1 (35) 46
2-4 patients a month 35.1 (34) 65.0 (63) 97
5-10 patients a month 20.8 (15) 79.2 (57) 72
Total 60 155 215
DF Value Prob Chi-Square 2 4.6164 0.0994
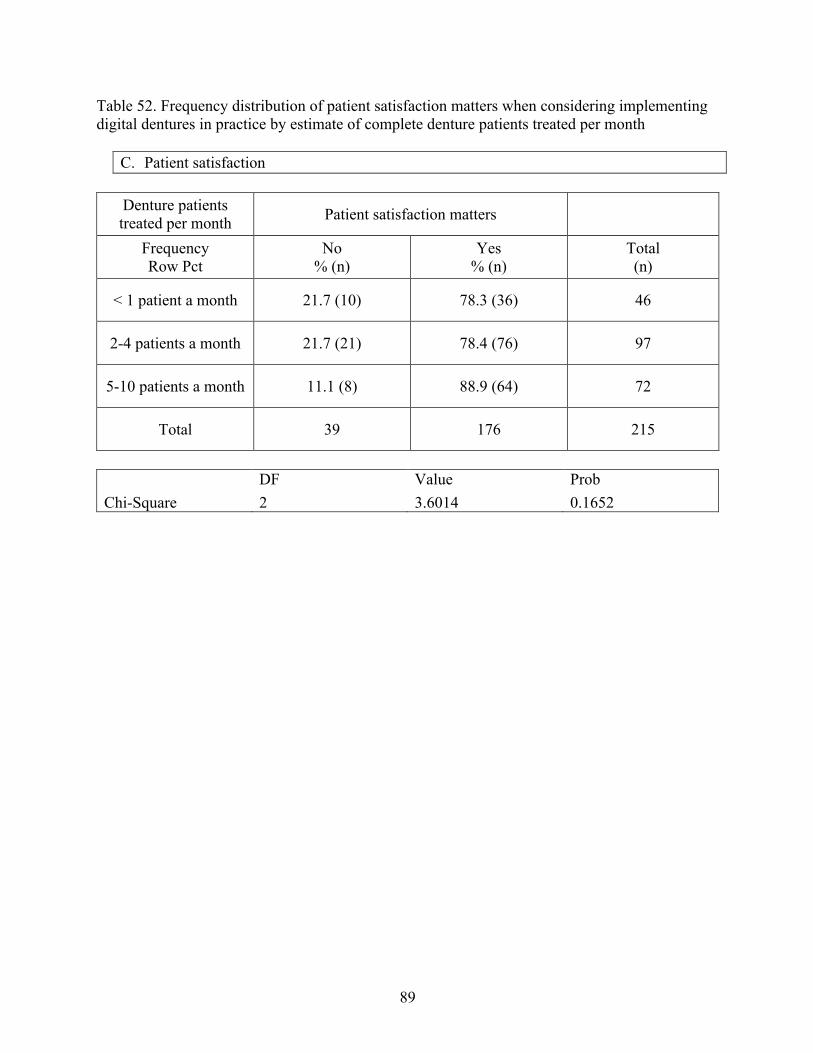
89
Table 52. Frequency distribution of patient satisfaction matters when considering implementing digital dentures in practice by estimate of complete denture patients treated per month
C. Patient satisfaction
Denture patients treated per month Patient satisfaction matters
Frequency Row Pct
No % (n)
Yes % (n)
Total (n)
< 1 patient a month 21.7 (10) 78.3 (36) 46
2-4 patients a month 21.7 (21) 78.4 (76) 97
5-10 patients a month 11.1 (8) 88.9 (64) 72
Total 39 176 215
DF Value Prob Chi-Square 2 3.6014 0.1652
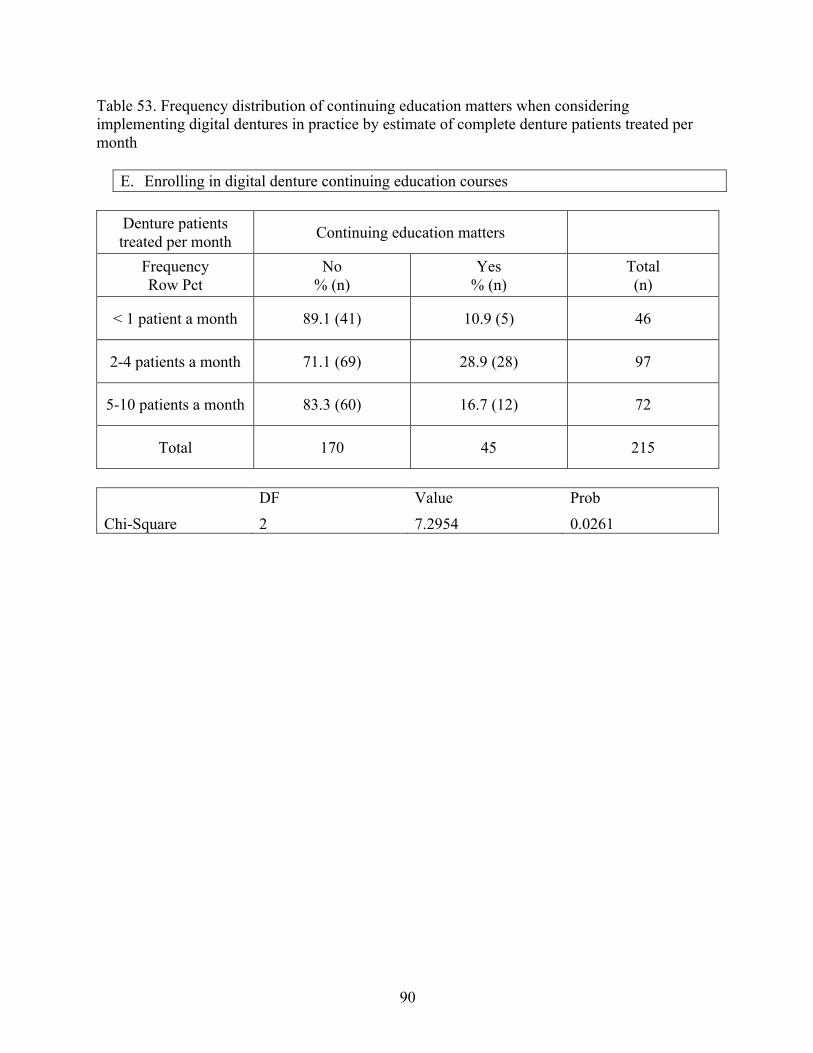
90
Table 53. Frequency distribution of continuing education matters when considering implementing digital dentures in practice by estimate of complete denture patients treated per month
E. Enrolling in digital denture continuing education courses
Denture patients treated per month Continuing education matters
Frequency Row Pct
No % (n)
Yes % (n)
Total (n)
< 1 patient a month 89.1 (41) 10.9 (5) 46
2-4 patients a month 71.1 (69) 28.9 (28) 97
5-10 patients a month 83.3 (60) 16.7 (12) 72
Total 170 45 215
DF Value Prob Chi-Square 2 7.2954 0.0261
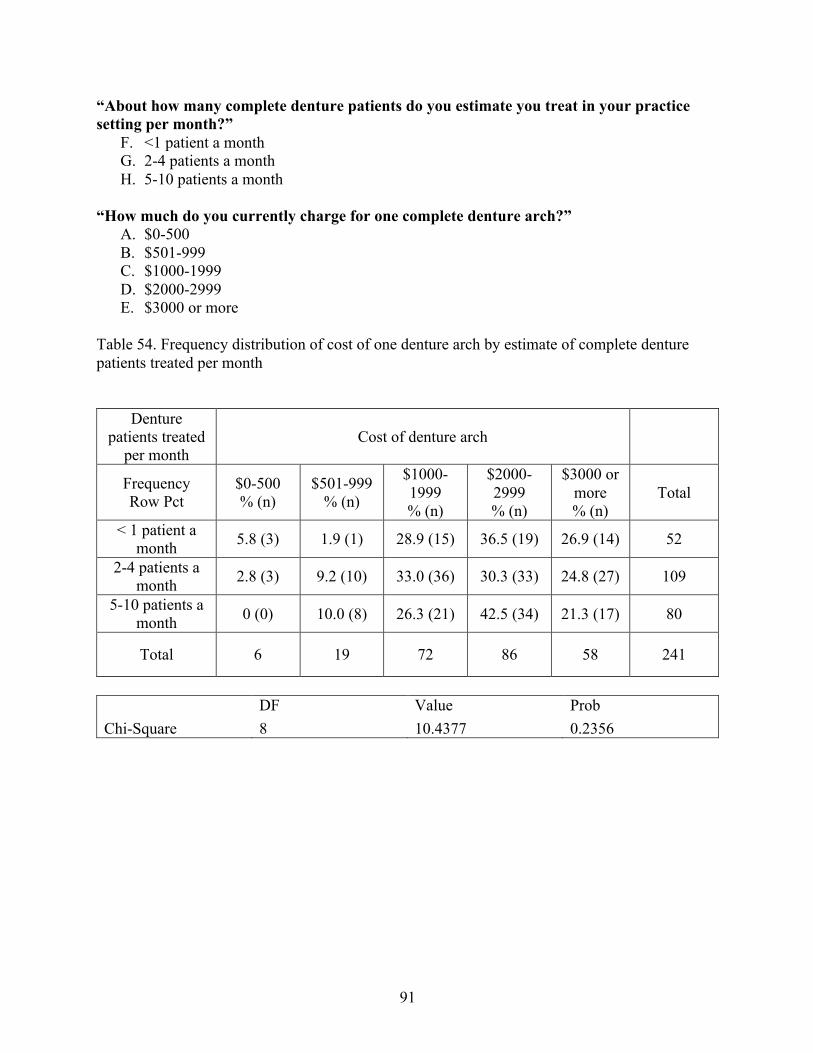
91
“About how many complete denture patients do you estimate you treat in your practice setting per month?”
F. <1 patient a month G. 2-4 patients a month H. 5-10 patients a month
“How much do you currently charge for one complete denture arch?”
A. $0-500 B. $501-999 C. $1000-1999 D. $2000-2999 E. $3000 or more
Table 54. Frequency distribution of cost of one denture arch by estimate of complete denture patients treated per month
Denture patients treated
per month Cost of denture arch
Frequency Row Pct
$0-500 % (n)
$501-999 % (n)
$1000-1999 % (n)
$2000-2999 % (n)
$3000 or more % (n)
Total
< 1 patient a month 5.8 (3) 1.9 (1) 28.9 (15) 36.5 (19) 26.9 (14) 52
2-4 patients a month 2.8 (3) 9.2 (10) 33.0 (36) 30.3 (33) 24.8 (27) 109
5-10 patients a month 0 (0) 10.0 (8) 26.3 (21) 42.5 (34) 21.3 (17) 80
Total 6 19 72 86 58 241
DF Value Prob Chi-Square 8 10.4377 0.2356
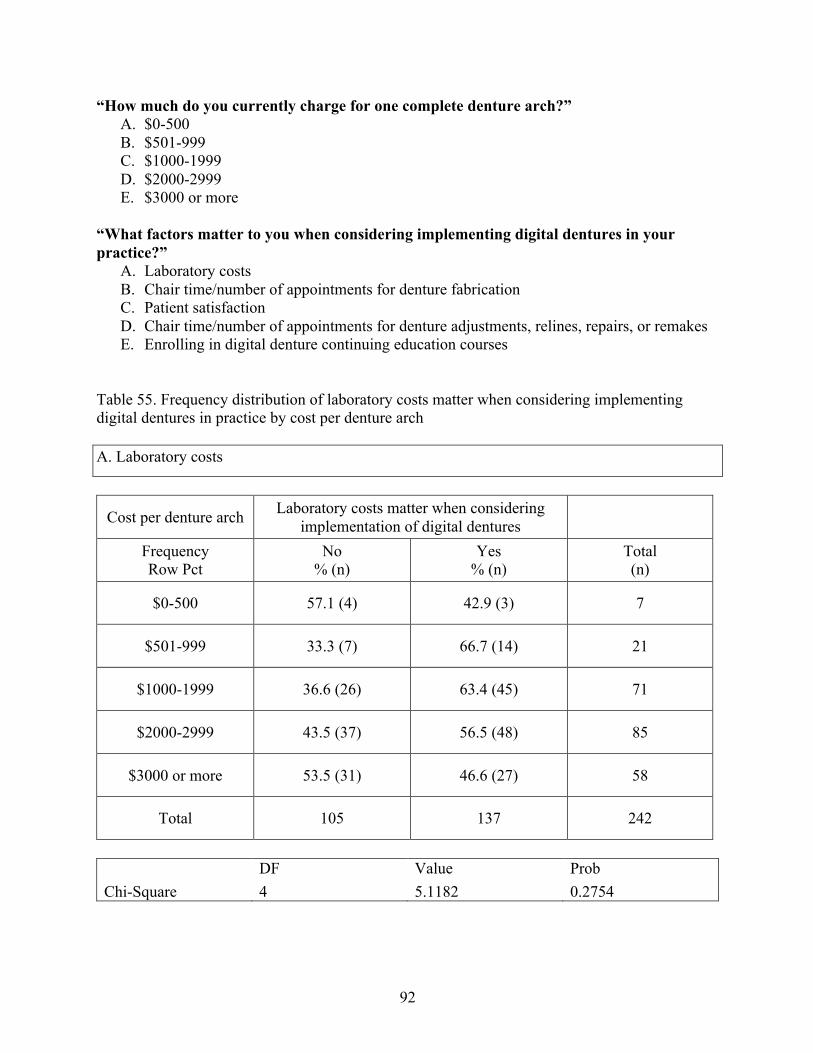
92
“How much do you currently charge for one complete denture arch?” A. $0-500 B. $501-999 C. $1000-1999 D. $2000-2999 E. $3000 or more
“What factors matter to you when considering implementing digital dentures in your practice?”
A. Laboratory costs B. Chair time/number of appointments for denture fabrication C. Patient satisfaction D. Chair time/number of appointments for denture adjustments, relines, repairs, or remakes E. Enrolling in digital denture continuing education courses
Table 55. Frequency distribution of laboratory costs matter when considering implementing digital dentures in practice by cost per denture arch A. Laboratory costs
Cost per denture arch Laboratory costs matter when considering implementation of digital dentures
Frequency Row Pct
No % (n)
Yes % (n)
Total (n)
$0-500 57.1 (4) 42.9 (3) 7
$501-999 33.3 (7) 66.7 (14) 21
$1000-1999 36.6 (26) 63.4 (45) 71
$2000-2999 43.5 (37) 56.5 (48) 85
$3000 or more 53.5 (31) 46.6 (27) 58
Total 105 137 242
DF Value Prob Chi-Square 4 5.1182 0.2754
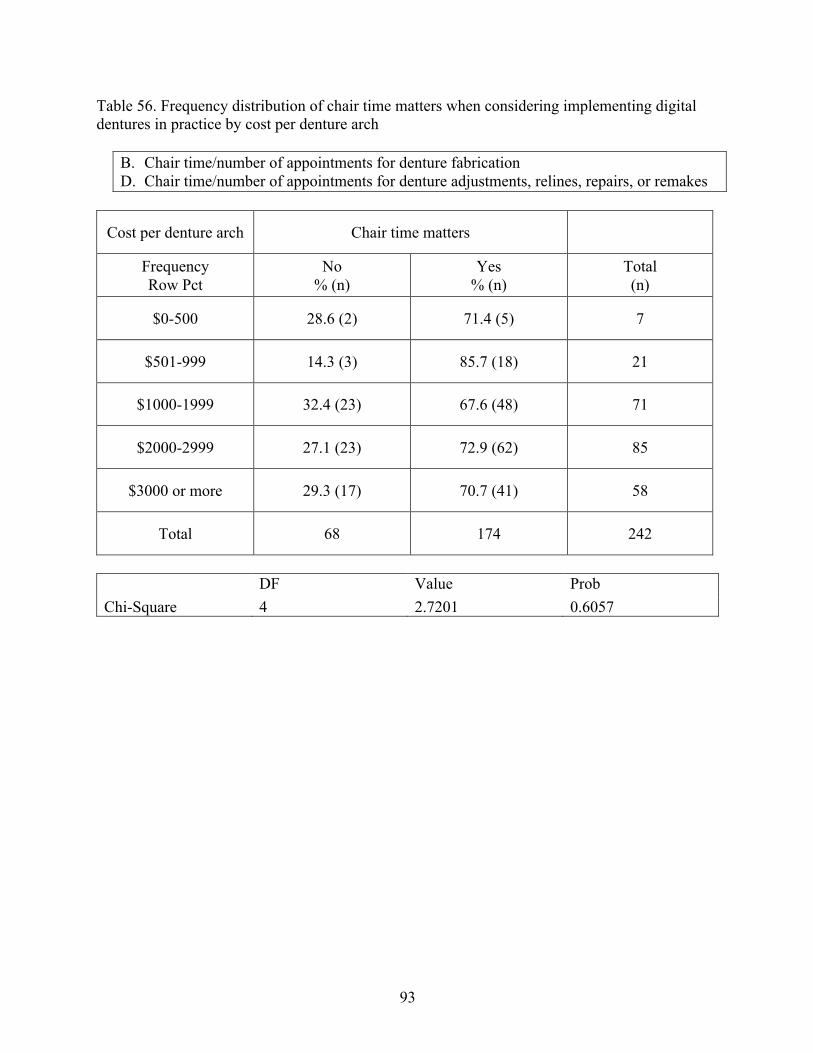
93
Table 56. Frequency distribution of chair time matters when considering implementing digital dentures in practice by cost per denture arch
B. Chair time/number of appointments for denture fabrication D. Chair time/number of appointments for denture adjustments, relines, repairs, or remakes
Cost per denture arch Chair time matters
Frequency Row Pct
No % (n)
Yes % (n)
Total (n)
$0-500 28.6 (2) 71.4 (5) 7
$501-999 14.3 (3) 85.7 (18) 21
$1000-1999 32.4 (23) 67.6 (48) 71
$2000-2999 27.1 (23) 72.9 (62) 85
$3000 or more 29.3 (17) 70.7 (41) 58
Total 68 174 242
DF Value Prob Chi-Square 4 2.7201 0.6057
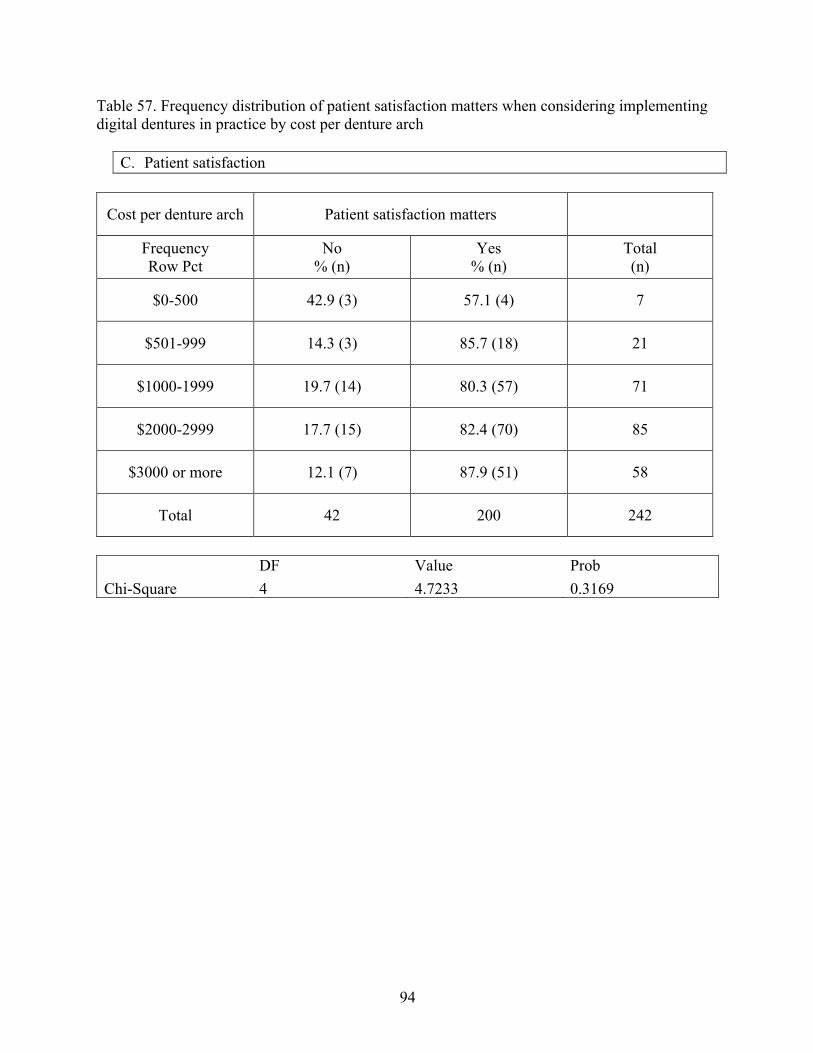
94
Table 57. Frequency distribution of patient satisfaction matters when considering implementing digital dentures in practice by cost per denture arch
C. Patient satisfaction
Cost per denture arch Patient satisfaction matters
Frequency Row Pct
No % (n)
Yes % (n)
Total (n)
$0-500 42.9 (3) 57.1 (4) 7
$501-999 14.3 (3) 85.7 (18) 21
$1000-1999 19.7 (14) 80.3 (57) 71
$2000-2999 17.7 (15) 82.4 (70) 85
$3000 or more 12.1 (7) 87.9 (51) 58
Total 42 200 242
DF Value Prob Chi-Square 4 4.7233 0.3169
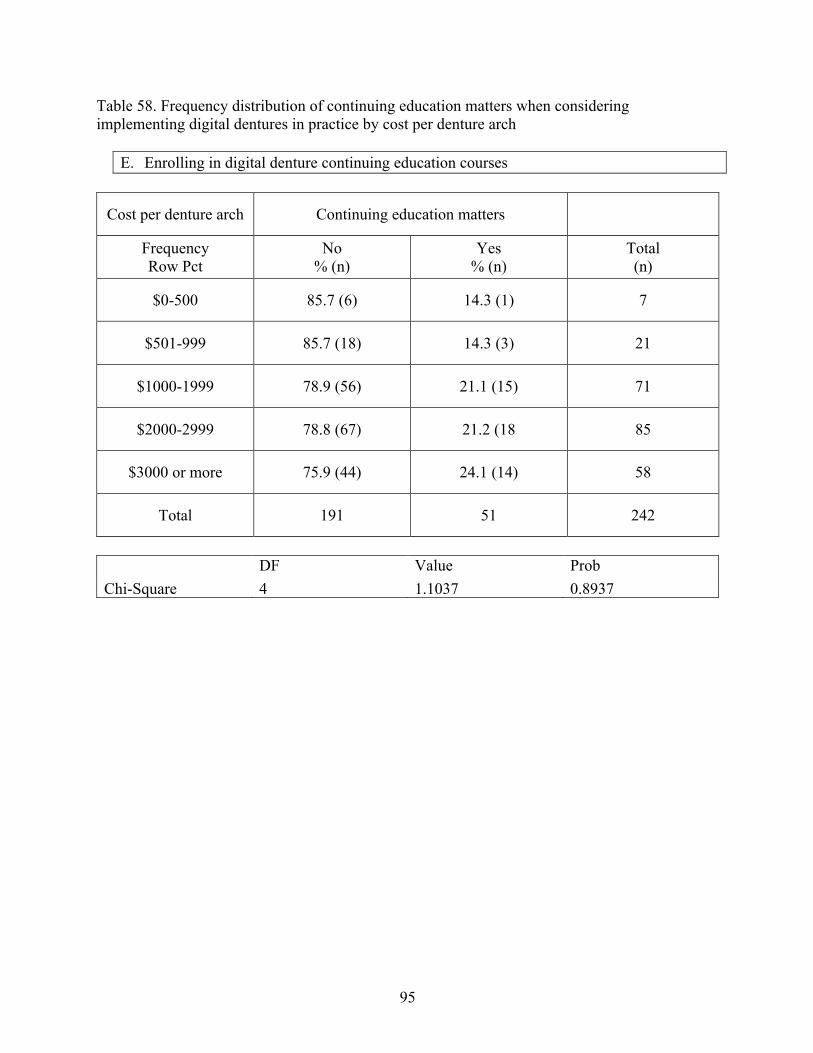
95
Table 58. Frequency distribution of continuing education matters when considering implementing digital dentures in practice by cost per denture arch
E. Enrolling in digital denture continuing education courses
Cost per denture arch Continuing education matters
Frequency Row Pct
No % (n)
Yes % (n)
Total (n)
$0-500 85.7 (6) 14.3 (1) 7
$501-999 85.7 (18) 14.3 (3) 21
$1000-1999 78.9 (56) 21.1 (15) 71
$2000-2999 78.8 (67) 21.2 (18 85
$3000 or more 75.9 (44) 24.1 (14) 58
Total 191 51 242
DF Value Prob Chi-Square 4 1.1037 0.8937
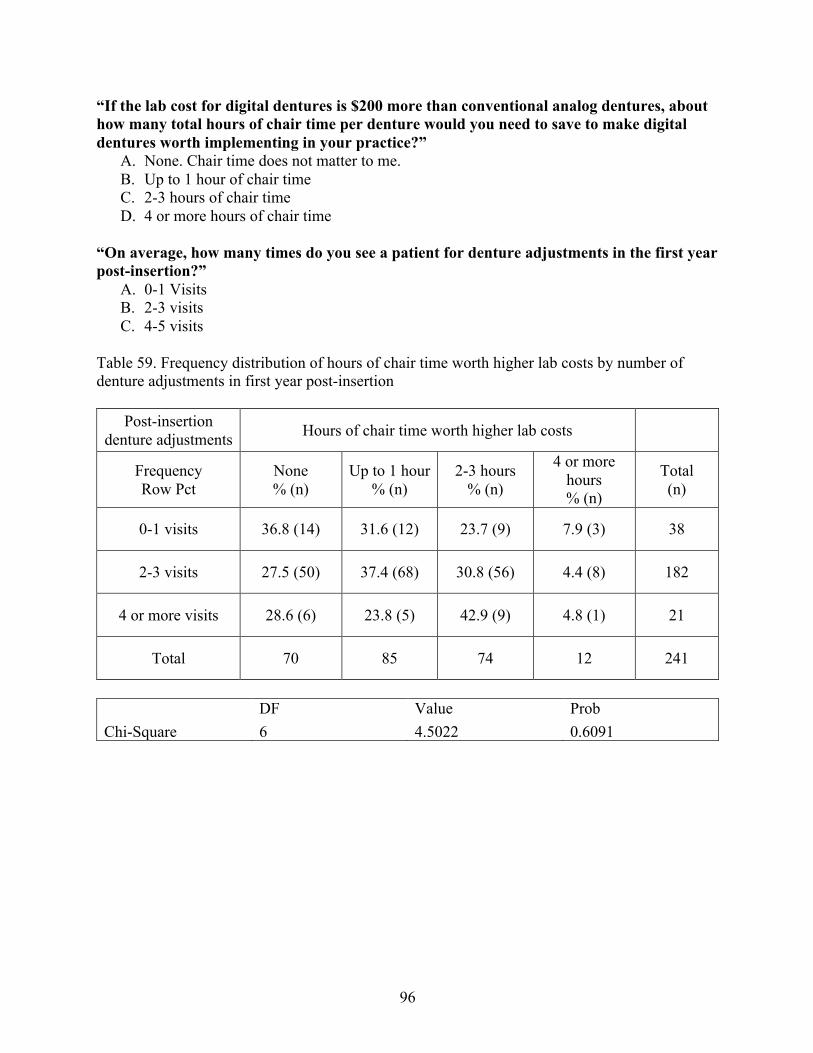
96
“If the lab cost for digital dentures is $200 more than conventional analog dentures, about how many total hours of chair time per denture would you need to save to make digital dentures worth implementing in your practice?”
A. None. Chair time does not matter to me. B. Up to 1 hour of chair time C. 2-3 hours of chair time D. 4 or more hours of chair time
“On average, how many times do you see a patient for denture adjustments in the first year post-insertion?”
A. 0-1 Visits B. 2-3 visits C. 4-5 visits
Table 59. Frequency distribution of hours of chair time worth higher lab costs by number of denture adjustments in first year post-insertion
Post-insertion denture adjustments Hours of chair time worth higher lab costs
Frequency Row Pct
None % (n)
Up to 1 hour % (n)
2-3 hours % (n)
4 or more hours % (n)
Total (n)
0-1 visits 36.8 (14) 31.6 (12) 23.7 (9) 7.9 (3) 38
2-3 visits 27.5 (50) 37.4 (68) 30.8 (56) 4.4 (8) 182
4 or more visits 28.6 (6) 23.8 (5) 42.9 (9) 4.8 (1) 21
Total 70 85 74 12 241
DF Value Prob Chi-Square 6 4.5022 0.6091
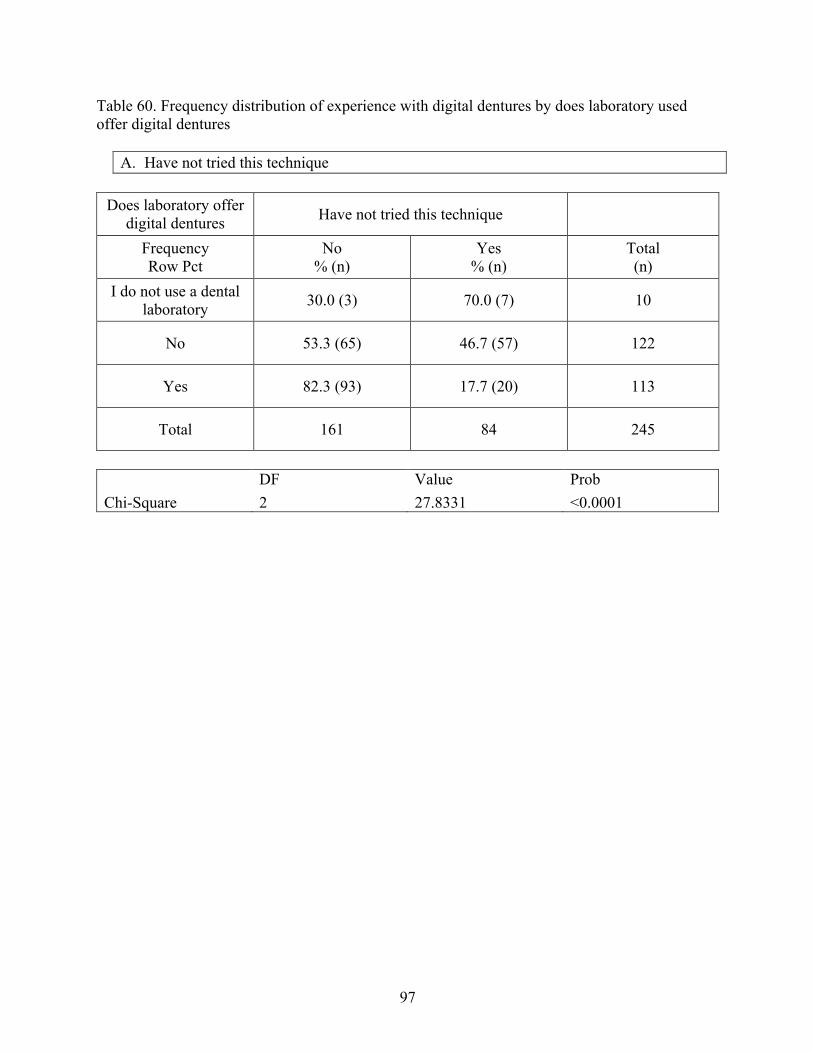
97
Table 60. Frequency distribution of experience with digital dentures by does laboratory used offer digital dentures
A. Have not tried this technique
Does laboratory offer digital dentures Have not tried this technique
Frequency Row Pct
No % (n)
Yes % (n)
Total (n)
I do not use a dental laboratory 30.0 (3) 70.0 (7) 10
No 53.3 (65) 46.7 (57) 122
Yes 82.3 (93) 17.7 (20) 113
Total 161 84 245
DF Value Prob Chi-Square 2 27.8331 <0.0001
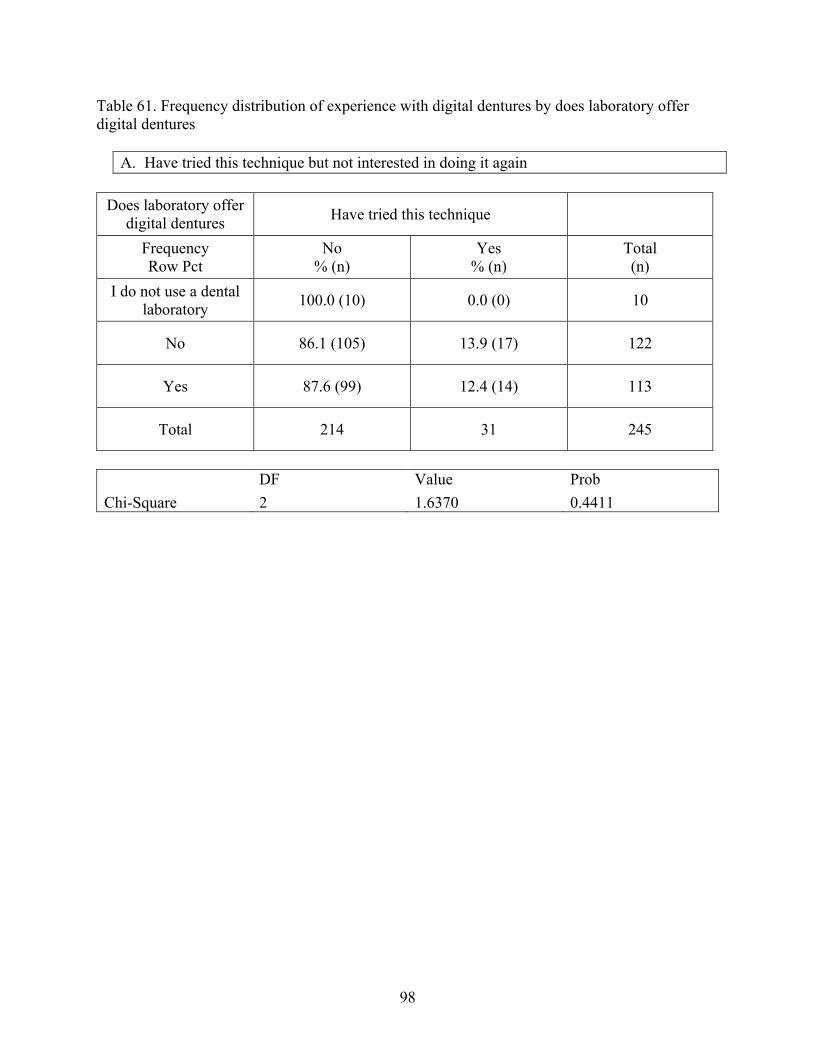
98
Table 61. Frequency distribution of experience with digital dentures by does laboratory offer digital dentures
A. Have tried this technique but not interested in doing it again
Does laboratory offer digital dentures Have tried this technique
Frequency Row Pct
No % (n)
Yes % (n)
Total (n)
I do not use a dental laboratory 100.0 (10) 0.0 (0) 10
No 86.1 (105) 13.9 (17) 122
Yes 87.6 (99) 12.4 (14) 113
Total 214 31 245
DF Value Prob Chi-Square 2 1.6370 0.4411
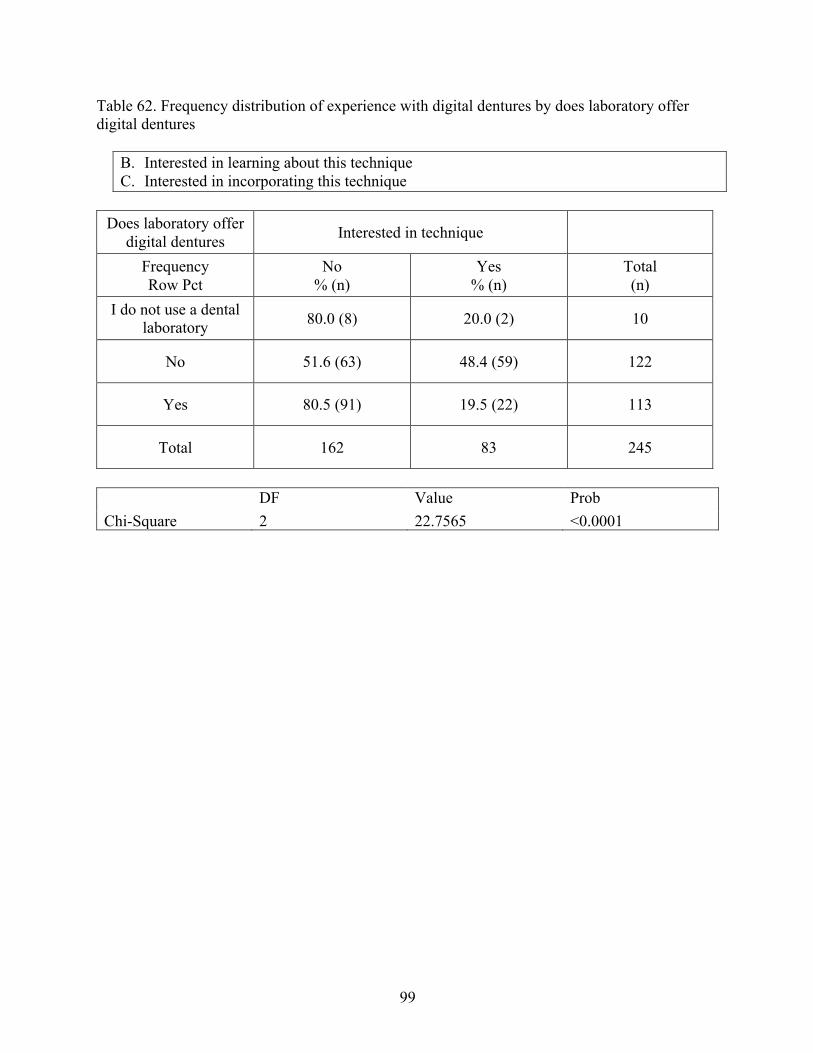
99
Table 62. Frequency distribution of experience with digital dentures by does laboratory offer digital dentures
B. Interested in learning about this technique C. Interested in incorporating this technique
Does laboratory offer
digital dentures Interested in technique
Frequency Row Pct
No % (n)
Yes % (n)
Total (n)
I do not use a dental laboratory 80.0 (8) 20.0 (2) 10
No 51.6 (63) 48.4 (59) 122
Yes 80.5 (91) 19.5 (22) 113
Total 162 83 245
DF Value Prob Chi-Square 2 22.7565 <0.0001
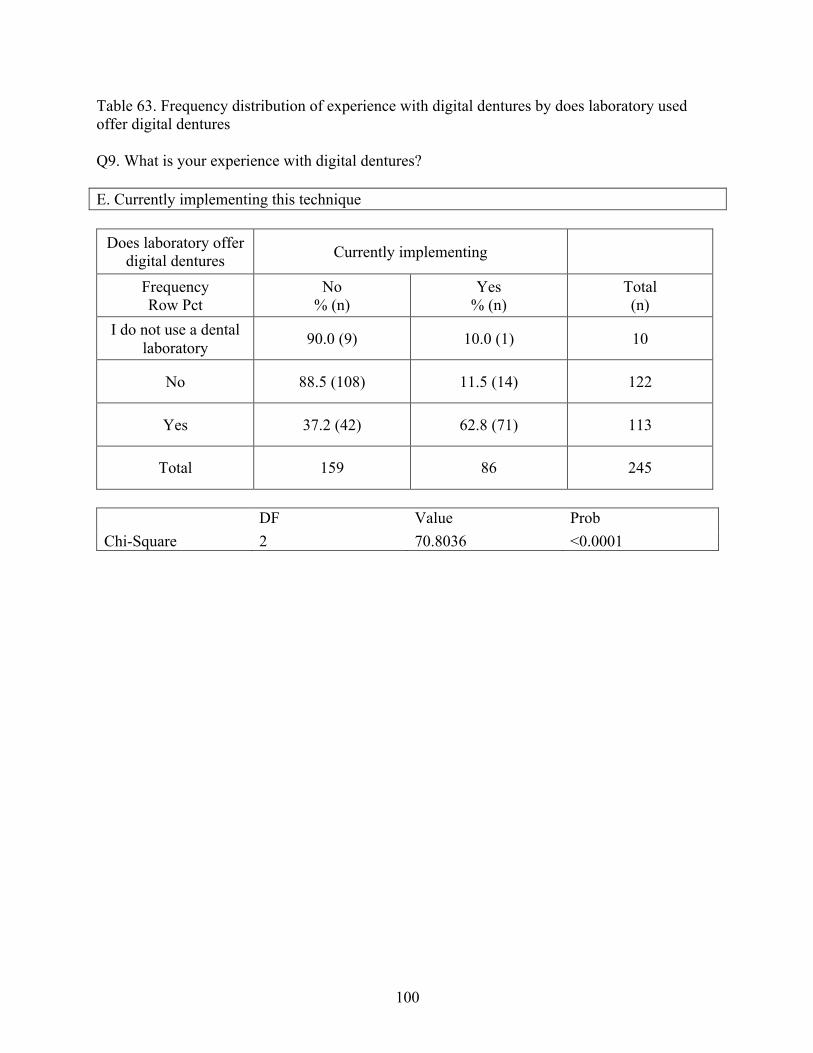
100
Table 63. Frequency distribution of experience with digital dentures by does laboratory used offer digital dentures Q9. What is your experience with digital dentures? E. Currently implementing this technique
Does laboratory offer
digital dentures Currently implementing
Frequency Row Pct
No % (n)
Yes % (n)
Total (n)
I do not use a dental laboratory 90.0 (9) 10.0 (1) 10
No 88.5 (108) 11.5 (14) 122
Yes 37.2 (42) 62.8 (71) 113
Total 159 86 245
DF Value Prob Chi-Square 2 70.8036 <0.0001
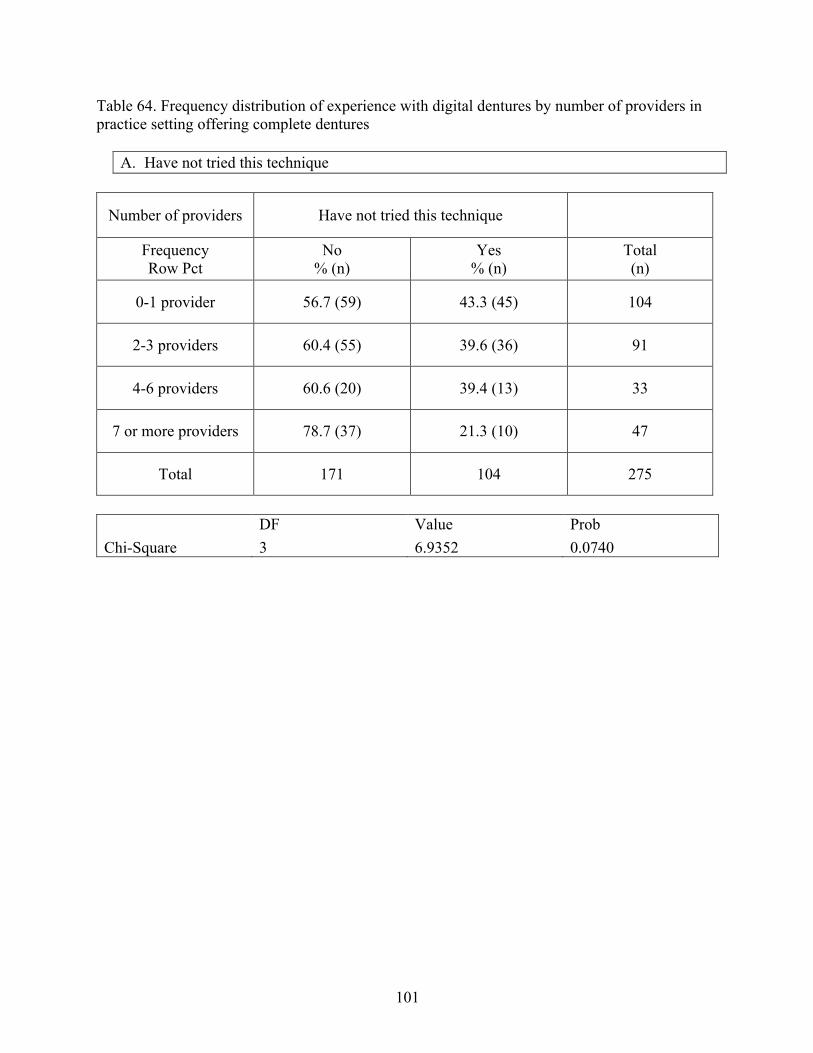
101
Table 64. Frequency distribution of experience with digital dentures by number of providers in practice setting offering complete dentures
A. Have not tried this technique
Number of providers Have not tried this technique
Frequency Row Pct
No % (n)
Yes % (n)
Total (n)
0-1 provider 56.7 (59) 43.3 (45) 104
2-3 providers 60.4 (55) 39.6 (36) 91
4-6 providers 60.6 (20) 39.4 (13) 33
7 or more providers 78.7 (37) 21.3 (10) 47
Total 171 104 275
DF Value Prob Chi-Square 3 6.9352 0.0740
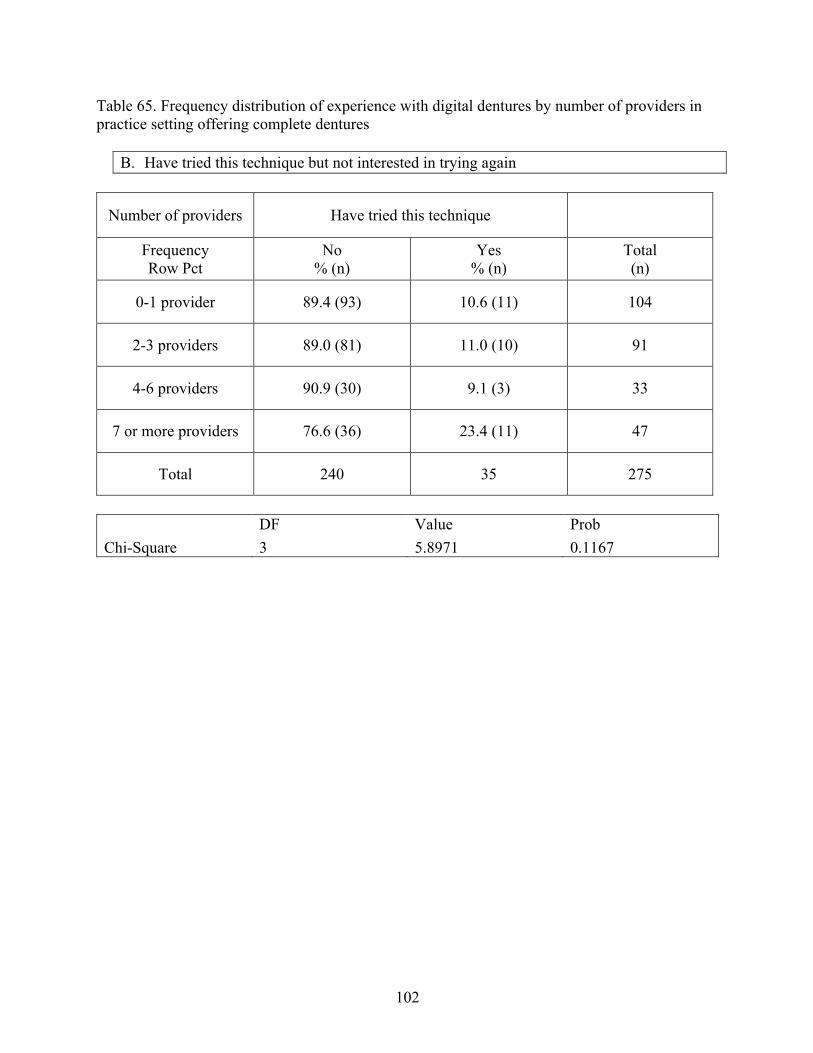
102
Table 65. Frequency distribution of experience with digital dentures by number of providers in practice setting offering complete dentures
B. Have tried this technique but not interested in trying again
Number of providers Have tried this technique
Frequency Row Pct
No % (n)
Yes % (n)
Total (n)
0-1 provider 89.4 (93) 10.6 (11) 104
2-3 providers 89.0 (81) 11.0 (10) 91
4-6 providers 90.9 (30) 9.1 (3) 33
7 or more providers 76.6 (36) 23.4 (11) 47
Total 240 35 275
DF Value Prob Chi-Square 3 5.8971 0.1167
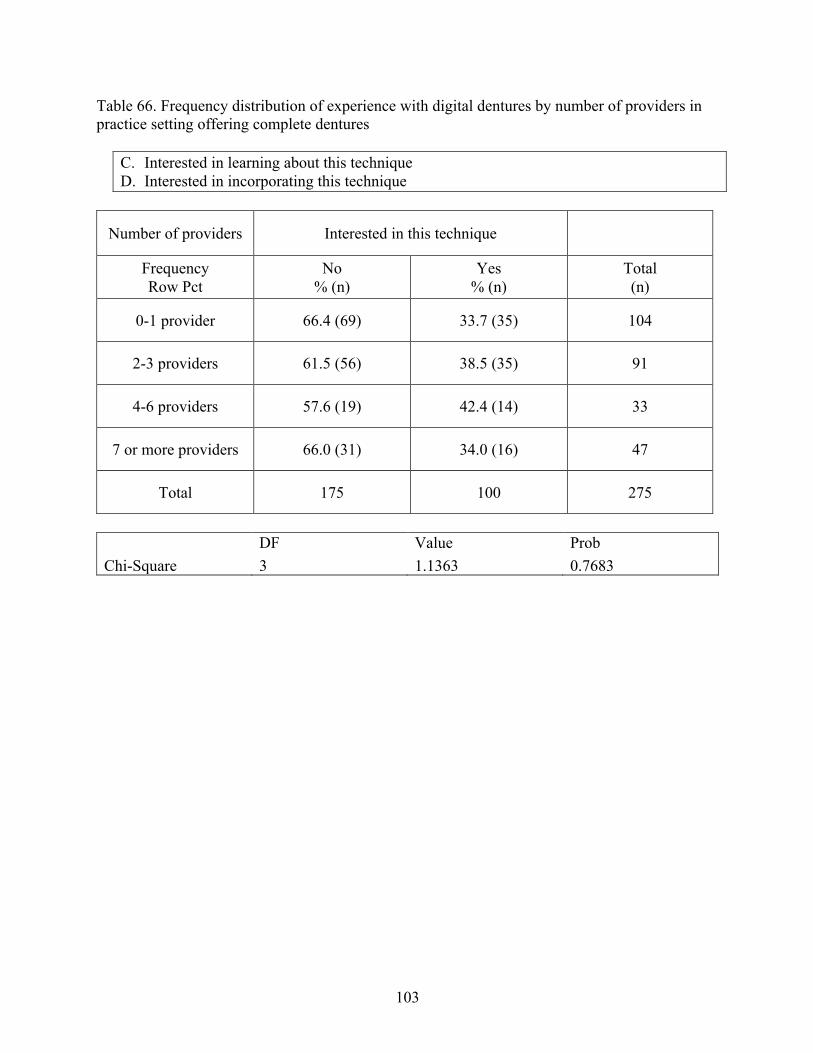
103
Table 66. Frequency distribution of experience with digital dentures by number of providers in practice setting offering complete dentures
C. Interested in learning about this technique D. Interested in incorporating this technique
Number of providers Interested in this technique
Frequency Row Pct
No % (n)
Yes % (n)
Total (n)
0-1 provider 66.4 (69) 33.7 (35) 104
2-3 providers 61.5 (56) 38.5 (35) 91
4-6 providers 57.6 (19) 42.4 (14) 33
7 or more providers 66.0 (31) 34.0 (16) 47
Total 175 100 275
DF Value Prob Chi-Square 3 1.1363 0.7683

104
Table 67. Frequency distribution of experience with digital dentures by number of other providers treating complete denture patients in practice setting Q9. What is your experience with digital dentures? E. Currently implementing this technique
Number of providers Currently implementing
Frequency Row Pct
No % (n)
Yes % (n)
Total (n)
0-1 provider 71.2 (74) 28.9 (30) 104
2-3 providers 70.3 (64) 29.7 (27) 91
4-6 providers 66.7 (22) 33.3 (11) 33
7 or more providers 59.6 (28) 40.4 (19) 47
Total 188 87 275
DF Value Prob Chi-Square 3 2.2597 0.5203
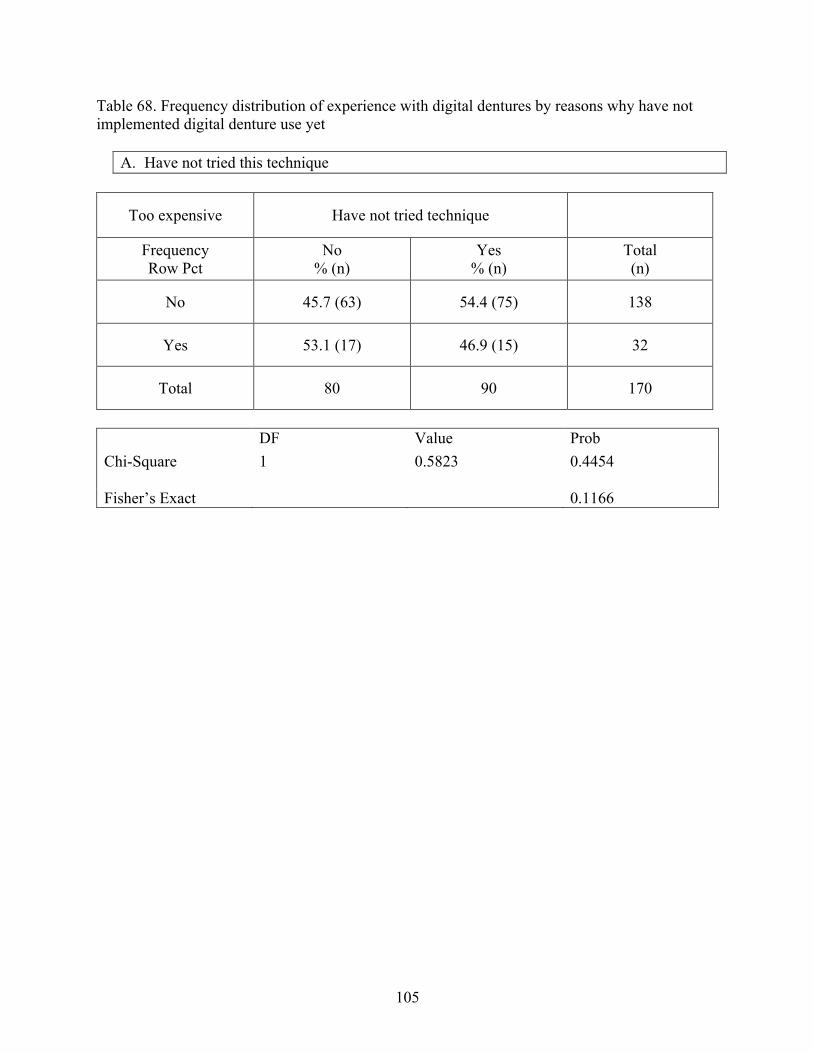
105
Table 68. Frequency distribution of experience with digital dentures by reasons why have not implemented digital denture use yet
A. Have not tried this technique
Too expensive Have not tried technique
Frequency Row Pct
No % (n)
Yes % (n)
Total (n)
No 45.7 (63) 54.4 (75) 138
Yes 53.1 (17) 46.9 (15) 32
Total 80 90 170
DF Value Prob Chi-Square 1 0.5823 0.4454
Fisher’s Exact 0.1166

106
Table 69. Frequency distribution of experience with digital dentures by reasons why digital dentures have not been implemented in practice A. Have not tried this technique
Q10. If you are not implementing digital dentures in your practice, what are the reasons?
B. Need more information/training
Need more information Have not tried technique
Frequency Row Pct
No % (n)
Yes % (n)
Total (n)
No 55.2 (53) 44.8 (43) 96
Yes 36.5 (27) 63.5 (47) 74
Total 80 90 170
DF Value Prob Chi-Square 1 5.8792 0.0153 Fisher’s Exact
0.0066
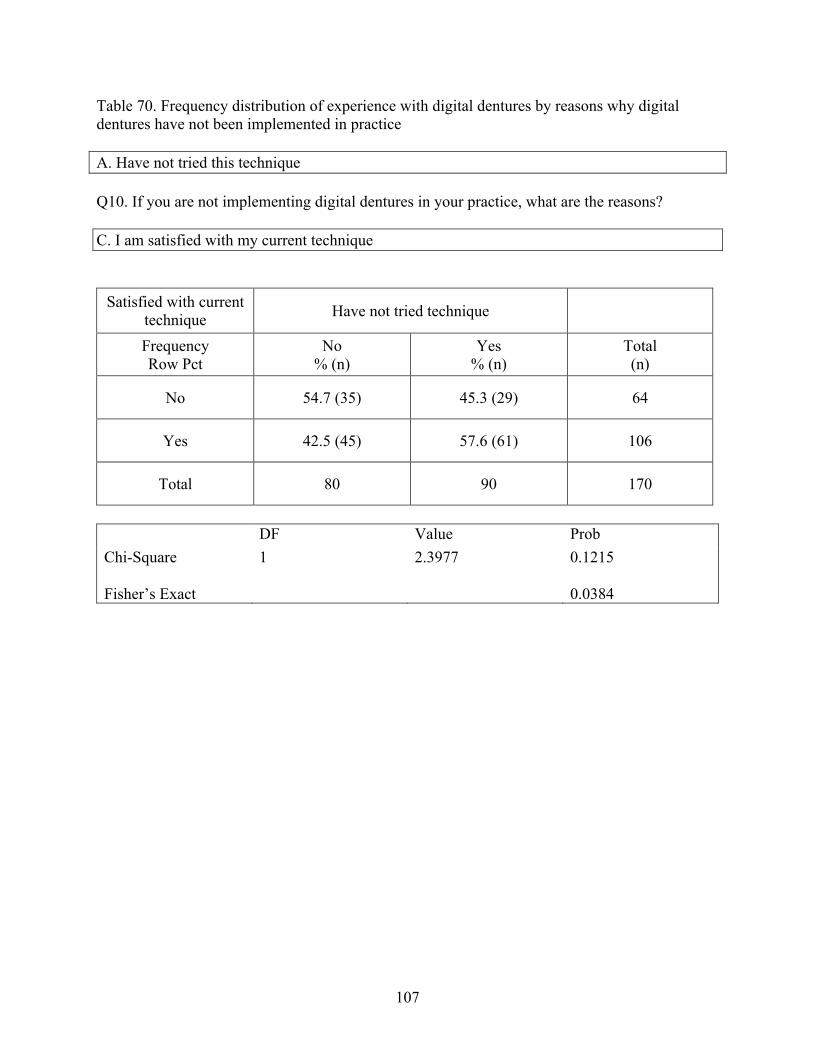
107
Table 70. Frequency distribution of experience with digital dentures by reasons why digital dentures have not been implemented in practice A. Have not tried this technique
Q10. If you are not implementing digital dentures in your practice, what are the reasons?
C. I am satisfied with my current technique
Satisfied with current technique Have not tried technique
Frequency Row Pct
No % (n)
Yes % (n)
Total (n)
No 54.7 (35) 45.3 (29) 64
Yes 42.5 (45) 57.6 (61) 106
Total 80 90 170
DF Value Prob Chi-Square 1 2.3977 0.1215 Fisher’s Exact
0.0384

108
Table 71. Frequency distribution of experience with digital dentures by reasons why have not implemented digital denture use yet
A. Have not tried this technique
Lack of time Have not tried technique
Frequency Row Pct
No % (n)
Yes % (n)
Total (n)
No 46.5 (73) 53.5 (84) 157
Yes 53.9 (7) 46.2 (6) 13
Total 80 90 170
DF Value Prob Chi-Square 1 0.2603 0.6099 Fisher’s Exact
0.1991
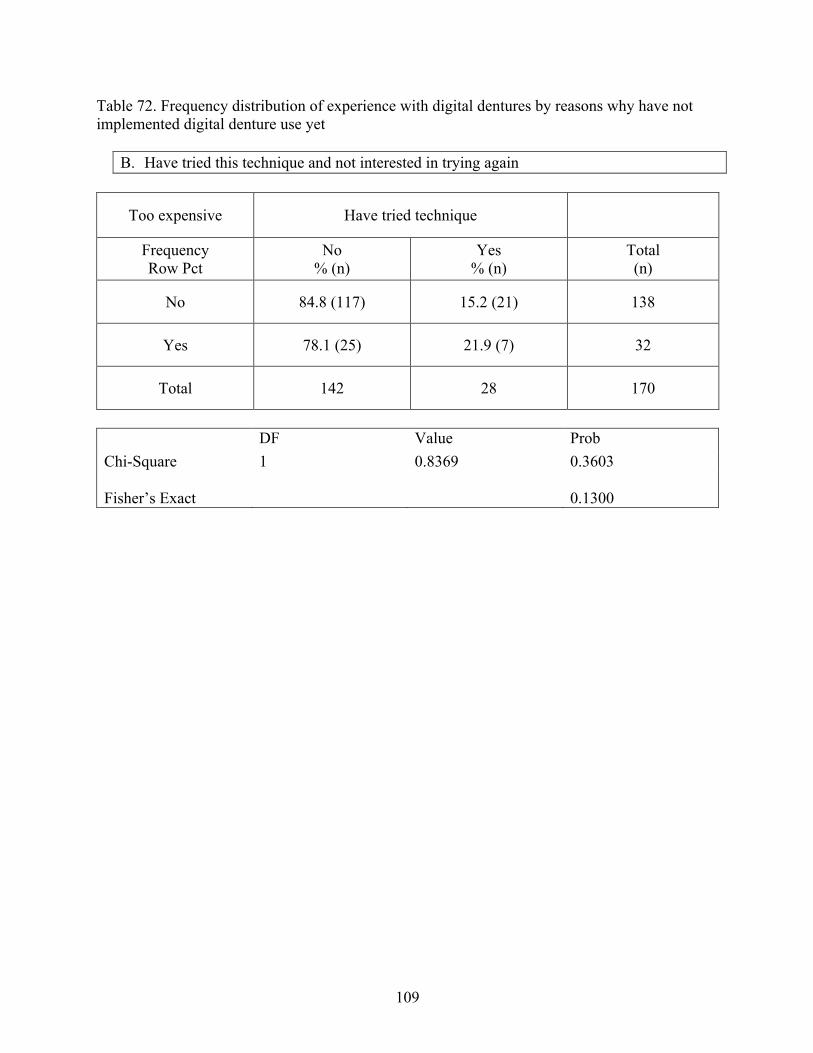
109
Table 72. Frequency distribution of experience with digital dentures by reasons why have not implemented digital denture use yet
B. Have tried this technique and not interested in trying again
Too expensive Have tried technique
Frequency Row Pct
No % (n)
Yes % (n)
Total (n)
No 84.8 (117) 15.2 (21) 138
Yes 78.1 (25) 21.9 (7) 32
Total 142 28 170
DF Value Prob Chi-Square 1 0.8369 0.3603 Fisher’s Exact
0.1300
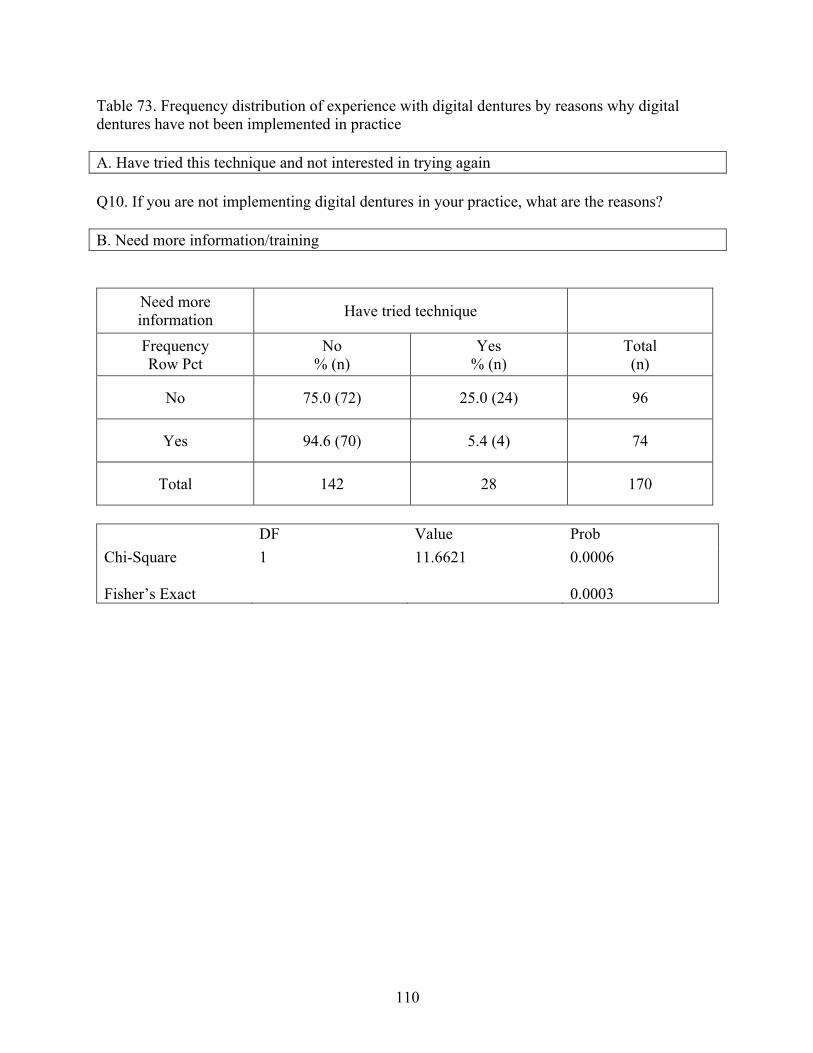
110
Table 73. Frequency distribution of experience with digital dentures by reasons why digital dentures have not been implemented in practice A. Have tried this technique and not interested in trying again
Q10. If you are not implementing digital dentures in your practice, what are the reasons?
B. Need more information/training
Need more information Have tried technique
Frequency Row Pct
No % (n)
Yes % (n)
Total (n)
No 75.0 (72) 25.0 (24) 96
Yes 94.6 (70) 5.4 (4) 74
Total 142 28 170
DF Value Prob Chi-Square 1 11.6621 0.0006 Fisher’s Exact
0.0003
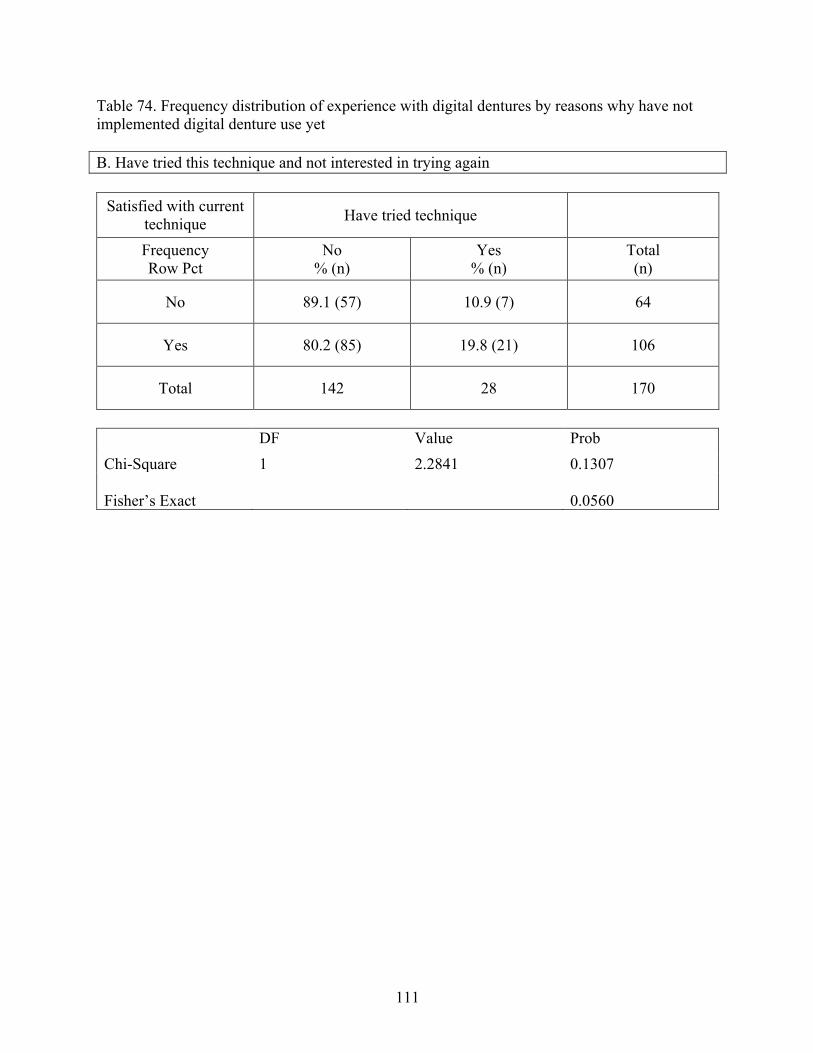
111
Table 74. Frequency distribution of experience with digital dentures by reasons why have not implemented digital denture use yet B. Have tried this technique and not interested in trying again
Satisfied with current
technique Have tried technique
Frequency Row Pct
No % (n)
Yes % (n)
Total (n)
No 89.1 (57) 10.9 (7) 64
Yes 80.2 (85) 19.8 (21) 106
Total 142 28 170
DF Value Prob Chi-Square 1 2.2841 0.1307 Fisher’s Exact
0.0560
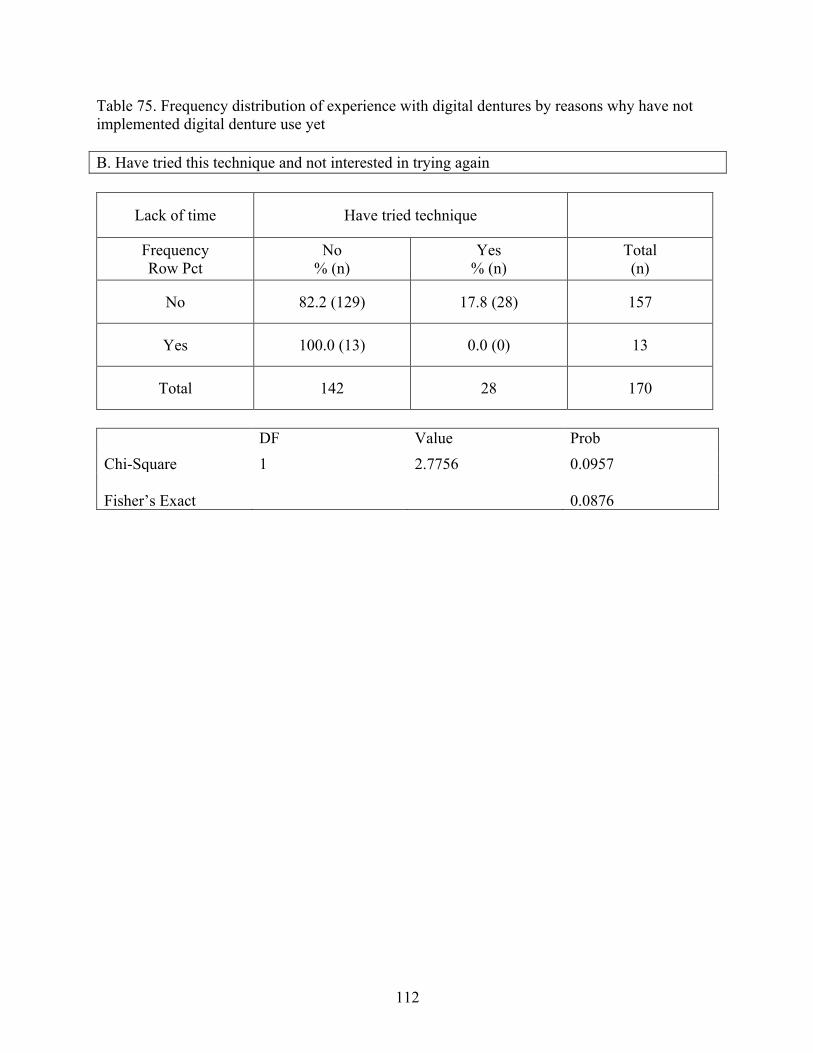
112
Table 75. Frequency distribution of experience with digital dentures by reasons why have not implemented digital denture use yet B. Have tried this technique and not interested in trying again
Lack of time Have tried technique
Frequency Row Pct
No % (n)
Yes % (n)
Total (n)
No 82.2 (129) 17.8 (28) 157
Yes 100.0 (13) 0.0 (0) 13
Total 142 28 170
DF Value Prob Chi-Square 1 2.7756 0.0957 Fisher’s Exact
0.0876
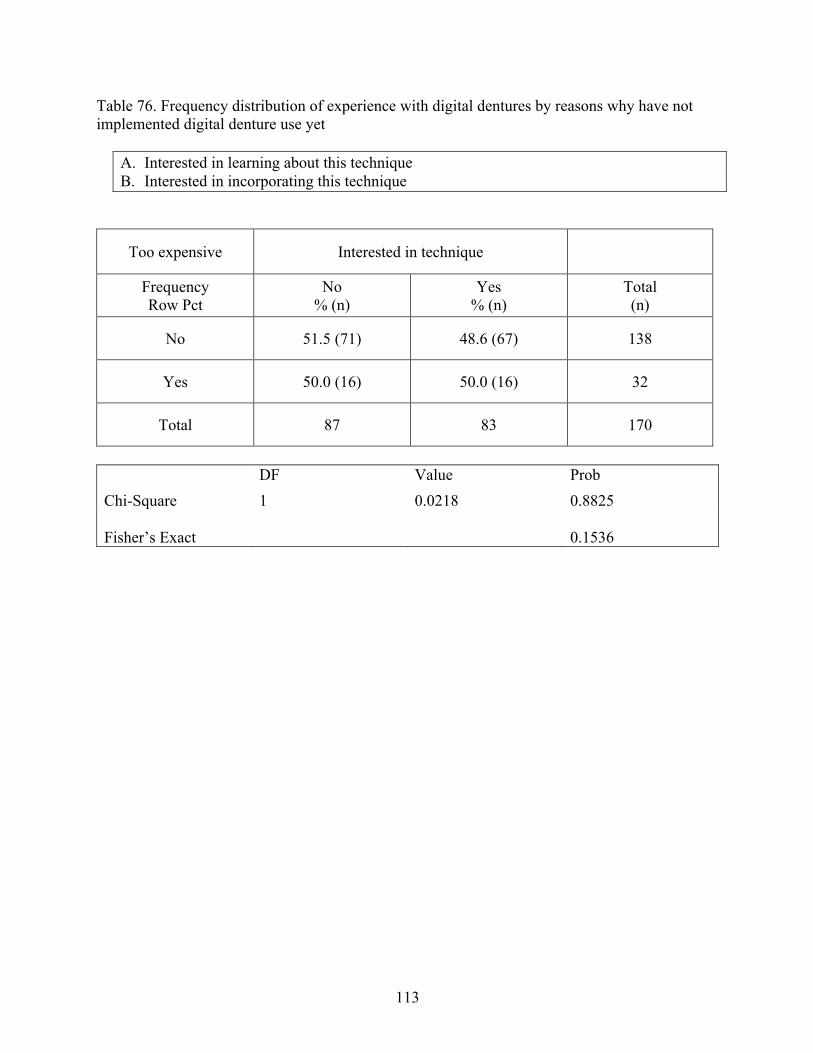
113
Table 76. Frequency distribution of experience with digital dentures by reasons why have not implemented digital denture use yet
A. Interested in learning about this technique B. Interested in incorporating this technique
Too expensive Interested in technique
Frequency Row Pct
No % (n)
Yes % (n)
Total (n)
No 51.5 (71) 48.6 (67) 138
Yes 50.0 (16) 50.0 (16) 32
Total 87 83 170
DF Value Prob Chi-Square 1 0.0218 0.8825 Fisher’s Exact
0.1536
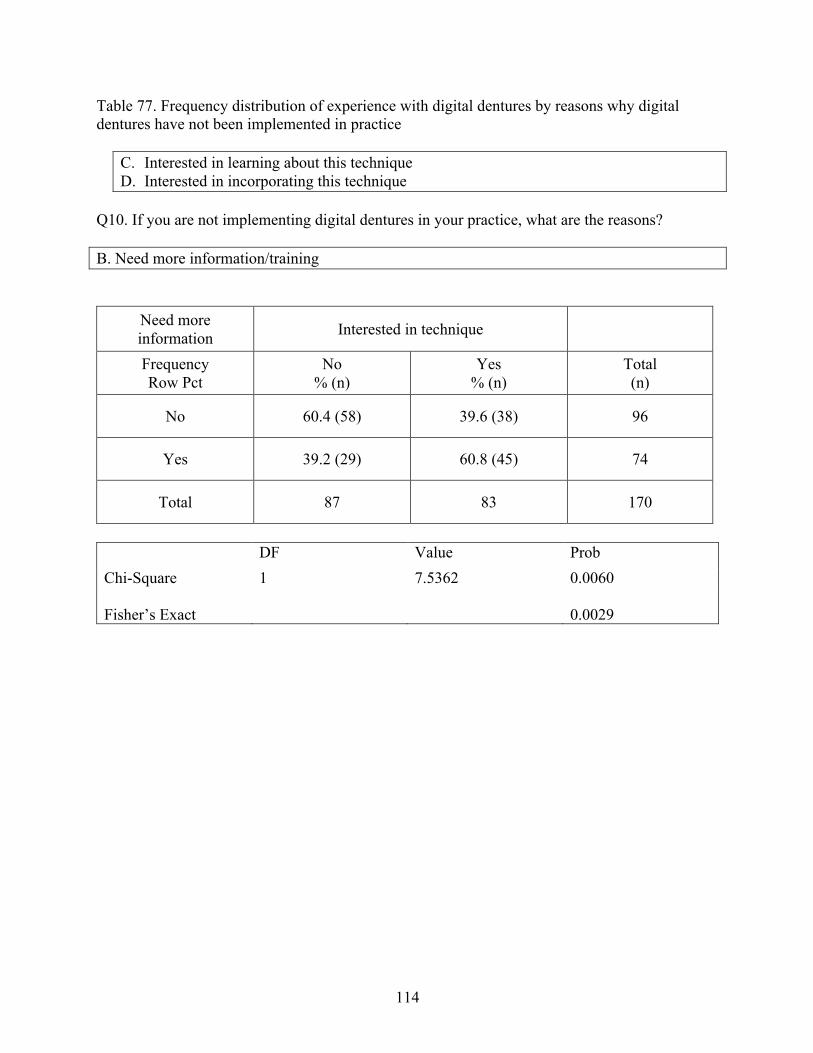
114
Table 77. Frequency distribution of experience with digital dentures by reasons why digital dentures have not been implemented in practice
C. Interested in learning about this technique D. Interested in incorporating this technique
Q10. If you are not implementing digital dentures in your practice, what are the reasons?
B. Need more information/training
Need more information Interested in technique
Frequency Row Pct
No % (n)
Yes % (n)
Total (n)
No 60.4 (58) 39.6 (38) 96
Yes 39.2 (29) 60.8 (45) 74
Total 87 83 170
DF Value Prob Chi-Square 1 7.5362 0.0060 Fisher’s Exact
0.0029

115
Table 78. Frequency distribution of experience with digital dentures by reasons why digital dentures have not been implemented in practice C. Interested in learning about this technique D. Interested in incorporating this technique
Q10. If you are not implementing digital dentures in your practice, what are the reasons?
C. I am satisfied with my current technique
Satisfied with current technique Interested in technique
Frequency Row Pct
No % (n)
Yes % (n)
Total (n)
No 32.8 (21) 67.2 (43) 64
Yes 62.3 (66) 37.7 (40) 106
Total 87 83 170
DF Value Prob Chi-Square 1 13.8534 0.0002 Fisher’s Exact
0.0001
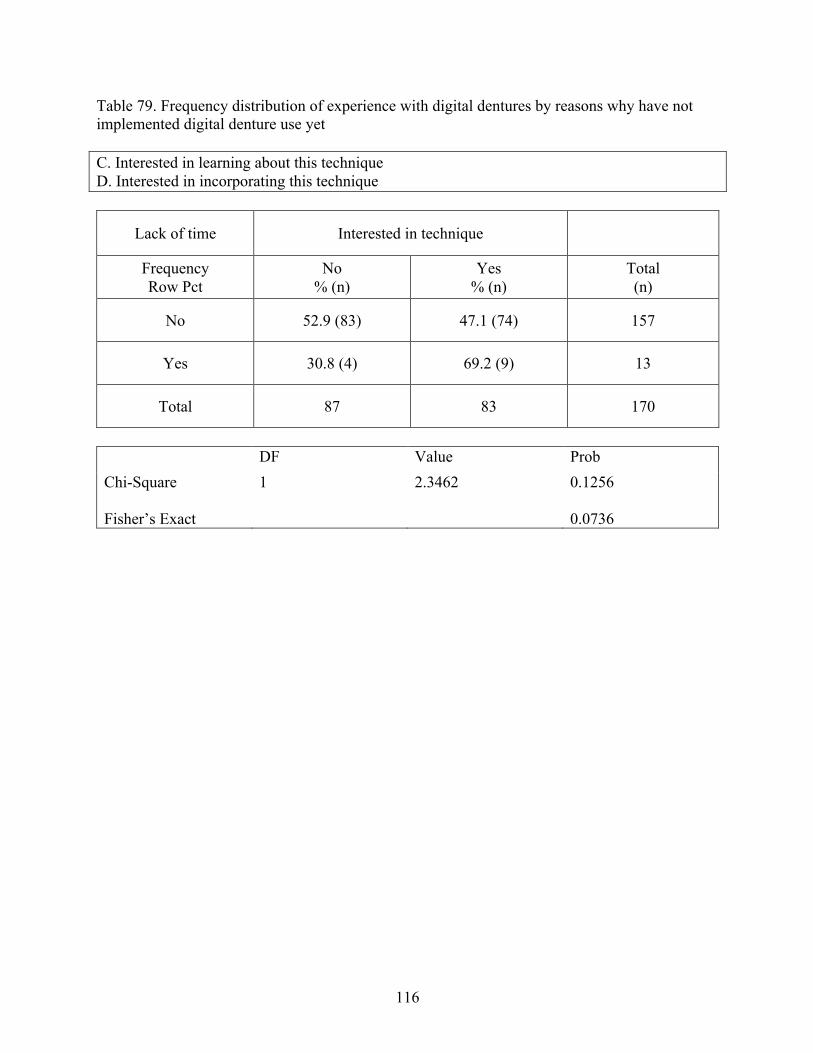
116
Table 79. Frequency distribution of experience with digital dentures by reasons why have not implemented digital denture use yet C. Interested in learning about this technique D. Interested in incorporating this technique
Lack of time Interested in technique
Frequency Row Pct
No % (n)
Yes % (n)
Total (n)
No 52.9 (83) 47.1 (74) 157
Yes 30.8 (4) 69.2 (9) 13
Total 87 83 170
DF Value Prob Chi-Square 1 2.3462 0.1256 Fisher’s Exact
0.0736

117
Table 80. Frequency distribution of experience with digital dentures by reasons why digital dentures have not been implemented in practice Q9. What is your experience with digital dentures? E. Currently implementing this technique
Q10. If you are not implementing digital dentures in your practice, what are the reasons?
A. Too expensive
Too expensive Currently implementing
Frequency Row Pct
No % (n)
Yes % (n)
Total (n)
No 93.5 (129) 6.5 (9) 138
Yes 93.8 (30) 6.3 (9) 32
Total 159 11 170
DF Value Prob Chi-Square 1 0.0032 0.9551 Fisher’s Exact
0.0736

118
Table 81. Frequency distribution of experience with digital dentures by reasons why digital dentures have not been implemented in practice Q9. What is your experience with digital dentures? E. Currently implementing this technique
Q10. If you are not implementing digital dentures in your practice, what are the reasons?
B. Need more information/training
Need more information Currently implementing
Frequency Row Pct
No % (n)
Yes % (n)
Total (n)
No 92.7 (89) 7.3 (7) 96
Yes 94.6 (70) 5.4 (4) 74
Total 159 11 170
DF Value Prob Chi-Square 1 0.2457 0.6201 Fisher’s Exact
0.2223
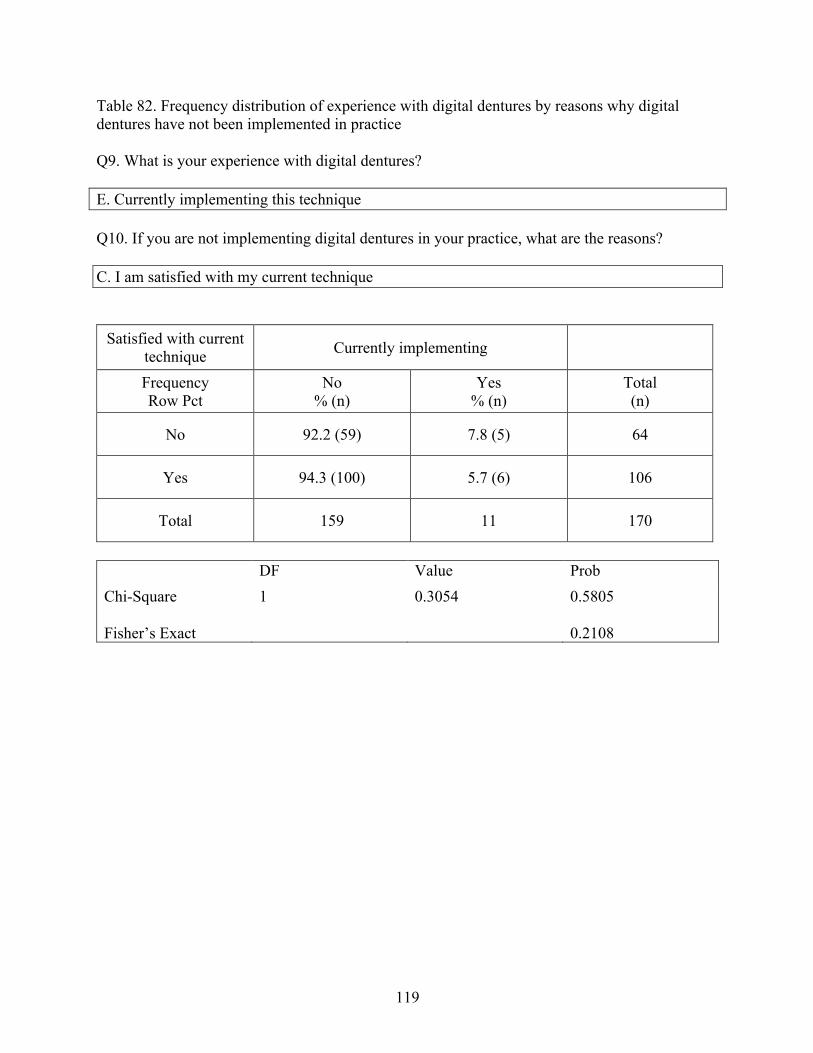
119
Table 82. Frequency distribution of experience with digital dentures by reasons why digital dentures have not been implemented in practice Q9. What is your experience with digital dentures? E. Currently implementing this technique
Q10. If you are not implementing digital dentures in your practice, what are the reasons? C. I am satisfied with my current technique
Satisfied with current technique Currently implementing
Frequency Row Pct
No % (n)
Yes % (n)
Total (n)
No 92.2 (59) 7.8 (5) 64
Yes 94.3 (100) 5.7 (6) 106
Total 159 11 170
DF Value Prob Chi-Square 1 0.3054 0.5805 Fisher’s Exact
0.2108

120
Table 83. Frequency distribution of experience with digital dentures by reasons why digital dentures have not been implemented in practice Q9. What is your experience with digital dentures? E. Currently implementing this technique Q10. If you are not implementing digital dentures in your practice, what are the reasons? D. Lack of time
Lack of time Currently implementing
Frequency Row Pct
No % (n)
Yes % (n)
Total (n)
No 93.6 (147) 6.4 (10) 157
Yes 92.3 (12) 7.7 (1) 13
Total 159 11 170
DF Value Prob Chi-Square 1 0.0347 0.8522 Fisher’s Exact
0.3943
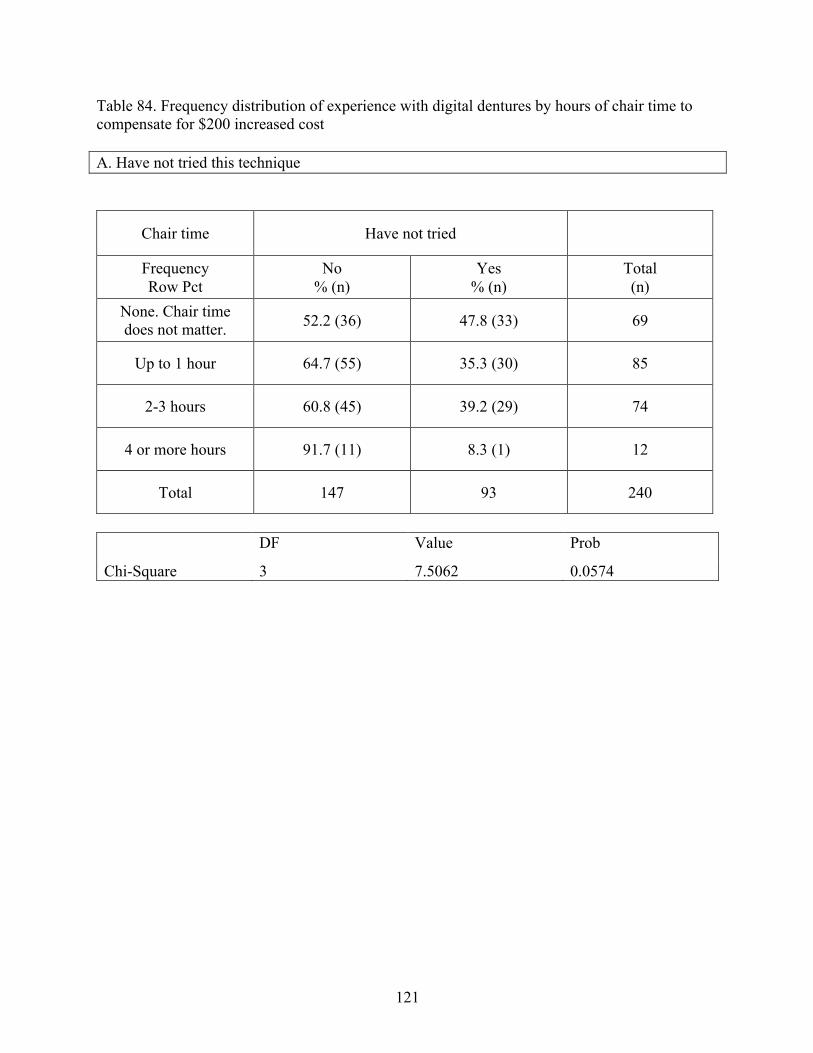
121
Table 84. Frequency distribution of experience with digital dentures by hours of chair time to compensate for $200 increased cost A. Have not tried this technique
Chair time Have not tried
Frequency Row Pct
No % (n)
Yes % (n)
Total (n)
None. Chair time does not matter. 52.2 (36) 47.8 (33) 69
Up to 1 hour 64.7 (55) 35.3 (30) 85
2-3 hours 60.8 (45) 39.2 (29) 74
4 or more hours 91.7 (11) 8.3 (1) 12
Total 147 93 240
DF Value Prob
Chi-Square 3 7.5062 0.0574
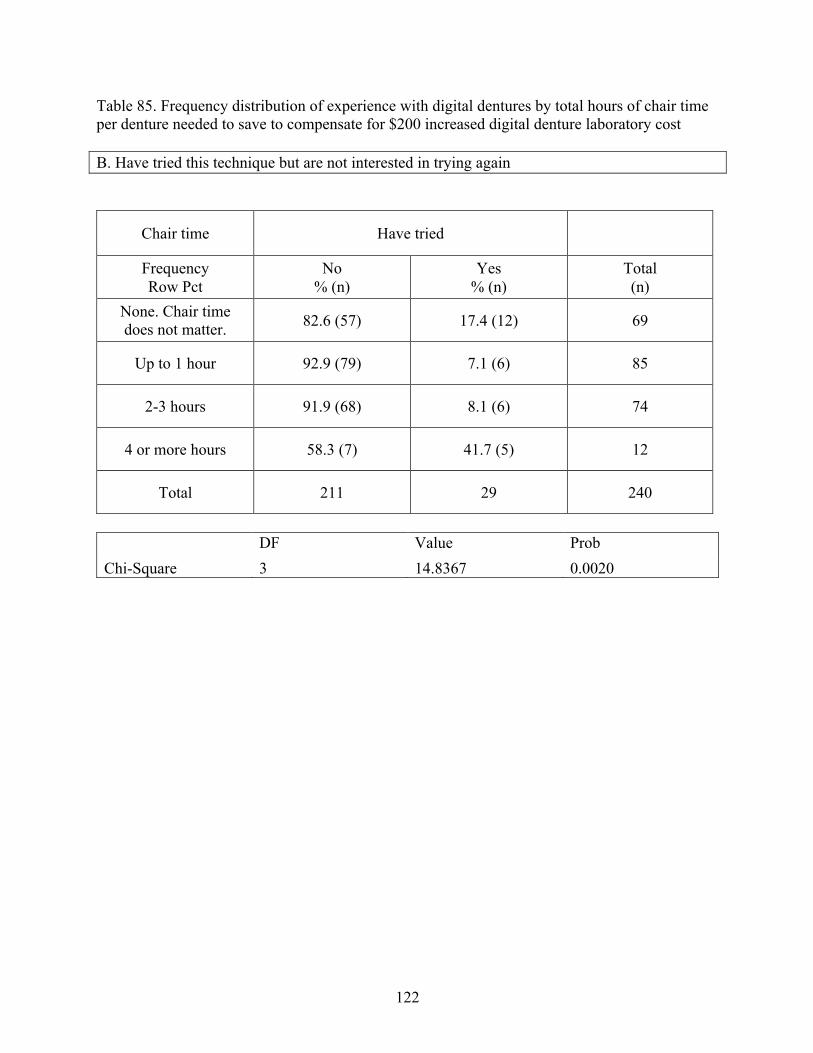
122
Table 85. Frequency distribution of experience with digital dentures by total hours of chair time per denture needed to save to compensate for $200 increased digital denture laboratory cost B. Have tried this technique but are not interested in trying again
Chair time Have tried
Frequency Row Pct
No % (n)
Yes % (n)
Total (n)
None. Chair time does not matter. 82.6 (57) 17.4 (12) 69
Up to 1 hour 92.9 (79) 7.1 (6) 85
2-3 hours 91.9 (68) 8.1 (6) 74
4 or more hours 58.3 (7) 41.7 (5) 12
Total 211 29 240
DF Value Prob Chi-Square 3 14.8367 0.0020
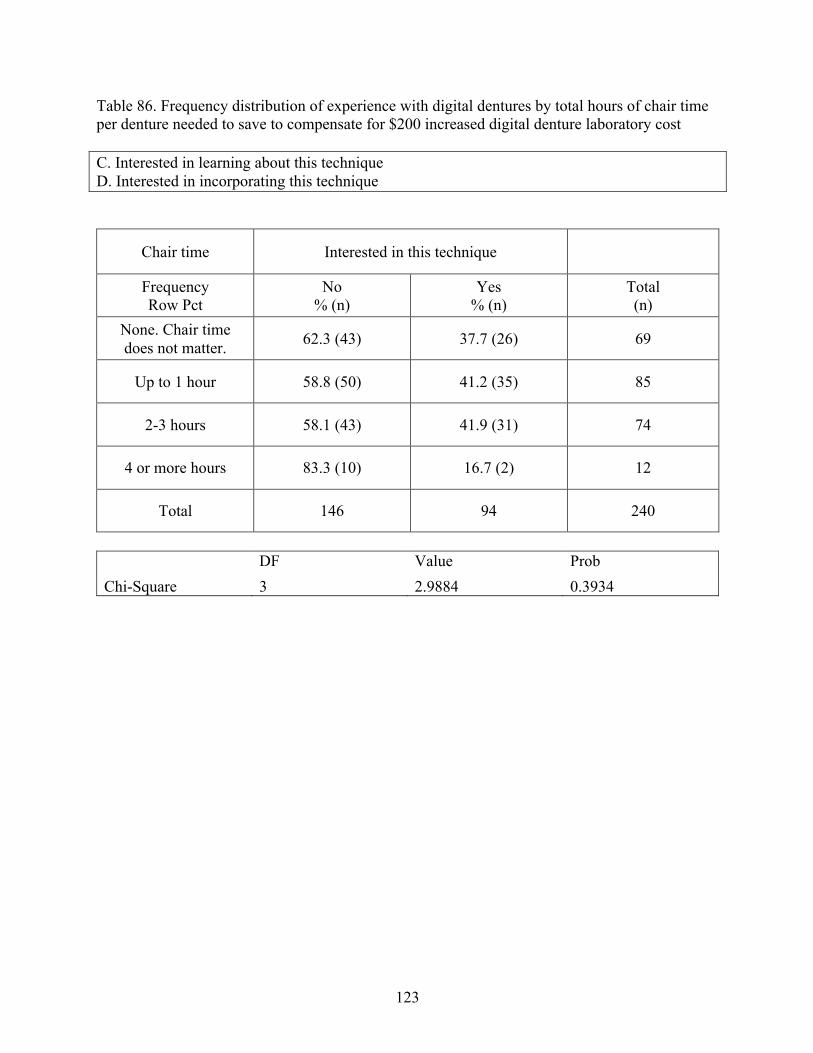
123
Table 86. Frequency distribution of experience with digital dentures by total hours of chair time per denture needed to save to compensate for $200 increased digital denture laboratory cost C. Interested in learning about this technique D. Interested in incorporating this technique
Chair time Interested in this technique
Frequency Row Pct
No % (n)
Yes % (n)
Total (n)
None. Chair time does not matter. 62.3 (43) 37.7 (26) 69
Up to 1 hour 58.8 (50) 41.2 (35) 85
2-3 hours 58.1 (43) 41.9 (31) 74
4 or more hours 83.3 (10) 16.7 (2) 12
Total 146 94 240
DF Value Prob Chi-Square 3 2.9884 0.3934
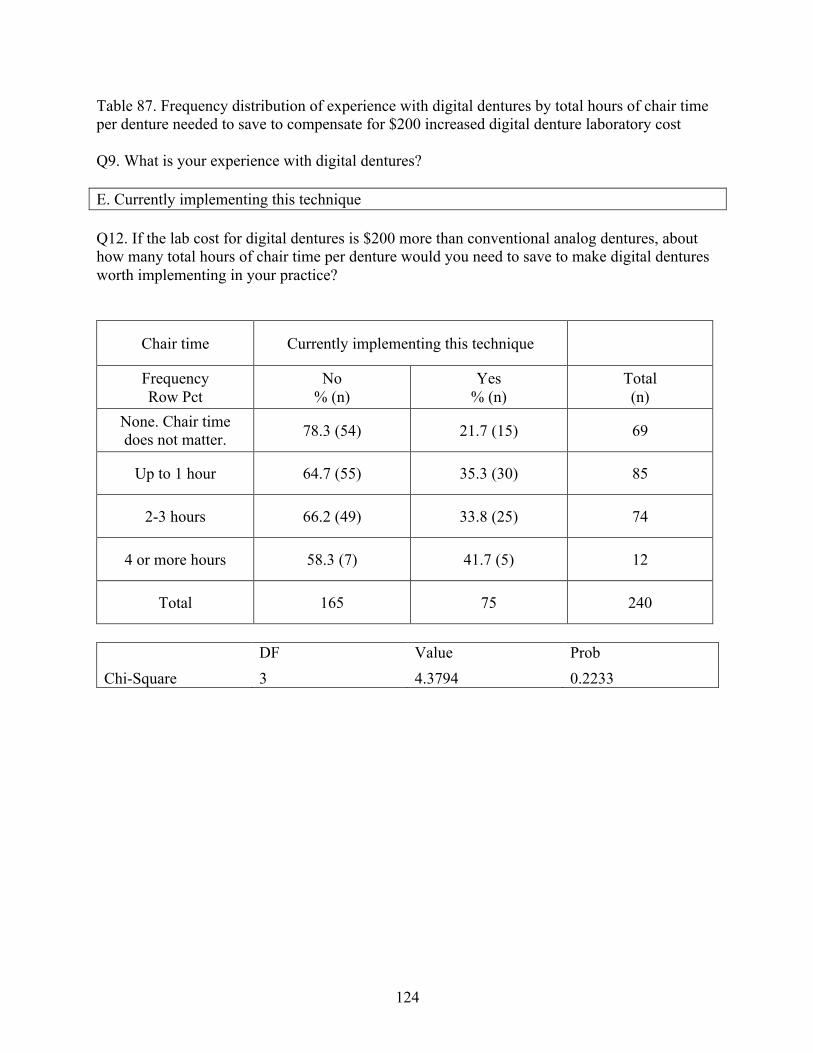
124
Table 87. Frequency distribution of experience with digital dentures by total hours of chair time per denture needed to save to compensate for $200 increased digital denture laboratory cost Q9. What is your experience with digital dentures? E. Currently implementing this technique Q12. If the lab cost for digital dentures is $200 more than conventional analog dentures, about how many total hours of chair time per denture would you need to save to make digital dentures worth implementing in your practice?
Chair time Currently implementing this technique
Frequency Row Pct
No % (n)
Yes % (n)
Total (n)
None. Chair time does not matter. 78.3 (54) 21.7 (15) 69
Up to 1 hour 64.7 (55) 35.3 (30) 85
2-3 hours 66.2 (49) 33.8 (25) 74
4 or more hours 58.3 (7) 41.7 (5) 12
Total 165 75 240
DF Value Prob Chi-Square 3 4.3794 0.2233
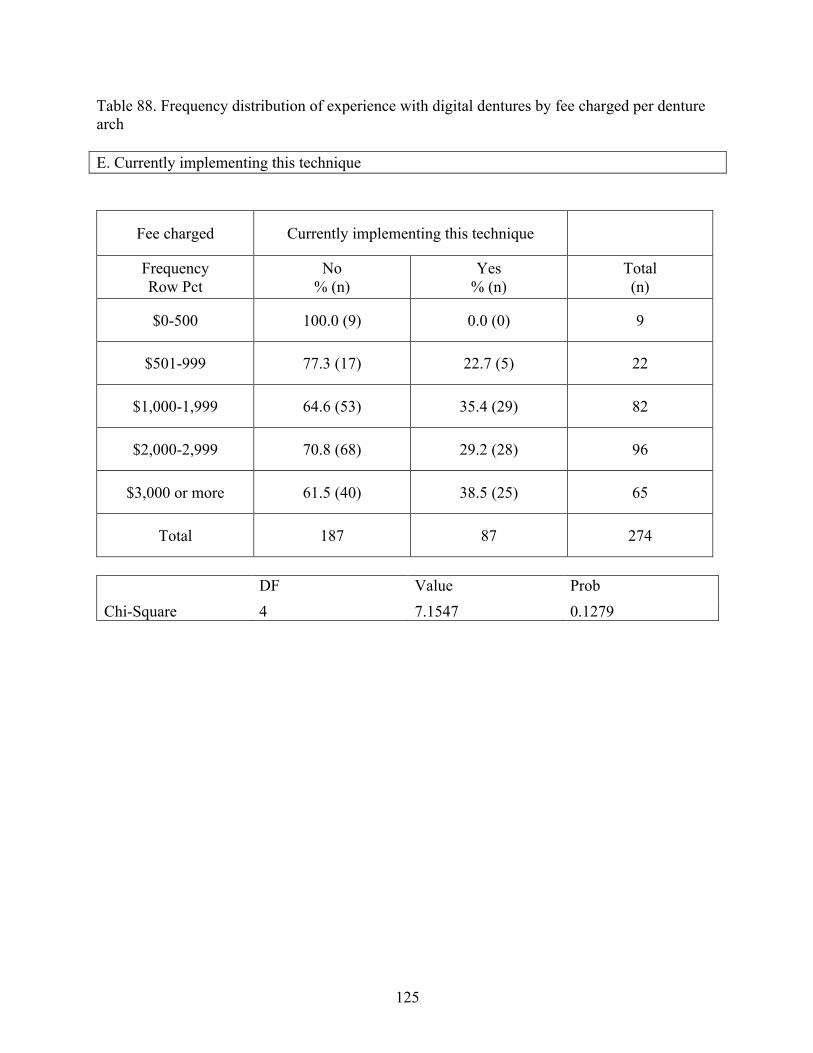
125
Table 88. Frequency distribution of experience with digital dentures by fee charged per denture arch E. Currently implementing this technique
Fee charged Currently implementing this technique
Frequency Row Pct
No % (n)
Yes % (n)
Total (n)
$0-500 100.0 (9) 0.0 (0) 9
$501-999 77.3 (17) 22.7 (5) 22
$1,000-1,999 64.6 (53) 35.4 (29) 82
$2,000-2,999 70.8 (68) 29.2 (28) 96
$3,000 or more 61.5 (40) 38.5 (25) 65
Total 187 87 274
DF Value Prob Chi-Square 4 7.1547 0.1279
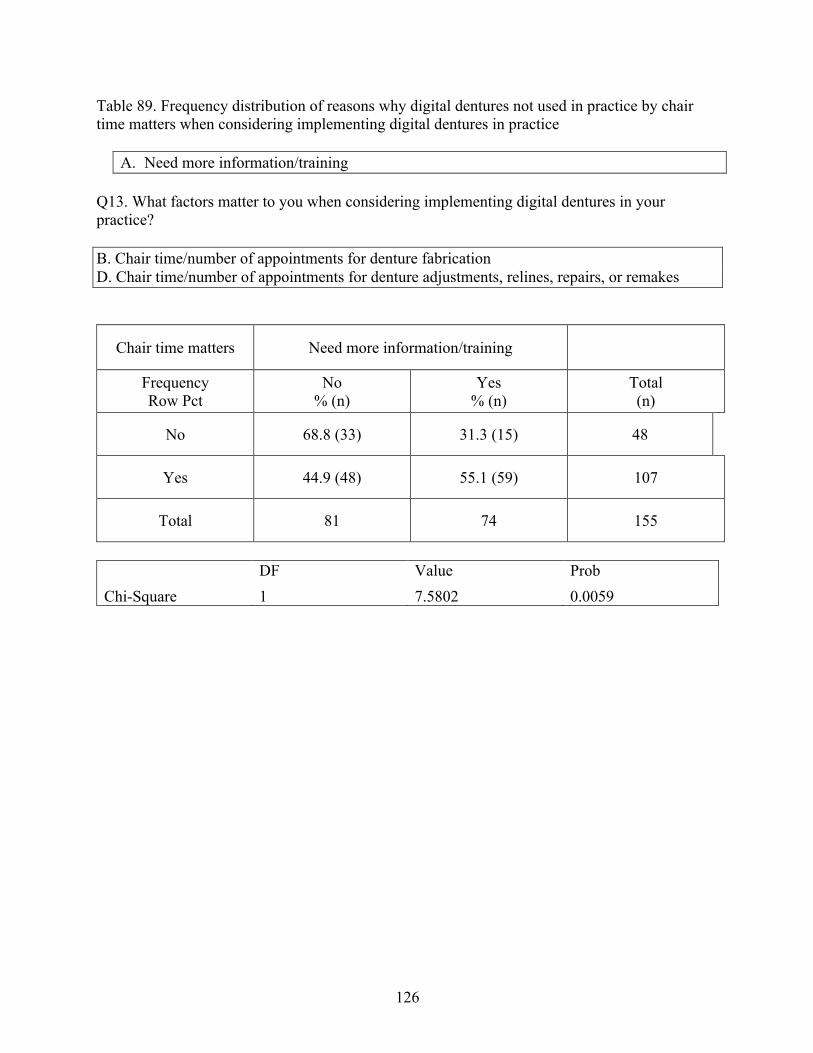
126
Table 89. Frequency distribution of reasons why digital dentures not used in practice by chair time matters when considering implementing digital dentures in practice
A. Need more information/training Q13. What factors matter to you when considering implementing digital dentures in your practice? B. Chair time/number of appointments for denture fabrication D. Chair time/number of appointments for denture adjustments, relines, repairs, or remakes
Chair time matters Need more information/training
Frequency Row Pct
No % (n)
Yes % (n)
Total (n)
No 68.8 (33) 31.3 (15) 48
Yes 44.9 (48) 55.1 (59) 107
Total 81 74 155
DF Value Prob Chi-Square 1 7.5802 0.0059
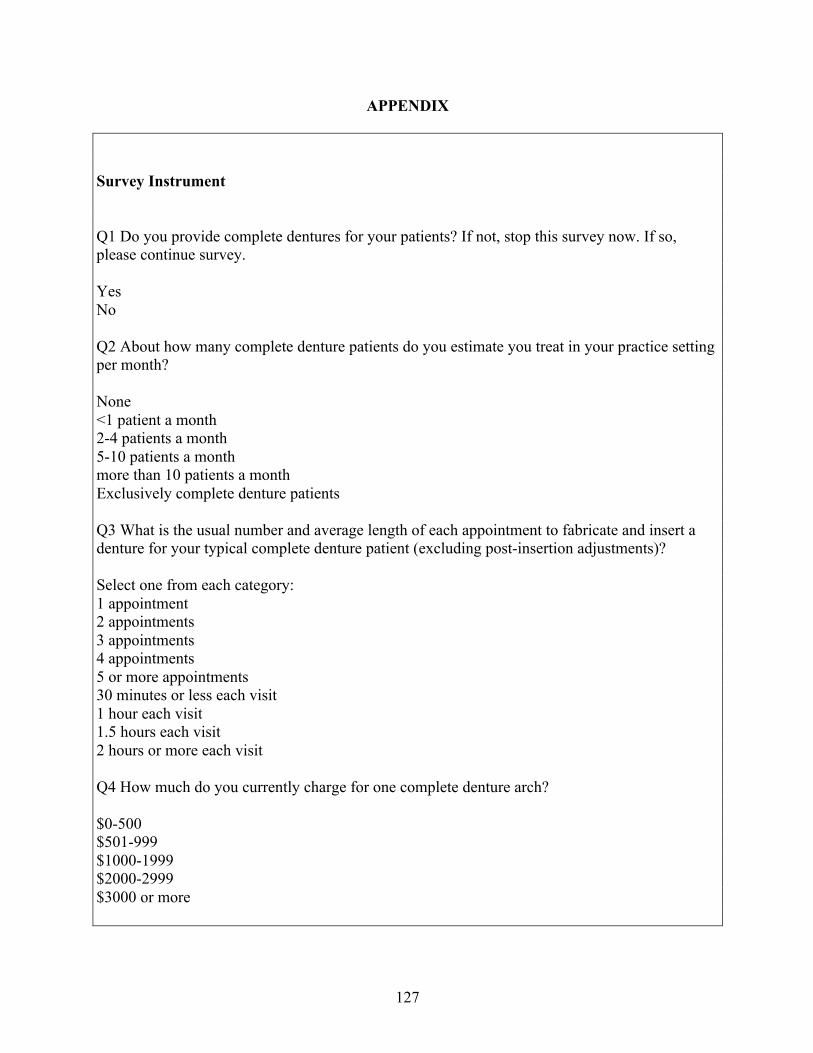
127
APPENDIX Survey Instrument Q1 Do you provide complete dentures for your patients? If not, stop this survey now. If so, please continue survey. Yes No Q2 About how many complete denture patients do you estimate you treat in your practice setting per month? None <1 patient a month 2-4 patients a month 5-10 patients a month more than 10 patients a month Exclusively complete denture patients Q3 What is the usual number and average length of each appointment to fabricate and insert a denture for your typical complete denture patient (excluding post-insertion adjustments)? Select one from each category: 1 appointment 2 appointments 3 appointments 4 appointments 5 or more appointments 30 minutes or less each visit 1 hour each visit 1.5 hours each visit 2 hours or more each visit Q4 How much do you currently charge for one complete denture arch? $0-500 $501-999 $1000-1999 $2000-2999 $3000 or more
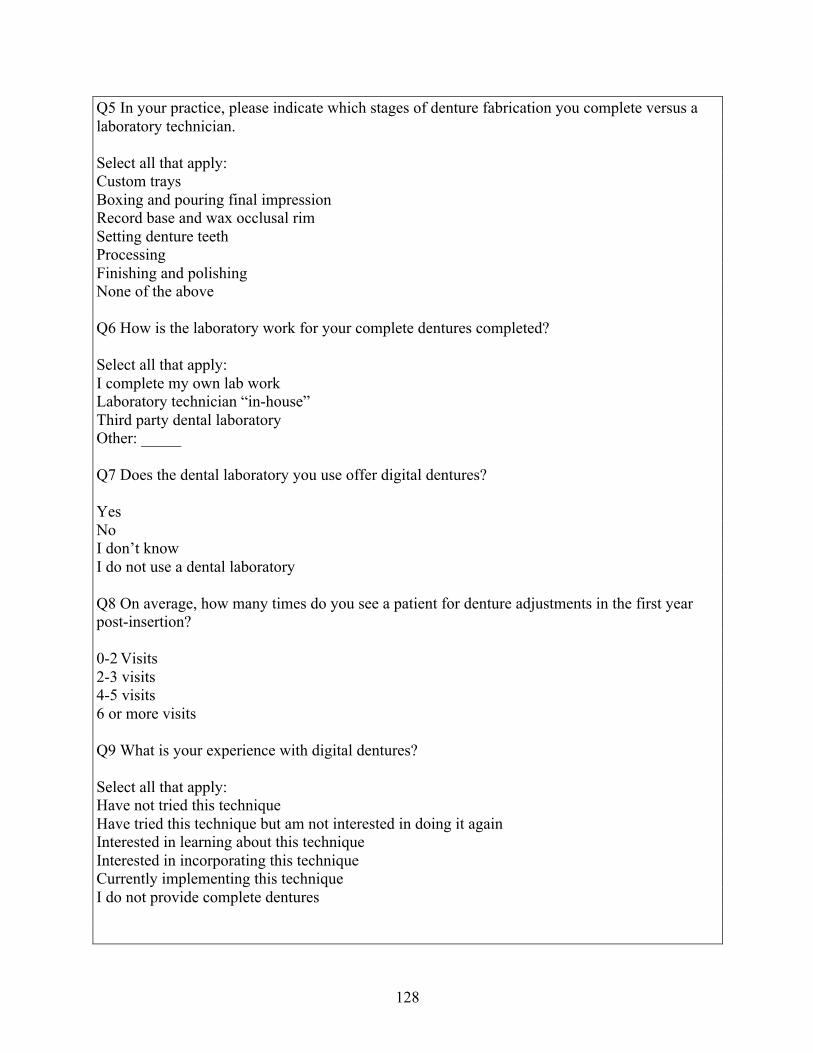
128
Q5 In your practice, please indicate which stages of denture fabrication you complete versus a laboratory technician. Select all that apply: Custom trays Boxing and pouring final impression Record base and wax occlusal rim Setting denture teeth Processing Finishing and polishing None of the above Q6 How is the laboratory work for your complete dentures completed? Select all that apply: I complete my own lab work Laboratory technician “in-house” Third party dental laboratory Other: _____ Q7 Does the dental laboratory you use offer digital dentures? Yes No I don’t know I do not use a dental laboratory Q8 On average, how many times do you see a patient for denture adjustments in the first year post-insertion? 0-2 Visits 2-3 visits 4-5 visits 6 or more visits Q9 What is your experience with digital dentures? Select all that apply: Have not tried this technique Have tried this technique but am not interested in doing it again Interested in learning about this technique Interested in incorporating this technique Currently implementing this technique I do not provide complete dentures
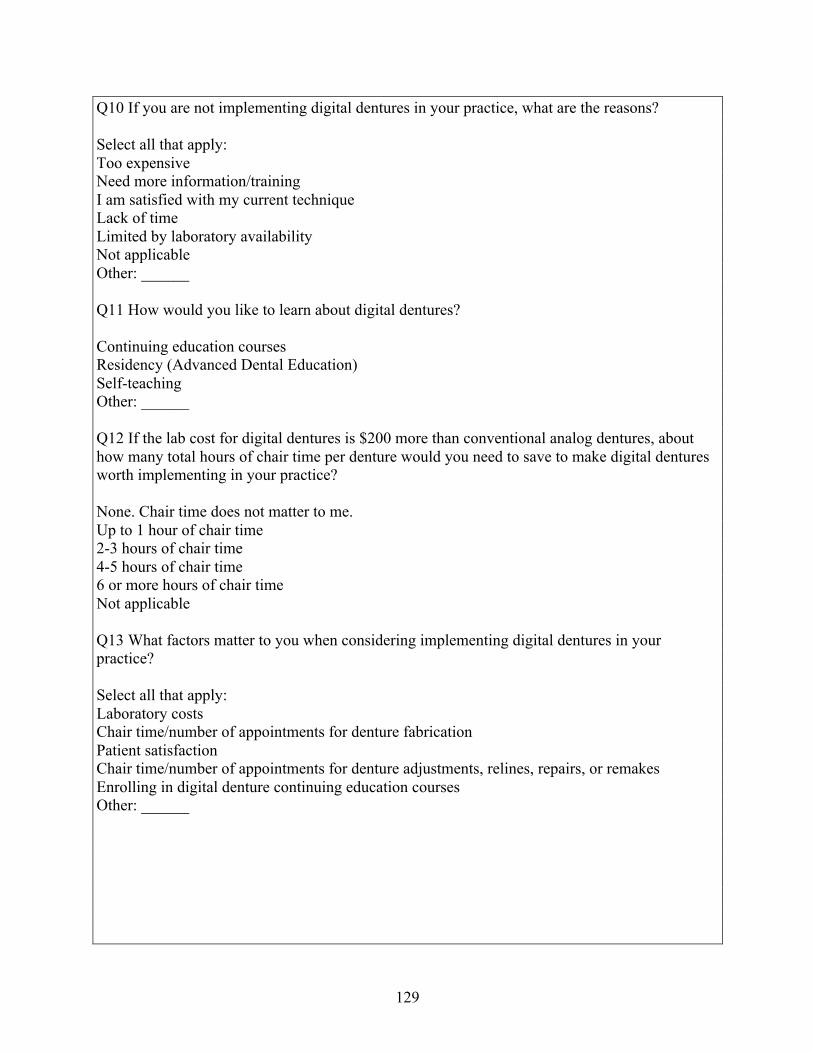
129
Q10 If you are not implementing digital dentures in your practice, what are the reasons? Select all that apply: Too expensive Need more information/training I am satisfied with my current technique Lack of time Limited by laboratory availability Not applicable Other: ______ Q11 How would you like to learn about digital dentures? Continuing education courses Residency (Advanced Dental Education) Self-teaching Other: ______ Q12 If the lab cost for digital dentures is $200 more than conventional analog dentures, about how many total hours of chair time per denture would you need to save to make digital dentures worth implementing in your practice? None. Chair time does not matter to me. Up to 1 hour of chair time 2-3 hours of chair time 4-5 hours of chair time 6 or more hours of chair time Not applicable Q13 What factors matter to you when considering implementing digital dentures in your practice? Select all that apply: Laboratory costs Chair time/number of appointments for denture fabrication Patient satisfaction Chair time/number of appointments for denture adjustments, relines, repairs, or remakes Enrolling in digital denture continuing education courses Other: ______
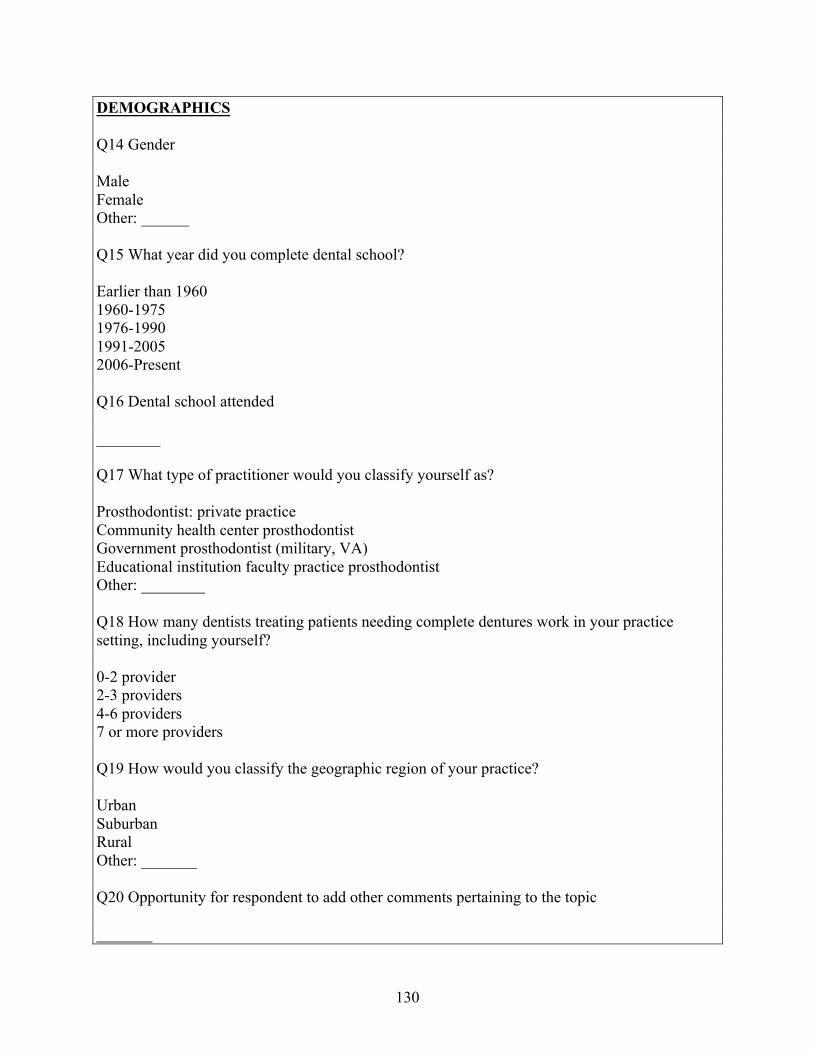
130
DEMOGRAPHICS Q14 Gender Male Female Other: ______ Q15 What year did you complete dental school? Earlier than 1960 1960-1975 1976-1990 1991-2005 2006-Present Q16 Dental school attended ________ Q17 What type of practitioner would you classify yourself as? Prosthodontist: private practice Community health center prosthodontist Government prosthodontist (military, VA) Educational institution faculty practice prosthodontist Other: ________ Q18 How many dentists treating patients needing complete dentures work in your practice setting, including yourself? 0-2 provider 2-3 providers 4-6 providers 7 or more providers Q19 How would you classify the geographic region of your practice? Urban Suburban Rural Other: _______ Q20 Opportunity for respondent to add other comments pertaining to the topic _______
131
Practice-Based Research Network Quick Poll Distribution
Join our Mailing List
March 2020
Digital Dentures
Digital CAD/CAM dentures are one of the new
ways technology is changing the way we
practice dentistry. Currently, no studies are
available on the costs and benefits of digital
dentures to patients and providers compared
to traditional denture fabrication methods. The
goal of this Quick Poll is to determine if
practitioners in the National Dental PBRN are
implementing digital dentures in their practices
and the motivations behind transitioning to
these new methods.
Please take a few moments to complete this 5-
question quick poll to help us determine if
this would be a possible future study in the
Network.
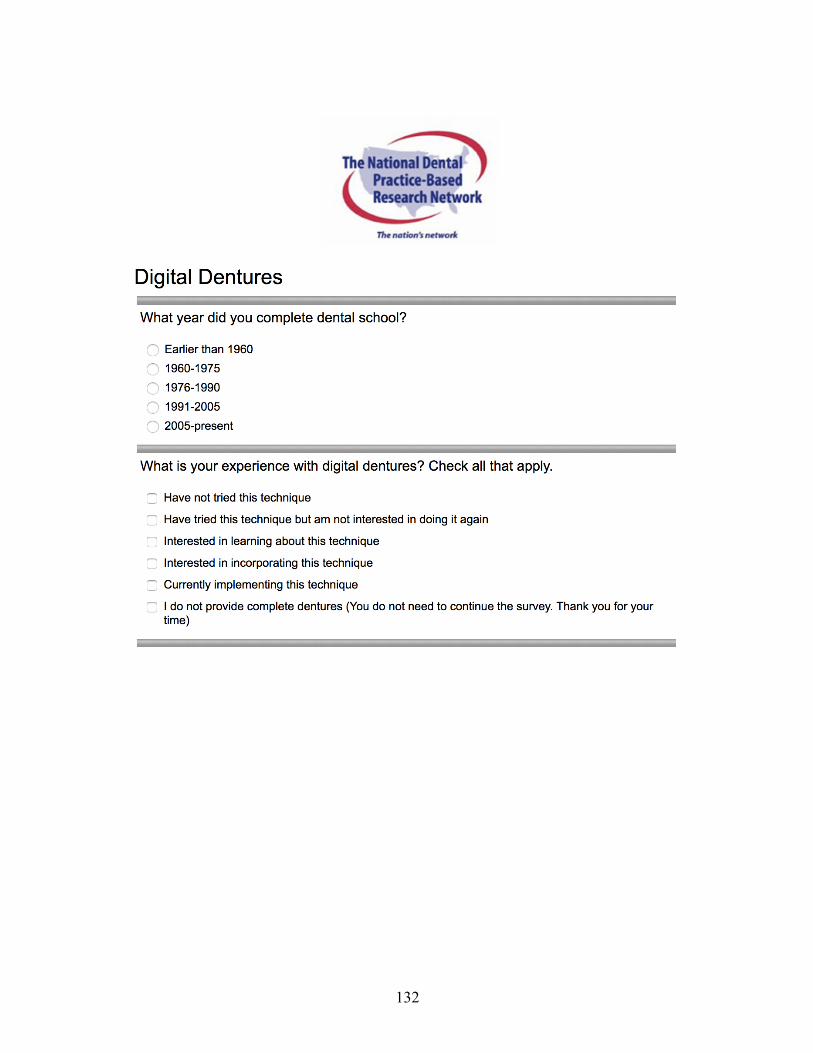
132
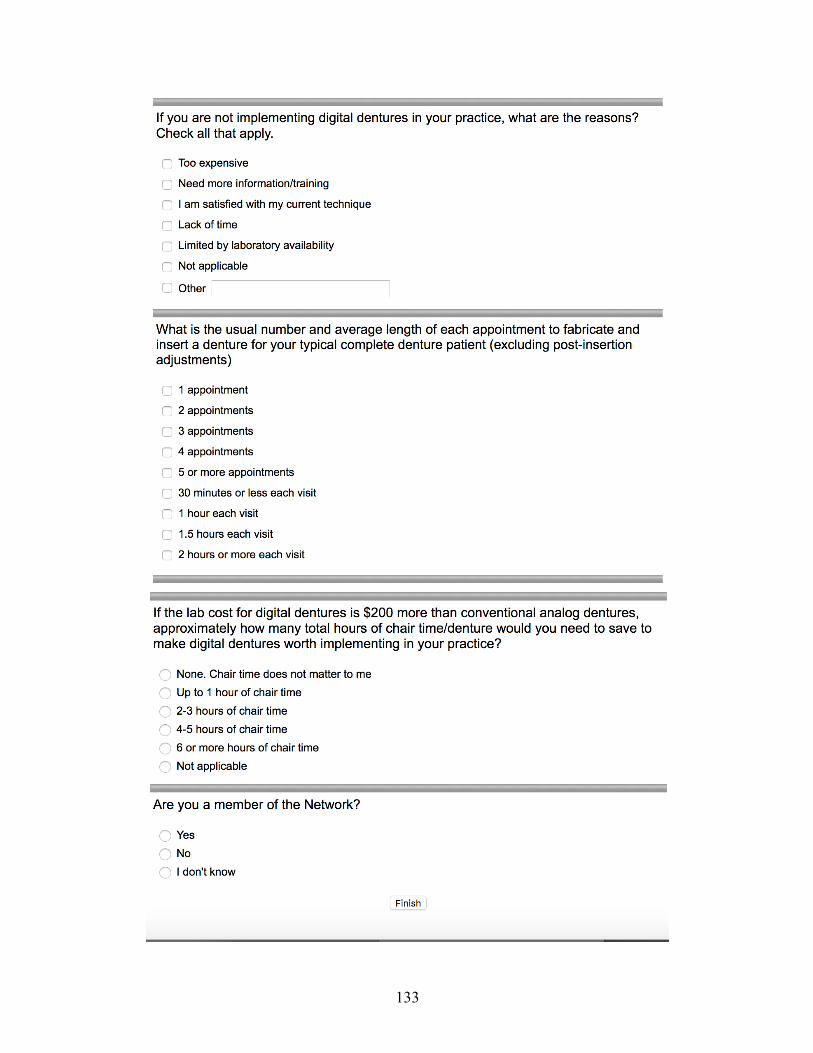
133
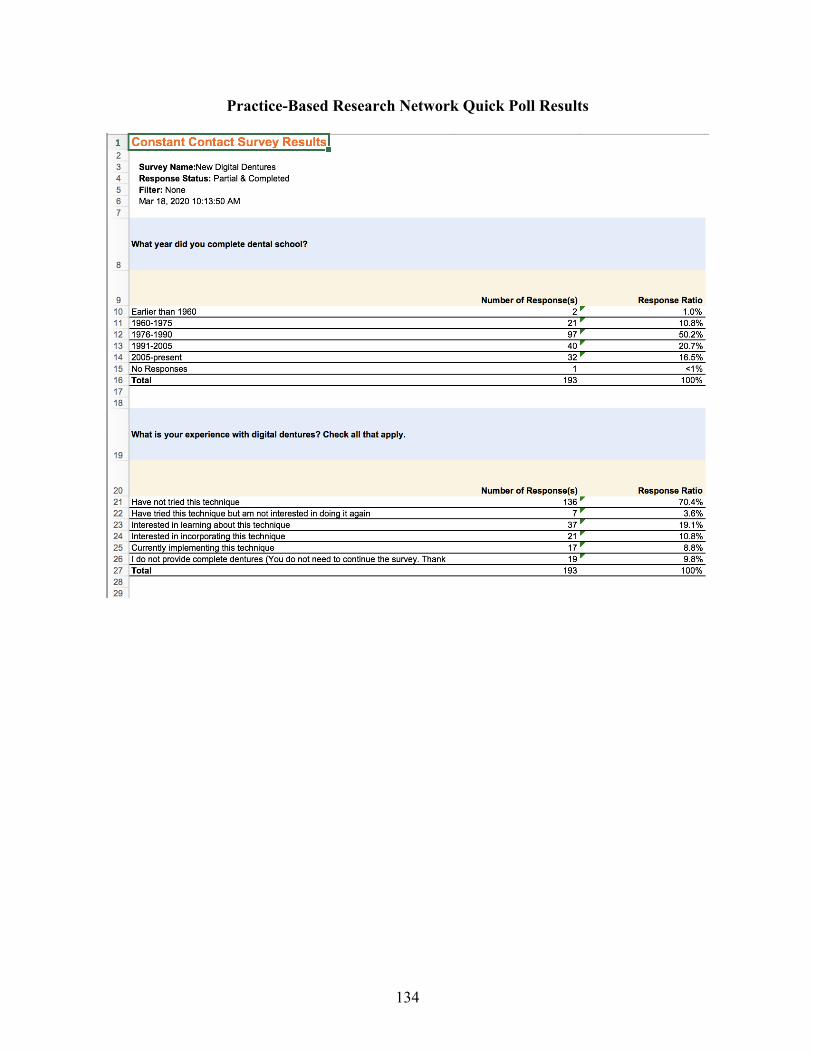
134
Practice-Based Research Network Quick Poll Results
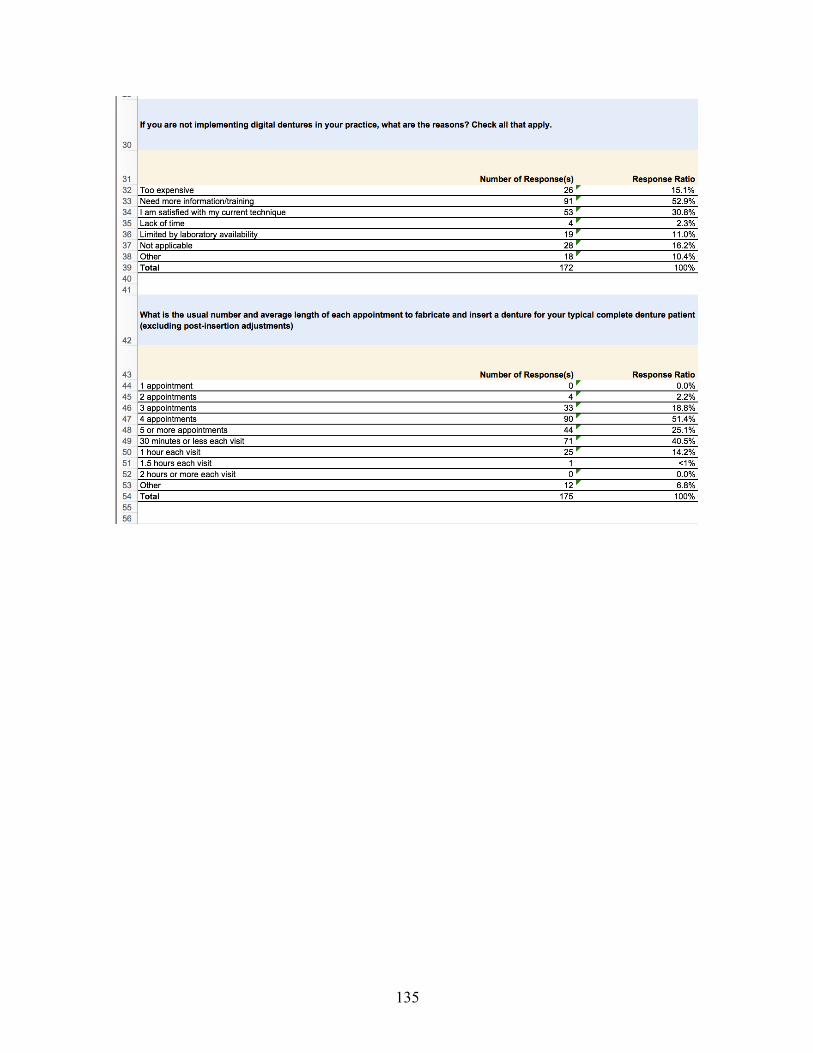
135
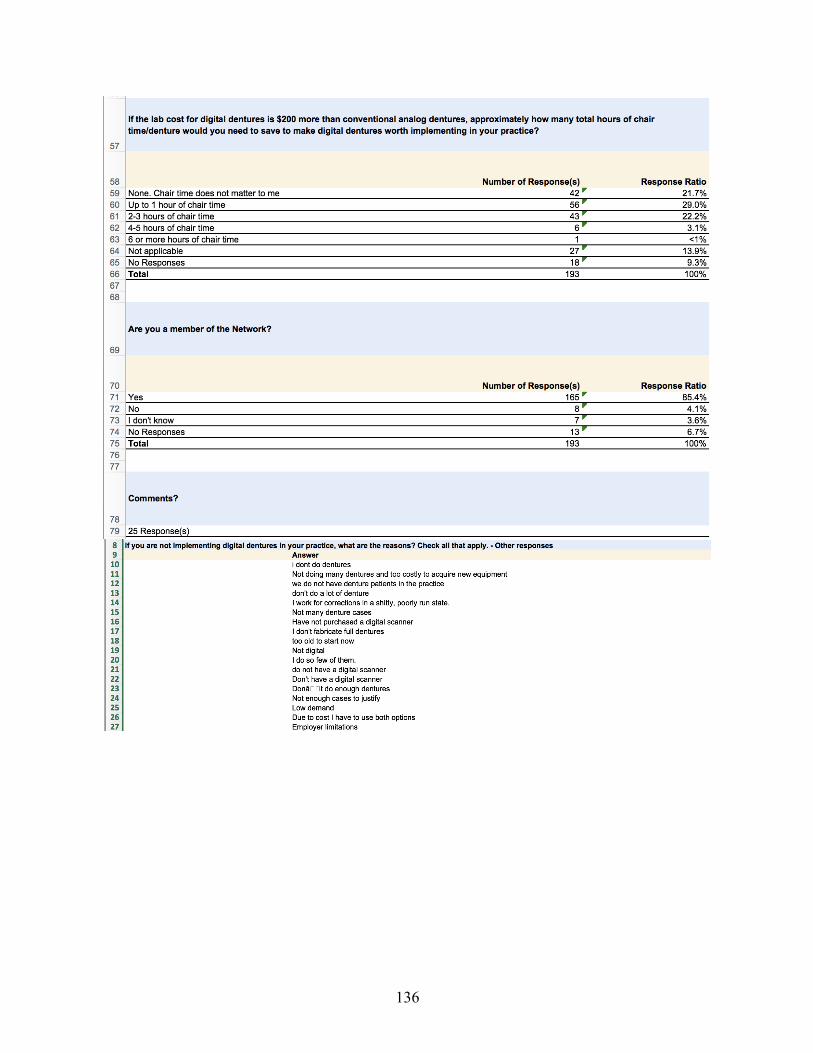
136
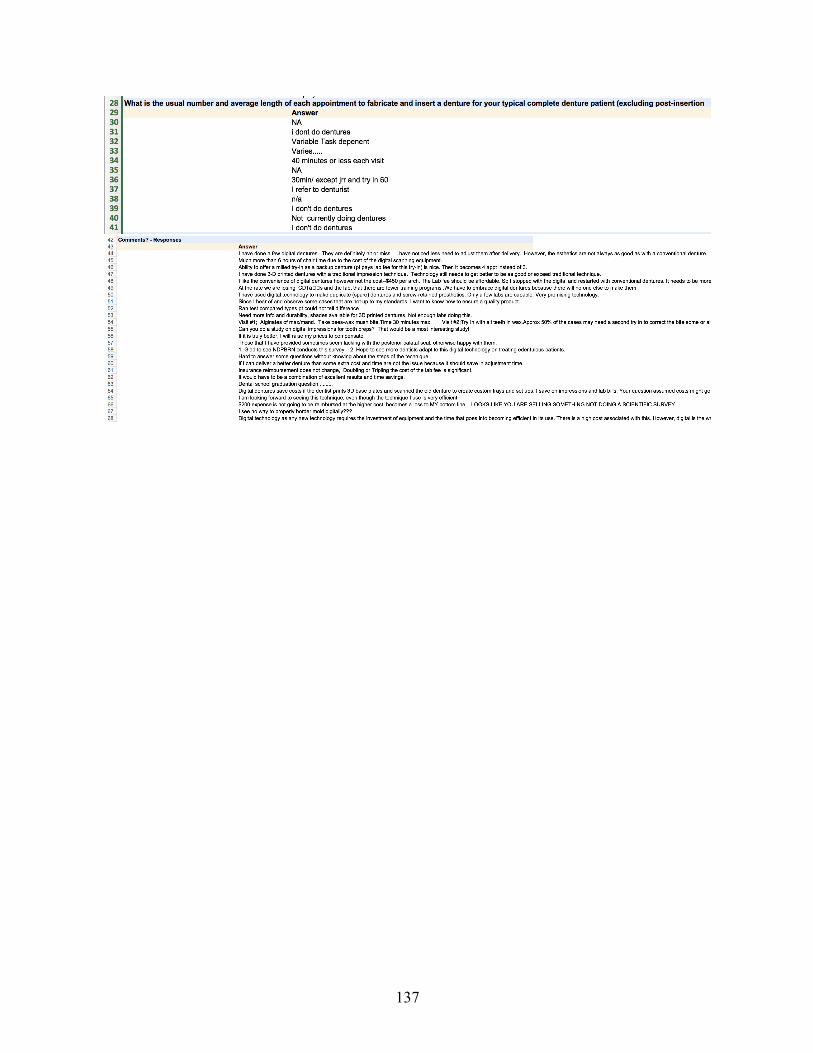
137