Embed Size (px)
Citation preview
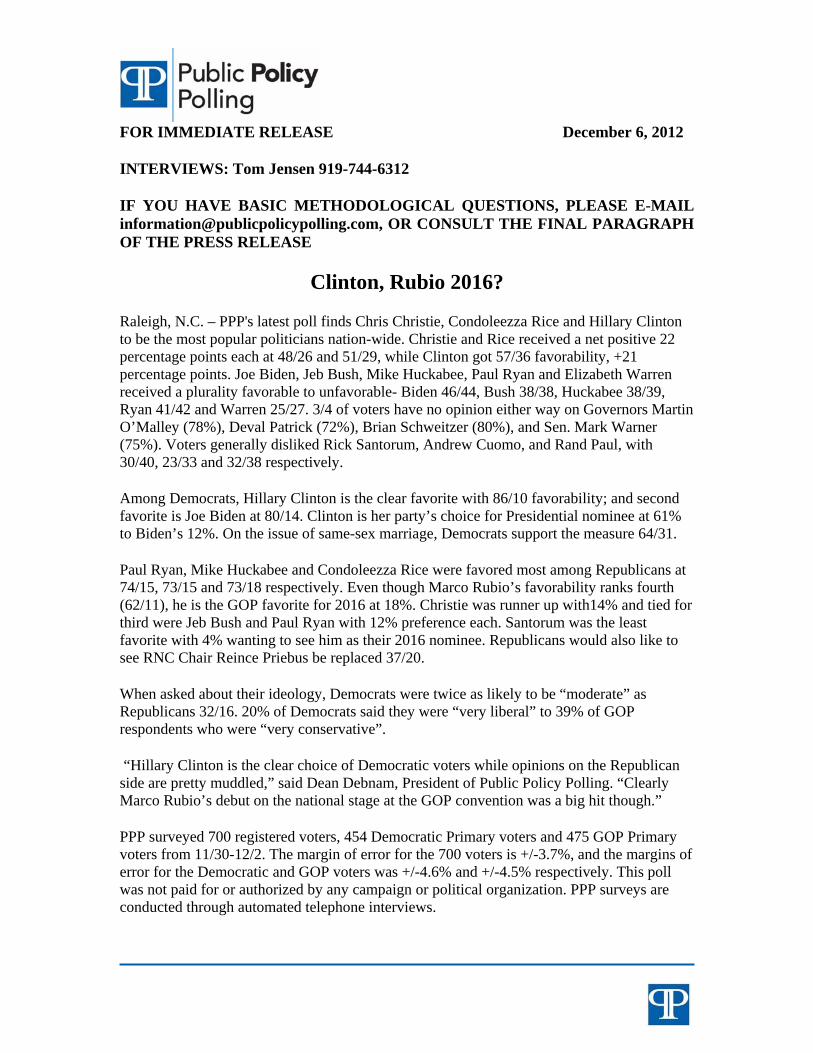
FOR IMMEDIATE RELEASE December 6, 2012 INTERVIEWS: Tom Jensen 919-744-6312 IF YOU HAVE BASIC METHODOLOGICAL QUESTIONS, PLEASE E-MAIL [email protected], OR CONSULT THE FINAL PARAGRAPH OF THE PRESS RELEASE
Clinton, Rubio 2016?
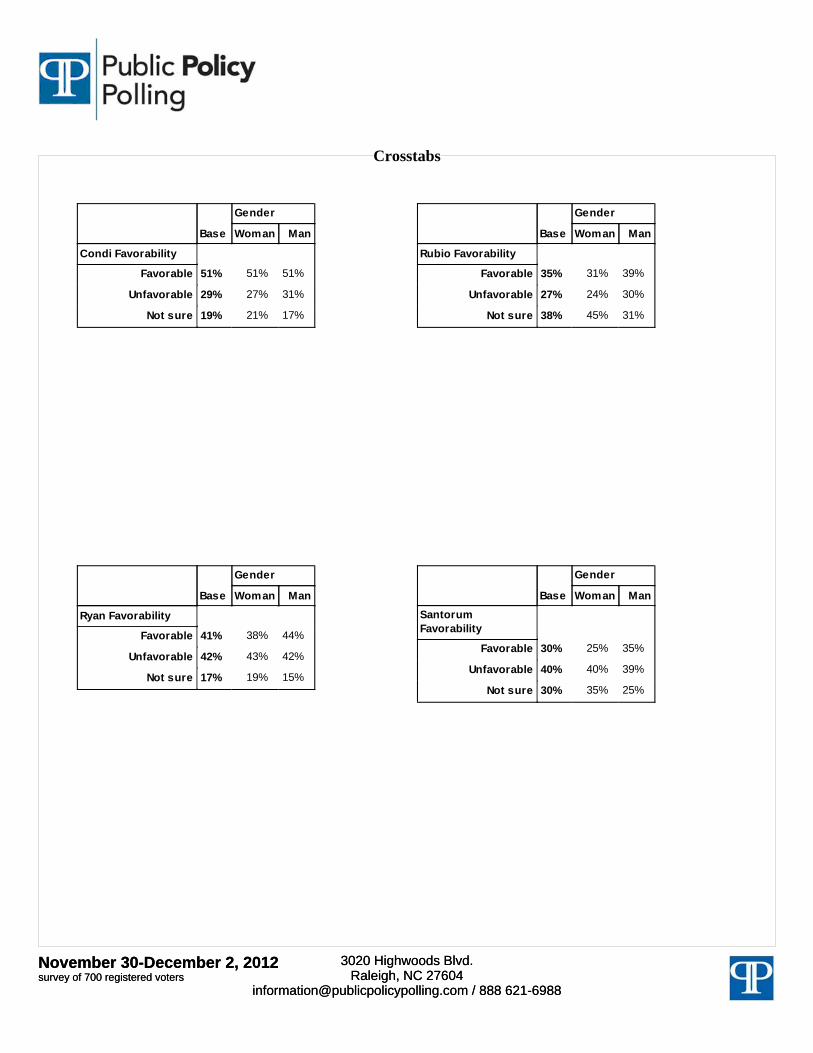
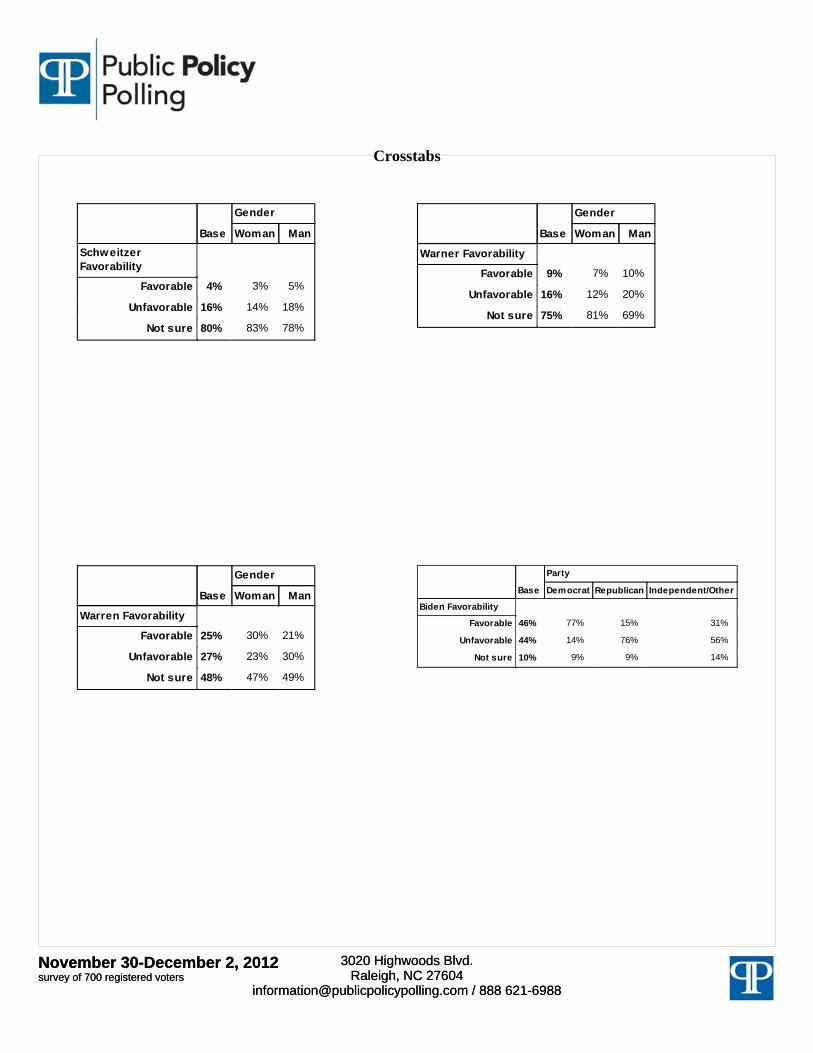
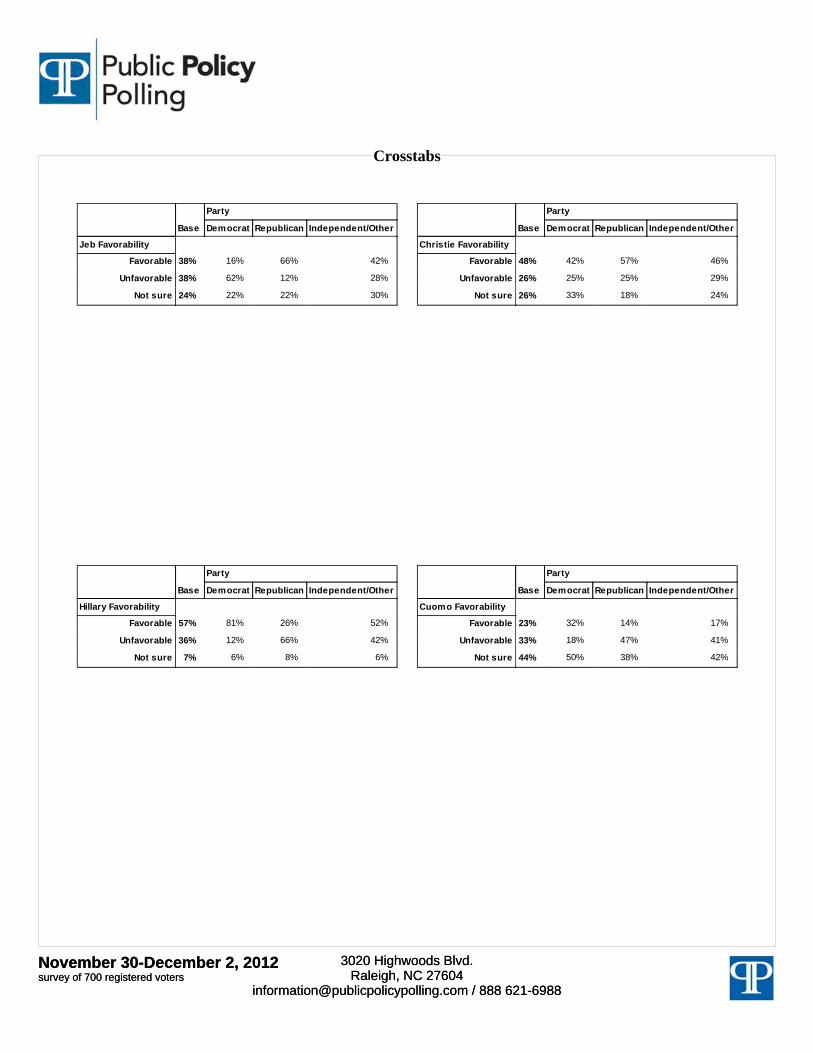
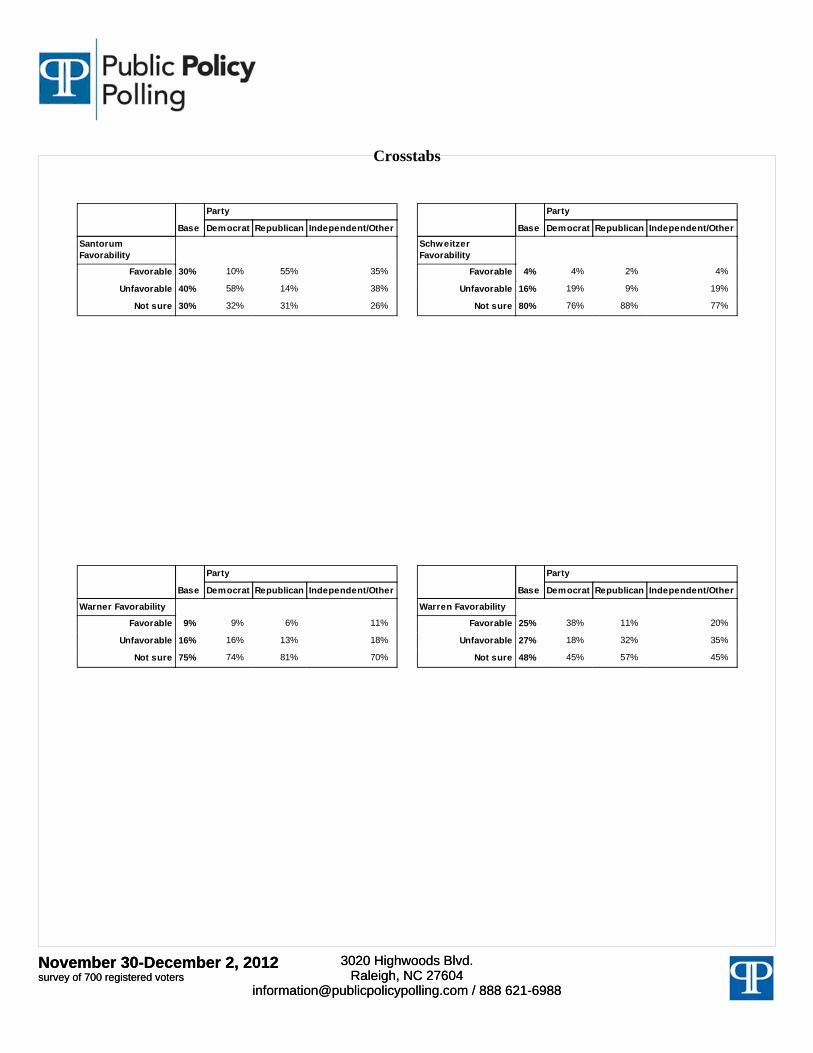
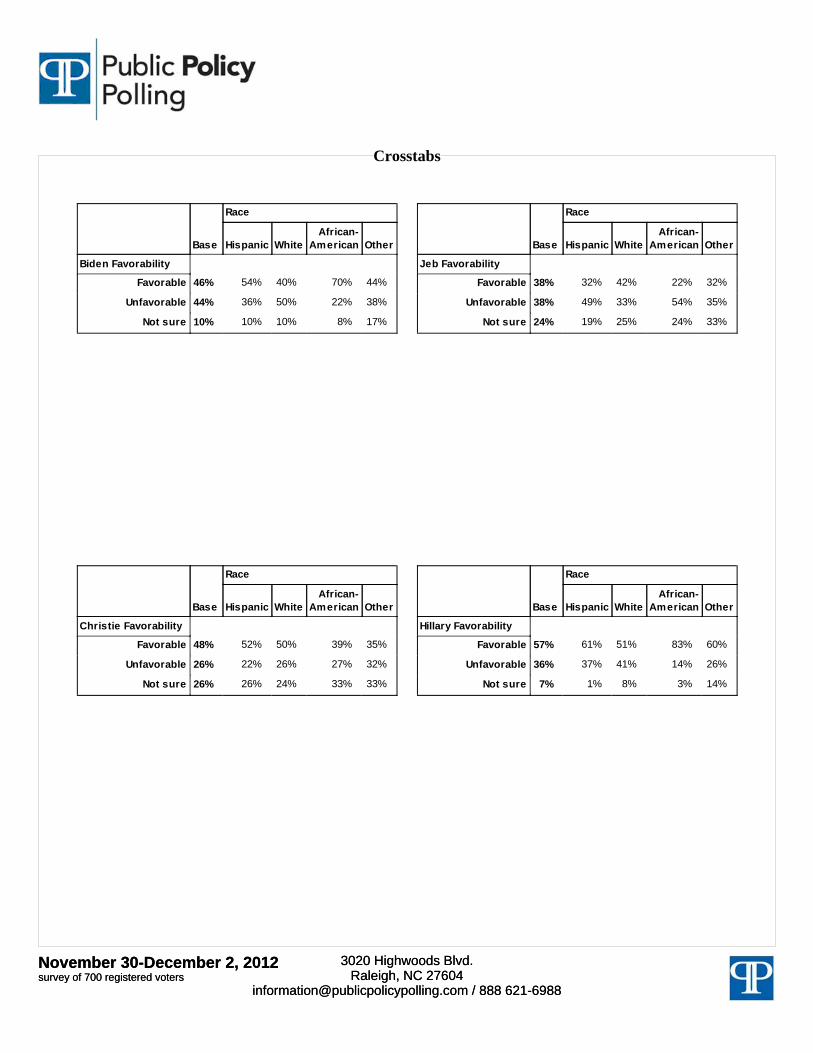
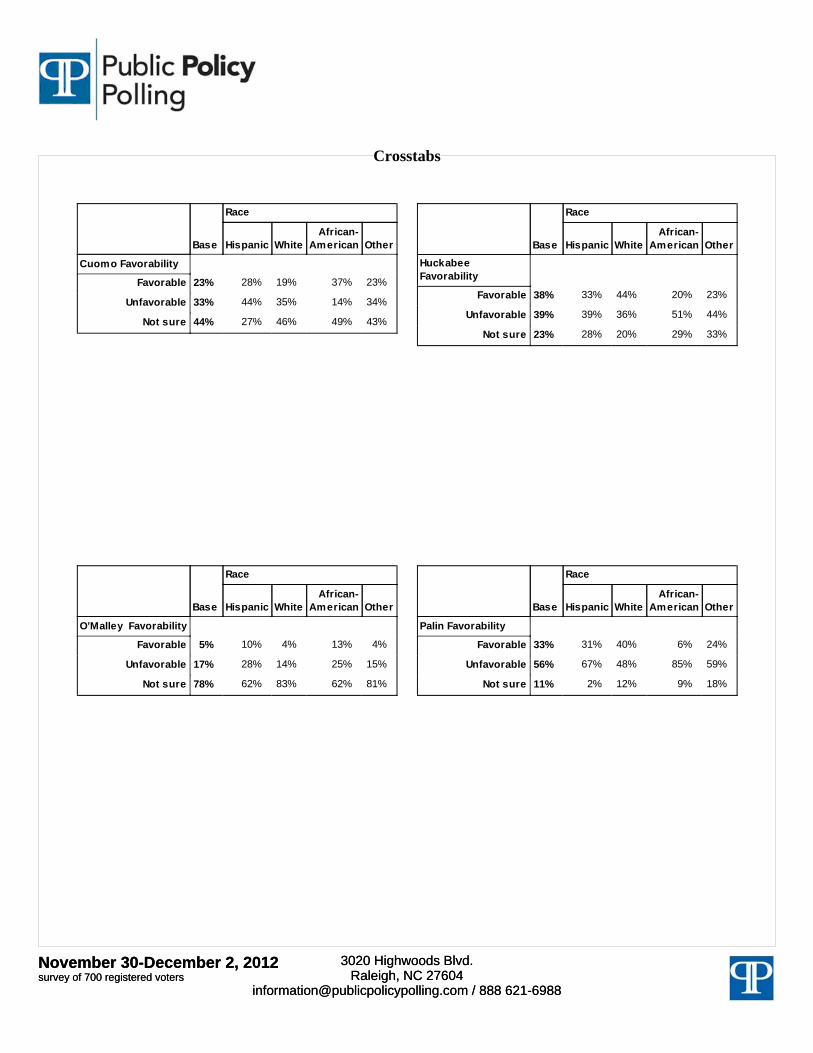
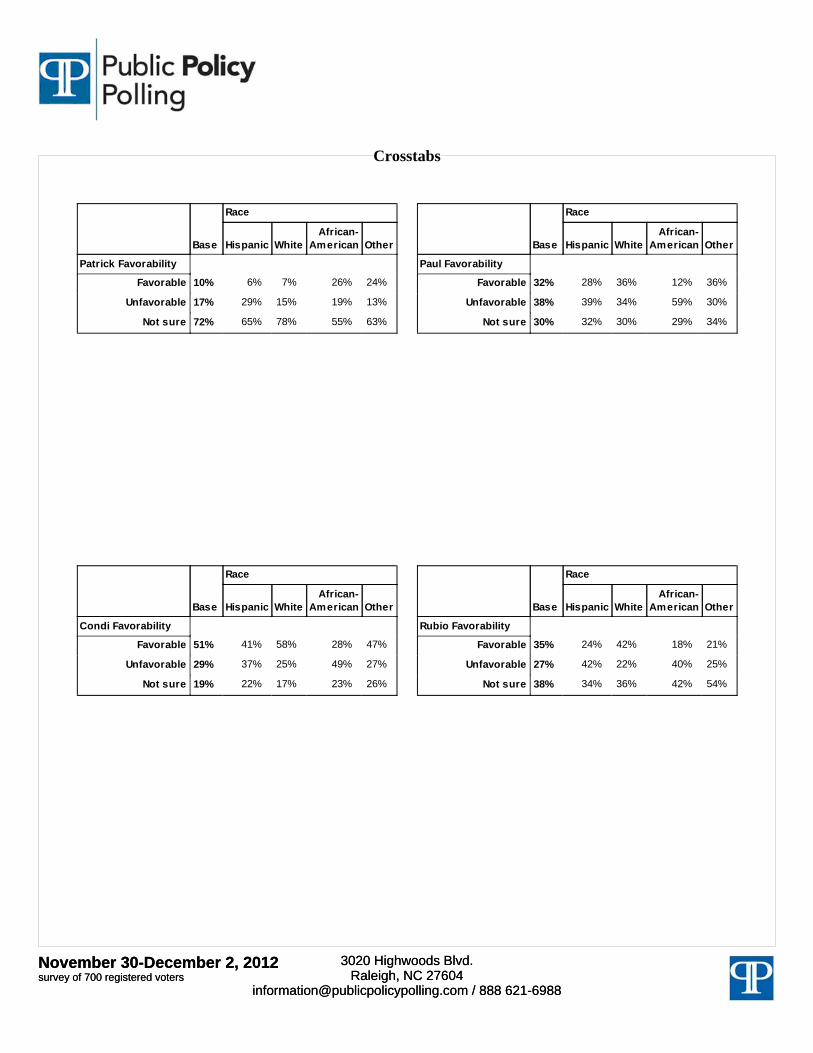
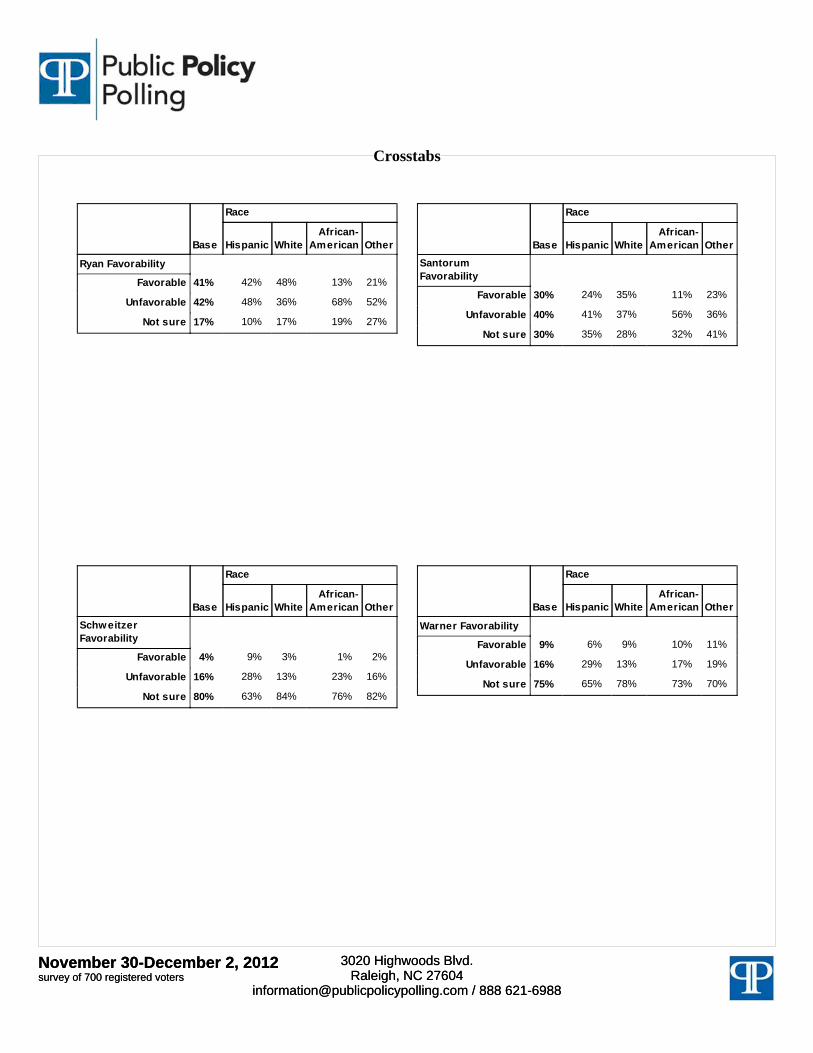
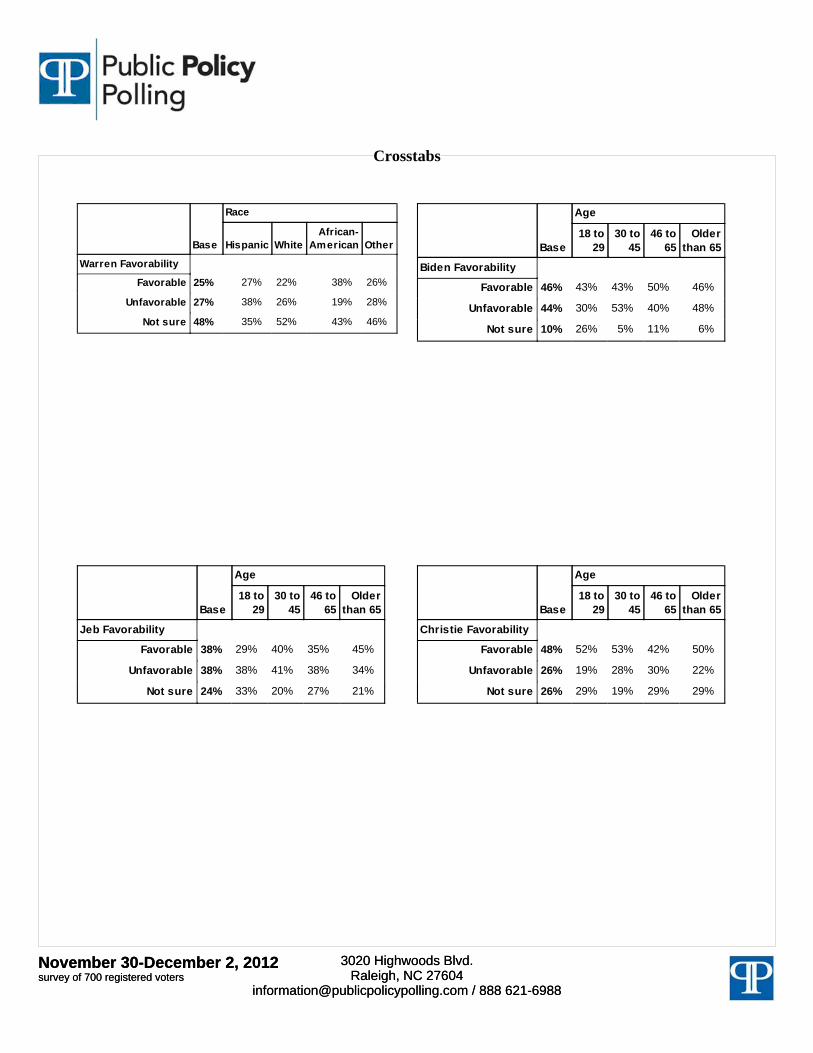
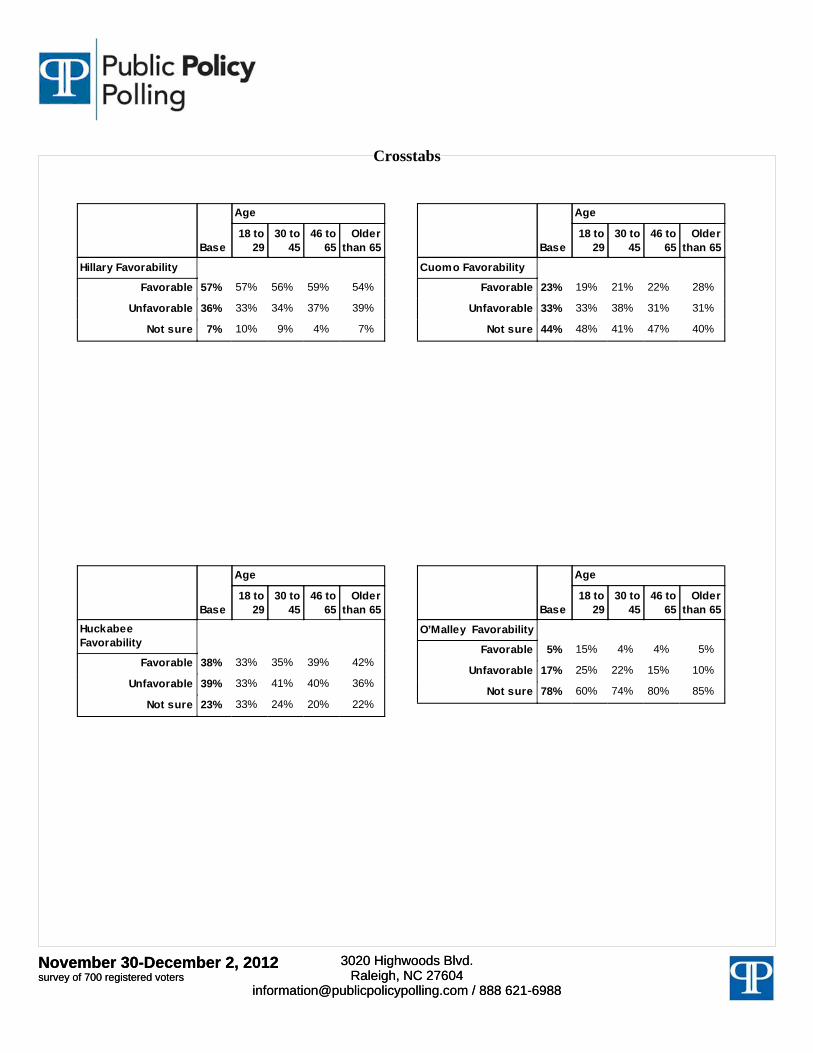
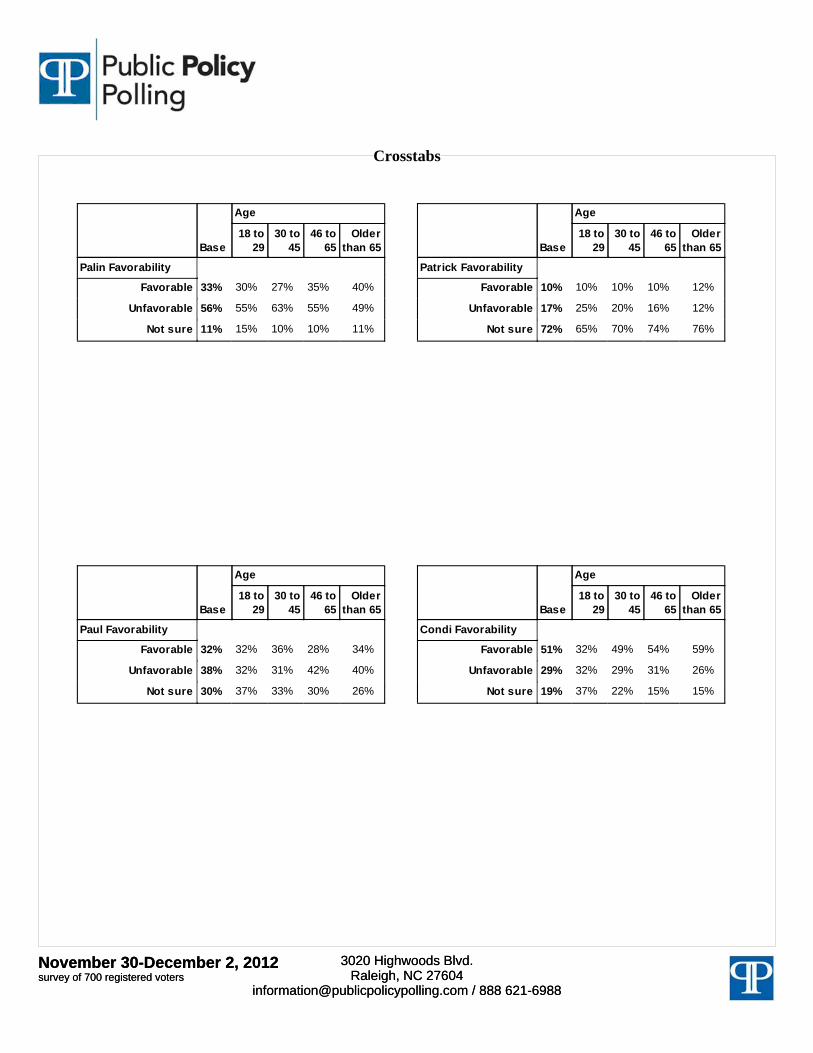
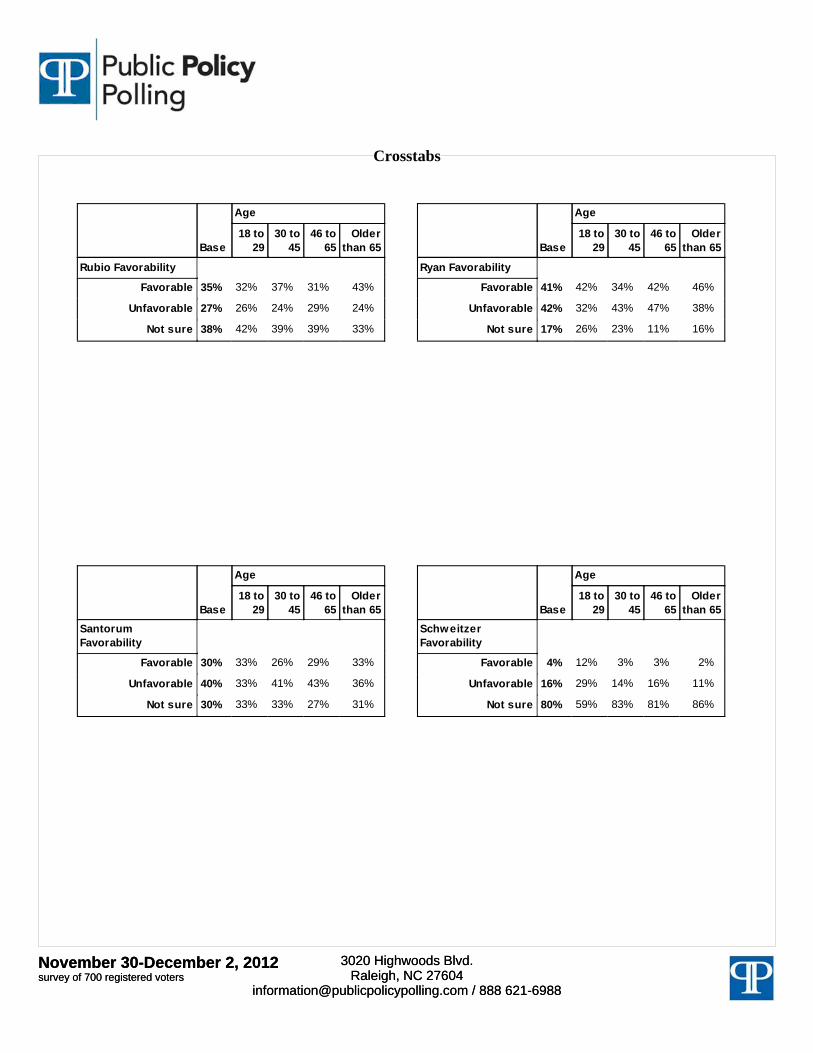
Raleigh, N.C. – PPP's latest poll finds Chris Christie, Condoleezza Rice and Hillary Clinton to be the most popular politicians nation-wide. Christie and Rice received a net positive 22 percentage points each at 48/26 and 51/29, while Clinton got 57/36 favorability, +21 percentage points. Joe Biden, Jeb Bush, Mike Huckabee, Paul Ryan and Elizabeth Warren received a plurality favorable to unfavorable- Biden 46/44, Bush 38/38, Huckabee 38/39, Ryan 41/42 and Warren 25/27. 3/4 of voters have no opinion either way on Governors Martin O’Malley (78%), Deval Patrick (72%), Brian Schweitzer (80%), and Sen. Mark Warner (75%). Voters generally disliked Rick Santorum, Andrew Cuomo, and Rand Paul, with 30/40, 23/33 and 32/38 respectively.
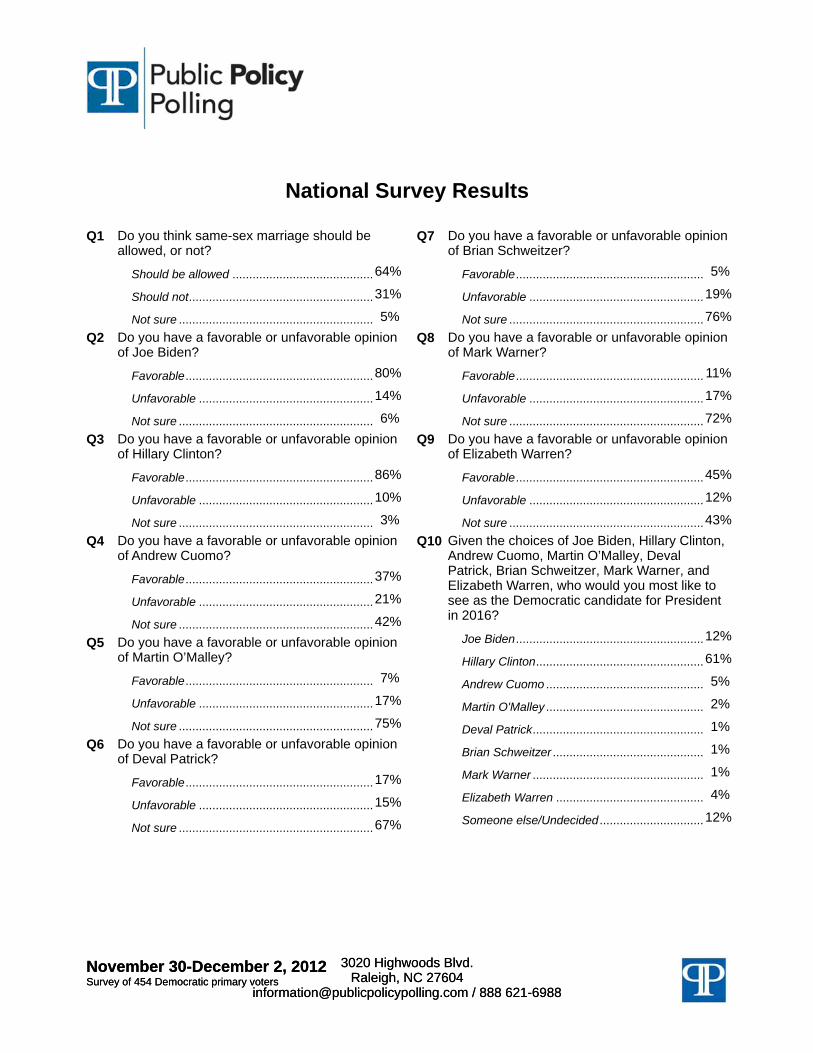
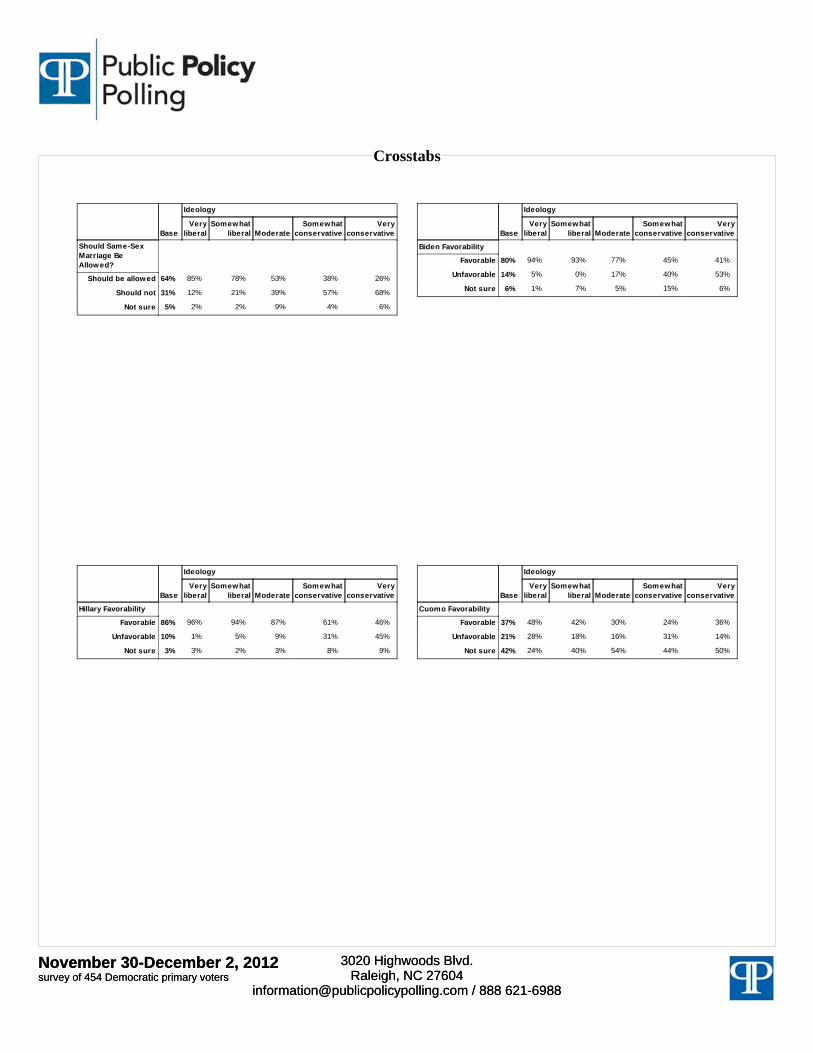
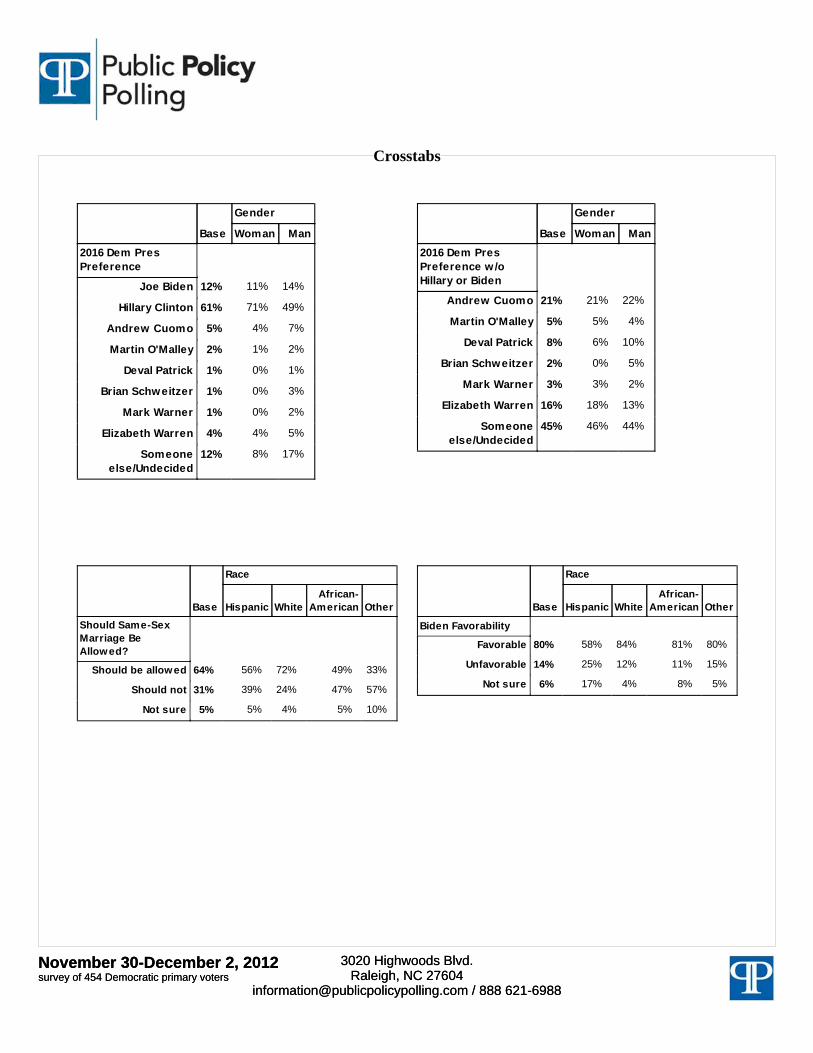
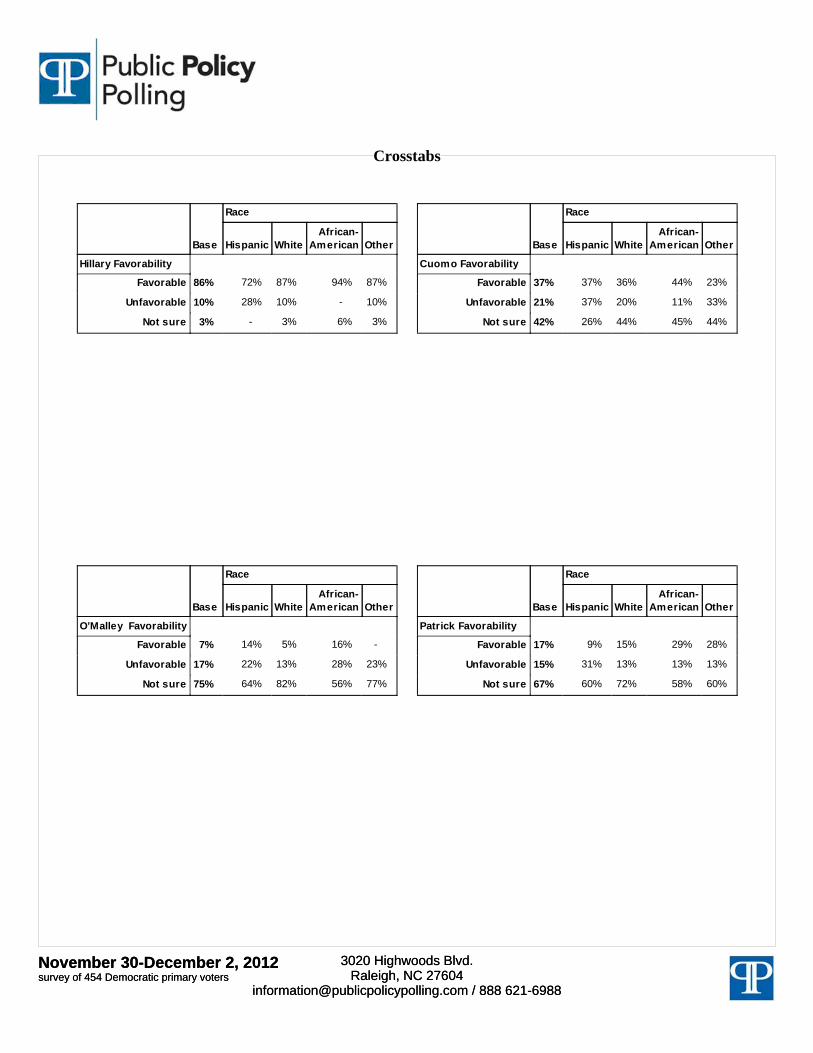
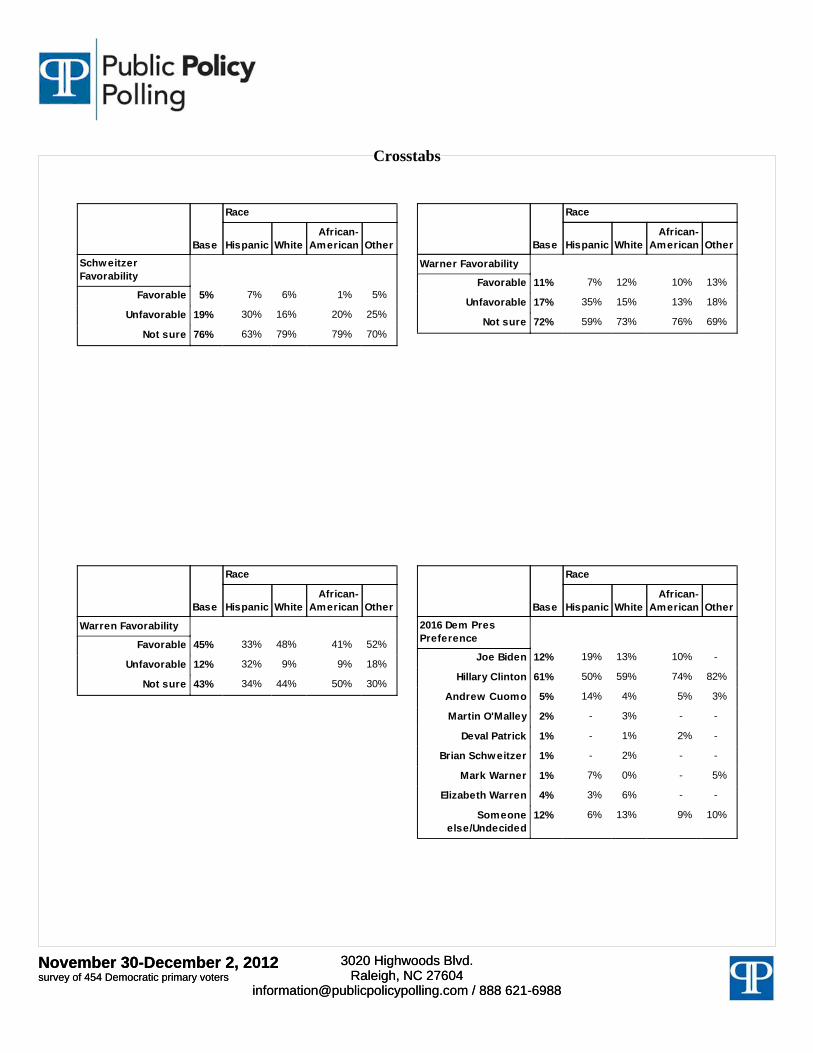
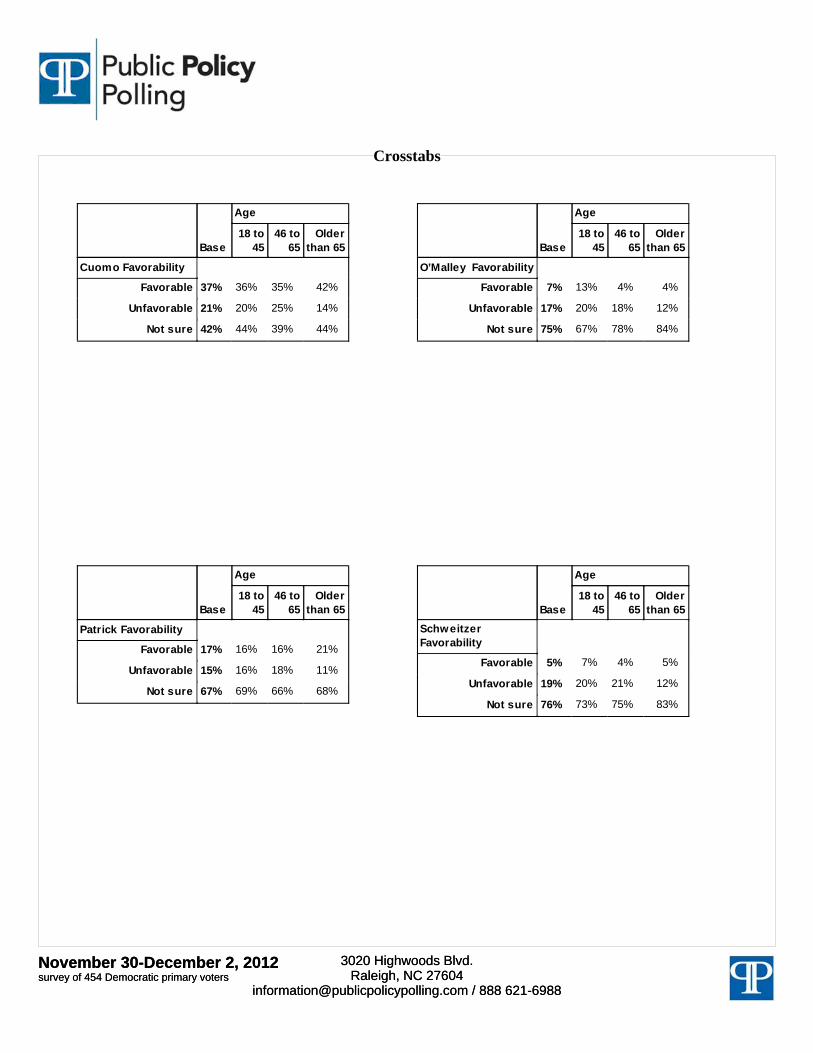
Among Democrats, Hillary Clinton is the clear favorite with 86/10 favorability; and second favorite is Joe Biden at 80/14. Clinton is her party’s choice for Presidential nominee at 61% to Biden’s 12%. On the issue of same-sex marriage, Democrats support the measure 64/31.
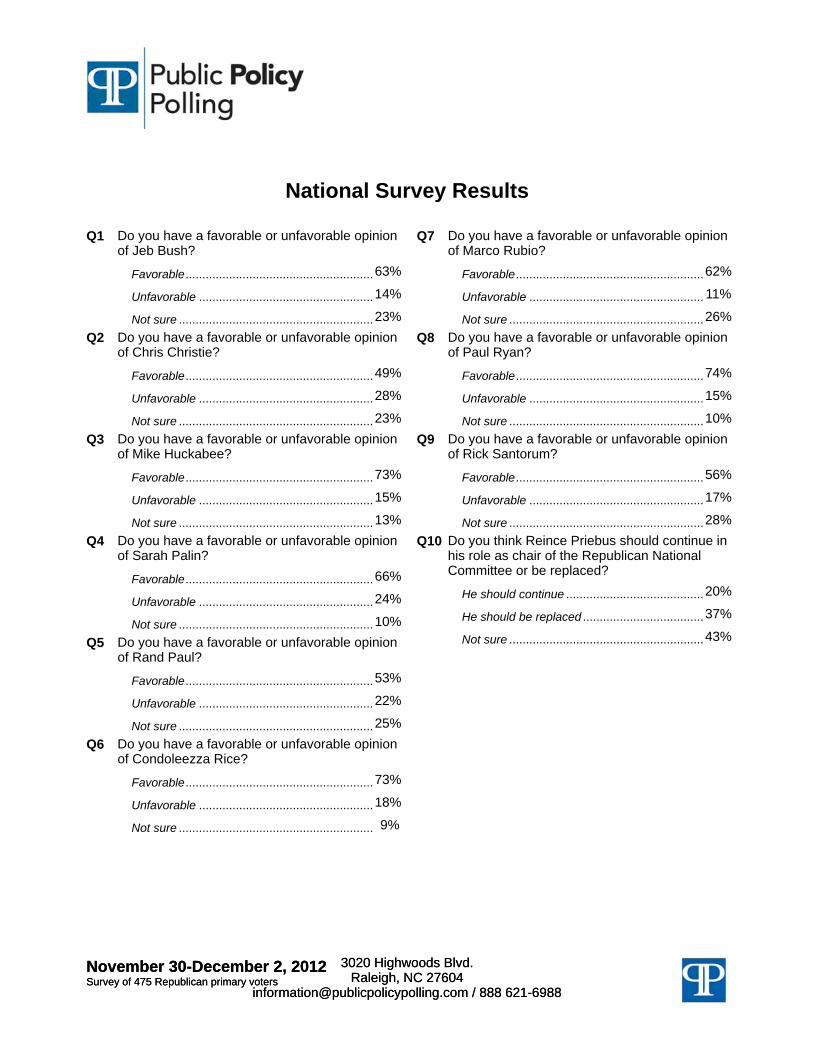
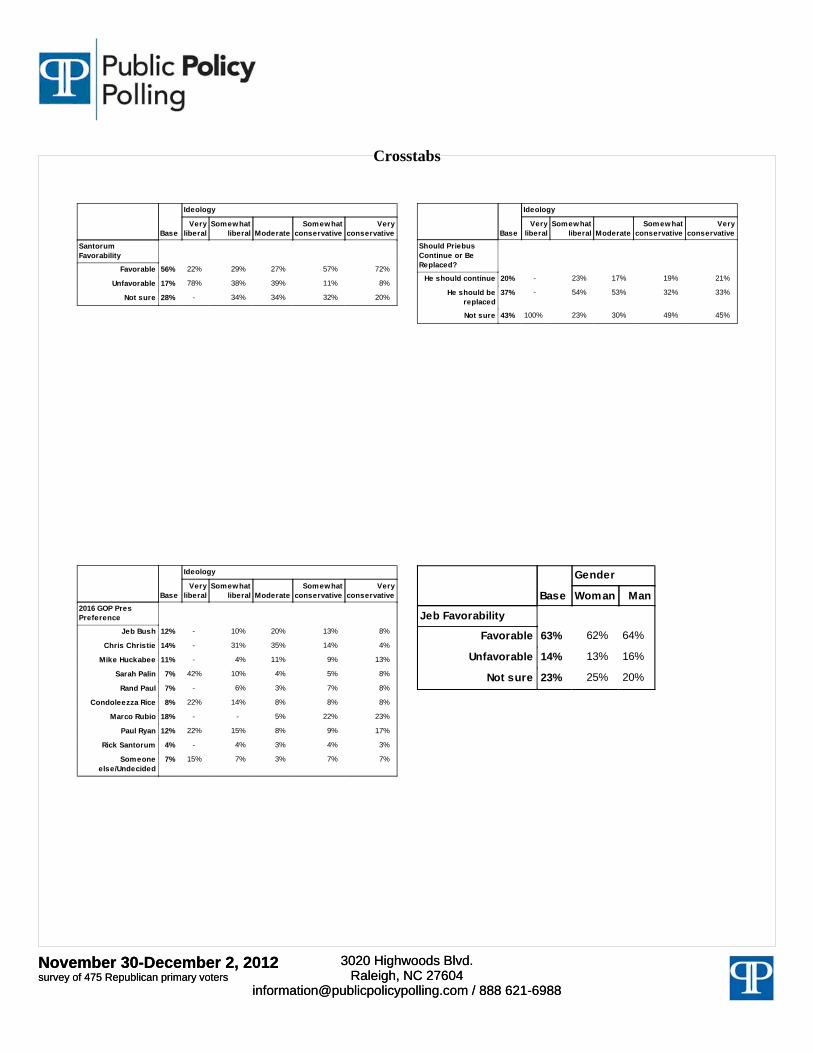
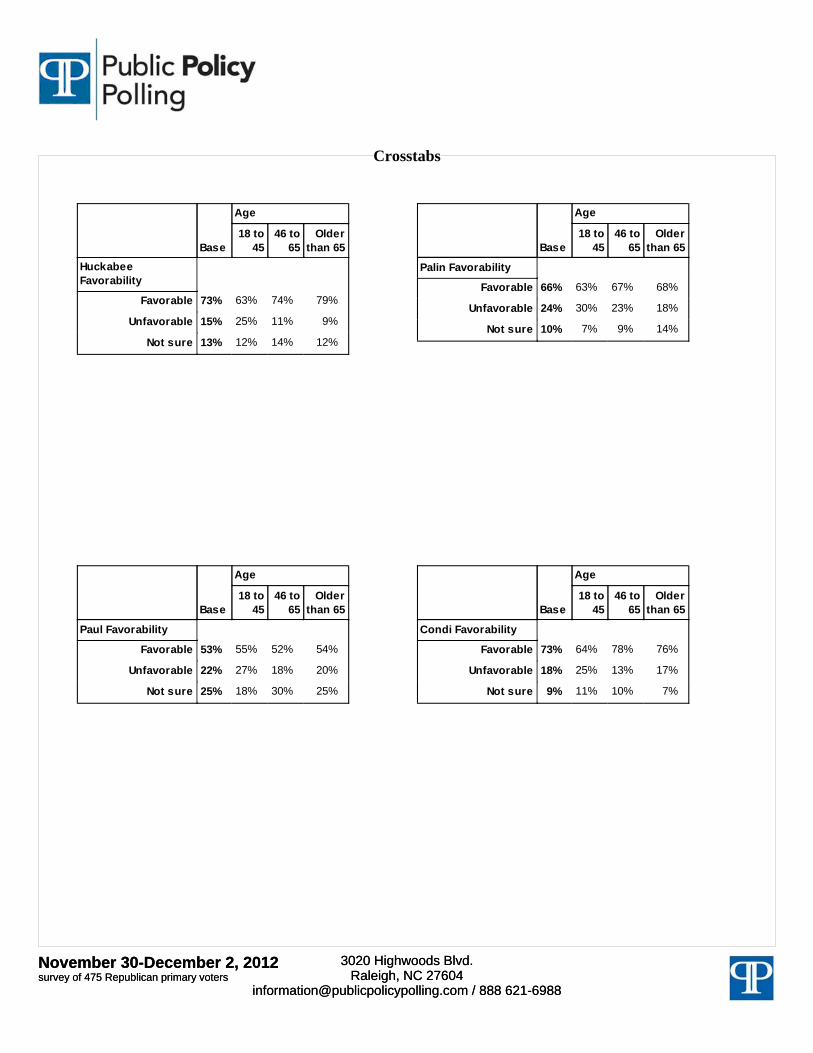
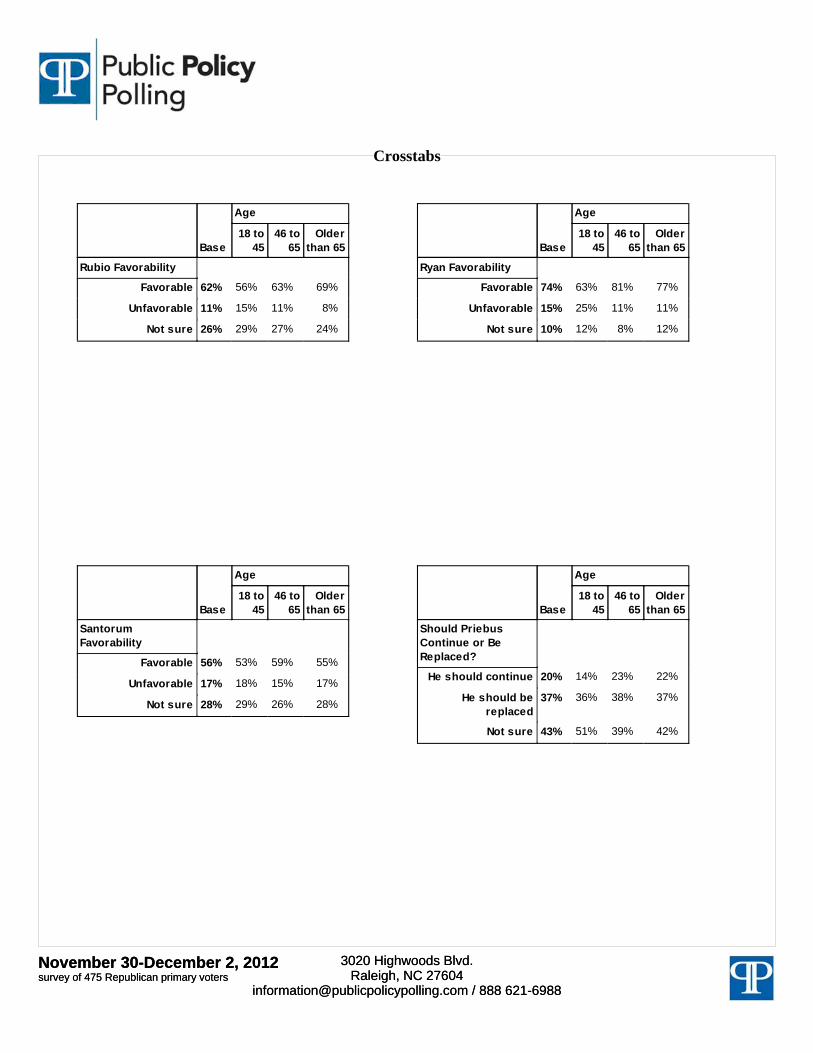
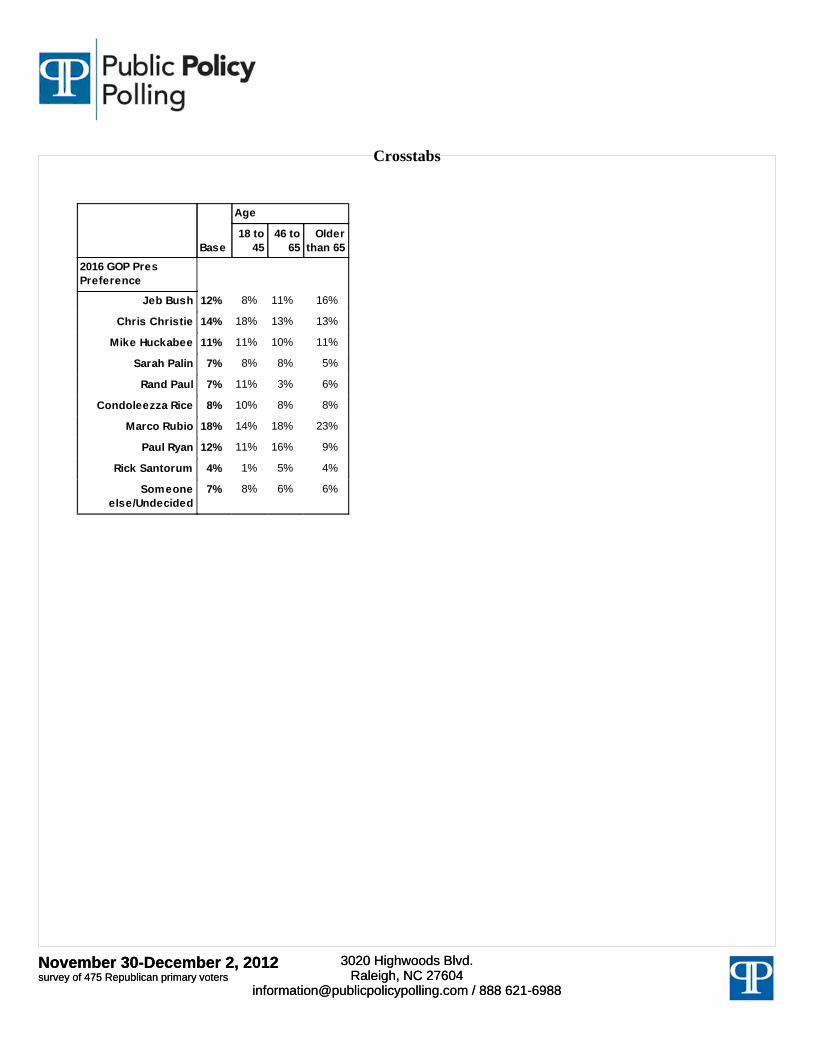
Paul Ryan, Mike Huckabee and Condoleezza Rice were favored most among Republicans at 74/15, 73/15 and 73/18 respectively. Even though Marco Rubio’s favorability ranks fourth (62/11), he is the GOP favorite for 2016 at 18%. Christie was runner up with14% and tied for third were Jeb Bush and Paul Ryan with 12% preference each. Santorum was the least favorite with 4% wanting to see him as their 2016 nominee. Republicans would also like to see RNC Chair Reince Priebus be replaced 37/20.
When asked about their ideology, Democrats were twice as likely to be “moderate” as Republicans 32/16. 20% of Democrats said they were “very liberal” to 39% of GOP respondents who were “very conservative”.
“Hillary Clinton is the clear choice of Democratic voters while opinions on the Republican side are pretty muddled,” said Dean Debnam, President of Public Policy Polling. “Clearly Marco Rubio’s debut on the national stage at the GOP convention was a big hit though.”
PPP surveyed 700 registered voters, 454 Democratic Primary voters and 475 GOP Primary voters from 11/30-12/2. The margin of error for the 700 voters is +/-3.7%, and the margins of error for the Democratic and GOP voters was +/-4.6% and +/-4.5% respectively. This poll was not paid for or authorized by any campaign or political organization. PPP surveys are conducted through automated telephone interviews.
November 30-December 2, 2012Survey of 700 registered votersNovember 30-December 2, 2012Survey of 700 registered voters
3020 Highwoods Blvd.Raleigh, NC 27604
[email protected] / 888 621-6988
3020 Highwoods Blvd.Raleigh, NC 27604
[email protected] / 888 621-6988
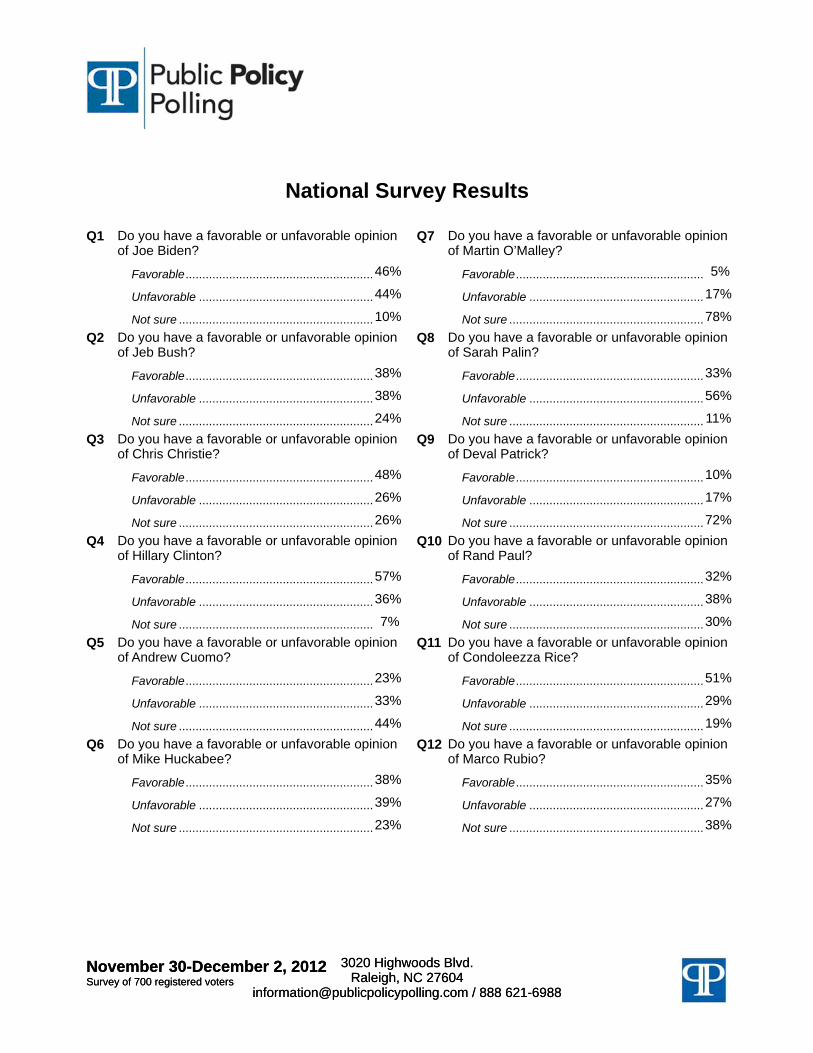
National Survey Results
Q1 Do you have a favorable or unfavorable opinion of Joe Biden?
46% Favorable........................................................
44% Unfavorable ....................................................
10% Not sure ..........................................................
Q2 Do you have a favorable or unfavorable opinion of Jeb Bush?
38% Favorable........................................................
38% Unfavorable ....................................................
24% Not sure ..........................................................
Q3 Do you have a favorable or unfavorable opinion of Chris Christie?
48% Favorable........................................................
26% Unfavorable ....................................................
26% Not sure ..........................................................
Q4 Do you have a favorable or unfavorable opinion of Hillary Clinton?
57% Favorable........................................................
36% Unfavorable ....................................................
7% Not sure ..........................................................
Q5 Do you have a favorable or unfavorable opinion of Andrew Cuomo?
23% Favorable........................................................
33% Unfavorable ....................................................
44% Not sure ..........................................................
Q6 Do you have a favorable or unfavorable opinion of Mike Huckabee?
38% Favorable........................................................
39% Unfavorable ....................................................
23% Not sure ..........................................................
Q7 Do you have a favorable or unfavorable opinion of Martin O’Malley?
5% Favorable........................................................
17% Unfavorable ....................................................
78% Not sure ..........................................................
Q8 Do you have a favorable or unfavorable opinion of Sarah Palin?
33% Favorable........................................................
56% Unfavorable ....................................................
11% Not sure ..........................................................
Q9 Do you have a favorable or unfavorable opinion of Deval Patrick?
10% Favorable........................................................
17% Unfavorable ....................................................
72% Not sure ..........................................................
Q10 Do you have a favorable or unfavorable opinion of Rand Paul?
32% Favorable........................................................
38% Unfavorable ....................................................
30% Not sure ..........................................................
Q11 Do you have a favorable or unfavorable opinion of Condoleezza Rice?
51% Favorable........................................................
29% Unfavorable ....................................................
19% Not sure ..........................................................
Q12 Do you have a favorable or unfavorable opinion of Marco Rubio?
35% Favorable........................................................
27% Unfavorable ....................................................
38% Not sure ..........................................................
November 30-December 2, 2012Survey of 700 registered votersNovember 30-December 2, 2012Survey of 700 registered voters
3020 Highwoods Blvd.Raleigh, NC 27604
[email protected] / 888 621-6988
3020 Highwoods Blvd.Raleigh, NC 27604
[email protected] / 888 621-6988
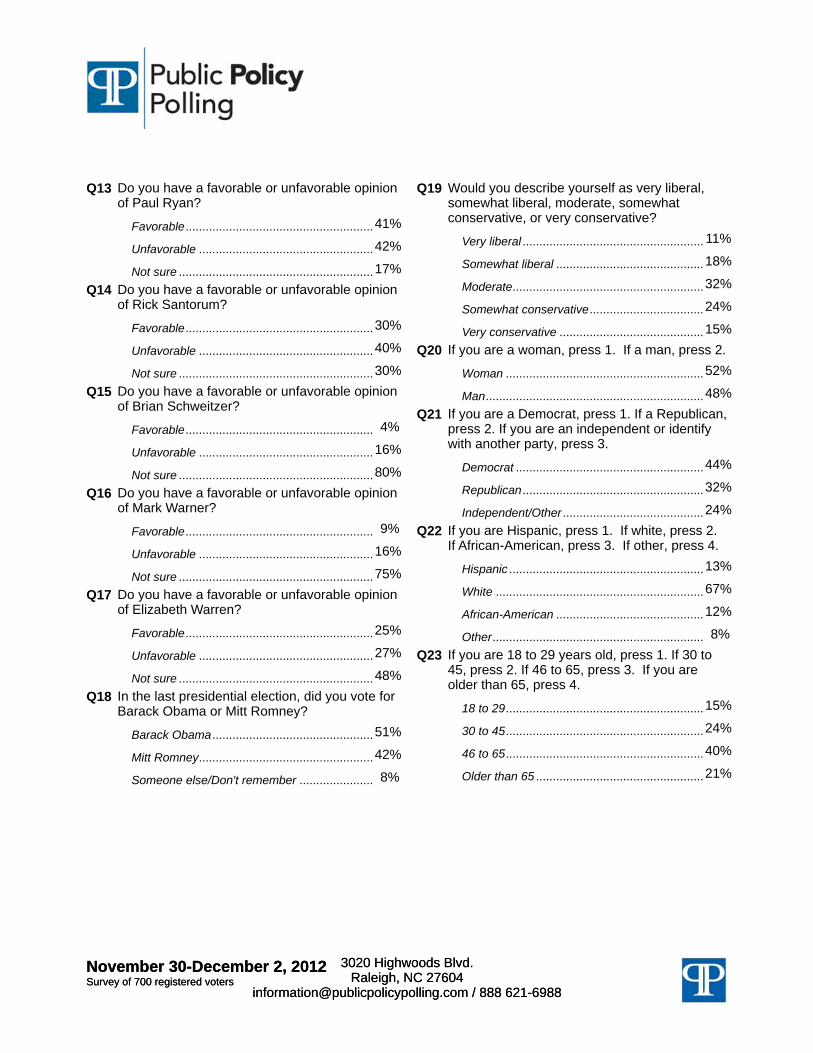
Q13 Do you have a favorable or unfavorable opinion of Paul Ryan?
41% Favorable........................................................
42% Unfavorable ....................................................
17% Not sure ..........................................................
Q14 Do you have a favorable or unfavorable opinion of Rick Santorum?
30% Favorable........................................................
40% Unfavorable ....................................................
30% Not sure ..........................................................
Q15 Do you have a favorable or unfavorable opinion of Brian Schweitzer?
4% Favorable........................................................
16% Unfavorable ....................................................
80% Not sure ..........................................................
Q16 Do you have a favorable or unfavorable opinion of Mark Warner?
9% Favorable........................................................
16% Unfavorable ....................................................
75% Not sure ..........................................................
Q17 Do you have a favorable or unfavorable opinion of Elizabeth Warren?
25% Favorable........................................................
27% Unfavorable ....................................................
48% Not sure ..........................................................
Q18 In the last presidential election, did you vote for Barack Obama or Mitt Romney?
51% Barack Obama ................................................
42% Mitt Romney....................................................
8% Someone else/Don't remember ......................
Q19 Would you describe yourself as very liberal, somewhat liberal, moderate, somewhat conservative, or very conservative?
11% Very liberal ......................................................
18% Somewhat liberal ............................................
32% Moderate.........................................................
24% Somewhat conservative..................................
15% Very conservative ...........................................
Q20 If you are a woman, press 1. If a man, press 2.
52% Woman ...........................................................
48% Man.................................................................
Q21 If you are a Democrat, press 1. If a Republican, press 2. If you are an independent or identify with another party, press 3.
44% Democrat ........................................................
32% Republican......................................................
24% Independent/Other ..........................................
Q22 If you are Hispanic, press 1. If white, press 2. If African-American, press 3. If other, press 4.
13% Hispanic ..........................................................
67% White ..............................................................
12% African-American ............................................
8% Other...............................................................
Q23 If you are 18 to 29 years old, press 1. If 30 to 45, press 2. If 46 to 65, press 3. If you are older than 65, press 4.
15% 18 to 29...........................................................
24% 30 to 45...........................................................
40% 46 to 65...........................................................
21% Older than 65 ..................................................
November 30-December 2, 2012survey of 700 registered votersNovember 30-December 2, 2012survey of 700 registered voters
3020 Highwoods Blvd.Raleigh, NC 27604
[email protected] / 888 621-6988
3020 Highwoods Blvd.Raleigh, NC 27604
[email protected] / 888 621-6988
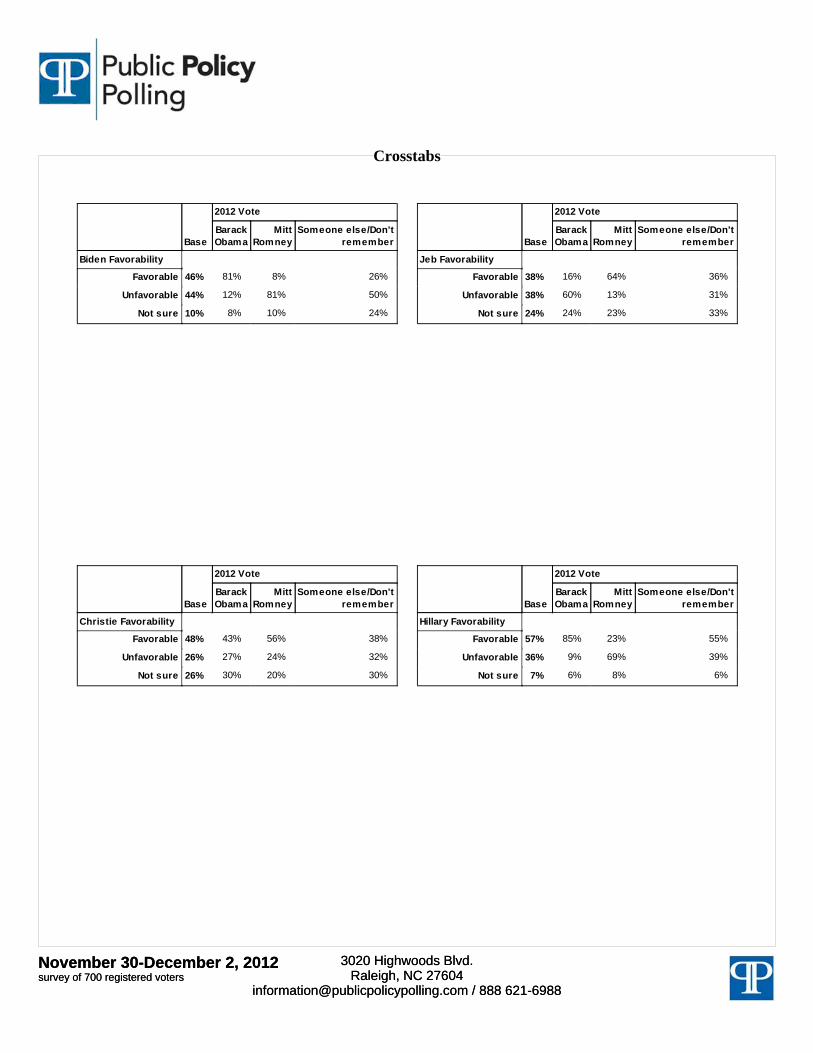
Crosstabs
Base
2012 Vote
BarackObama
MittRomney
Someone else/Don'tremember
Biden Favorability
Favorable
Unfavorable
Not sure
46% 81% 8% 26%
44% 12% 81% 50%
10% 8% 10% 24%
Base
2012 Vote
BarackObama
MittRomney
Someone else/Don'tremember
Jeb Favorability
Favorable
Unfavorable
Not sure
38% 16% 64% 36%
38% 60% 13% 31%
24% 24% 23% 33%
Base
2012 Vote
BarackObama
MittRomney
Someone else/Don'tremember
Christie Favorability
Favorable
Unfavorable
Not sure
48% 43% 56% 38%
26% 27% 24% 32%
26% 30% 20% 30%
Base
2012 Vote
BarackObama
MittRomney
Someone else/Don'tremember
Hillary Favorability
Favorable
Unfavorable
Not sure
57% 85% 23% 55%
36% 9% 69% 39%
7% 6% 8% 6%

November 30-December 2, 2012survey of 700 registered votersNovember 30-December 2, 2012survey of 700 registered voters
3020 Highwoods Blvd.Raleigh, NC 27604
[email protected] / 888 621-6988
3020 Highwoods Blvd.Raleigh, NC 27604
[email protected] / 888 621-6988
Crosstabs
Base
2012 Vote
BarackObama
MittRomney
Someone else/Don'tremember
Cuomo Favorability
Favorable
Unfavorable
Not sure
23% 32% 12% 15%
33% 21% 46% 43%
44% 46% 42% 42%
Base
2012 Vote
BarackObama
MittRomney
Someone else/Don'tremember
HuckabeeFavorability
Favorable
Unfavorable
Not sure
38% 12% 73% 24%
39% 60% 13% 42%
23% 28% 15% 34%
Base
2012 Vote
BarackObama
MittRomney
Someone else/Don'tremember
O’Malley Favorability
Favorable
Unfavorable
Not sure
5% 8% 3% -
17% 18% 15% 17%
78% 73% 82% 83%
Base
2012 Vote
BarackObama
MittRomney
Someone else/Don'tremember
Palin Favorability
Favorable
Unfavorable
Not sure
33% 4% 67% 43%
56% 86% 20% 53%
11% 10% 13% 4%

November 30-December 2, 2012survey of 700 registered votersNovember 30-December 2, 2012survey of 700 registered voters
3020 Highwoods Blvd.Raleigh, NC 27604
[email protected] / 888 621-6988
3020 Highwoods Blvd.Raleigh, NC 27604
[email protected] / 888 621-6988
Crosstabs
Base
2012 Vote
BarackObama
MittRomney
Someone else/Don'tremember
Patrick Favorability
Favorable
Unfavorable
Not sure
10% 16% 5% 1%
17% 17% 14% 33%
72% 66% 81% 66%
Base
2012 Vote
BarackObama
MittRomney
Someone else/Don'tremember
Paul Favorability
Favorable
Unfavorable
Not sure
32% 13% 52% 52%
38% 55% 19% 24%
30% 32% 29% 24%
Base
2012 Vote
BarackObama
MittRomney
Someone else/Don'tremember
Condi Favorability
Favorable
Unfavorable
Not sure
51% 34% 71% 63%
29% 43% 14% 21%
19% 23% 15% 16%
Base
2012 Vote
BarackObama
MittRomney
Someone else/Don'tremember
Rubio Favorability
Favorable
Unfavorable
Not sure
35% 12% 65% 30%
27% 43% 7% 23%
38% 45% 28% 46%
November 30-December 2, 2012survey of 700 registered votersNovember 30-December 2, 2012survey of 700 registered voters
3020 Highwoods Blvd.Raleigh, NC 27604
[email protected] / 888 621-6988
3020 Highwoods Blvd.Raleigh, NC 27604
[email protected] / 888 621-6988
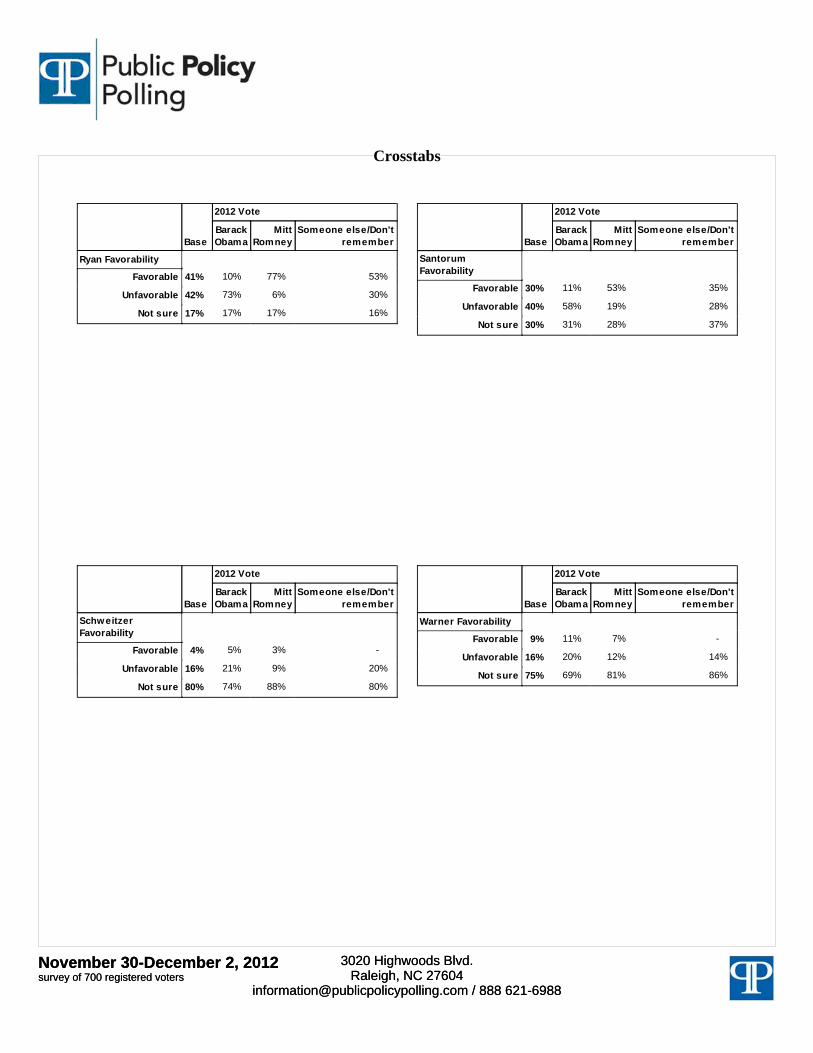
Crosstabs
Base
2012 Vote
BarackObama
MittRomney
Someone else/Don'tremember
Ryan Favorability
Favorable
Unfavorable
Not sure
41% 10% 77% 53%
42% 73% 6% 30%
17% 17% 17% 16%
Base
2012 Vote
BarackObama
MittRomney
Someone else/Don'tremember
SantorumFavorability
Favorable
Unfavorable
Not sure
30% 11% 53% 35%
40% 58% 19% 28%
30% 31% 28% 37%
Base
2012 Vote
BarackObama
MittRomney
Someone else/Don'tremember
SchweitzerFavorability
Favorable
Unfavorable
Not sure
4% 5% 3% -
16% 21% 9% 20%
80% 74% 88% 80%
Base
2012 Vote
BarackObama
MittRomney
Someone else/Don'tremember
Warner Favorability
Favorable
Unfavorable
Not sure
9% 11% 7% -
16% 20% 12% 14%
75% 69% 81% 86%
November 30-December 2, 2012survey of 700 registered votersNovember 30-December 2, 2012survey of 700 registered voters
3020 Highwoods Blvd.Raleigh, NC 27604
[email protected] / 888 621-6988
3020 Highwoods Blvd.Raleigh, NC 27604
[email protected] / 888 621-6988
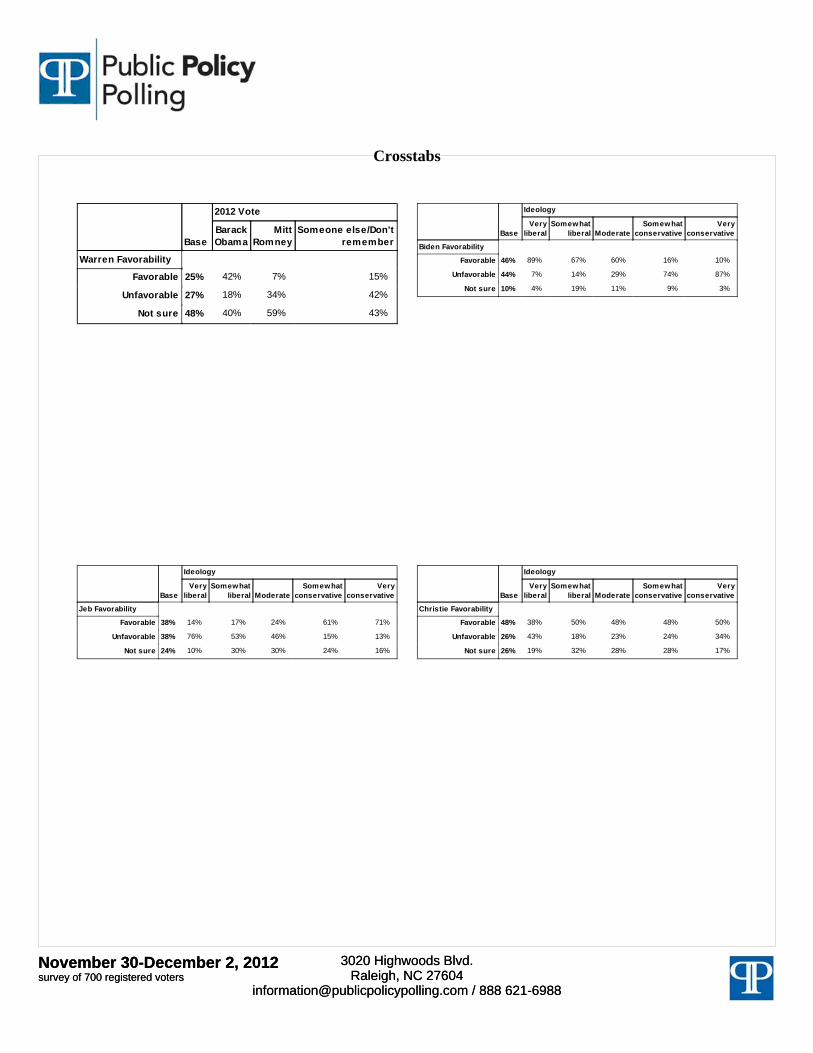
Crosstabs
Base
2012 Vote
BarackObama
MittRomney
Someone else/Don'tremember
Warren Favorability
Favorable
Unfavorable
Not sure
25% 42% 7% 15%
27% 18% 34% 42%
48% 40% 59% 43%
Base
Ideology
Veryliberal
Somewhatliberal Moderate
Somewhatconservative
Veryconservative
Biden Favorability
Favorable
Unfavorable
Not sure
46% 89% 67% 60% 16% 10%
44% 7% 14% 29% 74% 87%
10% 4% 19% 11% 9% 3%
Base
Ideology
Veryliberal
Somewhatliberal Moderate
Somewhatconservative
Veryconservative
Jeb Favorability
Favorable
Unfavorable
Not sure
38% 14% 17% 24% 61% 71%
38% 76% 53% 46% 15% 13%
24% 10% 30% 30% 24% 16%
Base
Ideology
Veryliberal
Somewhatliberal Moderate
Somewhatconservative
Veryconservative
Christie Favorability
Favorable
Unfavorable
Not sure
48% 38% 50% 48% 48% 50%
26% 43% 18% 23% 24% 34%
26% 19% 32% 28% 28% 17%
November 30-December 2, 2012survey of 700 registered votersNovember 30-December 2, 2012survey of 700 registered voters
3020 Highwoods Blvd.Raleigh, NC 27604
[email protected] / 888 621-6988
3020 Highwoods Blvd.Raleigh, NC 27604
[email protected] / 888 621-6988
Crosstabs
Base
Ideology
Veryliberal
Somewhatliberal Moderate
Somewhatconservative
Veryconservative
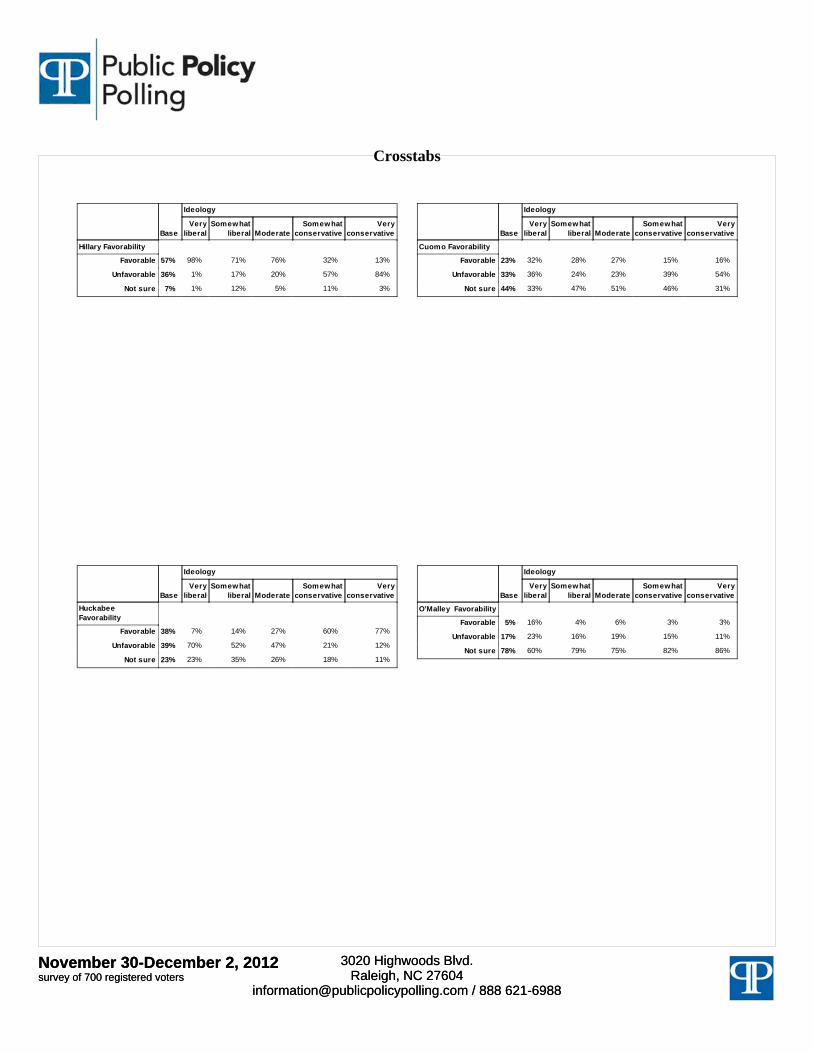
Hillary Favorability
Favorable
Unfavorable
Not sure
57% 98% 71% 76% 32% 13%
36% 1% 17% 20% 57% 84%
7% 1% 12% 5% 11% 3%
Base
Ideology
Veryliberal
Somewhatliberal Moderate
Somewhatconservative
Veryconservative
Cuomo Favorability
Favorable
Unfavorable
Not sure
23% 32% 28% 27% 15% 16%
33% 36% 24% 23% 39% 54%
44% 33% 47% 51% 46% 31%
Base
Ideology
Veryliberal
Somewhatliberal Moderate
Somewhatconservative
Veryconservative
HuckabeeFavorability
Favorable
Unfavorable
Not sure
38% 7% 14% 27% 60% 77%
39% 70% 52% 47% 21% 12%
23% 23% 35% 26% 18% 11%
Base
Ideology
Veryliberal
Somewhatliberal Moderate
Somewhatconservative
Veryconservative
O’Malley Favorability
Favorable
Unfavorable
Not sure
5% 16% 4% 6% 3% 3%
17% 23% 16% 19% 15% 11%
78% 60% 79% 75% 82% 86%

November 30-December 2, 2012survey of 700 registered votersNovember 30-December 2, 2012survey of 700 registered voters
3020 Highwoods Blvd.Raleigh, NC 27604
[email protected] / 888 621-6988
3020 Highwoods Blvd.Raleigh, NC 27604
[email protected] / 888 621-6988
Crosstabs
Base
Ideology
Veryliberal
Somewhatliberal Moderate
Somewhatconservative
Veryconservative
Palin Favorability
Favorable
Unfavorable
Not sure
33% 2% 13% 16% 57% 79%
56% 94% 71% 74% 28% 17%
11% 5% 16% 9% 15% 5%
Base
Ideology
Veryliberal
Somewhatliberal Moderate
Somewhatconservative
Veryconservative
Patrick Favorability
Favorable
Unfavorable
Not sure
10% 24% 12% 12% 7% 1%
17% 25% 15% 16% 17% 18%
72% 51% 73% 72% 76% 81%
Base
Ideology
Veryliberal
Somewhatliberal Moderate
Somewhatconservative
Veryconservative
Paul Favorability
Favorable
Unfavorable
Not sure
32% 21% 11% 25% 45% 57%
38% 58% 55% 43% 19% 21%
30% 22% 34% 32% 35% 22%
Base
Ideology
Veryliberal
Somewhatliberal Moderate
Somewhatconservative
Veryconservative
Condi Favorability
Favorable
Unfavorable
Not sure
51% 23% 39% 40% 74% 73%
29% 50% 34% 38% 12% 20%
19% 26% 28% 22% 14% 8%
November 30-December 2, 2012survey of 700 registered votersNovember 30-December 2, 2012survey of 700 registered voters
3020 Highwoods Blvd.Raleigh, NC 27604
[email protected] / 888 621-6988
3020 Highwoods Blvd.Raleigh, NC 27604
[email protected] / 888 621-6988
Crosstabs
Base
Ideology
Veryliberal
Somewhatliberal Moderate
Somewhatconservative
Veryconservative
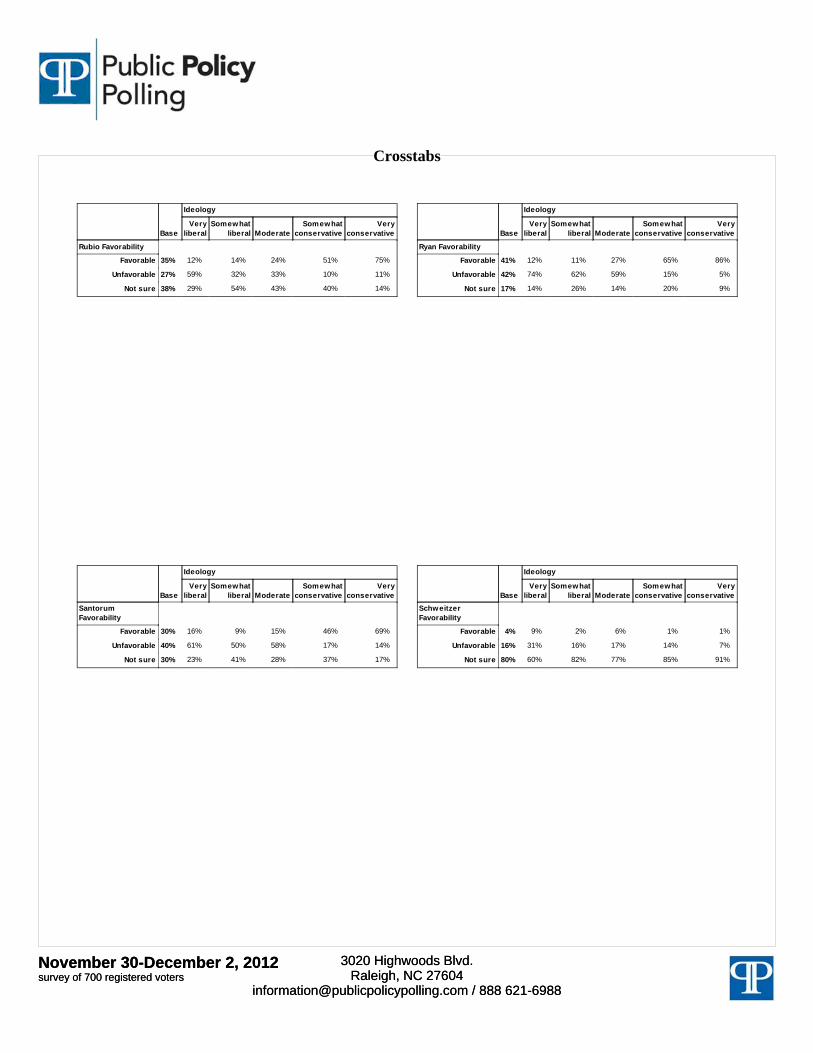
Rubio Favorability
Favorable
Unfavorable
Not sure
35% 12% 14% 24% 51% 75%
27% 59% 32% 33% 10% 11%
38% 29% 54% 43% 40% 14%
Base
Ideology
Veryliberal
Somewhatliberal Moderate
Somewhatconservative
Veryconservative
Ryan Favorability
Favorable
Unfavorable
Not sure
41% 12% 11% 27% 65% 86%
42% 74% 62% 59% 15% 5%
17% 14% 26% 14% 20% 9%
Base
Ideology
Veryliberal
Somewhatliberal Moderate
Somewhatconservative
Veryconservative
SantorumFavorability
Favorable
Unfavorable
Not sure
30% 16% 9% 15% 46% 69%
40% 61% 50% 58% 17% 14%
30% 23% 41% 28% 37% 17%
Base
Ideology
Veryliberal
Somewhatliberal Moderate
Somewhatconservative
Veryconservative
SchweitzerFavorability
Favorable
Unfavorable
Not sure
4% 9% 2% 6% 1% 1%
16% 31% 16% 17% 14% 7%
80% 60% 82% 77% 85% 91%
November 30-December 2, 2012survey of 700 registered votersNovember 30-December 2, 2012survey of 700 registered voters
3020 Highwoods Blvd.Raleigh, NC 27604
[email protected] / 888 621-6988
3020 Highwoods Blvd.Raleigh, NC 27604
[email protected] / 888 621-6988
Crosstabs
Base
Ideology
Veryliberal
Somewhatliberal Moderate
Somewhatconservative
Veryconservative
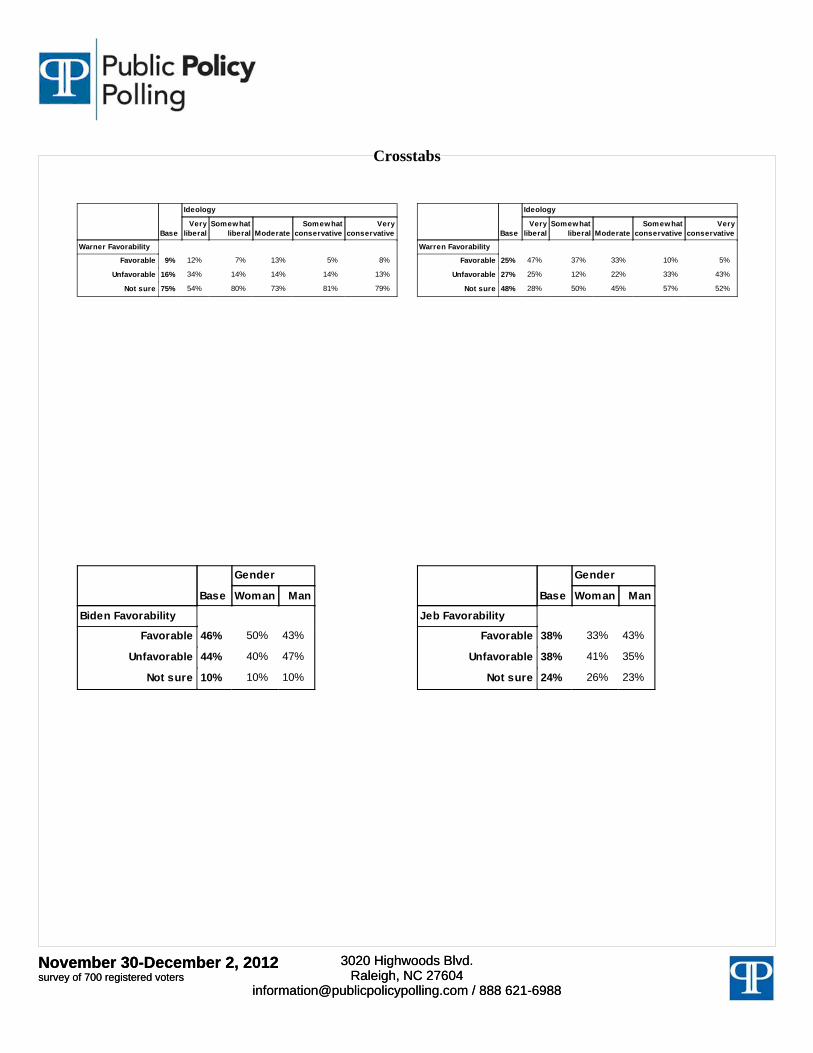
Warner Favorability
Favorable
Unfavorable
Not sure
9% 12% 7% 13% 5% 8%
16% 34% 14% 14% 14% 13%
75% 54% 80% 73% 81% 79%
Base
Ideology
Veryliberal
Somewhatliberal Moderate
Somewhatconservative
Veryconservative
Warren Favorability
Favorable
Unfavorable
Not sure
25% 47% 37% 33% 10% 5%
27% 25% 12% 22% 33% 43%
48% 28% 50% 45% 57% 52%
Base
Gender
Woman Man
Biden Favorability
Favorable
Unfavorable
Not sure
46% 50% 43%
44% 40% 47%
10% 10% 10%
Base
Gender
Woman Man
Jeb Favorability
Favorable
Unfavorable
Not sure
38% 33% 43%
38% 41% 35%
24% 26% 23%

November 30-December 2, 2012survey of 700 registered votersNovember 30-December 2, 2012survey of 700 registered voters
3020 Highwoods Blvd.Raleigh, NC 27604
[email protected] / 888 621-6988
3020 Highwoods Blvd.Raleigh, NC 27604
[email protected] / 888 621-6988
Crosstabs
Base
Gender
Woman Man
Christie Favorability
Favorable
Unfavorable
Not sure
48% 44% 52%
26% 25% 28%
26% 31% 21%
Base
Gender
Woman Man
Hillary Favorability
Favorable
Unfavorable
Not sure
57% 64% 50%
36% 29% 43%
7% 7% 7%
Base
Gender
Woman Man
Cuomo Favorability
Favorable
Unfavorable
Not sure
23% 23% 22%
33% 27% 39%
44% 49% 39%
Base
Gender
Woman Man
HuckabeeFavorability
Favorable
Unfavorable
Not sure
38% 33% 43%
39% 38% 39%
23% 28% 18%
November 30-December 2, 2012survey of 700 registered votersNovember 30-December 2, 2012survey of 700 registered voters
3020 Highwoods Blvd.Raleigh, NC 27604
[email protected] / 888 621-6988
3020 Highwoods Blvd.Raleigh, NC 27604
[email protected] / 888 621-6988
Crosstabs
Base
Gender
Woman Man
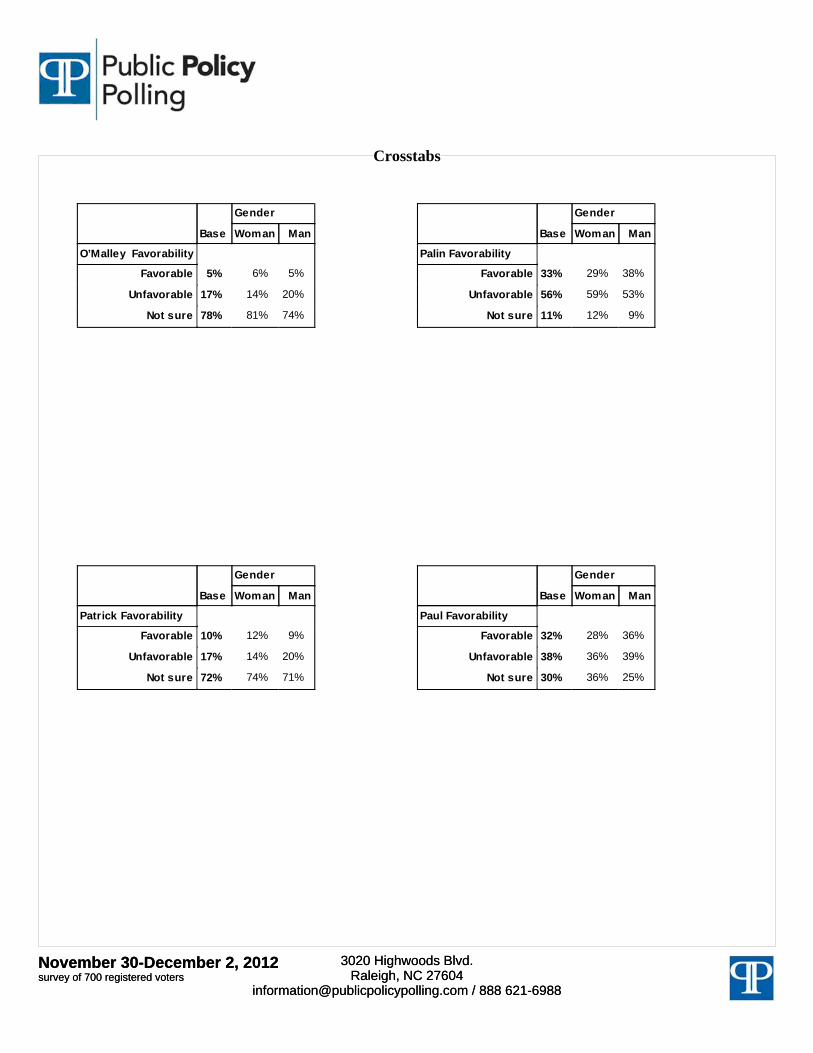
O’Malley Favorability
Favorable
Unfavorable
Not sure
5% 6% 5%
17% 14% 20%
78% 81% 74%
Base
Gender
Woman Man
Palin Favorability
Favorable
Unfavorable
Not sure
33% 29% 38%
56% 59% 53%
11% 12% 9%
Base
Gender
Woman Man
Patrick Favorability
Favorable
Unfavorable
Not sure
10% 12% 9%
17% 14% 20%
72% 74% 71%
Base
Gender
Woman Man
Paul Favorability
Favorable
Unfavorable
Not sure
32% 28% 36%
38% 36% 39%
30% 36% 25%
November 30-December 2, 2012survey of 700 registered votersNovember 30-December 2, 2012survey of 700 registered voters
3020 Highwoods Blvd.Raleigh, NC 27604
[email protected] / 888 621-6988
3020 Highwoods Blvd.Raleigh, NC 27604
[email protected] / 888 621-6988
Crosstabs
Base
Gender
Woman Man
Condi Favorability
Favorable
Unfavorable
Not sure
51% 51% 51%
29% 27% 31%
19% 21% 17%
Base
Gender
Woman Man
Rubio Favorability
Favorable
Unfavorable
Not sure
35% 31% 39%
27% 24% 30%
38% 45% 31%
Base
Gender
Woman Man
Ryan Favorability
Favorable
Unfavorable
Not sure
41% 38% 44%
42% 43% 42%
17% 19% 15%
Base
Gender
Woman Man
SantorumFavorability
Favorable
Unfavorable
Not sure
30% 25% 35%
40% 40% 39%
30% 35% 25%
November 30-December 2, 2012survey of 700 registered votersNovember 30-December 2, 2012survey of 700 registered voters
3020 Highwoods Blvd.Raleigh, NC 27604
[email protected] / 888 621-6988
3020 Highwoods Blvd.Raleigh, NC 27604
[email protected] / 888 621-6988
Crosstabs
Base
Gender
Woman Man
SchweitzerFavorability
Favorable
Unfavorable
Not sure
4% 3% 5%
16% 14% 18%
80% 83% 78%
Base
Gender
Woman Man
Warner Favorability
Favorable
Unfavorable
Not sure
9% 7% 10%
16% 12% 20%
75% 81% 69%
Base
Gender
Woman Man
Warren Favorability
Favorable
Unfavorable
Not sure
25% 30% 21%
27% 23% 30%
48% 47% 49%
Base
Party
Democrat Republican Independent/Other
Biden Favorability
Favorable
Unfavorable
Not sure
46% 77% 15% 31%
44% 14% 76% 56%
10% 9% 9% 14%
November 30-December 2, 2012survey of 700 registered votersNovember 30-December 2, 2012survey of 700 registered voters
3020 Highwoods Blvd.Raleigh, NC 27604
[email protected] / 888 621-6988
3020 Highwoods Blvd.Raleigh, NC 27604
[email protected] / 888 621-6988
Crosstabs
Base
Party
Democrat Republican Independent/Other
Jeb Favorability
Favorable
Unfavorable
Not sure
38% 16% 66% 42%
38% 62% 12% 28%
24% 22% 22% 30%
Base
Party
Democrat Republican Independent/Other
Christie Favorability
Favorable
Unfavorable
Not sure
48% 42% 57% 46%
26% 25% 25% 29%
26% 33% 18% 24%
Base
Party
Democrat Republican Independent/Other
Hillary Favorability
Favorable
Unfavorable
Not sure
57% 81% 26% 52%
36% 12% 66% 42%
7% 6% 8% 6%
Base
Party
Democrat Republican Independent/Other
Cuomo Favorability
Favorable
Unfavorable
Not sure
23% 32% 14% 17%
33% 18% 47% 41%
44% 50% 38% 42%

November 30-December 2, 2012survey of 700 registered votersNovember 30-December 2, 2012survey of 700 registered voters
3020 Highwoods Blvd.Raleigh, NC 27604
[email protected] / 888 621-6988
3020 Highwoods Blvd.Raleigh, NC 27604
[email protected] / 888 621-6988
Crosstabs
Base
Party
Democrat Republican Independent/Other
HuckabeeFavorability
Favorable
Unfavorable
Not sure
38% 14% 71% 41%
39% 57% 14% 36%
23% 29% 16% 22%
Base
Party
Democrat Republican Independent/Other
O’Malley Favorability
Favorable
Unfavorable
Not sure
5% 7% 3% 6%
17% 18% 13% 20%
78% 75% 84% 75%
Base
Party
Democrat Republican Independent/Other
Palin Favorability
Favorable
Unfavorable
Not sure
33% 8% 66% 38%
56% 80% 25% 51%
11% 12% 9% 12%
Base
Party
Democrat Republican Independent/Other
Patrick Favorability
Favorable
Unfavorable
Not sure
10% 16% 4% 8%
17% 16% 12% 25%
72% 69% 83% 67%

November 30-December 2, 2012survey of 700 registered votersNovember 30-December 2, 2012survey of 700 registered voters
3020 Highwoods Blvd.Raleigh, NC 27604
[email protected] / 888 621-6988
3020 Highwoods Blvd.Raleigh, NC 27604
[email protected] / 888 621-6988
Crosstabs
Base
Party
Democrat Republican Independent/Other
Paul Favorability
Favorable
Unfavorable
Not sure
32% 15% 50% 40%
38% 51% 22% 33%
30% 34% 28% 27%
Base
Party
Democrat Republican Independent/Other
Condi Favorability
Favorable
Unfavorable
Not sure
51% 33% 75% 55%
29% 42% 14% 26%
19% 25% 11% 19%
Base
Party
Democrat Republican Independent/Other
Rubio Favorability
Favorable
Unfavorable
Not sure
35% 15% 62% 39%
27% 39% 8% 26%
38% 45% 30% 35%
Base
Party
Democrat Republican Independent/Other
Ryan Favorability
Favorable
Unfavorable
Not sure
41% 13% 74% 50%
42% 68% 11% 34%
17% 19% 15% 16%
November 30-December 2, 2012survey of 700 registered votersNovember 30-December 2, 2012survey of 700 registered voters
3020 Highwoods Blvd.Raleigh, NC 27604
[email protected] / 888 621-6988
3020 Highwoods Blvd.Raleigh, NC 27604
[email protected] / 888 621-6988
Crosstabs
Base
Party
Democrat Republican Independent/Other
SantorumFavorability
Favorable
Unfavorable
Not sure
30% 10% 55% 35%
40% 58% 14% 38%
30% 32% 31% 26%
Base
Party
Democrat Republican Independent/Other
SchweitzerFavorability
Favorable
Unfavorable
Not sure
4% 4% 2% 4%
16% 19% 9% 19%
80% 76% 88% 77%
Base
Party
Democrat Republican Independent/Other
Warner Favorability
Favorable
Unfavorable
Not sure
9% 9% 6% 11%
16% 16% 13% 18%
75% 74% 81% 70%
Base
Party
Democrat Republican Independent/Other
Warren Favorability
Favorable
Unfavorable
Not sure
25% 38% 11% 20%
27% 18% 32% 35%
48% 45% 57% 45%
November 30-December 2, 2012survey of 700 registered votersNovember 30-December 2, 2012survey of 700 registered voters
3020 Highwoods Blvd.Raleigh, NC 27604
[email protected] / 888 621-6988
3020 Highwoods Blvd.Raleigh, NC 27604
[email protected] / 888 621-6988
Crosstabs
Base
Race
Hispanic WhiteAfrican-
American Other
Biden Favorability
Favorable
Unfavorable
Not sure
46% 54% 40% 70% 44%
44% 36% 50% 22% 38%
10% 10% 10% 8% 17%
Base
Race
Hispanic WhiteAfrican-
American Other
Jeb Favorability
Favorable
Unfavorable
Not sure
38% 32% 42% 22% 32%
38% 49% 33% 54% 35%
24% 19% 25% 24% 33%
Base
Race
Hispanic WhiteAfrican-
American Other
Christie Favorability
Favorable
Unfavorable
Not sure
48% 52% 50% 39% 35%
26% 22% 26% 27% 32%
26% 26% 24% 33% 33%
Base
Race
Hispanic WhiteAfrican-
American Other
Hillary Favorability
Favorable
Unfavorable
Not sure
57% 61% 51% 83% 60%
36% 37% 41% 14% 26%
7% 1% 8% 3% 14%
November 30-December 2, 2012survey of 700 registered votersNovember 30-December 2, 2012survey of 700 registered voters
3020 Highwoods Blvd.Raleigh, NC 27604
[email protected] / 888 621-6988
3020 Highwoods Blvd.Raleigh, NC 27604
[email protected] / 888 621-6988
Crosstabs
Base
Race
Hispanic WhiteAfrican-
American Other
Cuomo Favorability
Favorable
Unfavorable
Not sure
23% 28% 19% 37% 23%
33% 44% 35% 14% 34%
44% 27% 46% 49% 43%
Base
Race
Hispanic WhiteAfrican-
American Other
HuckabeeFavorability
Favorable
Unfavorable
Not sure
38% 33% 44% 20% 23%
39% 39% 36% 51% 44%
23% 28% 20% 29% 33%
Base
Race
Hispanic WhiteAfrican-
American Other
O’Malley Favorability
Favorable
Unfavorable
Not sure
5% 10% 4% 13% 4%
17% 28% 14% 25% 15%
78% 62% 83% 62% 81%
Base
Race
Hispanic WhiteAfrican-
American Other
Palin Favorability
Favorable
Unfavorable
Not sure
33% 31% 40% 6% 24%
56% 67% 48% 85% 59%
11% 2% 12% 9% 18%
November 30-December 2, 2012survey of 700 registered votersNovember 30-December 2, 2012survey of 700 registered voters
3020 Highwoods Blvd.Raleigh, NC 27604
[email protected] / 888 621-6988
3020 Highwoods Blvd.Raleigh, NC 27604
[email protected] / 888 621-6988
Crosstabs
Base
Race
Hispanic WhiteAfrican-
American Other
Patrick Favorability
Favorable
Unfavorable
Not sure
10% 6% 7% 26% 24%
17% 29% 15% 19% 13%
72% 65% 78% 55% 63%
Base
Race
Hispanic WhiteAfrican-
American Other
Paul Favorability
Favorable
Unfavorable
Not sure
32% 28% 36% 12% 36%
38% 39% 34% 59% 30%
30% 32% 30% 29% 34%
Base
Race
Hispanic WhiteAfrican-
American Other
Condi Favorability
Favorable
Unfavorable
Not sure
51% 41% 58% 28% 47%
29% 37% 25% 49% 27%
19% 22% 17% 23% 26%
Base
Race
Hispanic WhiteAfrican-
American Other
Rubio Favorability
Favorable
Unfavorable
Not sure
35% 24% 42% 18% 21%
27% 42% 22% 40% 25%
38% 34% 36% 42% 54%
November 30-December 2, 2012survey of 700 registered votersNovember 30-December 2, 2012survey of 700 registered voters
3020 Highwoods Blvd.Raleigh, NC 27604
[email protected] / 888 621-6988
3020 Highwoods Blvd.Raleigh, NC 27604
[email protected] / 888 621-6988
Crosstabs
Base
Race
Hispanic WhiteAfrican-
American Other
Ryan Favorability
Favorable
Unfavorable
Not sure
41% 42% 48% 13% 21%
42% 48% 36% 68% 52%
17% 10% 17% 19% 27%
Base
Race
Hispanic WhiteAfrican-
American Other
SantorumFavorability
Favorable
Unfavorable
Not sure
30% 24% 35% 11% 23%
40% 41% 37% 56% 36%
30% 35% 28% 32% 41%
Base
Race
Hispanic WhiteAfrican-
American Other
SchweitzerFavorability
Favorable
Unfavorable
Not sure
4% 9% 3% 1% 2%
16% 28% 13% 23% 16%
80% 63% 84% 76% 82%
Base
Race
Hispanic WhiteAfrican-
American Other
Warner Favorability
Favorable
Unfavorable
Not sure
9% 6% 9% 10% 11%
16% 29% 13% 17% 19%
75% 65% 78% 73% 70%
November 30-December 2, 2012survey of 700 registered votersNovember 30-December 2, 2012survey of 700 registered voters
3020 Highwoods Blvd.Raleigh, NC 27604
[email protected] / 888 621-6988
3020 Highwoods Blvd.Raleigh, NC 27604
[email protected] / 888 621-6988
Crosstabs
Base
Race
Hispanic WhiteAfrican-
American Other
Warren Favorability
Favorable
Unfavorable
Not sure
25% 27% 22% 38% 26%
27% 38% 26% 19% 28%
48% 35% 52% 43% 46%
Base
Age
18 to29
30 to45
46 to65
Olderthan 65
Biden Favorability
Favorable
Unfavorable
Not sure
46% 43% 43% 50% 46%
44% 30% 53% 40% 48%
10% 26% 5% 11% 6%
Base
Age
18 to29
30 to45
46 to65
Olderthan 65
Jeb Favorability
Favorable
Unfavorable
Not sure
38% 29% 40% 35% 45%
38% 38% 41% 38% 34%
24% 33% 20% 27% 21%
Base
Age
18 to29
30 to45
46 to65
Olderthan 65
Christie Favorability
Favorable
Unfavorable
Not sure
48% 52% 53% 42% 50%
26% 19% 28% 30% 22%
26% 29% 19% 29% 29%
November 30-December 2, 2012survey of 700 registered votersNovember 30-December 2, 2012survey of 700 registered voters
3020 Highwoods Blvd.Raleigh, NC 27604
[email protected] / 888 621-6988
3020 Highwoods Blvd.Raleigh, NC 27604
[email protected] / 888 621-6988
Crosstabs
Base
Age
18 to29
30 to45
46 to65
Olderthan 65
Hillary Favorability
Favorable
Unfavorable
Not sure
57% 57% 56% 59% 54%
36% 33% 34% 37% 39%
7% 10% 9% 4% 7%
Base
Age
18 to29
30 to45
46 to65
Olderthan 65
Cuomo Favorability
Favorable
Unfavorable
Not sure
23% 19% 21% 22% 28%
33% 33% 38% 31% 31%
44% 48% 41% 47% 40%
Base
Age
18 to29
30 to45
46 to65
Olderthan 65
HuckabeeFavorability
Favorable
Unfavorable
Not sure
38% 33% 35% 39% 42%
39% 33% 41% 40% 36%
23% 33% 24% 20% 22%
Base
Age
18 to29
30 to45
46 to65
Olderthan 65
O’Malley Favorability
Favorable
Unfavorable
Not sure
5% 15% 4% 4% 5%
17% 25% 22% 15% 10%
78% 60% 74% 80% 85%
November 30-December 2, 2012survey of 700 registered votersNovember 30-December 2, 2012survey of 700 registered voters
3020 Highwoods Blvd.Raleigh, NC 27604
[email protected] / 888 621-6988
3020 Highwoods Blvd.Raleigh, NC 27604
[email protected] / 888 621-6988
Crosstabs
Base
Age
18 to29
30 to45
46 to65
Olderthan 65
Palin Favorability
Favorable
Unfavorable
Not sure
33% 30% 27% 35% 40%
56% 55% 63% 55% 49%
11% 15% 10% 10% 11%
Base
Age
18 to29
30 to45
46 to65
Olderthan 65
Patrick Favorability
Favorable
Unfavorable
Not sure
10% 10% 10% 10% 12%
17% 25% 20% 16% 12%
72% 65% 70% 74% 76%
Base
Age
18 to29
30 to45
46 to65
Olderthan 65
Paul Favorability
Favorable
Unfavorable
Not sure
32% 32% 36% 28% 34%
38% 32% 31% 42% 40%
30% 37% 33% 30% 26%
Base
Age
18 to29
30 to45
46 to65
Olderthan 65
Condi Favorability
Favorable
Unfavorable
Not sure
51% 32% 49% 54% 59%
29% 32% 29% 31% 26%
19% 37% 22% 15% 15%
November 30-December 2, 2012survey of 700 registered votersNovember 30-December 2, 2012survey of 700 registered voters
3020 Highwoods Blvd.Raleigh, NC 27604
[email protected] / 888 621-6988
3020 Highwoods Blvd.Raleigh, NC 27604
[email protected] / 888 621-6988
Crosstabs
Base
Age
18 to29
30 to45
46 to65
Olderthan 65
Rubio Favorability
Favorable
Unfavorable
Not sure
35% 32% 37% 31% 43%
27% 26% 24% 29% 24%
38% 42% 39% 39% 33%
Base
Age
18 to29
30 to45
46 to65
Olderthan 65
Ryan Favorability
Favorable
Unfavorable
Not sure
41% 42% 34% 42% 46%
42% 32% 43% 47% 38%
17% 26% 23% 11% 16%
Base
Age
18 to29
30 to45
46 to65
Olderthan 65
SantorumFavorability
Favorable
Unfavorable
Not sure
30% 33% 26% 29% 33%
40% 33% 41% 43% 36%
30% 33% 33% 27% 31%
Base
Age
18 to29
30 to45
46 to65
Olderthan 65
SchweitzerFavorability
Favorable
Unfavorable
Not sure
4% 12% 3% 3% 2%
16% 29% 14% 16% 11%
80% 59% 83% 81% 86%

November 30-December 2, 2012survey of 700 registered votersNovember 30-December 2, 2012survey of 700 registered voters
3020 Highwoods Blvd.Raleigh, NC 27604
[email protected] / 888 621-6988
3020 Highwoods Blvd.Raleigh, NC 27604
[email protected] / 888 621-6988
Crosstabs
Base
Age
18 to29
30 to45
46 to65
Olderthan 65
Warner Favorability
Favorable
Unfavorable
Not sure
9% 12% 8% 8% 10%
16% 18% 16% 19% 10%
75% 71% 76% 74% 80%
Base
Age
18 to29
30 to45
46 to65
Olderthan 65
Warren Favorability
Favorable
Unfavorable
Not sure
25% 18% 21% 28% 28%
27% 35% 24% 27% 26%
48% 47% 55% 45% 46%
November 30-December 2, 2012Survey of 475 Republican primary votersNovember 30-December 2, 2012Survey of 475 Republican primary voters
3020 Highwoods Blvd.Raleigh, NC 27604
[email protected] / 888 621-6988
3020 Highwoods Blvd.Raleigh, NC 27604
[email protected] / 888 621-6988
National Survey Results
Q1 Do you have a favorable or unfavorable opinion of Jeb Bush?
63% Favorable........................................................
14% Unfavorable ....................................................
23% Not sure ..........................................................
Q2 Do you have a favorable or unfavorable opinion of Chris Christie?
49% Favorable........................................................
28% Unfavorable ....................................................
23% Not sure ..........................................................
Q3 Do you have a favorable or unfavorable opinion of Mike Huckabee?
73% Favorable........................................................
15% Unfavorable ....................................................
13% Not sure ..........................................................
Q4 Do you have a favorable or unfavorable opinion of Sarah Palin?
66% Favorable........................................................
24% Unfavorable ....................................................
10% Not sure ..........................................................
Q5 Do you have a favorable or unfavorable opinion of Rand Paul?
53% Favorable........................................................
22% Unfavorable ....................................................
25% Not sure ..........................................................
Q6 Do you have a favorable or unfavorable opinion of Condoleezza Rice?
73% Favorable........................................................
18% Unfavorable ....................................................
9% Not sure ..........................................................
Q7 Do you have a favorable or unfavorable opinion of Marco Rubio?
62% Favorable........................................................
11% Unfavorable ....................................................
26% Not sure ..........................................................
Q8 Do you have a favorable or unfavorable opinion of Paul Ryan?
74% Favorable........................................................
15% Unfavorable ....................................................
10% Not sure ..........................................................
Q9 Do you have a favorable or unfavorable opinion of Rick Santorum?
56% Favorable........................................................
17% Unfavorable ....................................................
28% Not sure ..........................................................
Q10 Do you think Reince Priebus should continue in his role as chair of the Republican National Committee or be replaced?
20% He should continue .........................................
37% He should be replaced ....................................
43% Not sure ..........................................................

November 30-December 2, 2012Survey of 475 Republican primary votersNovember 30-December 2, 2012Survey of 475 Republican primary voters
3020 Highwoods Blvd.Raleigh, NC 27604
[email protected] / 888 621-6988
3020 Highwoods Blvd.Raleigh, NC 27604
[email protected] / 888 621-6988
Q11 Given the choices of Jeb Bush, Chris Christie, Mike Huckabee, Sarah Palin, Rand Paul, Condoleezza Rice, Marco Rubio, Paul Ryan, and Rick Santorum, who would you most like to see as the GOP candidate for President in 2016?
12% Jeb Bush.........................................................
14% Chris Christie ..................................................
11% Mike Huckabee ...............................................
7% Sarah Palin .....................................................
7% Rand Paul .......................................................
8% Condoleezza Rice ...........................................
18% Marco Rubio ...................................................
12% Paul Ryan .......................................................
4% Rick Santorum ................................................
7% Someone else/Undecided ...............................
Q12 Would you describe yourself as very liberal, somewhat liberal, moderate, somewhat conservative, or very conservative?
1% Very liberal ......................................................
6% Somewhat liberal ............................................
16% Moderate.........................................................
38% Somewhat conservative..................................
39% Very conservative ...........................................
Q13 If you are a woman, press 1. If a man, press 2.
49% Woman ...........................................................
51% Man.................................................................
Q14 If you are 18 to 45 years old, press 1. If 46 to 65, press 2. If you are older than 65, press 3.
30% 18 to 45...........................................................
39% 46 to 65...........................................................
31% Older than 65 ..................................................

November 30-December 2, 2012survey of 475 Republican primary votersNovember 30-December 2, 2012survey of 475 Republican primary voters
3020 Highwoods Blvd.Raleigh, NC 27604
[email protected] / 888 621-6988
3020 Highwoods Blvd.Raleigh, NC 27604
[email protected] / 888 621-6988
Crosstabs
Base
Ideology
Veryliberal
Somewhatliberal Moderate
Somewhatconservative
Veryconservative
Jeb Favorability
Favorable
Unfavorable
Not sure
63% 43% 36% 46% 69% 68%
14% 42% 31% 35% 7% 10%
23% 15% 32% 19% 24% 22%
Base
Ideology
Veryliberal
Somewhatliberal Moderate
Somewhatconservative
Veryconservative
Christie Favorability
Favorable
Unfavorable
Not sure
49% 85% 45% 51% 54% 42%
28% - 40% 28% 24% 31%
23% 15% 16% 21% 22% 26%
Base
Ideology
Veryliberal
Somewhatliberal Moderate
Somewhatconservative
Veryconservative
HuckabeeFavorability
Favorable
Unfavorable
Not sure
73% 43% 61% 48% 76% 82%
15% 42% 31% 31% 12% 7%
13% 15% 7% 22% 12% 11%
Base
Ideology
Veryliberal
Somewhatliberal Moderate
Somewhatconservative
Veryconservative
Palin Favorability
Favorable
Unfavorable
Not sure
66% 22% 52% 31% 67% 84%
24% 64% 45% 59% 20% 9%
10% 15% 4% 10% 13% 7%

November 30-December 2, 2012survey of 475 Republican primary votersNovember 30-December 2, 2012survey of 475 Republican primary voters
3020 Highwoods Blvd.Raleigh, NC 27604
[email protected] / 888 621-6988
3020 Highwoods Blvd.Raleigh, NC 27604
[email protected] / 888 621-6988
Crosstabs
Base
Ideology
Veryliberal
Somewhatliberal Moderate
Somewhatconservative
Veryconservative
Paul Favorability
Favorable
Unfavorable
Not sure
53% 22% 36% 30% 59% 61%
22% 42% 50% 44% 15% 15%
25% 36% 13% 26% 26% 24%
Base
Ideology
Veryliberal
Somewhatliberal Moderate
Somewhatconservative
Veryconservative
Condi Favorability
Favorable
Unfavorable
Not sure
73% 64% 50% 58% 79% 78%
18% 36% 40% 30% 12% 14%
9% - 11% 12% 10% 8%
Base
Ideology
Veryliberal
Somewhatliberal Moderate
Somewhatconservative
Veryconservative
Rubio Favorability
Favorable
Unfavorable
Not sure
62% 64% 22% 45% 64% 74%
11% - 55% 22% 6% 6%
26% 36% 22% 33% 30% 20%
Base
Ideology
Veryliberal
Somewhatliberal Moderate
Somewhatconservative
Veryconservative
Ryan Favorability
Favorable
Unfavorable
Not sure
74% 43% 33% 47% 80% 87%
15% 57% 46% 42% 9% 5%
10% - 22% 11% 11% 8%
November 30-December 2, 2012survey of 475 Republican primary votersNovember 30-December 2, 2012survey of 475 Republican primary voters
3020 Highwoods Blvd.Raleigh, NC 27604
[email protected] / 888 621-6988
3020 Highwoods Blvd.Raleigh, NC 27604
[email protected] / 888 621-6988
Crosstabs
Base
Ideology
Veryliberal
Somewhatliberal Moderate
Somewhatconservative
Veryconservative
SantorumFavorability
Favorable
Unfavorable
Not sure
56% 22% 29% 27% 57% 72%
17% 78% 38% 39% 11% 8%
28% - 34% 34% 32% 20%
Base
Ideology
Veryliberal
Somew hatliberal Moderate
Somew hatconservative
Veryconservative
Should PriebusContinue or BeReplaced?
He should continue
He should bereplaced
Not sure
20% - 23% 17% 19% 21%
37% - 54% 53% 32% 33%
43% 100% 23% 30% 49% 45%
Base
Ideology
Veryliberal
Somewhatliberal Moderate
Somewhatconservative
Veryconservative
2016 GOP PresPreference
Jeb Bush
Chris Christie
Mike Huckabee
Sarah Palin
Rand Paul
Condoleezza Rice
Marco Rubio
Paul Ryan
Rick Santorum
Someoneelse/Undecided
12% - 10% 20% 13% 8%
14% - 31% 35% 14% 4%
11% - 4% 11% 9% 13%
7% 42% 10% 4% 5% 8%
7% - 6% 3% 7% 8%
8% 22% 14% 8% 8% 8%
18% - - 5% 22% 23%
12% 22% 15% 8% 9% 17%
4% - 4% 3% 4% 3%
7% 15% 7% 3% 7% 7%
Base
Gender
Woman Man
Jeb Favorability
Favorable
Unfavorable
Not sure
63% 62% 64%
14% 13% 16%
23% 25% 20%
November 30-December 2, 2012survey of 475 Republican primary votersNovember 30-December 2, 2012survey of 475 Republican primary voters
3020 Highwoods Blvd.Raleigh, NC 27604
[email protected] / 888 621-6988
3020 Highwoods Blvd.Raleigh, NC 27604
[email protected] / 888 621-6988
Crosstabs
Base
Gender
Woman Man
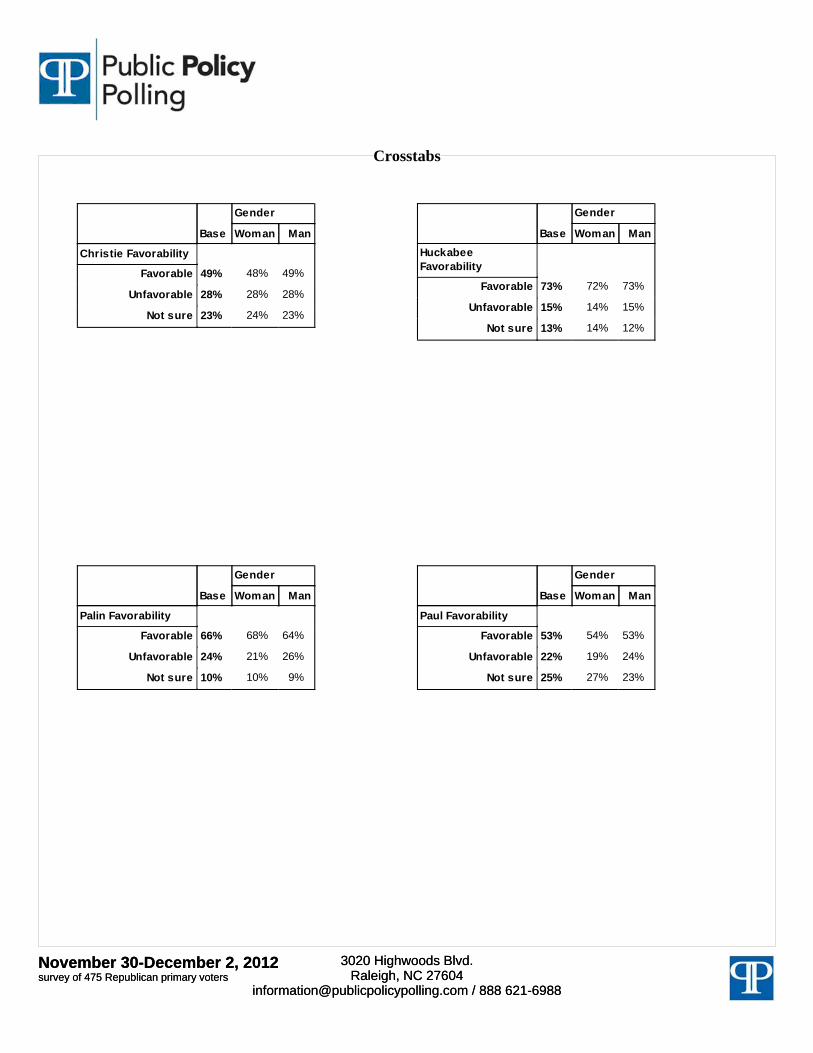
Christie Favorability
Favorable
Unfavorable
Not sure
49% 48% 49%
28% 28% 28%
23% 24% 23%
Base
Gender
Woman Man
HuckabeeFavorability
Favorable
Unfavorable
Not sure
73% 72% 73%
15% 14% 15%
13% 14% 12%
Base
Gender
Woman Man
Palin Favorability
Favorable
Unfavorable
Not sure
66% 68% 64%
24% 21% 26%
10% 10% 9%
Base
Gender
Woman Man
Paul Favorability
Favorable
Unfavorable
Not sure
53% 54% 53%
22% 19% 24%
25% 27% 23%

November 30-December 2, 2012survey of 475 Republican primary votersNovember 30-December 2, 2012survey of 475 Republican primary voters
3020 Highwoods Blvd.Raleigh, NC 27604
[email protected] / 888 621-6988
3020 Highwoods Blvd.Raleigh, NC 27604
[email protected] / 888 621-6988
Crosstabs
Base
Gender
Woman Man
Condi Favorability
Favorable
Unfavorable
Not sure
73% 72% 74%
18% 17% 18%
9% 11% 8%
Base
Gender
Woman Man
Rubio Favorability
Favorable
Unfavorable
Not sure
62% 62% 63%
11% 8% 14%
26% 30% 23%
Base
Gender
Woman Man
Ryan Favorability
Favorable
Unfavorable
Not sure
74% 77% 72%
15% 14% 17%
10% 10% 11%
Base
Gender
Woman Man
SantorumFavorability
Favorable
Unfavorable
Not sure
56% 57% 55%
17% 15% 18%
28% 28% 27%
November 30-December 2, 2012survey of 475 Republican primary votersNovember 30-December 2, 2012survey of 475 Republican primary voters
3020 Highwoods Blvd.Raleigh, NC 27604
[email protected] / 888 621-6988
3020 Highwoods Blvd.Raleigh, NC 27604
[email protected] / 888 621-6988
Crosstabs
Base
Gender
Woman Man
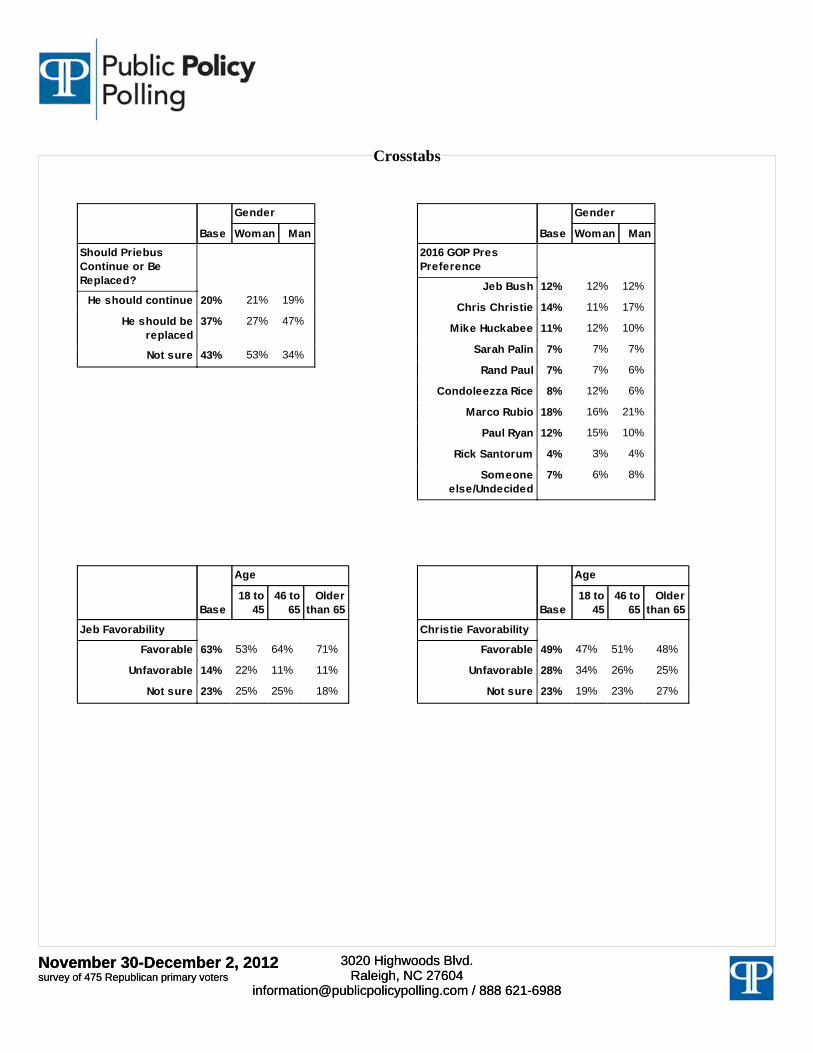
Should PriebusContinue or BeReplaced?
He should continue
He should bereplaced
Not sure
20% 21% 19%
37% 27% 47%
43% 53% 34%
Base
Gender
Woman Man
2016 GOP PresPreference
Jeb Bush
Chris Christie
Mike Huckabee
Sarah Palin
Rand Paul
Condoleezza Rice
Marco Rubio
Paul Ryan
Rick Santorum
Someoneelse/Undecided
12% 12% 12%
14% 11% 17%
11% 12% 10%
7% 7% 7%
7% 7% 6%
8% 12% 6%
18% 16% 21%
12% 15% 10%
4% 3% 4%
7% 6% 8%
Base
Age
18 to45
46 to65
Olderthan 65
Jeb Favorability
Favorable
Unfavorable
Not sure
63% 53% 64% 71%
14% 22% 11% 11%
23% 25% 25% 18%
Base
Age
18 to45
46 to65
Olderthan 65
Christie Favorability
Favorable
Unfavorable
Not sure
49% 47% 51% 48%
28% 34% 26% 25%
23% 19% 23% 27%
November 30-December 2, 2012survey of 475 Republican primary votersNovember 30-December 2, 2012survey of 475 Republican primary voters
3020 Highwoods Blvd.Raleigh, NC 27604
[email protected] / 888 621-6988
3020 Highwoods Blvd.Raleigh, NC 27604
[email protected] / 888 621-6988
Crosstabs
Base
Age
18 to45
46 to65
Olderthan 65
HuckabeeFavorability
Favorable
Unfavorable
Not sure
73% 63% 74% 79%
15% 25% 11% 9%
13% 12% 14% 12%
Base
Age
18 to45
46 to65
Olderthan 65
Palin Favorability
Favorable
Unfavorable
Not sure
66% 63% 67% 68%
24% 30% 23% 18%
10% 7% 9% 14%
Base
Age
18 to45
46 to65
Olderthan 65
Paul Favorability
Favorable
Unfavorable
Not sure
53% 55% 52% 54%
22% 27% 18% 20%
25% 18% 30% 25%
Base
Age
18 to45
46 to65
Olderthan 65
Condi Favorability
Favorable
Unfavorable
Not sure
73% 64% 78% 76%
18% 25% 13% 17%
9% 11% 10% 7%
November 30-December 2, 2012survey of 475 Republican primary votersNovember 30-December 2, 2012survey of 475 Republican primary voters
3020 Highwoods Blvd.Raleigh, NC 27604
[email protected] / 888 621-6988
3020 Highwoods Blvd.Raleigh, NC 27604
[email protected] / 888 621-6988
Crosstabs
Base
Age
18 to45
46 to65
Olderthan 65
Rubio Favorability
Favorable
Unfavorable
Not sure
62% 56% 63% 69%
11% 15% 11% 8%
26% 29% 27% 24%
Base
Age
18 to45
46 to65
Olderthan 65
Ryan Favorability
Favorable
Unfavorable
Not sure
74% 63% 81% 77%
15% 25% 11% 11%
10% 12% 8% 12%
Base
Age
18 to45
46 to65
Olderthan 65
SantorumFavorability
Favorable
Unfavorable
Not sure
56% 53% 59% 55%
17% 18% 15% 17%
28% 29% 26% 28%
Base
Age
18 to45
46 to65
Olderthan 65
Should PriebusContinue or BeReplaced?
He should continue
He should bereplaced
Not sure
20% 14% 23% 22%
37% 36% 38% 37%
43% 51% 39% 42%
November 30-December 2, 2012survey of 475 Republican primary votersNovember 30-December 2, 2012survey of 475 Republican primary voters
3020 Highwoods Blvd.Raleigh, NC 27604
[email protected] / 888 621-6988
3020 Highwoods Blvd.Raleigh, NC 27604
[email protected] / 888 621-6988
Crosstabs
Base
Age
18 to45
46 to65
Olderthan 65
2016 GOP PresPreference
Jeb Bush
Chris Christie
Mike Huckabee
Sarah Palin
Rand Paul
Condoleezza Rice
Marco Rubio
Paul Ryan
Rick Santorum
Someoneelse/Undecided
12% 8% 11% 16%
14% 18% 13% 13%
11% 11% 10% 11%
7% 8% 8% 5%
7% 11% 3% 6%
8% 10% 8% 8%
18% 14% 18% 23%
12% 11% 16% 9%
4% 1% 5% 4%
7% 8% 6% 6%
November 30-December 2, 2012Survey of 454 Democratic primary votersNovember 30-December 2, 2012Survey of 454 Democratic primary voters
3020 Highwoods Blvd.Raleigh, NC 27604
[email protected] / 888 621-6988
3020 Highwoods Blvd.Raleigh, NC 27604
[email protected] / 888 621-6988
National Survey Results
Q1 Do you think same-sex marriage should be allowed, or not?
64% Should be allowed ..........................................
31% Should not.......................................................
5% Not sure ..........................................................
Q2 Do you have a favorable or unfavorable opinion of Joe Biden?
80% Favorable........................................................
14% Unfavorable ....................................................
6% Not sure ..........................................................
Q3 Do you have a favorable or unfavorable opinion of Hillary Clinton?
86% Favorable........................................................
10% Unfavorable ....................................................
3% Not sure ..........................................................
Q4 Do you have a favorable or unfavorable opinion of Andrew Cuomo?
37% Favorable........................................................
21% Unfavorable ....................................................
42% Not sure ..........................................................
Q5 Do you have a favorable or unfavorable opinion of Martin O’Malley?
7% Favorable........................................................
17% Unfavorable ....................................................
75% Not sure ..........................................................
Q6 Do you have a favorable or unfavorable opinion of Deval Patrick?
17% Favorable........................................................
15% Unfavorable ....................................................
67% Not sure ..........................................................
Q7 Do you have a favorable or unfavorable opinion of Brian Schweitzer?
5% Favorable........................................................
19% Unfavorable ....................................................
76% Not sure ..........................................................
Q8 Do you have a favorable or unfavorable opinion of Mark Warner?
11% Favorable........................................................
17% Unfavorable ....................................................
72% Not sure ..........................................................
Q9 Do you have a favorable or unfavorable opinion of Elizabeth Warren?
45% Favorable........................................................
12% Unfavorable ....................................................
43% Not sure ..........................................................
Q10 Given the choices of Joe Biden, Hillary Clinton, Andrew Cuomo, Martin O’Malley, Deval Patrick, Brian Schweitzer, Mark Warner, and Elizabeth Warren, who would you most like to see as the Democratic candidate for President in 2016?
12% Joe Biden........................................................
61% Hillary Clinton..................................................
5% Andrew Cuomo ...............................................
2% Martin O'Malley ...............................................
1% Deval Patrick...................................................
1% Brian Schweitzer .............................................
1% Mark Warner ...................................................
4% Elizabeth Warren ............................................
12% Someone else/Undecided ...............................
November 30-December 2, 2012Survey of 454 Democratic primary votersNovember 30-December 2, 2012Survey of 454 Democratic primary voters
3020 Highwoods Blvd.Raleigh, NC 27604
[email protected] / 888 621-6988
3020 Highwoods Blvd.Raleigh, NC 27604
[email protected] / 888 621-6988
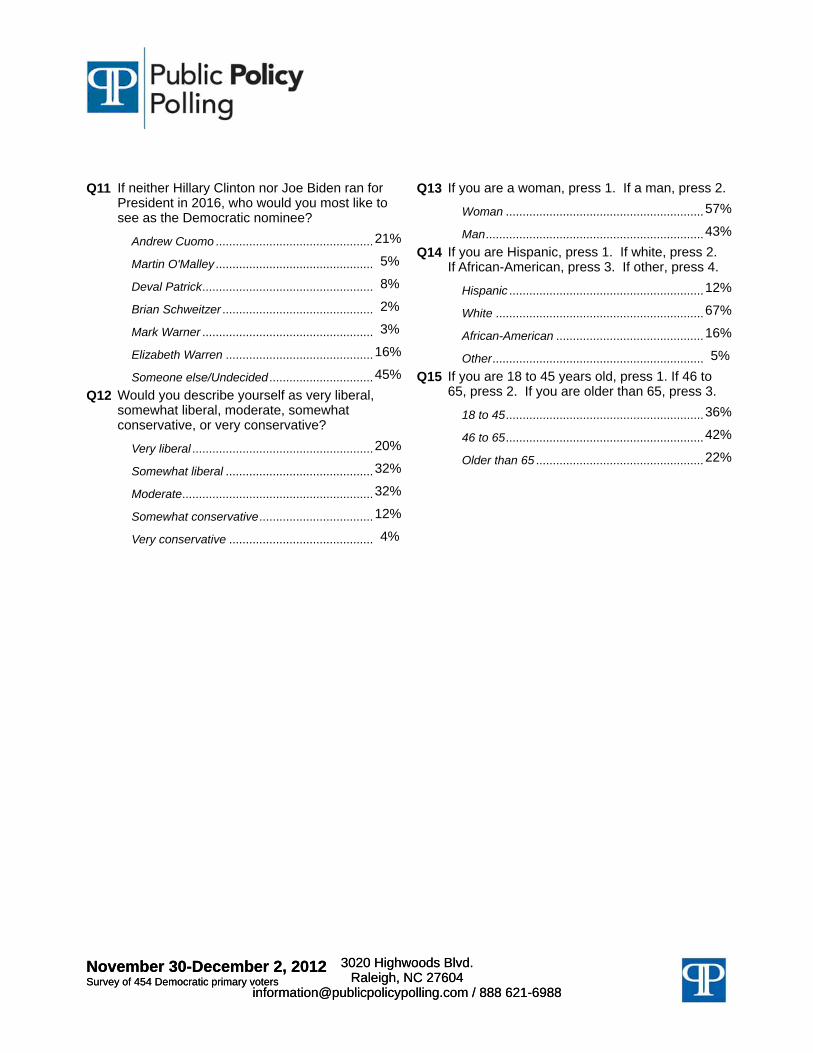
Q11 If neither Hillary Clinton nor Joe Biden ran for President in 2016, who would you most like to see as the Democratic nominee?
21% Andrew Cuomo ...............................................
5% Martin O'Malley ...............................................
8% Deval Patrick...................................................
2% Brian Schweitzer .............................................
3% Mark Warner ...................................................
16% Elizabeth Warren ............................................
45% Someone else/Undecided ...............................
Q12 Would you describe yourself as very liberal, somewhat liberal, moderate, somewhat conservative, or very conservative?
20% Very liberal ......................................................
32% Somewhat liberal ............................................
32% Moderate.........................................................
12% Somewhat conservative..................................
4% Very conservative ...........................................
Q13 If you are a woman, press 1. If a man, press 2.
57% Woman ...........................................................
43% Man.................................................................
Q14 If you are Hispanic, press 1. If white, press 2. If African-American, press 3. If other, press 4.
12% Hispanic ..........................................................
67% White ..............................................................
16% African-American ............................................
5% Other...............................................................
Q15 If you are 18 to 45 years old, press 1. If 46 to 65, press 2. If you are older than 65, press 3.
36% 18 to 45...........................................................
42% 46 to 65...........................................................
22% Older than 65 ..................................................
November 30-December 2, 2012survey of 454 Democratic primary votersNovember 30-December 2, 2012survey of 454 Democratic primary voters
3020 Highwoods Blvd.Raleigh, NC 27604
[email protected] / 888 621-6988
3020 Highwoods Blvd.Raleigh, NC 27604
[email protected] / 888 621-6988
Crosstabs
Base
Ideology
Veryliberal
Somewhatliberal Moderate
Somewhatconservative
Veryconservative
Should Same-SexMarriage BeAllowed?
Should be allowed
Should not
Not sure
64% 85% 78% 53% 38% 26%
31% 12% 21% 39% 57% 68%
5% 2% 2% 9% 4% 6%
Base
Ideology
Veryliberal
Somewhatliberal Moderate
Somewhatconservative
Veryconservative
Biden Favorability
Favorable
Unfavorable
Not sure
80% 94% 93% 77% 45% 41%
14% 5% 0% 17% 40% 53%
6% 1% 7% 5% 15% 6%
Base
Ideology
Veryliberal
Somewhatliberal Moderate
Somewhatconservative
Veryconservative
Hillary Favorability
Favorable
Unfavorable
Not sure
86% 96% 94% 87% 61% 46%
10% 1% 5% 9% 31% 45%
3% 3% 2% 3% 8% 9%
Base
Ideology
Veryliberal
Somewhatliberal Moderate
Somewhatconservative
Veryconservative
Cuomo Favorability
Favorable
Unfavorable
Not sure
37% 48% 42% 30% 24% 36%
21% 28% 18% 16% 31% 14%
42% 24% 40% 54% 44% 50%

November 30-December 2, 2012survey of 454 Democratic primary votersNovember 30-December 2, 2012survey of 454 Democratic primary voters
3020 Highwoods Blvd.Raleigh, NC 27604
[email protected] / 888 621-6988
3020 Highwoods Blvd.Raleigh, NC 27604
[email protected] / 888 621-6988
Crosstabs
Base
Ideology
Veryliberal
Somewhatliberal Moderate
Somewhatconservative
Veryconservative
O’Malley Favorability
Favorable
Unfavorable
Not sure
7% 16% 6% 6% - 6%
17% 19% 15% 14% 31% 11%
75% 66% 78% 80% 69% 83%
Base
Ideology
Veryliberal
Somewhatliberal Moderate
Somewhatconservative
Veryconservative
Patrick Favorability
Favorable
Unfavorable
Not sure
17% 28% 18% 14% 10% 6%
15% 17% 12% 13% 27% 14%
67% 55% 70% 73% 63% 80%
Base
Ideology
Veryliberal
Somewhatliberal Moderate
Somewhatconservative
Veryconservative
SchweitzerFavorability
Favorable
Unfavorable
Not sure
5% 6% 7% 4% 2% 6%
19% 25% 13% 19% 27% 6%
76% 69% 80% 77% 71% 89%
Base
Ideology
Veryliberal
Somewhatliberal Moderate
Somewhatconservative
Veryconservative
Warner Favorability
Favorable
Unfavorable
Not sure
11% 15% 8% 14% 4% 11%
17% 24% 19% 10% 23% 6%
72% 61% 73% 76% 72% 83%
November 30-December 2, 2012survey of 454 Democratic primary votersNovember 30-December 2, 2012survey of 454 Democratic primary voters
3020 Highwoods Blvd.Raleigh, NC 27604
[email protected] / 888 621-6988
3020 Highwoods Blvd.Raleigh, NC 27604
[email protected] / 888 621-6988
Crosstabs
Base
Ideology
Veryliberal
Somewhatliberal Moderate
Somewhatconservative
Veryconservative
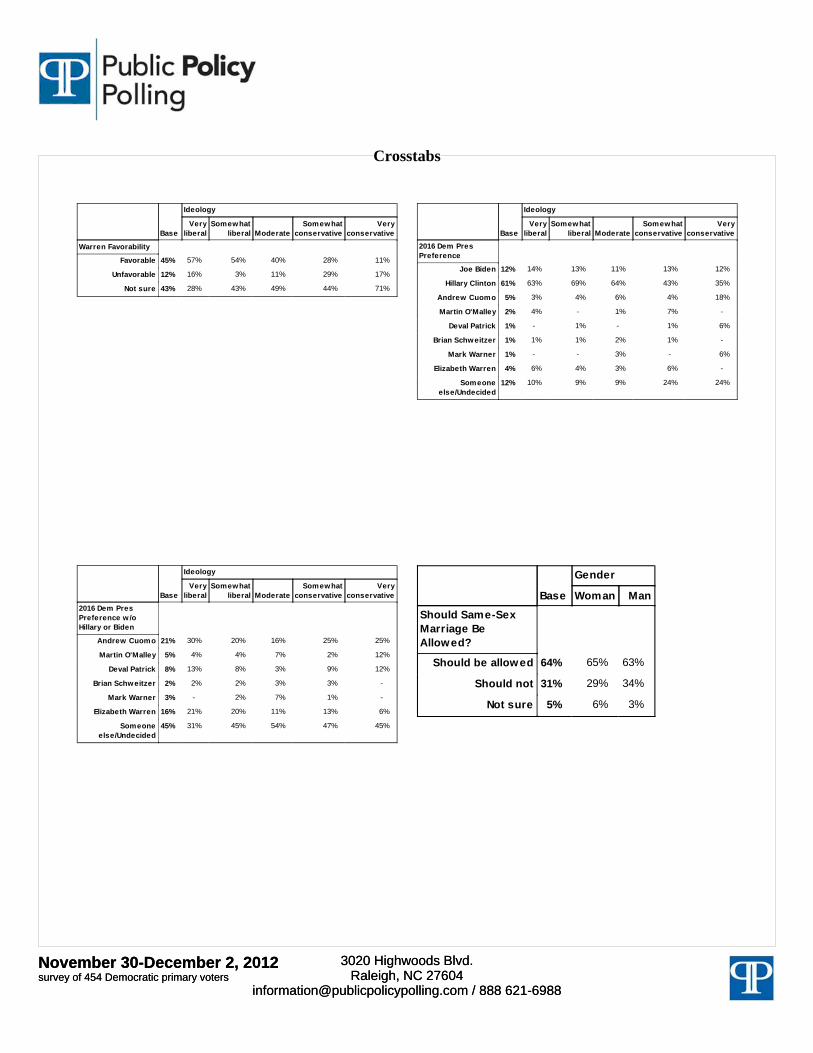
Warren Favorability
Favorable
Unfavorable
Not sure
45% 57% 54% 40% 28% 11%
12% 16% 3% 11% 29% 17%
43% 28% 43% 49% 44% 71%
Base
Ideology
Veryliberal
Somewhatliberal Moderate
Somewhatconservative
Veryconservative
2016 Dem PresPreference
Joe Biden
Hillary Clinton
Andrew Cuomo
Martin O'Malley
Deval Patrick
Brian Schweitzer
Mark Warner
Elizabeth Warren
Someoneelse/Undecided
12% 14% 13% 11% 13% 12%
61% 63% 69% 64% 43% 35%
5% 3% 4% 6% 4% 18%
2% 4% - 1% 7% -
1% - 1% - 1% 6%
1% 1% 1% 2% 1% -
1% - - 3% - 6%
4% 6% 4% 3% 6% -
12% 10% 9% 9% 24% 24%
Base
Ideology
Veryliberal
Somewhatliberal Moderate
Somewhatconservative
Veryconservative
2016 Dem PresPreference w /oHillary or Biden
Andrew Cuomo
Martin O'Malley
Deval Patrick
Brian Schweitzer
Mark Warner
Elizabeth Warren
Someoneelse/Undecided
21% 30% 20% 16% 25% 25%
5% 4% 4% 7% 2% 12%
8% 13% 8% 3% 9% 12%
2% 2% 2% 3% 3% -
3% - 2% 7% 1% -
16% 21% 20% 11% 13% 6%
45% 31% 45% 54% 47% 45%
Base
Gender
Woman Man
Should Same-SexMarriage BeAllowed?
Should be allowed
Should not
Not sure
64% 65% 63%
31% 29% 34%
5% 6% 3%

November 30-December 2, 2012survey of 454 Democratic primary votersNovember 30-December 2, 2012survey of 454 Democratic primary voters
3020 Highwoods Blvd.Raleigh, NC 27604
[email protected] / 888 621-6988
3020 Highwoods Blvd.Raleigh, NC 27604
[email protected] / 888 621-6988
Crosstabs
Base
Gender
Woman Man
Biden Favorability
Favorable
Unfavorable
Not sure
80% 82% 77%
14% 10% 18%
6% 7% 4%
Base
Gender
Woman Man
Hillary Favorability
Favorable
Unfavorable
Not sure
86% 92% 79%
10% 7% 15%
3% 1% 6%
Base
Gender
Woman Man
Cuomo Favorability
Favorable
Unfavorable
Not sure
37% 38% 36%
21% 17% 26%
42% 46% 38%
Base
Gender
Woman Man
O’Malley Favorability
Favorable
Unfavorable
Not sure
7% 8% 7%
17% 15% 20%
75% 77% 73%
November 30-December 2, 2012survey of 454 Democratic primary votersNovember 30-December 2, 2012survey of 454 Democratic primary voters
3020 Highwoods Blvd.Raleigh, NC 27604
[email protected] / 888 621-6988
3020 Highwoods Blvd.Raleigh, NC 27604
[email protected] / 888 621-6988
Crosstabs
Base
Gender
Woman Man
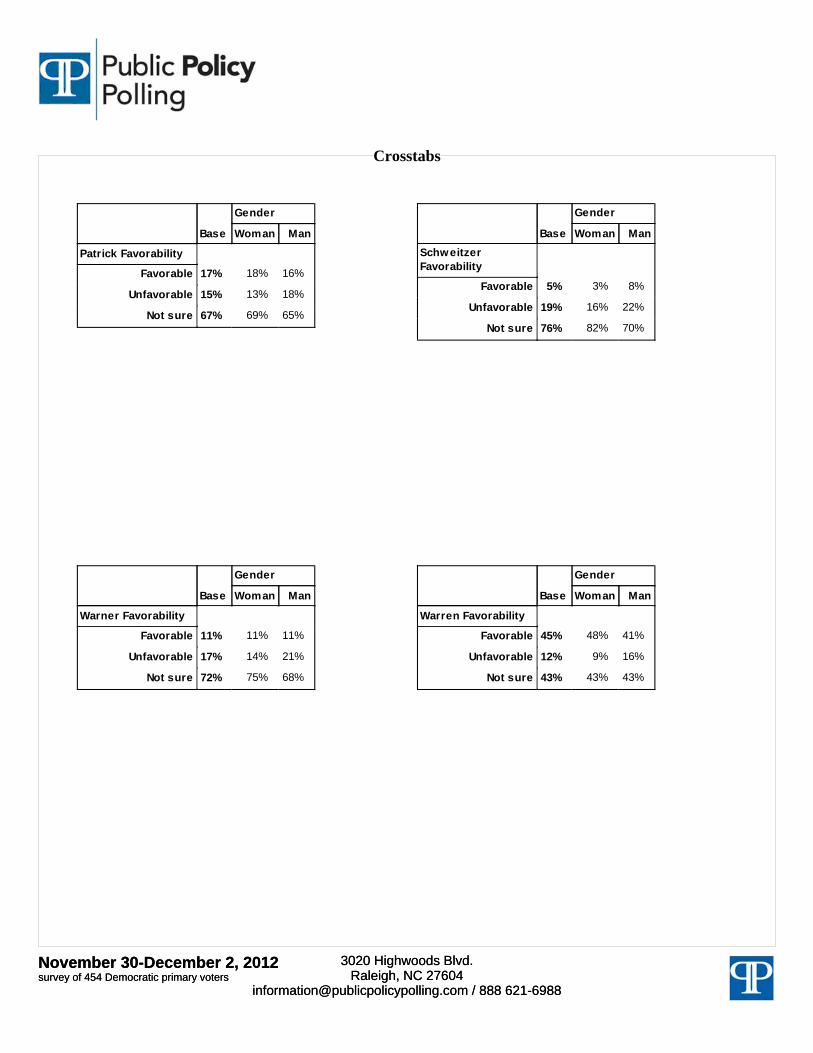
Patrick Favorability
Favorable
Unfavorable
Not sure
17% 18% 16%
15% 13% 18%
67% 69% 65%
Base
Gender
Woman Man
SchweitzerFavorability
Favorable
Unfavorable
Not sure
5% 3% 8%
19% 16% 22%
76% 82% 70%
Base
Gender
Woman Man
Warner Favorability
Favorable
Unfavorable
Not sure
11% 11% 11%
17% 14% 21%
72% 75% 68%
Base
Gender
Woman Man
Warren Favorability
Favorable
Unfavorable
Not sure
45% 48% 41%
12% 9% 16%
43% 43% 43%
November 30-December 2, 2012survey of 454 Democratic primary votersNovember 30-December 2, 2012survey of 454 Democratic primary voters
3020 Highwoods Blvd.Raleigh, NC 27604
[email protected] / 888 621-6988
3020 Highwoods Blvd.Raleigh, NC 27604
[email protected] / 888 621-6988
Crosstabs
Base
Gender
Woman Man
2016 Dem PresPreference
Joe Biden
Hillary Clinton
Andrew Cuomo
Martin O'Malley
Deval Patrick
Brian Schweitzer
Mark Warner
Elizabeth Warren
Someoneelse/Undecided
12% 11% 14%
61% 71% 49%
5% 4% 7%
2% 1% 2%
1% 0% 1%
1% 0% 3%
1% 0% 2%
4% 4% 5%
12% 8% 17%
Base
Gender
Woman Man
2016 Dem PresPreference w /oHillary or Biden
Andrew Cuomo
Martin O'Malley
Deval Patrick
Brian Schweitzer
Mark Warner
Elizabeth Warren
Someoneelse/Undecided
21% 21% 22%
5% 5% 4%
8% 6% 10%
2% 0% 5%
3% 3% 2%
16% 18% 13%
45% 46% 44%
Base
Race
Hispanic WhiteAfrican-
American Other
Should Same-SexMarriage BeAllowed?
Should be allowed
Should not
Not sure
64% 56% 72% 49% 33%
31% 39% 24% 47% 57%
5% 5% 4% 5% 10%
Base
Race
Hispanic WhiteAfrican-
American Other
Biden Favorability
Favorable
Unfavorable
Not sure
80% 58% 84% 81% 80%
14% 25% 12% 11% 15%
6% 17% 4% 8% 5%
November 30-December 2, 2012survey of 454 Democratic primary votersNovember 30-December 2, 2012survey of 454 Democratic primary voters
3020 Highwoods Blvd.Raleigh, NC 27604
[email protected] / 888 621-6988
3020 Highwoods Blvd.Raleigh, NC 27604
[email protected] / 888 621-6988
Crosstabs
Base
Race
Hispanic WhiteAfrican-
American Other
Hillary Favorability
Favorable
Unfavorable
Not sure
86% 72% 87% 94% 87%
10% 28% 10% - 10%
3% - 3% 6% 3%
Base
Race
Hispanic WhiteAfrican-
American Other
Cuomo Favorability
Favorable
Unfavorable
Not sure
37% 37% 36% 44% 23%
21% 37% 20% 11% 33%
42% 26% 44% 45% 44%
Base
Race
Hispanic WhiteAfrican-
American Other
O’Malley Favorability
Favorable
Unfavorable
Not sure
7% 14% 5% 16% -
17% 22% 13% 28% 23%
75% 64% 82% 56% 77%
Base
Race
Hispanic WhiteAfrican-
American Other
Patrick Favorability
Favorable
Unfavorable
Not sure
17% 9% 15% 29% 28%
15% 31% 13% 13% 13%
67% 60% 72% 58% 60%
November 30-December 2, 2012survey of 454 Democratic primary votersNovember 30-December 2, 2012survey of 454 Democratic primary voters
3020 Highwoods Blvd.Raleigh, NC 27604
[email protected] / 888 621-6988
3020 Highwoods Blvd.Raleigh, NC 27604
[email protected] / 888 621-6988
Crosstabs
Base
Race
Hispanic WhiteAfrican-
American Other
SchweitzerFavorability
Favorable
Unfavorable
Not sure
5% 7% 6% 1% 5%
19% 30% 16% 20% 25%
76% 63% 79% 79% 70%
Base
Race
Hispanic WhiteAfrican-
American Other
Warner Favorability
Favorable
Unfavorable
Not sure
11% 7% 12% 10% 13%
17% 35% 15% 13% 18%
72% 59% 73% 76% 69%
Base
Race
Hispanic WhiteAfrican-
American Other
Warren Favorability
Favorable
Unfavorable
Not sure
45% 33% 48% 41% 52%
12% 32% 9% 9% 18%
43% 34% 44% 50% 30%
Base
Race
Hispanic WhiteAfrican-
American Other
2016 Dem PresPreference
Joe Biden
Hillary Clinton
Andrew Cuomo
Martin O'Malley
Deval Patrick
Brian Schweitzer
Mark Warner
Elizabeth Warren
Someoneelse/Undecided
12% 19% 13% 10% -
61% 50% 59% 74% 82%
5% 14% 4% 5% 3%
2% - 3% - -
1% - 1% 2% -
1% - 2% - -
1% 7% 0% - 5%
4% 3% 6% - -
12% 6% 13% 9% 10%

November 30-December 2, 2012survey of 454 Democratic primary votersNovember 30-December 2, 2012survey of 454 Democratic primary voters
3020 Highwoods Blvd.Raleigh, NC 27604
[email protected] / 888 621-6988
3020 Highwoods Blvd.Raleigh, NC 27604
[email protected] / 888 621-6988
Crosstabs
Base
Race
Hispanic WhiteAfrican-
American Other
2016 Dem PresPreference w /oHillary or Biden
Andrew Cuomo
Martin O'Malley
Deval Patrick
Brian Schweitzer
Mark Warner
Elizabeth Warren
Someoneelse/Undecided
21% 40% 18% 25% 18%
5% - 3% 15% 8%
8% 7% 6% 14% 8%
2% - 3% - -
3% - 4% - -
16% 14% 20% 5% 3%
45% 40% 46% 41% 64%
Base
Age
18 to45
46 to65
Olderthan 65
Should Same-SexMarriage BeAllowed?
Should be allowed
Should not
Not sure
64% 58% 69% 65%
31% 40% 25% 29%
5% 2% 6% 6%
Base
Age
18 to45
46 to65
Olderthan 65
Biden Favorability
Favorable
Unfavorable
Not sure
80% 76% 82% 84%
14% 18% 12% 11%
6% 7% 6% 5%
Base
Age
18 to45
46 to65
Olderthan 65
Hillary Favorability
Favorable
Unfavorable
Not sure
86% 84% 86% 89%
10% 13% 10% 6%
3% 2% 4% 5%
November 30-December 2, 2012survey of 454 Democratic primary votersNovember 30-December 2, 2012survey of 454 Democratic primary voters
3020 Highwoods Blvd.Raleigh, NC 27604
[email protected] / 888 621-6988
3020 Highwoods Blvd.Raleigh, NC 27604
[email protected] / 888 621-6988
Crosstabs
Base
Age
18 to45
46 to65
Olderthan 65
Cuomo Favorability
Favorable
Unfavorable
Not sure
37% 36% 35% 42%
21% 20% 25% 14%
42% 44% 39% 44%
Base
Age
18 to45
46 to65
Olderthan 65
O’Malley Favorability
Favorable
Unfavorable
Not sure
7% 13% 4% 4%
17% 20% 18% 12%
75% 67% 78% 84%
Base
Age
18 to45
46 to65
Olderthan 65
Patrick Favorability
Favorable
Unfavorable
Not sure
17% 16% 16% 21%
15% 16% 18% 11%
67% 69% 66% 68%
Base
Age
18 to45
46 to65
Olderthan 65
SchweitzerFavorability
Favorable
Unfavorable
Not sure
5% 7% 4% 5%
19% 20% 21% 12%
76% 73% 75% 83%
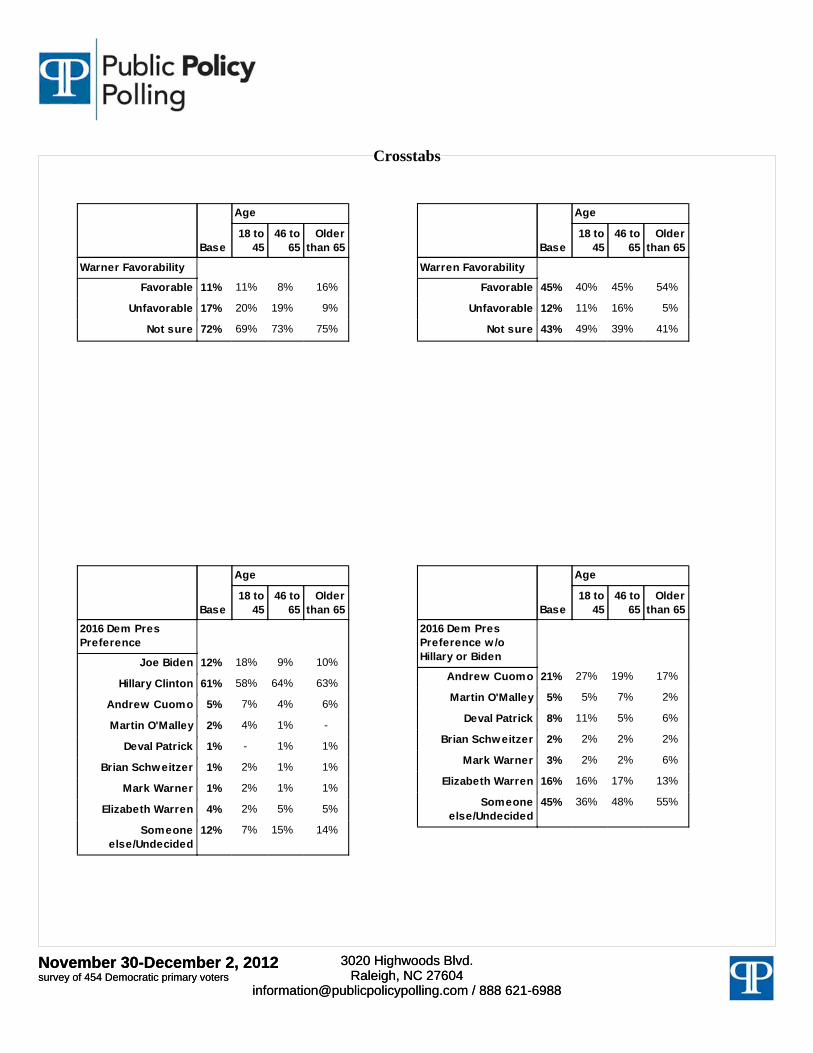
November 30-December 2, 2012survey of 454 Democratic primary votersNovember 30-December 2, 2012survey of 454 Democratic primary voters
3020 Highwoods Blvd.Raleigh, NC 27604
[email protected] / 888 621-6988
3020 Highwoods Blvd.Raleigh, NC 27604
[email protected] / 888 621-6988
Crosstabs
Base
Age
18 to45
46 to65
Olderthan 65
Warner Favorability
Favorable
Unfavorable
Not sure
11% 11% 8% 16%
17% 20% 19% 9%
72% 69% 73% 75%
Base
Age
18 to45
46 to65
Olderthan 65
Warren Favorability
Favorable
Unfavorable
Not sure
45% 40% 45% 54%
12% 11% 16% 5%
43% 49% 39% 41%
Base
Age
18 to45
46 to65
Olderthan 65
2016 Dem PresPreference
Joe Biden
Hillary Clinton
Andrew Cuomo
Martin O'Malley
Deval Patrick
Brian Schweitzer
Mark Warner
Elizabeth Warren
Someoneelse/Undecided
12% 18% 9% 10%
61% 58% 64% 63%
5% 7% 4% 6%
2% 4% 1% -
1% - 1% 1%
1% 2% 1% 1%
1% 2% 1% 1%
4% 2% 5% 5%
12% 7% 15% 14%
Base
Age
18 to45
46 to65
Olderthan 65
2016 Dem PresPreference w /oHillary or Biden
Andrew Cuomo
Martin O'Malley
Deval Patrick
Brian Schweitzer
Mark Warner
Elizabeth Warren
Someoneelse/Undecided
21% 27% 19% 17%
5% 5% 7% 2%
8% 11% 5% 6%
2% 2% 2% 2%
3% 2% 2% 6%
16% 16% 17% 13%
45% 36% 48% 55%