Embed Size (px)
Citation preview
8/13/2019 CLME Marine Resource Valuation 2011 11 17
http://slidepdf.com/reader/full/clme-marine-resource-valuation-2011-11-17 1/61
Centre for Resource Management and Environmental Studies
FACULTY OF PURE AND APPLIED SCIENCESTHE UNIVERSITY OF THE WEST INDIES
CAVE HILL CAMPUS, BARBADOS
Regional Governance Framework for the CLME project
Deliverable 4:
The Valuation of Marine Ecosystem Goods and Services in the
Caribbean
Peter W. Schuhmann
Department of Economics and Finance
The University of North Carolina Wilmington
601 S. College Road
Wilmington NC 28403
USA
November 2011
8/13/2019 CLME Marine Resource Valuation 2011 11 17
http://slidepdf.com/reader/full/clme-marine-resource-valuation-2011-11-17 2/61
Table of Contents List of Tables ................................................................................................................................. iii
List of Figures ................................................................................................................................ iii
List of abbreviations ...................................................................................................................... iv
Executive Summary ........................................................................................................................ v
1 The economics of marine ecosystem goods and services ........................................................ 1
1.1 Introduction .......................................................................................................................... 1
1.2 Services, Benefits and Value ............................................................................................... 2
1.3 Valuation .............................................................................................................................. 3
1.4 The importance of valuation ................................................................................................ 4
2 Valuation Methodologies ........................................................................................................ 4
2.1 Methodologies based on market data ................................................................................... 4
2.1.1 The market price approach .................................................................................................... 4
Figure 1: Market gains (producer and consumer surplus) .............................................................. 5
2.1.2 The replacement cost approach ............................................................................................. 6
2.1.3 The cost (damage) avoidance approach ................................................................................ 6
2.1.4 The production function approach (productivity method) .................................................... 7
2.2 Non-market approaches ....................................................................................................... 7
2.2.1 Revealed preference methods ............................................................................................... 7
2.2.2 The Travel Cost Method ....................................................................................................... 82.2.3 The Hedonic Pricing Method ................................................................................................ 8
2.3 Stated Preference Methods .................................................................................................. 9
2.3.1 The Contingent Valuation Method........................................................................................ 9
2.3.2 Choice Modeling (Choice Experiments) ............................................................................. 10
2.4 Methods that rely on existing valuation estimates ............................................................. 10
2.4.1 The Benefits Transfer Approach ......................................................................................... 10
2.4.2 Meta analysis ...................................................................................................................... 11
2.4.3 Economic Impact Analysis ................................................................................................. 11
2.5 Guiding valuation in the CLME: Appropriate methods for different categories of values 12
2.5.1 Extractive uses and services tied to markets ....................................................................... 12
2.5.2 Marine ecosystem services.................................................................................................. 13
2.5.3 Non-use values .................................................................................................................... 13
2.6 Valuation difficulties ......................................................................................................... 14
8/13/2019 CLME Marine Resource Valuation 2011 11 17
http://slidepdf.com/reader/full/clme-marine-resource-valuation-2011-11-17 3/61
ii
2.6.1 Marginality .......................................................................................................................... 14
2.6.2 Double-counting.................................................................................................................. 15
2.6.3 Distribution of costs and benefits ........................................................................................ 15
2.6.4 Nonlinearities in ecosystem service provision .................................................................... 15
2.6.5 Aggregation ......................................................................................................................... 16
3 Review of marine valuation studies in the Caribbean ........................................................... 16
3.1 Overview ............................................................................................................................ 16
3.2 Replicable applications in the Caribbean ........................................................................... 17
3.3 Tourism and marine resources ........................................................................................... 18
3.4 Valuations of the Coral Reef Ecosystem ........................................................................... 19
3.4.1 Estimates of multiple values from reef ecosystems ............................................................ 20
3.4.2 Reef recreation and tourism not specific to MPAs ............................................................. 22
3.5 Marine protected areas ....................................................................................................... 24
3.5.1 General valuations of MPAs ............................................................................................... 24
3.5.2 Financial analysis of MPAs ................................................................................................ 25
3.5.3 WTP and Recreation in Marine Protected Areas ................................................................ 25
3.6 Coral reef ecosystem service values .................................................................................. 29
3.7 Reef fishery valuation studies ............................................................................................ 31
3.7.1 Financial analysis of reef fisheries ...................................................................................... 31
3.7.2 Economic value and economic impacts .............................................................................. 323.7.3 Other reef values ................................................................................................................. 33
3.7.4 Other applications of economics to reef resources in the CLME ....................................... 33
4 Values associated with the pelagic ecosystem ...................................................................... 34
4.1 Pelagic fishery values and analyses ................................................................................... 35
4.1.1 Commercial fishery value estimates ................................................................................... 35
4.1.2 Economic linkages and pelagic fisheries ............................................................................ 35
4.1.3 Fisheries multipliers ............................................................................................................ 36
4.2 Sport fishing values............................................................................................................ 36
4.3 Other recreation in the pelagic ecosystem ......................................................................... 37
5 Values associated with the continental shelf ecosystem ....................................................... 37
6 Summary of Wider Caribbean Marine Resource Values ...................................................... 38
6.1 Overview of analyses ......................................................................................................... 38
8/13/2019 CLME Marine Resource Valuation 2011 11 17
http://slidepdf.com/reader/full/clme-marine-resource-valuation-2011-11-17 4/61
iii
6.2 Gaps, unknowns and possibilities for future valuation work ............................................. 39
7 Recommendations for valuation in the CLME ...................................................................... 42
8 References ............................................................................................................................. 44
List of Tables
Table 1: Ecosystem Services .......................................................................................................... 1
Table 2: Categories of Economic Value ......................................................................................... 3
Table 3: Appropriate valuation methods....................................................................................... 14
Table 4: Knowledge of values by country for reef and pelagic ecosystems in the CLME ........... 40
Table 5: Summary of knowledge of Caribbean marine resource values ...................................... 41
List of Figures
Figure 1: Market gains (producer and consumer surplus) .............................................................. 5
Figure 2: Ecosystem-to-benefits pathway general form ............................................................... 43
Figure 3: Ecosystem-to-benefits pathway example ...................................................................... 43
8/13/2019 CLME Marine Resource Valuation 2011 11 17
http://slidepdf.com/reader/full/clme-marine-resource-valuation-2011-11-17 5/61
iv
List of abbreviations
BAU Business as usual
BVI British Virgin Islands
BMP Bonaire Marine ParkCA Cost avoidance method
CBA Cost benefit analysis
CLME Caribbean Large Marine Ecosystem
CM Choice modeling
CS Consumer surplus
CTO Caribbean Tourism Organization
CVM Contingent valuation method
GDP Gross domestic product
GSMP Gladden Spit Marine Park
HP Hedonic price method
MBMP Montego Bay Marine Park
MEY Maximum economic yield
MSY Maximum sustainable yield
MP Market price method
NPV Net present value
PF Production function method
PS Producer surplus
RC Replacement cost method
SVG St. Vincent and the Grenadines
TCI Turks and Caicos Islands
TCM Travel cost method
TEV Total economic value
USVI United States Virgin IslandsWCR Wider Caribbean Region
WRI World Resources Institute
WTA Willingness to accept
WTP Willingness to pay
8/13/2019 CLME Marine Resource Valuation 2011 11 17
http://slidepdf.com/reader/full/clme-marine-resource-valuation-2011-11-17 6/61
v
Executive Summary
This report provides a summary of economic analyses of marine ecosystem services in the WiderCaribbean Region for the three major marine ecosystem types being addressed by the CaribbeanLarge Marine Ecosystem (CLME) Project: reef, pelagic and continental shelf. Particular
attention is given to empirical valuation studies. An overview of existing valuationmethodologies is provided, along with recommendations for applications in the in the CLMEProject area. Advantages and disadvantages of alternative methods are discussed. Market andnon-market valuation studies from peer-reviewed journals, proceedings, government archivesand university databases are reviewed. Attention is also given to other empirical work at thenexus of economics and marine resources in the Caribbean such as the use and effects ofeconomic incentives, economic impact studies, and conservation finance. Studies reviewed forthis report include analyses of primary and secondary data, benefits transfer applications, meta-analyses and case studies. Gaps, deficiencies and unknowns in the extant literature arehighlighted and discussed. The summary and analysis of gaps together form a framework forvaluation in the Wider Caribbean Region so that future work can be directed toward areas of
policy importance.Approximately 200 individual value estimates were reviewed for this study. To date, marineeconomic valuations in the WCR have focused on only a limited number of benefits derivedfrom marine ecosystem goods and services, primarily benefits that are relatively easy to measureand convey to the public, such as recreation opportunities in near-shore protected areas, and benefits that are ascribed to easily measured market indicators such those derived from realestate and capture fisheries. Values associated with reefs have received far more attention thanthose associated with the pelagic or shelf ecosystems, no doubt due to the ease of access toassociated user groups by researchers and the relatively straightforward linkages betweenchanges in resource quality and well-being.
Despite a plethora of market data and evidence of overfishing in the WCR (CARSEA, 2007), theeconomic impacts of overfishing remain largely unexplored. These include effects on nationaleconomies, employment, food security and tourism. Likewise, the economic practicality offisheries subsidies in terms of the relative values of contemporaneous support livelihoods andfuture economic costs overfishing remains unknown.
As overfishing could potentially lead to the loss of historic fishing heritage as well as animportant source of protection against exogenous economic shocks, understanding the valuesfrom the cultural and security benefits of small scale fisheries deserves of attention. Othercultural service values that remain largely unknown include the value of WCR marineecosystems to research and education and the amenity value of reefs to coastal property owners.This latter value, estimable via the HP method, would appear to be an important partner to
studies that estimate the value of reefs for coastal protection.Supporting and regulating services provided by the marine ecosystems of the WCR that have been recognized as important in the context of natural sciences, have not be linked to valuation.Examples include the contribution of Caribbean reefs and other coastal ecosystems to fisheries production, climate regulation and habitat provision. With appropriate modeling, the PF methodcould be applied to improve our understanding of these values.

8/13/2019 CLME Marine Resource Valuation 2011 11 17
http://slidepdf.com/reader/full/clme-marine-resource-valuation-2011-11-17 7/61
vi
Finally, despite the continued improvement of appropriate methodologies, estimates of non-usevalues for WCR marine ecosystem goods and services are in short supply.
The matrix of ecosystem services by major marine ecosystems serves as a framework forreviewing the status of evaluation studies in the Wider Caribbean Region. It is suggested thatfuture work on valuation be coordinated among countries and agencies so that gaps can be
prioritized and addressed through conceptual models and valuation studies that will lead to amore comprehensive understanding of the full value of the goods and services provided by allthree major ecosystems.
8/13/2019 CLME Marine Resource Valuation 2011 11 17
http://slidepdf.com/reader/full/clme-marine-resource-valuation-2011-11-17 8/61
1 The economics of marine ecosystem goods and services
1.1 Introduction
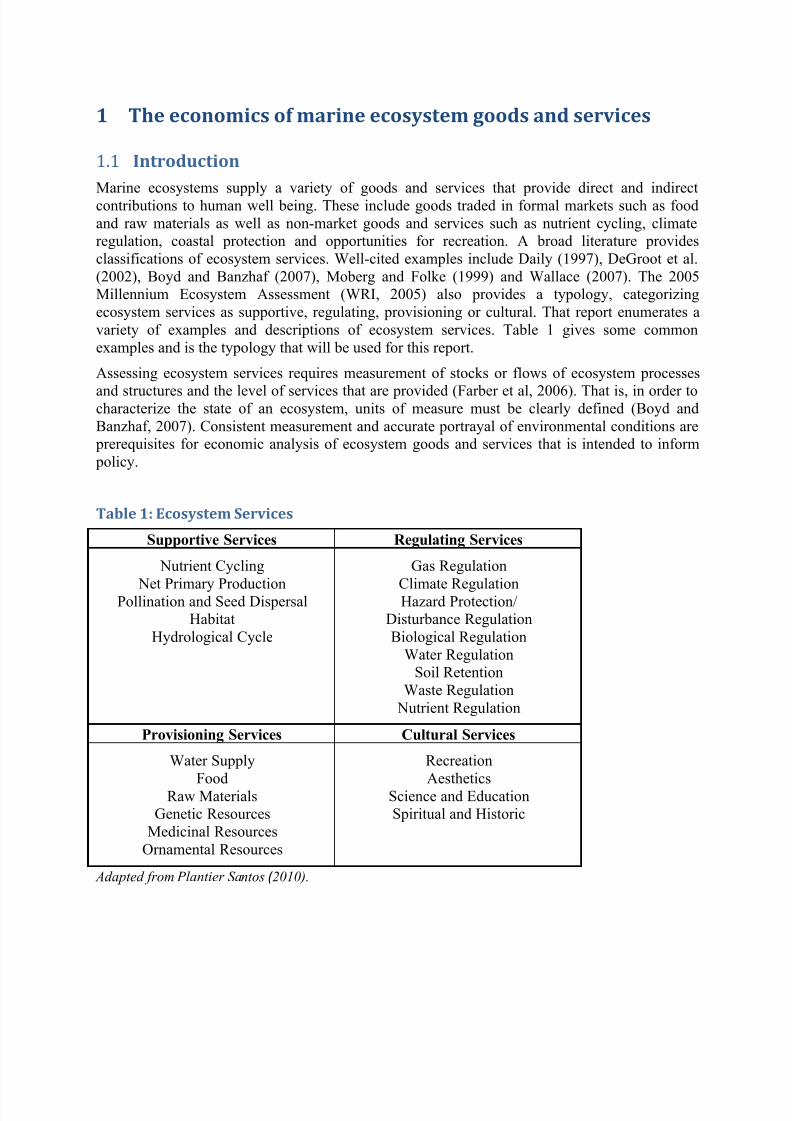
Marine ecosystems supply a variety of goods and services that provide direct and indirectcontributions to human well being. These include goods traded in formal markets such as foodand raw materials as well as non-market goods and services such as nutrient cycling, climateregulation, coastal protection and opportunities for recreation. A broad literature providesclassifications of ecosystem services. Well-cited examples include Daily (1997), DeGroot et al.(2002), Boyd and Banzhaf (2007), Moberg and Folke (1999) and Wallace (2007). The 2005Millennium Ecosystem Assessment (WRI, 2005) also provides a typology, categorizingecosystem services as supportive, regulating, provisioning or cultural. That report enumerates avariety of examples and descriptions of ecosystem services. Table 1 gives some commonexamples and is the typology that will be used for this report.
Assessing ecosystem services requires measurement of stocks or flows of ecosystem processes
and structures and the level of services that are provided (Farber et al, 2006). That is, in order tocharacterize the state of an ecosystem, units of measure must be clearly defined (Boyd andBanzhaf, 2007). Consistent measurement and accurate portrayal of environmental conditions are prerequisites for economic analysis of ecosystem goods and services that is intended to inform policy.
Adapted from Plantier Santos ( 2010).
Table 1: Ecosystem Services
Supportive Services Regulating Services
Nutrient Cycling
Net Primary ProductionPollination and Seed DispersalHabitat
Hydrological Cycle
Gas Regulation
Climate RegulationHazard Protection/Disturbance RegulationBiological Regulation
Water RegulationSoil Retention
Waste Regulation Nutrient Regulation
Provisioning Services Cultural Services
Water Supply
FoodRaw MaterialsGenetic Resources
Medicinal ResourcesOrnamental Resources
Recreation
AestheticsScience and EducationSpiritual and Historic
8/13/2019 CLME Marine Resource Valuation 2011 11 17
http://slidepdf.com/reader/full/clme-marine-resource-valuation-2011-11-17 9/61
2
1.2 Services, Benefits and Value
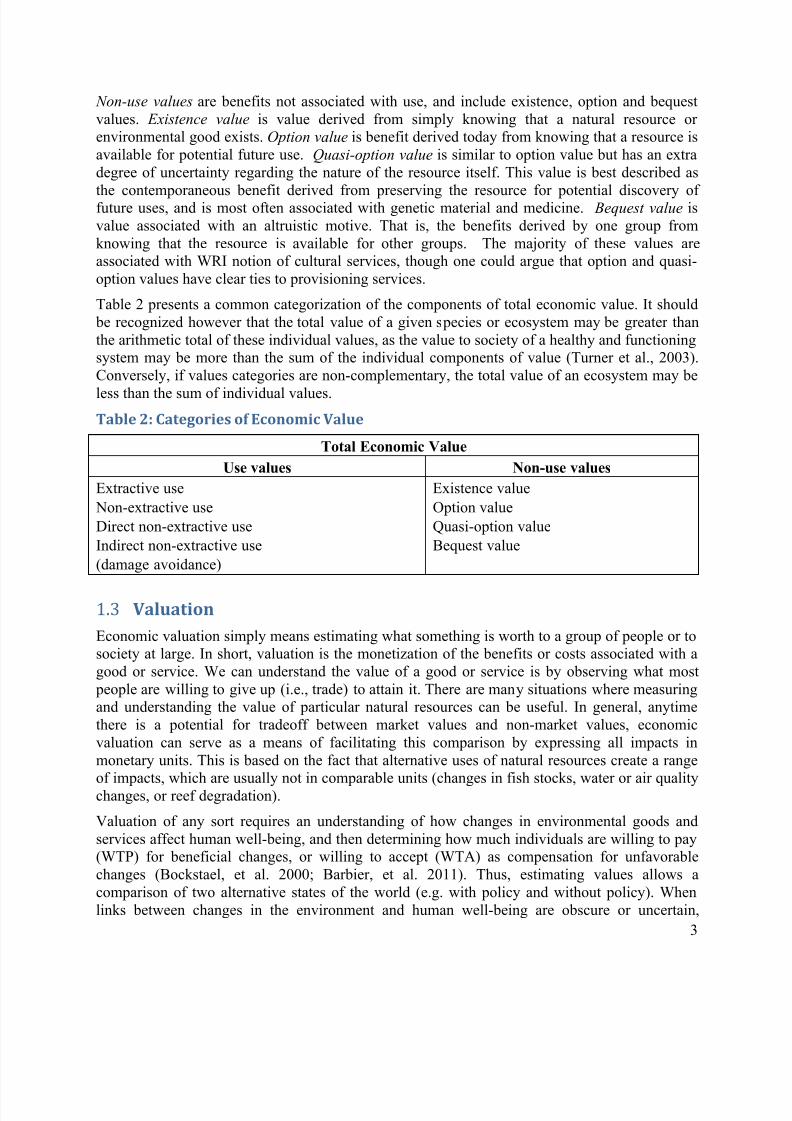
Understanding and measuring the associated contributions to human well being is the domain ofeconomic valuation, hence it is important at the onset of this report to link notions of ecosystemservices with concepts of human well being and economic value. As noted in Boyd and Banzhaf(2007) and echoed by Fisher and Turner (2008), ecosystem services (processes and functions)
are not synonymous with ecosystem benefits (outcomes). While the former may be especiallydifficult to quantify, measurements of the latter are more often of interest for informing policy.More importantly for the purposes of this review, it is these benefits that provide the basis ofeconomic valuation studies. For example, consider the case of a coral reef ecosystem. The processes and functions of the reef include biological production, biochemical processing, wasteassimilation and maintenance of biological diversity. These processes and functions provide the benefits of food, recreation, aesthetics and damage/cost avoidance. The delineation betweenecosystem services and ecosystem benefits helps us to avoid the problem of double countingwhen estimating economic values as we only seek to measure distinct benefits (Fisher andTurner, 2008).
Economists define the value of a particular good or service as what it is worth to people, in termsof the contribution of the good or service to well-being (Bockstael et al., 2000). Because thisdefinition of value is best measured by what people are willing and able to pay for a good orservice, value is often confused with cost. Cost, or what people have to actually pay for a good orservice, is considered expenditure and may differ greatly from the value of the good or service.For example, a beach renourishment project may involve $1 million in physical and engineeringcosts, but may generate considerably more (or less) than that in actual economic value. Likewise,subsidies to developers or commercial fishers may cost society thousands of dollars but result innet economic losses. Such actions should be recognized as having positive costs but negativeeconomic values.
It is also important to recognize that economic value extends beyond the marketplace to
“nonmarket ” goods and services such as clean water and diverse ecosystems, and may include benefits derived without any direct use or interaction with the natural environment whatsoever.These “non-use values” include benefits derived from simply knowing that a species or
ecosystem exists, benefits from the knowledge that resources may be available for futuregenerations or for potential future use or research and discovery. That people are willing to giveup time or other resources (including money) for the opportunity to consume these goods andservices lends evidence to this notion.
Distinguishing the notions of ecosystem services and ecosystem benefits allows us to partitionthe concept of economic value in a way that allows for a straightforward and commonly acceptedclassification scheme. For example, in addition to categorizing values in terms of whether or notthey are revealed in formal markets, it is common to differentiate between values associated withuse and those not associated with use. Use values include benefits derived from environmentalgoods that are associated with direct or indirect interaction with the environment. Direct benefitscan be derived via extraction (e.g. fish harvests, raw materials) and would be associated with provisioning services in the WRI (2005) typology, while benefits derived from non-extractivedirect interactions such as recreation, research and aesthetics would be associated with culturalservices. Indirect use values include the benefits from damage or cost avoidance (e.g. protectionof coastal real estate) and would be associated with regulating services.
8/13/2019 CLME Marine Resource Valuation 2011 11 17
http://slidepdf.com/reader/full/clme-marine-resource-valuation-2011-11-17 10/61
3
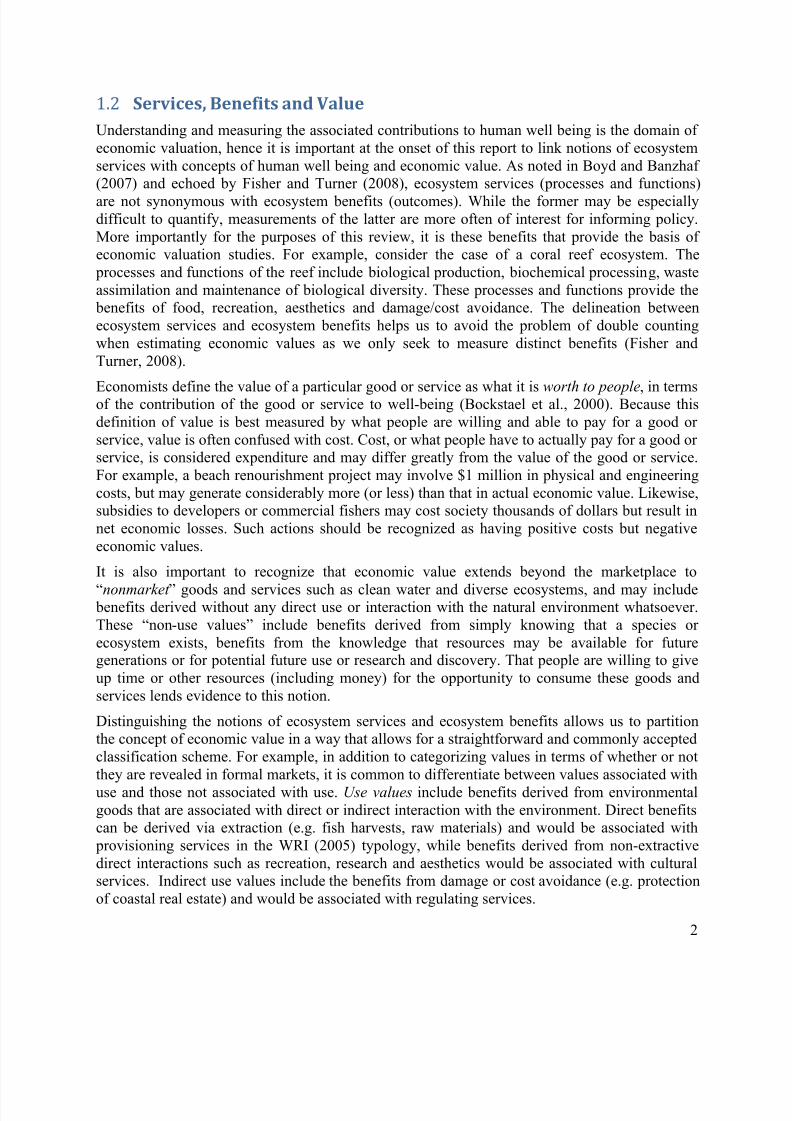
Non-use values are benefits not associated with use, and include existence, option and bequestvalues. Existence value is value derived from simply knowing that a natural resource orenvironmental good exists. Option value is benefit derived today from knowing that a resource isavailable for potential future use. Quasi-option value is similar to option value but has an extradegree of uncertainty regarding the nature of the resource itself. This value is best described as
the contemporaneous benefit derived from preserving the resource for potential discovery offuture uses, and is most often associated with genetic material and medicine. Bequest value isvalue associated with an altruistic motive. That is, the benefits derived by one group fromknowing that the resource is available for other groups. The majority of these values areassociated with WRI notion of cultural services, though one could argue that option and quasi-option values have clear ties to provisioning services.
Table 2 presents a common categorization of the components of total economic value. It should be recognized however that the total value of a given species or ecosystem may be greater thanthe arithmetic total of these individual values, as the value to society of a healthy and functioningsystem may be more than the sum of the individual components of value (Turner et al., 2003).Conversely, if values categories are non-complementary, the total value of an ecosystem may be
less than the sum of individual values.Table 2: Categories of Economic Value
Total Economic Value
Use values Non-use values
Extractive use Non-extractive useDirect non-extractive useIndirect non-extractive use(damage avoidance)
Existence valueOption valueQuasi-option valueBequest value
1.3 Valuation
Economic valuation simply means estimating what something is worth to a group of people or tosociety at large. In short, valuation is the monetization of the benefits or costs associated with agood or service. We can understand the value of a good or service is by observing what most people are willing to give up (i.e., trade) to attain it. There are many situations where measuringand understanding the value of particular natural resources can be useful. In general, anytimethere is a potential for tradeoff between market values and non-market values, economicvaluation can serve as a means of facilitating this comparison by expressing all impacts inmonetary units. This is based on the fact that alternative uses of natural resources create a range
of impacts, which are usually not in comparable units (changes in fish stocks, water or air qualitychanges, or reef degradation).
Valuation of any sort requires an understanding of how changes in environmental goods andservices affect human well-being, and then determining how much individuals are willing to pay(WTP) for beneficial changes, or willing to accept (WTA) as compensation for unfavorablechanges (Bockstael, et al. 2000; Barbier, et al. 2011). Thus, estimating values allows acomparison of two alternative states of the world (e.g. with policy and without policy). Whenlinks between changes in the environment and human well-being are obscure or uncertain,
8/13/2019 CLME Marine Resource Valuation 2011 11 17
http://slidepdf.com/reader/full/clme-marine-resource-valuation-2011-11-17 11/61
4
valuation naturally becomes more difficult. Valuation may be precluded due to scientificcomplexity, human cognitive limitations, or when the monetary measures are deemed morallyintractable because of prevailing social norms (Turner et al., 2003). Given the classificationscheme for values outlined above, it is not surprising that the majority of valuation studies deriveestimates for benefits associated with provisioning and cultural ecosystem services, and
relatively few address supportive and regulating services. Indeed, while values linked tosupportive and regulating services are clearly non-market in nature, their estimation takes placeoutside of the realm of traditional non-market valuation (described below), and requires adifferent set of empirical approaches.
1.4 The importance of valuation
Despite the fact that the entire market economy depends on the existence of natural systems,values derived from environmental goods and services are often ignored by policy makers. Partof the explanation for this stems from the fact that people and governments most often respond tomonetary price signals which may differ from economic values (Dixon, 1998). Without anunderstanding of the monetary worth of natural resources, conservation efforts may be stymied because they are viewed as costly in terms of precluding activities that have large immediatefinancial rewards (Schuhmann et al., 2011). Simply put, the true value of natural resources, in theCaribbean and around the world, is largely unknown, and as a consequence may not be given dueattention in the policy process.
Valuation studies can fill this void by generating information on the costs associated with speciesand habitat loss, the benefits of conservation and restoration efforts, or economic dependence onnatural systems. When reported in a common and easily understood monetary metric, suchinformation can serve as a valuable input into decision-making processes attempting to managethe allocation of scarce resources among competing demands (Turner et al., 2003). At thenational level, economic valuation can support decision-making by ministries, the private sector,
and organizations involved in the use and management of natural systems. Incorporating thevalue of natural assets into national income accounts, though difficult, may allow for a moreaccurate indication of economic performance or national wealth (Dharmaratne and Strand,1999). Public and private sector organizations that indirectly affect natural systems via actions or budgetary decisions can also benefit from knowledge gained through valuation studies, but may be less convinced of the importance of valuation than direct stakeholders (Lange and Jiddawi,2008).
2 Valuation Methodologies
2.1 Methodologies based on market data
2.1.1 The market price approach
Approaches to valuation can take many forms, coincident with the many ways that humans caninteract with the environment and the array of benefits that result. The method chosen oftendepends on what is being valued and the intended use or policy purpose of the values. Whenvalue is easily revealed through market transactions (such as benefits associated with directextractive uses), monetization may be accomplished via the relatively straightforward market
8/13/2019 CLME Marine Resource Valuation 2011 11 17
http://slidepdf.com/reader/full/clme-marine-resource-valuation-2011-11-17 12/61
5
price approach (MP). Sometimes referred to as financial analysis, this approach valuesenvironmental goods and services based on profits or market value-added (Huber andRuitenbeek, 1997). In its simplest form, the MP method constructs estimates of total expenditure by purchasers (equivalent to revenue received by producers) based on market prices andquantities. Such estimates ignore costs of providing the goods and services and as such are not
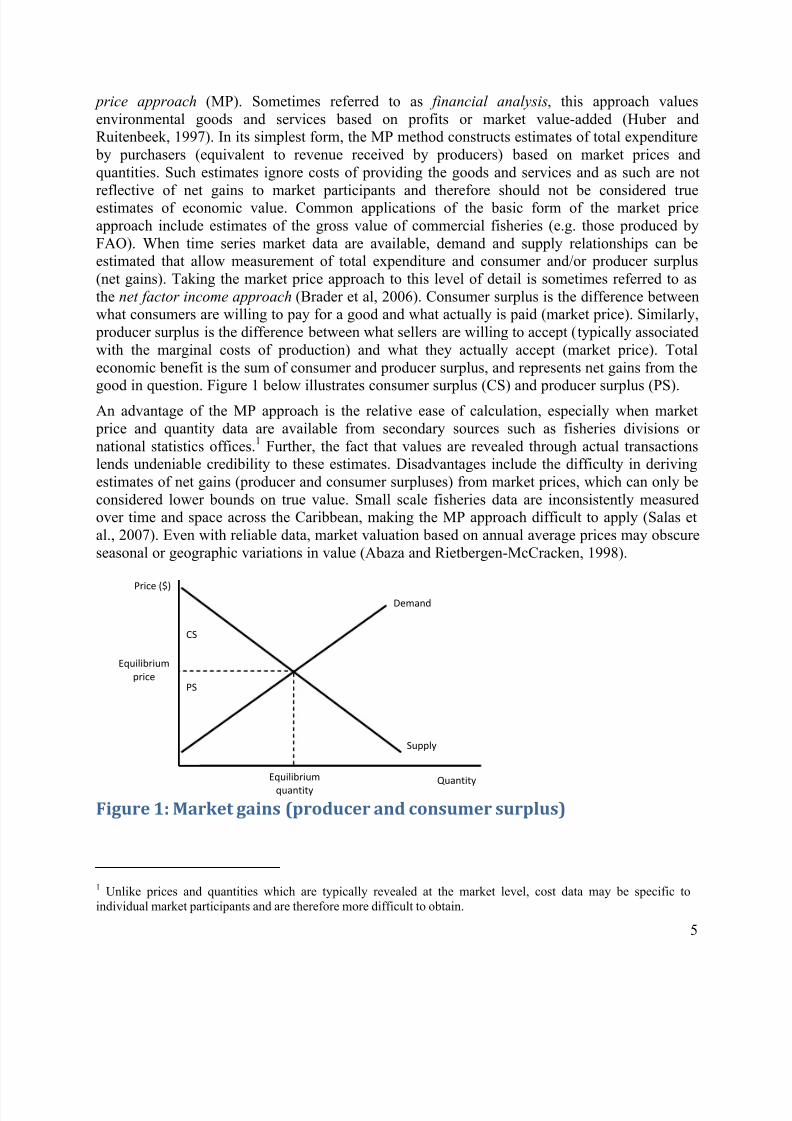
reflective of net gains to market participants and therefore should not be considered trueestimates of economic value. Common applications of the basic form of the market priceapproach include estimates of the gross value of commercial fisheries (e.g. those produced byFAO). When time series market data are available, demand and supply relationships can beestimated that allow measurement of total expenditure and consumer and/or producer surplus(net gains). Taking the market price approach to this level of detail is sometimes referred to asthe net factor income approach (Brader et al, 2006). Consumer surplus is the difference betweenwhat consumers are willing to pay for a good and what actually is paid (market price). Similarly, producer surplus is the difference between what sellers are willing to accept (typically associatedwith the marginal costs of production) and what they actually accept (market price). Totaleconomic benefit is the sum of consumer and producer surplus, and represents net gains from the
good in question. Figure 1 below illustrates consumer surplus (CS) and producer surplus (PS).An advantage of the MP approach is the relative ease of calculation, especially when market price and quantity data are available from secondary sources such as fisheries divisions ornational statistics offices.1 Further, the fact that values are revealed through actual transactionslends undeniable credibility to these estimates. Disadvantages include the difficulty in derivingestimates of net gains (producer and consumer surpluses) from market prices, which can only beconsidered lower bounds on true value. Small scale fisheries data are inconsistently measuredover time and space across the Caribbean, making the MP approach difficult to apply (Salas etal., 2007). Even with reliable data, market valuation based on annual average prices may obscureseasonal or geographic variations in value (Abaza and Rietbergen-McCracken, 1998).
Figure 1: Market gains (producer and consumer surplus)
1 Unlike prices and quantities which are typically revealed at the market level, cost data may be specific toindividual market participants and are therefore more difficult to obtain.
Price ($)
Equilibrium
quantity
Demand
Supply
Quantity
Equilibrium
price
CS
PS
8/13/2019 CLME Marine Resource Valuation 2011 11 17
http://slidepdf.com/reader/full/clme-marine-resource-valuation-2011-11-17 13/61
6
2.1.2 The replacement cost approach
The replacement cost approach (RC) is based on the idea that some goods and services provided by the natural environment can be replaced with manmade goods and services. Estimates of thecosts of providing these replacement services are used as the value of the associated naturally provided services. For example, the costs associated with constructing an artificial breakwater
may be used as a proxy for the value of a reef that provides the same service, or the costsassociated with building and maintaining a water treatment plant may be used as an estimate ofthe value of the water cleaning service provided by wetlands. This method is applicable only insituations when the natural service can be suitably and equivalently replaced with a manmadealternative, the costs of that substitute are known or estimable (WRI, 2009) and represent theleast-cost means of providing the service, and when society is willing and able to incur the costsassociated with the replacement (Bockstael et al., 2000). When these conditions are not met, useof the replacement cost approach is not valid (EPA, 2009).
Advantages of the replacement cost approach include relative ease of calculation based onmarket data. The values conveyed by this method are also easily understood by policy makersand the public at large as representing the opportunity costs associated with failure to protectnatural assets. The principle disadvantage of the method is that it is not a true means ofmeasuring the value of ecosystem goods and services in the sense of gross or net benefits to people. The method provides a measurement of costs, which may not reflect the true value of in-situ environmental goods and services. Indeed, it seems unlike that man-made alternatives will provide the full range of benefits provided by natural assets. Application of the replacement costapproach may therefore leave policy makers with insufficient information regarding the truegains from outlays or interventions designed to prevent damage to natural assets (Abaza andRietbergen-McCracken, 1998).
2.1.3 The cost (damage) avoidance approach
Similar to the replacement cost approach, the cost (damage) avoidance approach (CA) usesestimates of the expenditures that would be incurred to prevent, diminish or avoid harmfuleffects associated with degradations to natural resources. This perspective views the cost savingsassociated with reduced spending on human and environmental health as benefits of maintainingecosystem services or preventing their decline. For example, the cost of replacing coastal realestate may be used as an estimate of the storm protection service derived from healthy reefs, orthe value of reducing bacterial counts in surface water may be quantified by estimating theassociated reductions in costly incidents of diarrhea (Farber et al. 2006).
It is important to reinforce the idea that the replacement cost approach and cost avoidanceapproaches ascribe estimates of costs to notions of value, which may be an inherently flawedmeans of understanding the benefits derived from changes in natural resources. For example, the
cost of building an artificial reef may be wholly unrelated to the benefits derived from a naturalreef. Using the value of coastal real estate as a proxy for the value of reefs may lead analysts toconclude that degraded reefs adjacent to highly developed coastlines are worth more than healthyreefs where coastal development is limited. These methods should be only used with theappropriate cautions and caveats and should not be used in isolation (i.e. without considerationsof other benefits derived via alternative methodologies).
8/13/2019 CLME Marine Resource Valuation 2011 11 17
http://slidepdf.com/reader/full/clme-marine-resource-valuation-2011-11-17 14/61
7
2.1.4 The production function approach (productivity method)
The production function approach (PF), which is sometimes referred to as the productivity
method , links the impact of a change in environmental conditions to the provision of particulargoods or services by using a model describing the production relationship. The resulting changein the output of the good or service is then valued via other methods such as those described
above and below. For example, if commercial fishery yields can be modeled as a function ofmangrove acreage or reef quality, then changes in the quality or quantity of reefs or mangrovescan be valued using the market price method using estimates of their impact on fisheries output.Cartier et al. (1999) suggest that production function approaches should attempt to focus onvaluation of a limited number of locally important use values under different impact orconservation scenarios in order to provide insight into the relative scale of benefits as well as acomparative basis or benchmark for values that may be more difficult to measure or involvegreater uncertainty.
A potential obstacle in implementing the PF approach is the need for an integratedmultidisciplinary approach. Application of this method requires an appropriate understanding ofthe relationship between the environmental resource and the resulting impacts on the productionof the good or service of interest (WRI, 2009). In short, outputs from ecological models of bio- physical relationships are needed as inputs to economic valuation models. As noted in EPA(2009), indentifying the need for such collaborations amounts to identifying ecological processesthat produce responses that affect human well-being. Producing the outputs that are amenable tovaluation may involve an additional level of modeling or measurement that is beyond the typicalscope of analysis for researchers in a particular discipline, and may necessitate education of thegeneral public in terms of the importance of ecological change (EPA, 2009). Clearly, such effortsmust take place early in the valuation process. Despite this limitation, the PF approach holdsgreat promise for the valuation of a more complete range of ecosystem services.
2.2 Non-market approachesThe estimation of values that occur outside of markets or those that are only partially associatedwith markets (especially those associated with non-use), while much less known outside theeconomics profession, are facilitated by a variety of valuation techniques. A brief discussion ofthe more popular and practical techniques are presented below. For an in depth discussion on thefull range of methods and the history of non-market valuation, see Bockstael, McConnell, andStrand (1989), Bockstael, Hanemann, and Kling (1987) and Braden and Kolstad (1991).
2.2.1 Revealed preference methods
Revealed preference methods include the travel cost method (TCM) and hedonic pricing (HP).These methods examine decisions that individuals make regarding market goods that are usedtogether with non-market goods to reveal the value of the non-market good (Kahn, 1998), andrequire that a link be established between changes in the environmental resource and changes inthe observed behavior of people. For instance, changes in beach width or reef quality may resultin tourists moving to another location or taking fewer trips. With this information, a demand ormarginal willingness to pay (WTP) function can be estimated, which allows one to estimate thevalue of particular changes in the natural resource. The principle advantage of revealed preference methods is that resulting values are grounded in actual behavior and are therefore
8/13/2019 CLME Marine Resource Valuation 2011 11 17
http://slidepdf.com/reader/full/clme-marine-resource-valuation-2011-11-17 15/61
8
empirically defensible. However, these methods are not suitable for monetization of non-usevalues.
2.2.2 The Travel Cost Method
TCM, one of the most widely used revealed preference valuation techniques, uses information on
actual behavior to estimate a trip demand curve from which the value of the resource can bederived. This method is most commonly employed to value natural resources associated withrecreation, and can be applied to changes in the quality or quantity of environmental attributes atrecreation sites, changes in accessibility or number of sites and willingness to pay user fees(Birol et al., 2006).
A trip demand curve is estimated using visitation data, including travel costs and the number oftrips taken by each individual to a particular site. Using distance traveled as a proxy for the priceof a trip, and the number of trips as the quantity, individual or group demand curves can beestimated for a site or destination. The net benefits of a particular site or the value of theresources within each site can then be estimated. When modified for international travel, thismethod can be employed to value the flow of recreation services from tourist activities related to
the coastal and marine environment, though accuracy may be sacrificed with increased traveldistance (Abaza and Rietbergen-McCracken, 1998). The TCM has been used by governmentand non-government agencies alike around the world to value a wide variety of non-marketgoods and services, including ecotourism and wildlife viewing in Costa Rica (Menkhaus andLober 1996), diving in Honduras and Bonaire (Pendleton, 1994 and Pendleton, 1995), MPAtourism in Jamaica (Reid-Grant and Bhat, 2009) and reef tourism in Bermuda and Puerto Rico(Van Beukerin et al., 2009 and ETI, 2007).
Application of the TCM requires a detailed survey of individuals who travel to a particularlocation and use the associated resources. These data are typically acquired via surveyinstruments administered to travelers or recreationists. Travel log data reporting the dates and
frequency of travel by individuals or households are ideal, but can be costly. On-site, phone ormail data pertaining to a single travel experiences are often sufficient, but may limit valuation toconditions existing at the time of travel (Birol et al., 2006). Exit surveys administered by tourismoffices (e.g. CTO) often contain the variables appropriate for TCM estimation. Difficulties invaluation arise when the purpose for travel includes activities other than interaction with naturalresources, as travel expenses, the price surrogate, must be partitioned among multiple purposes.Treatment of the opportunity cost of time is an important issue and has received attention in theliterature (e.g. McConnel and Strand, 1981; Smith et al., 1983).
2.2.3 The Hedonic Pricing Method
The HP method recognizes that natural resource values will be reflected in the prices people pay
for composite goods such as housing. For example, housing prices along the coastline tend toexceed the prices of inland homes because beaches provide recreational and amenity values tocoastal property owners. Hence, when people buy a house, the price they pay not only reflectsthe materials that went into constructing that house, but also the number of bedrooms, squarefootage, whether there is a garage, neighborhood characteristics, and environmentalcharacteristics and amenities. By collecting data on house characteristics and associatedenvironmental attributes, the value of environmental amenities or changes in them can beestimated. Because this method relies on market real estate data, value results are highly
8/13/2019 CLME Marine Resource Valuation 2011 11 17
http://slidepdf.com/reader/full/clme-marine-resource-valuation-2011-11-17 16/61
9
defensible provided that associated environmental characteristics can be accurately quantifiedand have not undergone significant change since the time of housing transactions. Further, theHP method is limited to direct use values that easily be ascribed to real estate as perceived by thehousing consumer (Birol et al., 2006). Examples of the HP method applied in the CLME includevan Beukering et al. (2009) who estimate the contribution of reefs to the amenity value of real
estate in Bermuda.
2.3 Stated Preference Methods
Stated Preference Methods include the Contingent Valuation Method (CVM) and ChoiceModeling (CM, also referred to as Conjoint Analysis and Choice Experiments). While therevealed preference methods outlined above allow for the estimation of the value associated withrecreation activities and property, such analyses do not permit the estimation of changes invalues not associated with direct use (i.e. the non-use values described above). For example,tourists and residents may place value on the knowledge that the reef ecosystem and its wildlifeare preserved in a particular way. To elicit such values, stated preference methods must beemployed. CVM relies on direct survey questions to elicit values, while CM asks people to makehypothetical choices across bundles of goods or through ranking alternatives with “price” being
one alternative or characteristic in the bundle.
Both of these techniques are well-accepted methods for valuing non-market goods and servicesand have been used around the world. As early as 1994, the CVM method has been used in over1600 studies and 40 countries (Carson et al. 1994). The U.S. Department of Interior (DOI) hasadopted CVM to measure non-market values associated with damages under CERCLA 1980(DOI 1986), while NOAA has endorsed the use of this method for damage assessment under theOil Pollution Act of 1990 (Arrow et al. 1993).
2.3.1 The Contingent Valuation Method
The goal of CVM is to create a realistic, albeit hypothetical, market where peoples’ values for agood or service are expressed. A CVM survey constructed for deriving non-use values consistsof four main elements: a description of the program the respondent is asked to value or vote upon(e.g, a conservation project); a mechanism for eliciting value or choice (e.g., a simplereferendum type question that asks the respondent to vote “yes” or “no” to a specified price); a“payment vehicle” describing the manner in which the hypothetical payments are collected (e.g.,higher taxes or a payment into a trust fund); and information on respondent attitudes andcharacteristics (e.g., socioeconomic characteristics and environmental attitudes). This exercisecould be undertaken via an in-person or mail survey of residents and tourists to ascertain thevalue of a particular resource. CVM estimates are subject to numerous biases including strategic bias, hypothetical bias, starting point bias and information bias, which have made the method
controversial and the subject of great debate in the literature (see Portney, 1994). Because of theextensive pretesting and groundwork required to develop survey instruments that surmount thesedifficulties, the CVM method can be prohibitively expensive (Birol et al. 2006). Whitehead(2000) and Huber and Ruitenbeek (1997) provide excellent guidelines and best practices forvaluation via CVM. CVM is perhaps the widely used non-market valuation method in theCLME, with more than 20 applications detailed in this report.
8/13/2019 CLME Marine Resource Valuation 2011 11 17
http://slidepdf.com/reader/full/clme-marine-resource-valuation-2011-11-17 17/61
10
2.3.2 Choice Modeling (Choice Experiments)
While CVM can be a powerful and useful tool in deriving value estimates for natural resources, aCM approach may be more useful in terms of determining the value associated with factors thatcontribute to tourists’ destination choice (Forster et al. 2011) and as such may be moreappropriate for valuation of coastal and marine resources in the Caribbean. The CM approach is
increasingly gaining favor in the literature as it avoids many of the inherent biases associatedwith CVM and is more consistent with economic welfare theory than conjoint analysis (Hanleyet al, 2001a). Unlike other valuation methods, CEs allow multidimensional attribute changes to be valued simultaneously, and can be used to generate estimates of the relative value of multipleattributes (Huybers, 2004). The choice modeling approach can therefore be used to analyzetradeoffs that individuals are willing to make between environmental factors and as such can bean important tool in guiding the allocation of scarce conservation resources. Data for a CManalysis are obtained from a survey designed to elicit preferences by guiding the respondentthrough a series of paired choice alternatives, each described in terms of different levels ofattributes that comprise the product. On the basis of an experimental design, the descriptions ofthe alternatives vary across scenarios. By observing the changes in stated choices due to the
variation in the alternative’s characteristics, the effect of the attributes on the choices can bederived (Huybers, 2004).
2.4 Methods that rely on existing valuation estimates
2.4.1 The Benefits Transfer Approach
Developed for situations in which the costs of primary data collection for valuation are prohibitive, the benefits transfer approach spatially and/or temporally transfers summaryestimates of environmental benefit from other case studies (i.e., the study site) to the policy casestudy (i.e., the policy site) (Dumas et al. 2005). The two principle approaches to this practice are
benefit estimate transfer and benefit function transfer. The former directly applies summaryestimates of environmental benefits (e.g. estimates of WTP) from the study site to the policy site,while the latter applies an empirical model of benefits to the policy site (e.g. coefficient estimatesfrom a WTP model where independent variables include demographics and measures ofenvironmental quality). By allowing characteristics of the policy site to be substituted into anempirical function of value, benefit function transfer may allow for greater accuracy of transfer(Loomis, 1992). Necessary conditions for a valid benefit transfer include a theoretically andmethodologically valid application at the study site, similar population sizes and characteristicsin the study and policy sites, similarity between pre-policy and post-policy environmentalconditions at the sites, and similar distributions of property rights (Brouwer, 2000, Dumas et al.2005). Value is also dependent upon the availability of substitutes (Bockstael et al., 2000), which
often vary across sites. While this method provides a convenient and low-cost tool for valuation,when the study site is inappropriately matched to environmental or socioeconomic conditions atthe policy site, benefit transfer estimates are subject to error (Plummer, 2009). Because of thesignificant variation in ecosystem values across sites (Steiner, et al. 2004), this method should beused with caution.
8/13/2019 CLME Marine Resource Valuation 2011 11 17
http://slidepdf.com/reader/full/clme-marine-resource-valuation-2011-11-17 18/61
11
2.4.2 Meta analysis
Meta analysis is a method that synthesizes results from a collection of existing studies byregressing value estimates from similar studies on study and site characteristics (Woodward andWui, 2001). Dependent variables can include measures of the resource being valued, valuationmethod, time, and sample characteristics (Loomis and White, 1996). The advantage of this
method is the ability to empirically account for factors that cause variation in estimates of value(Smith and Kaoru, 1990). Fitted values can be generated and used as value estimates for the policy site by applying appropriate values of the independent variables.
2.4.3 Economic Impact Analysis
Related to valuation studies is the notion of economic impact analysis, which recognizes that thecontribution of market transactions to an economy may substantially larger than is revealed bythe market price method. For example, commercial fishery earnings serve to generate additionalrevenues, incomes and employment in national and regional economies. Hence, economic
impacts include the values associated with output and revenues that flow from a particularmarket transaction as a portion of each dollar spent by a consumer represents revenue earned by
someone else in the economy. As some of that generated income is used to purchase other goodsand services, each new dollar spent and earned ripples through numerous other businesses andhouseholds creating an “economic multiplier effect”. As only a portion of each dollar that isearned is spent, the amount of money from a particular transaction that continues on in thenational economy tends to get smaller. If the linkages between economic sectors are known orestimable, the total economic impact of earnings or spending in a particular market can beestimated. These impacts are commonly partitioned into direct effects, indirect effects andinduced effects. Direct effects are market contributions to the national economy, and aretypically measured by gross total revenues, total employment or gross incomes. Indirect effects
are impacts on the incomes and wages of the suppliers of inputs used in the industry in questionwhen those earnings are subsequently spent on other goods and services. Finally, induced effects
are the economic impacts of spending of generated income by households who are either directlyor indirectly employed in the industry. Indirect and induced effects taken together are oftenreferred to as value added effects (Fedler, 2010).
The estimation of these effects is typically facilitated by input-output models, which empiricallydelineate forward and backward linkages between a particular economic sector and the rest of theeconomy. These linkages form the basis for multipliers which measure the extent to which agiven economic activity (direct effect) propagates other economic activity (Schuhmann et al.,2010). Value added effects can be represented with a multiplier that converts direct expenditurestotal economic impact (Fedler, 2010). For example, if the estimated value added multiplier fortourism is 1.5, then each $1 of direct spending by tourists results in an additional $1.50 ofindirect and induced effects, for a total of $2.50 in economic impact. For more details on input-output analysis see Miller and Blair (1985). Economic impact analysis and the use of input-output models should not be considered a substitute for the calculation of total economic value oreconomic surplus, as net gains to market participants are not estimated, and non-market valuesare excluded (Hoagland, et al, 2005).
8/13/2019 CLME Marine Resource Valuation 2011 11 17
http://slidepdf.com/reader/full/clme-marine-resource-valuation-2011-11-17 19/61
12
2.5 Guiding valuation in the CLME: Appropriate methods for different
categories of values
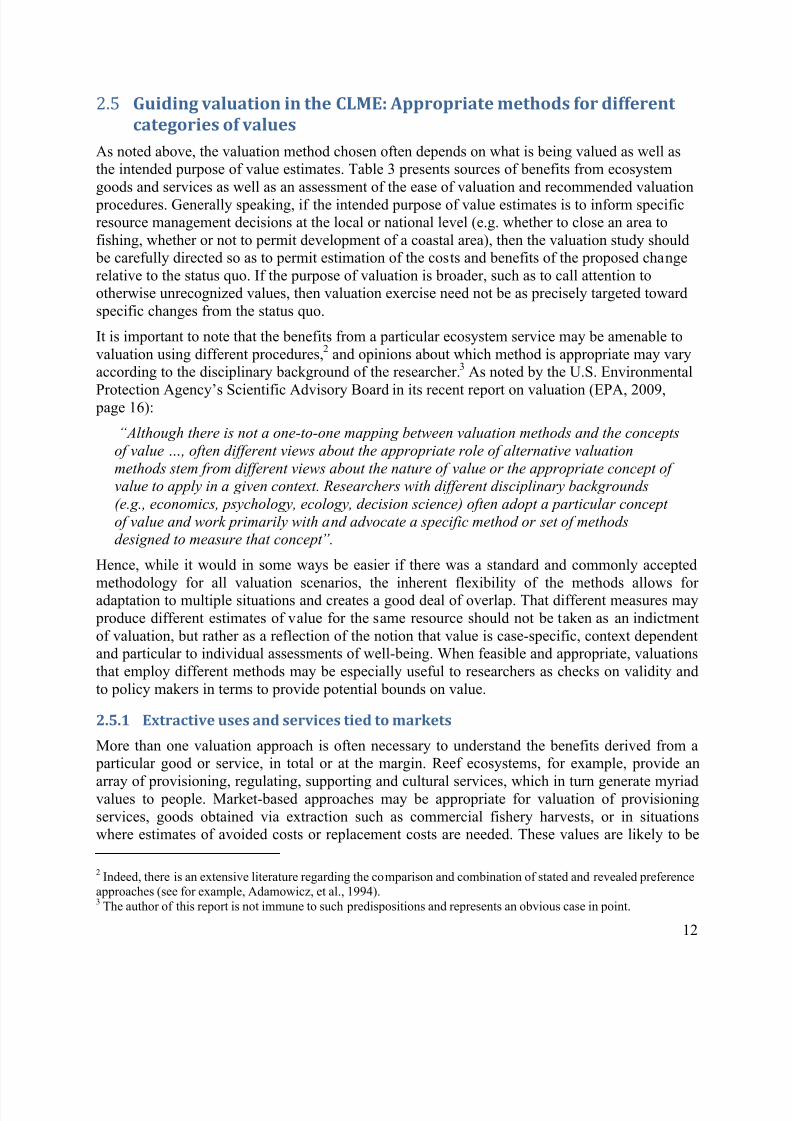
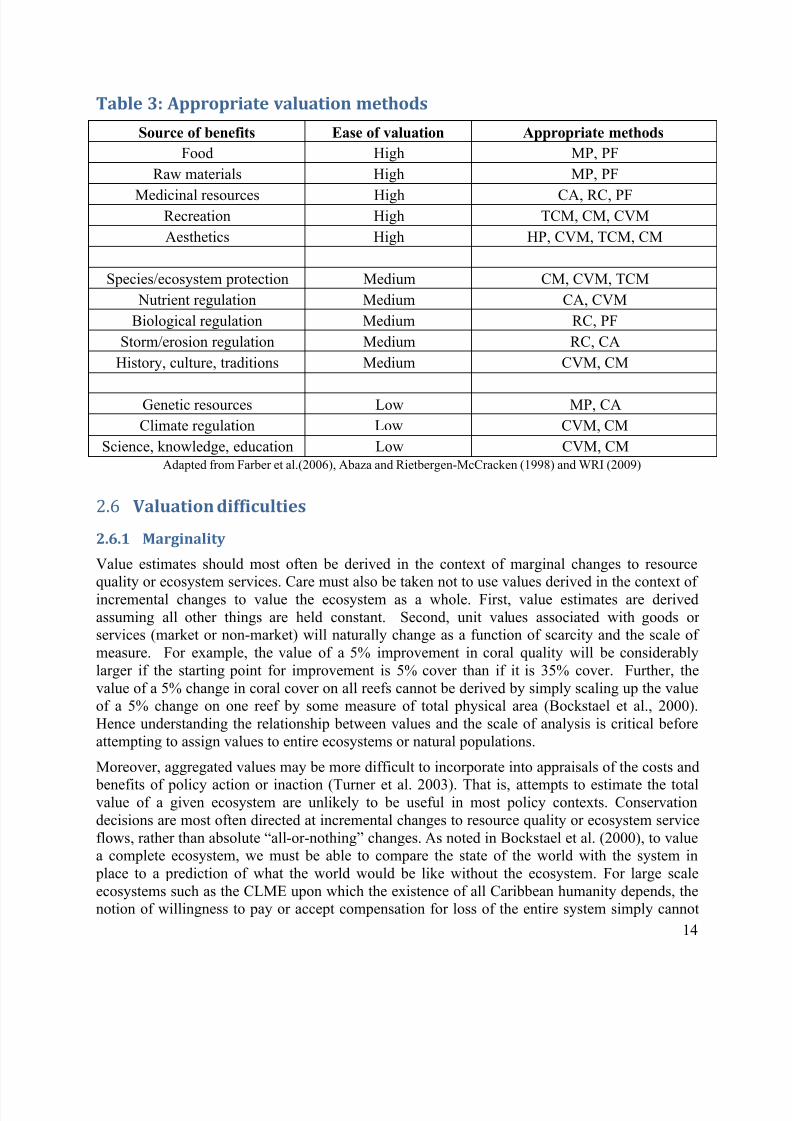
As noted above, the valuation method chosen often depends on what is being valued as well asthe intended purpose of value estimates. Table 3 presents sources of benefits from ecosystemgoods and services as well as an assessment of the ease of valuation and recommended valuation procedures. Generally speaking, if the intended purpose of value estimates is to inform specificresource management decisions at the local or national level (e.g. whether to close an area tofishing, whether or not to permit development of a coastal area), then the valuation study should be carefully directed so as to permit estimation of the costs and benefits of the proposed changerelative to the status quo. If the purpose of valuation is broader, such as to call attention tootherwise unrecognized values, then valuation exercise need not be as precisely targeted towardspecific changes from the status quo.
It is important to note that the benefits from a particular ecosystem service may be amenable tovaluation using different procedures,2 and opinions about which method is appropriate may varyaccording to the disciplinary background of the researcher.3 As noted by the U.S. Environmental
Protection Agency’s Scientific Advisory Board in its recent report on valuation (EPA, 2009, page 16):
“ Although there is not a one-to-one mapping between valuation methods and the concepts
of value … , often different views about the appropriate role of alternative valuation
methods stem from different views about the nature of value or the appropriate concept ofvalue to apply in a given context. Researchers with different disciplinary backgrounds
(e.g., economics, psychology, ecology, decision science) often adopt a particular concept
of value and work primarily with and advocate a specific method or set of methodsdesigned to measure that concept ”.
Hence, while it would in some ways be easier if there was a standard and commonly accepted
methodology for all valuation scenarios, the inherent flexibility of the methods allows foradaptation to multiple situations and creates a good deal of overlap. That different measures may produce different estimates of value for the same resource should not be taken as an indictmentof valuation, but rather as a reflection of the notion that value is case-specific, context dependentand particular to individual assessments of well-being. When feasible and appropriate, valuationsthat employ different methods may be especially useful to researchers as checks on validity andto policy makers in terms to provide potential bounds on value.
2.5.1 Extractive uses and services tied to markets
More than one valuation approach is often necessary to understand the benefits derived from a particular good or service, in total or at the margin. Reef ecosystems, for example, provide an
array of provisioning, regulating, supporting and cultural services, which in turn generate myriadvalues to people. Market-based approaches may be appropriate for valuation of provisioningservices, goods obtained via extraction such as commercial fishery harvests, or in situationswhere estimates of avoided costs or replacement costs are needed. These values are likely to be
2 Indeed, there is an extensive literature regarding the comparison and combination of stated and revealed preferenceapproaches (see for example, Adamowicz, et al., 1994).3 The author of this report is not immune to such predispositions and represents an obvious case in point.
8/13/2019 CLME Marine Resource Valuation 2011 11 17
http://slidepdf.com/reader/full/clme-marine-resource-valuation-2011-11-17 20/61
13
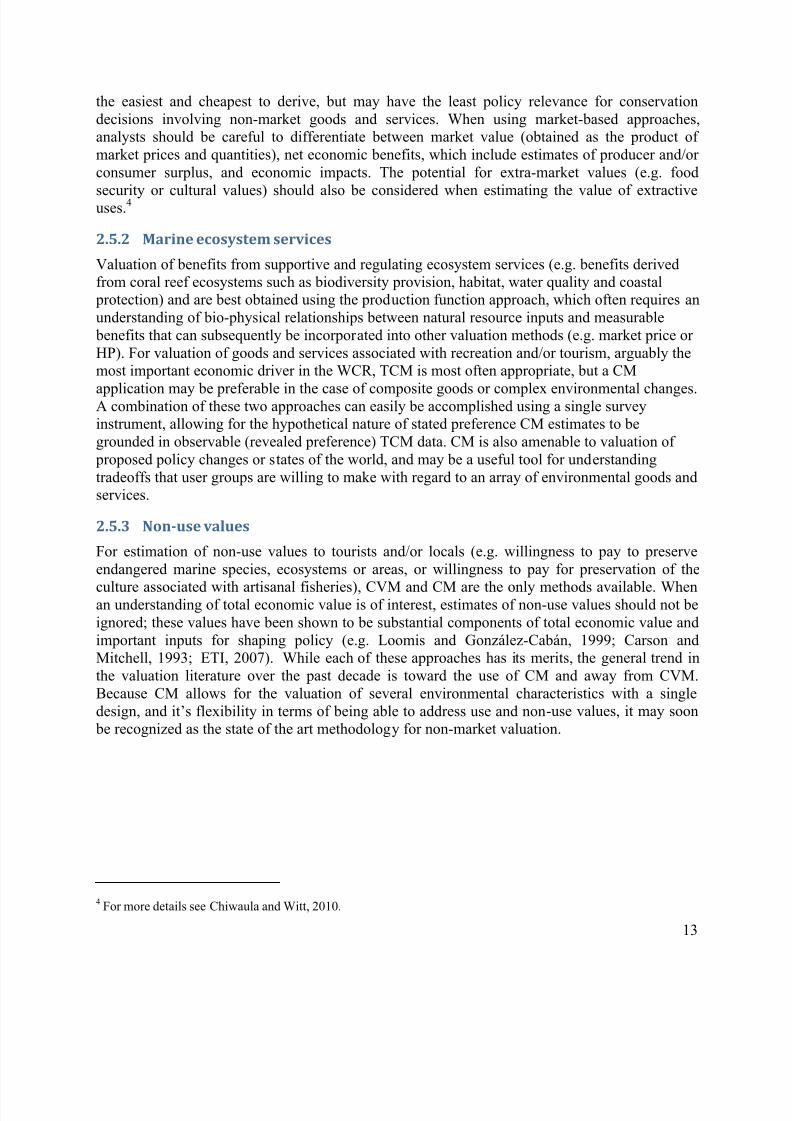
the easiest and cheapest to derive, but may have the least policy relevance for conservationdecisions involving non-market goods and services. When using market-based approaches,analysts should be careful to differentiate between market value (obtained as the product ofmarket prices and quantities), net economic benefits, which include estimates of producer and/orconsumer surplus, and economic impacts. The potential for extra-market values (e.g. food
security or cultural values) should also be considered when estimating the value of extractiveuses.4
2.5.2 Marine ecosystem services
Valuation of benefits from supportive and regulating ecosystem services (e.g. benefits derivedfrom coral reef ecosystems such as biodiversity provision, habitat, water quality and coastal protection) and are best obtained using the production function approach, which often requires anunderstanding of bio-physical relationships between natural resource inputs and measurable benefits that can subsequently be incorporated into other valuation methods (e.g. market price orHP). For valuation of goods and services associated with recreation and/or tourism, arguably themost important economic driver in the WCR, TCM is most often appropriate, but a CM
application may be preferable in the case of composite goods or complex environmental changes.A combination of these two approaches can easily be accomplished using a single surveyinstrument, allowing for the hypothetical nature of stated preference CM estimates to begrounded in observable (revealed preference) TCM data. CM is also amenable to valuation of proposed policy changes or states of the world, and may be a useful tool for understandingtradeoffs that user groups are willing to make with regard to an array of environmental goods andservices.
2.5.3 Non-use values
For estimation of non-use values to tourists and/or locals (e.g. willingness to pay to preserveendangered marine species, ecosystems or areas, or willingness to pay for preservation of the
culture associated with artisanal fisheries), CVM and CM are the only methods available. Whenan understanding of total economic value is of interest, estimates of non-use values should not beignored; these values have been shown to be substantial components of total economic value andimportant inputs for shaping policy (e.g. Loomis and González-Cabán, 1999; Carson andMitchell, 1993; ETI, 2007). While each of these approaches has its merits, the general trend inthe valuation literature over the past decade is toward the use of CM and away from CVM.Because CM allows for the valuation of several environmental characteristics with a singledesign, and it’s flexibility in terms of being able to address use and non -use values, it may soon be recognized as the state of the art methodology for non-market valuation.
4 For more details see Chiwaula and Witt, 2010.
8/13/2019 CLME Marine Resource Valuation 2011 11 17
http://slidepdf.com/reader/full/clme-marine-resource-valuation-2011-11-17 21/61
14
Table 3: Appropriate valuation methods
Source of benefits Ease of valuation Appropriate methods
Food High MP, PF
Raw materials High MP, PF
Medicinal resources High CA, RC, PFRecreation High TCM, CM, CVM
Aesthetics High HP, CVM, TCM, CM
Species/ecosystem protection Medium CM, CVM, TCM
Nutrient regulation Medium CA, CVM
Biological regulation Medium RC, PF
Storm/erosion regulation Medium RC, CA
History, culture, traditions Medium CVM, CM
Genetic resources Low MP, CA
Climate regulation Low CVM, CM
Science, knowledge, education Low CVM, CMAdapted from Farber et al.(2006), Abaza and Rietbergen-McCracken (1998) and WRI (2009)
2.6 Valuation difficulties
2.6.1 Marginality
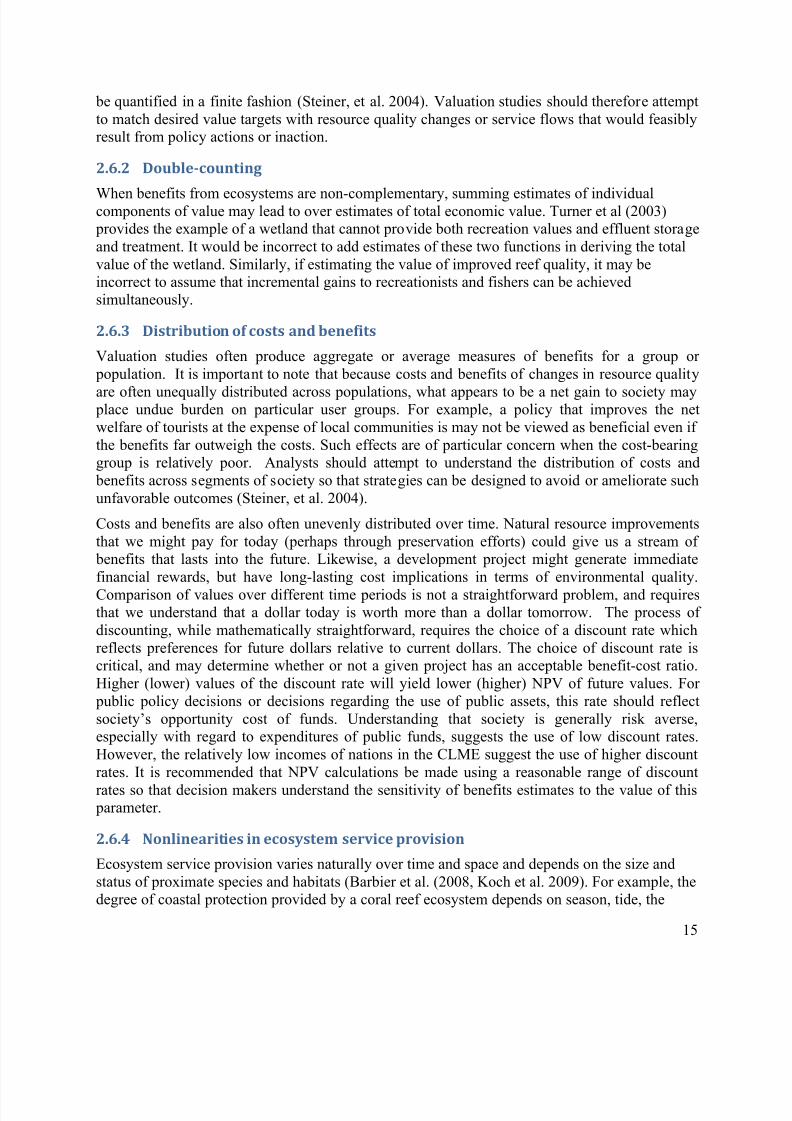
Value estimates should most often be derived in the context of marginal changes to resource
quality or ecosystem services. Care must also be taken not to use values derived in the context ofincremental changes to value the ecosystem as a whole. First, value estimates are derivedassuming all other things are held constant. Second, unit values associated with goods orservices (market or non-market) will naturally change as a function of scarcity and the scale ofmeasure. For example, the value of a 5% improvement in coral quality will be considerablylarger if the starting point for improvement is 5% cover than if it is 35% cover. Further, thevalue of a 5% change in coral cover on all reefs cannot be derived by simply scaling up the valueof a 5% change on one reef by some measure of total physical area (Bockstael et al., 2000).Hence understanding the relationship between values and the scale of analysis is critical beforeattempting to assign values to entire ecosystems or natural populations.
Moreover, aggregated values may be more difficult to incorporate into appraisals of the costs and
benefits of policy action or inaction (Turner et al. 2003). That is, attempts to estimate the totalvalue of a given ecosystem are unlikely to be useful in most policy contexts. Conservationdecisions are most often directed at incremental changes to resource quality or ecosystem serviceflows, rather than absolute “all-or-nothing” changes. As noted in Bockstael et al. (2000), to valuea complete ecosystem, we must be able to compare the state of the world with the system in place to a prediction of what the world would be like without the ecosystem. For large scaleecosystems such as the CLME upon which the existence of all Caribbean humanity depends, thenotion of willingness to pay or accept compensation for loss of the entire system simply cannot
8/13/2019 CLME Marine Resource Valuation 2011 11 17
http://slidepdf.com/reader/full/clme-marine-resource-valuation-2011-11-17 22/61
15
be quantified in a finite fashion (Steiner, et al. 2004). Valuation studies should therefore attemptto match desired value targets with resource quality changes or service flows that would feasiblyresult from policy actions or inaction.
2.6.2 Double-counting
When benefits from ecosystems are non-complementary, summing estimates of individualcomponents of value may lead to over estimates of total economic value. Turner et al (2003) provides the example of a wetland that cannot provide both recreation values and effluent storageand treatment. It would be incorrect to add estimates of these two functions in deriving the totalvalue of the wetland. Similarly, if estimating the value of improved reef quality, it may beincorrect to assume that incremental gains to recreationists and fishers can be achievedsimultaneously.
2.6.3 Distribution of costs and benefits
Valuation studies often produce aggregate or average measures of benefits for a group or population. It is important to note that because costs and benefits of changes in resource quality
are often unequally distributed across populations, what appears to be a net gain to society may place undue burden on particular user groups. For example, a policy that improves the netwelfare of tourists at the expense of local communities is may not be viewed as beneficial even ifthe benefits far outweigh the costs. Such effects are of particular concern when the cost-bearinggroup is relatively poor. Analysts should attempt to understand the distribution of costs and benefits across segments of society so that strategies can be designed to avoid or ameliorate suchunfavorable outcomes (Steiner, et al. 2004).
Costs and benefits are also often unevenly distributed over time. Natural resource improvementsthat we might pay for today (perhaps through preservation efforts) could give us a stream of benefits that lasts into the future. Likewise, a development project might generate immediatefinancial rewards, but have long-lasting cost implications in terms of environmental quality.
Comparison of values over different time periods is not a straightforward problem, and requiresthat we understand that a dollar today is worth more than a dollar tomorrow. The process ofdiscounting, while mathematically straightforward, requires the choice of a discount rate whichreflects preferences for future dollars relative to current dollars. The choice of discount rate iscritical, and may determine whether or not a given project has an acceptable benefit-cost ratio.Higher (lower) values of the discount rate will yield lower (higher) NPV of future values. For public policy decisions or decisions regarding the use of public assets, this rate should reflectsociety’s opportunity cost of funds. Understanding that society is generally risk averse,especially with regard to expenditures of public funds, suggests the use of low discount rates.However, the relatively low incomes of nations in the CLME suggest the use of higher discountrates. It is recommended that NPV calculations be made using a reasonable range of discount
rates so that decision makers understand the sensitivity of benefits estimates to the value of this parameter.
2.6.4 Nonlinearities in ecosystem service provision
Ecosystem service provision varies naturally over time and space and depends on the size andstatus of proximate species and habitats (Barbier et al. (2008, Koch et al. 2009). For example, thedegree of coastal protection provided by a coral reef ecosystem depends on season, tide, the
8/13/2019 CLME Marine Resource Valuation 2011 11 17
http://slidepdf.com/reader/full/clme-marine-resource-valuation-2011-11-17 23/61
16
extent and composition of the reef, as well as the presence or absence of other near shore habitatssuch as mangroves and sea grass beds. Such nonlinearities in the provision of ecosystem servicesmay result in inappropriate estimates of value if services are assumed to be linear or static. Assuch, attempts to value ecosystem services should incorporate such nonlinear relationships may be flawed, resulting in inappropriate management actions. Koch et al. (2009) provide important
discussion of this issue and associated recommendations for valuation in the context ofecosystem-based management.
2.6.5 Aggregation
One of the main issues inherent in economic valuation studies is aggregating individual measuresof value or willingness to pay (WTP) to the level of a population. In order to aggregate, severalissues must be confronted, including defining the relevant population for the good (i.e. who hasstanding) and determining what measure of value to apply to that population (e.g. mean,median). The former issue is clouded by the notion of non-use values, which may apply toanyone, regardless of the physical location of the resource.
In the case of commercial and recreational uses of natural resources, it is common to apply and
individual benefit measure to an estimate of the relevant population (e.g. number of fishers ordivers). While straightforward, this type of summation ignores any changes in participation thatoccur due to marginal changes in the quality of the resource being valued. For example, if weestimate that a 10% increase in stock size will increase commercial fisher revenues by$1,000/year and there are 100 fishers, we might surmise that aggregate gains are $100,000, butthis ignores the changes in effort that may be induced by the 10% increase in stock size. Toaccount for changes in use, participation functions can be estimated (e.g. Bockstael et al. 1987,Parsons and Kealy 1995, Schuhmann and Easley 2000). Simple multiplication of individualestimates of value by population estimates also ignores the notion that individual values arelikely a function of geographic distance from the resource. To account for such effects, themathematical relationship between distance and value (so called “distance-decay functions”) can
be estimated (e.g. Hanley et al. 2003). Such functions may be useful in determining the relevant population (i.e. at what distance does value reach zero?) but may not be applicable to non-usevalues (Hanley et al. 2003).
It is also important to note that because individual values are highly dependent on the relativescarcity of the resource and availability of substitutes for the resource, distance decayrelationships may not transfer to other areas or other resources within an area. In other words, because value is largely context-specific (Turner et al., 2003), our ability to aggregate site-specific resource values geographical and cultural space is limited, and many value estimateswill not be amenable to reasonable aggregation from local to regional scales (Jin et al., 2003).
3 Review of marine valuation studies in the Caribbean
3.1 Overview
While the extant valuation literature contains analysis of most of the world’s ecosystems andnumerous species, applications to aquatic and marine goods and services have garnered the leastattention (Turner et al., 2003). Because valuation studies are costly, time consuming and oftenrequire advanced econometric skills and training, valuation is more commonly applied in the
8/13/2019 CLME Marine Resource Valuation 2011 11 17
http://slidepdf.com/reader/full/clme-marine-resource-valuation-2011-11-17 24/61
17
setting of industrialized nations. Marine resource valuations in the Caribbean tend to focus onmore obvious and measurable benefits, primarily those derived from coastal and reef ecosystemsas associated with marine protected areas, recreation and tourism. Analyses of benefits from pelagic and continental shelf ecosystems are much less apparent in the literature. This is perhapsdue to a perceived disconnect between these offshore systems and tourism, but is also no doubt
in part due to the relative dearth of scientific knowledge of these systems and the consequentempirical difficulties associated with monetizing their benefits to people. Notable exceptions tothis generalization include estimates of the commercial (market) value of pelagic and deepwaterfisheries, which are readily available for most countries from FAO and/or national fisheriesoffices, and a select few studies that examine economic values associated with offshore billfishing and whale watching. Information regarding the economics of mineral deposits andenergy resources of continental shelf is available (e.g. U.N., 2004), but is not specific to theCaribbean Sea. Attempts to value benefits from the supportive and regulating ecosystem servicesof offshore ecosystems of the Caribbean Sea or benefits from genetic materials contained inthese ecosystems appear to be nonexistent.
In terms of nations within the Caribbean Region, Jamaica has received the most attention by
resource economists, and is essentially in a league of its own with regard to the both number and breadth of valuation studies. Much of this work was conducted as part of a World Bank projectin the late 1990s, and includes estimates of the economic value of Montego Bay coral reefsassociated with coastal protection, artisanal fisheries and tourism/recreation (Gustavson, 1998),non-use benefits of the Montego Bay Marine Park (Spash et al., 1998), and the NPV of biodiversity for marine bioprospecting (Ruitenbeek and Cartier, 1999). Bonaire and Curacaohave each been the setting for numerous valuation studies, the majority of which are in thecontext of reefs within MPAs. Barbados, Belize, Costa Rica, St. Lucia and Tobago also have been the setting for multiple valuation studies, many of them in recent years. Counts of existingvalue estimates in each Caribbean nation are listed in Table 4, categorized by type of value.
3.2 Replicable applications in the Caribbean
While there have been a few attempts to value region-wide ecosystem services (e.g. Cesar et al.,2003 estimate the NPV of coral reefs from fisheries, coastal protection, tourism/recreation and biodiversity), WRI’s Coastal Capital series and OAS’s Reefix (based in part on a methodologydeveloped by WRI) represent the only attempts to apply common methodologies to numerouscountries in the Caribbean. Like numerous other valuation studies in the Caribbean, these effortsemploy methodologies that do not require a great deal of primary data collection (e.g. benefitstransfer) or are based on convenience sampling schemes. By relying on secondary data andrelatively non-technical methods, these approaches provide a replicable and low-cost approach tovaluation. Coupling these characteristics with precedence in the region, these approaches may be
more amenable to acceptance and implementation by policy makers in the CLME. As noted inthe UNDP status report on Biodiversity and Ecosystems in Latin America and the Caribbean(2010):
“… past studies have shown limited transferable messages that are all too often site
specific and use numerous valuation methodologies. That no common framework foreconomic valuation exists hinders its uptake by political leaders.”
8/13/2019 CLME Marine Resource Valuation 2011 11 17
http://slidepdf.com/reader/full/clme-marine-resource-valuation-2011-11-17 25/61
18
While this perspective has merit, it should also be recognized that these relatively low-costmethodologies are not conventional approaches to valuation in the sense of understandingwillingness-to-pay or economic gains associated with incremental changes in resource quality orecosystem service flows. This is not to say that they do not provide important contributions tothe body of knowledge, or that attempts to incorporate the gross market value of natural
resources into national accounts are unfounded. Indeed, lack of recognition by policy makers ofthe economic value of natural assets most certainly leads to inefficient resource allocationsleaving society worse off (TEEB 2009). Estimation of market or near-market values can form a powerful case for conservation (Turner et al, 2003). WRI’s Coastal Capital series hasundoubtedly done more than any other single effort in this regard, by calling attention to previously unrecognized economic values associated with coastal and marine resources in theCaribbean.
Yet, the desire to adopt common and transferrable methodologies ignores many importantaspects of valuation, including the need to address different components of economic value withdifferent approaches, the inherently case-specific nature of natural resource value and the realityof marginal resource change. Moreover, that these methods necessarily rely on secondary market
data virtually ensures that the significant components of value associated with non-market usesand passive uses will be omitted and potentially ignored. In short, while “one-size-fits-all”approaches to valuation are likely to send important signals regarding the economic importanceof natural resources, they may grossly underestimate true economic value and may not besufficient for informing policy.
There is ample evidence to support these notions. Numerous studies have successfully appliedmultiple methodologies to a single ecosystem (e.g. Cabrera, et al. 1998 for mangroves inMexico; Cartier and Ruitenbeek, 1999 and Gustavson, 1998 for reefs in Montego Bay, Jamaica;ETI, 2007 for reefs in Puerto Rico; van Beukering et al. 2009 for reefs in Bermuda). These largemulti-disciplinary efforts generate a holistic perspective on the value of ecosystems, as well asthe relative sizes of different elements of economic value. Pointing to the case-specific nature ofvalue, tourism and recreation values appear to exceed those associated with coastal protection byup to a factor of 10 in Jamaica (Cartier and Ruitenbeek, 1999), but may be 100 times greater inPuerto Rico (ETI, 2007), while Cesar et al. (2003), report average coastal protection and tourismvalues that are approximately equivalent for the region as a whole.
3.3 Tourism and marine resources
Tourism in the Caribbean accounts for significant shares of national GDPs, employment andforeign exchange (Tsounta, 2008, Griffith, 2009). Total visitor arrivals have exceeded 42million in recent years (CTO, 2009).5 Annual visitor spending is estimated to be in excess of US$27 billion (Griffith, 2009). Based on tourism’s total share of GDP, capital investment and total
exports, the Caribbean is the most tourism-dependent region in the world (WTTC, 2011). Numerous studies analyze the complex relationships between tourism, natural resources andCaribbean economies (e.g. Holder, 1988; Beekhuis, 1981; Burke and Maidens, 2004). One couldrealistically argue that nearly all economic analyses and valuation studies in the Caribbean are atleast indirectly related to tourism. Because tourism is the principle economic driver in the
55 Comprised of roughly half stay-over and half cruise ship arrivals.
8/13/2019 CLME Marine Resource Valuation 2011 11 17
http://slidepdf.com/reader/full/clme-marine-resource-valuation-2011-11-17 26/61
19
Caribbean, it is not surprising that many valuation studies relying on primary data use tourists astheir subjects.
Carr and Heyman (2009) provide an excellent overview as well as a wealth of detailedinformation on numerous economic statistics associated with tourism, commercial fisheries andmarine resources (including reefs and MPAs) in Antigua and Barbuda, Jamaica and the
Caribbean region as a whole. Based on a comparison of tourism and commercial fisheries inAntigua and Barbuda relative to Jamaica and other OECS member states, the authors concludethat Antigua and Barbuda is at a crossroads, in danger of overexploiting its marine resources, particularly its fish and coral reef communities.
Dixon et al. (2001) provide an overview of issues related to sustainable use of environmentalresources in the context of tourism, as well as opportunities and threats related to tourism and theenvironment. The authors suggest incentive-based policy actions to generate revenues that can bedirected toward conservation, including capturing economic rents via user fees, taxation andinvestment incentives. Specifically, the authors recommend modest taxation of tourists via acombination of indirect taxes on goods used primarily by tourists (e.g. hotel services) and entryor departure levies. They note that such taxes may be the most effective means of rent capture provided that tourists understand that the purpose of these levies is for environmental preservation. Protected areas entrance fees are also recommended as a source of incomegeneration and means of limiting potential over-use.
Uyarra (2002) and Uyarra et al. (2005) use principle components analysis to establish empiricallinks between environmental quality and tourism. Based on a convenience sample of 316 touristsin Bonaire and 338 tourists in Barbados, the authors illustrate the correlation between 16environmental attributes and holiday destination choice. The willingness of tourists to return tothe destination at the same price and lower levels of environmental quality is also measured, andused to suggest the potential impact of climate change on tourism. The authors find that allenvironmental attributes had positive effects on holiday enjoyment. Tourists in Bonaire have
stronger preferences for marine environmental quality while tourists in Barbados tend to havestronger preferences for terrestrial environmental features, especially those relating to beaches. Notable exceptions include the higher importance of clear water and the presence of sea turtles inBarbados relative to Bonaire. A large majority (80%) of respondents indicated that they would be unwilling to return for the same price if the quality of their preferred environmental featureswere diminished (via coral bleaching in Bonaire and diminished beach size in Barbados),suggesting potentially devastating economic impacts from climate change.6
3.4 Valuations of the Coral Reef Ecosystem
In the area of coastal and marine resource valuation, beaches and reefs have received the most
attention to date. Brander et al. (2006) provides an overview and meta-analysis employing 166worldwide reef valuation studies. Chong et al. (2003) conduct a meta analysis using 25 reefvaluation studies covering 20 sites and 7 countries in the Caribbean. Cesar (2000) and Gustavsonet al. (2000) provide collections of articles on coral reef valuation. Conservation International.
6 Details of the survey methodology are not provided by the authors, and it is questionable whether this work is based on a random sample and therefore representative of the true tourist populations. It appears that scuba diversand tourists from the U.K. are over-represented in Barbados sub-sample.
8/13/2019 CLME Marine Resource Valuation 2011 11 17
http://slidepdf.com/reader/full/clme-marine-resource-valuation-2011-11-17 27/61
20
(2008) provides a global compilation of values for reefs (as well as mangroves and seagrasses)including several summaries from the Caribbean.
Vergara et al. (2008) investigate the economic consequences of coral mortality in the Caribbeandue to the effects of warm seas and severe high-temperature episodes that may result fromclimate change. Specifically, assuming a temperature increase of 2ºC as a response to a doubling
of CO2 concentration over pre-industrial levels, the authors estimate economic losses associatedwith 50 percent coral reef mortality by 2040 and 90 percent mortality by 2060. Presumably using benefits transfer from estimated global reef values, direct economic losses associated withfisheries, tourism activity, coastal protection and pharmaceutical uses are estimated to be between US$4.83 billion and US$6.6 billion for 50% coral mortality and between US$ 8.68 billion and 11.98 billion for 90% mortality. Notably, the loss of pharmaceutical values comprises between 55 and 75% of estimated losses, suggesting that reef value estimates were likelytransferred from less tourism-dependent areas.
3.4.1 Estimates of multiple values from reef ecosystems
As noted in section 2.6.1 above, value estimates should be derived in the context of marginal
changes to resource quality or ecosystem services, and are derived holding other factors andchanges constant. Valuations typically only produce estimates for the most readily observed ormeasured components of human well being. Hence, estimates of the “total economic value” ofecosystems are likely mislabeled. Declarations of total value may carry considerable weight andgarner attention, hence their use, while rare, is understandable. Several studies use multiplemethodologies to estimate different components of total economic value.
Cesar et al. (2003) employs benefits transfer from applications of the market price method andcost-avoidance methods (principally Burke et al., 2002) to estimate annual net benefit streamsand net present value (NPV) of coral reefs from fisheries, coastal protection, tourism/recreationand biodiversity in the Caribbean Region. The 19,000 km2 of reefs in the Caribbean are reported
to provide annual net benefits of US$391 million from fisheries, US$720 million from coastal protection, US$663 million from tourism/recreation and US$79 million from biodiversity value,for total annual net benefits of US$1.85 billion, or a net present value of US$49.5 billion(assuming a 3% discount rate).7
Ruitenbeek and Cartier (1999), Gustavson (1998) and Gustavson (2002) report estimates of thenet present value (NPV) of coral reefs to tourism and recreation, fisheries, coastal protection and bioprospecting in Montego Bay, Jamaica. Readily identified direct local uses of the reef (nearshore fisheries and tourism services) were valued using PF approaches, whereby costs ofoperations are subtracted from total revenues taken in through the use of the coral reefs.8 NPVestimates for tourism in Montego Bay ranged from US$210 million to US$630 million,depending on the discount rate. The estimated NPV for nearshore fisheries is US$1.31 million.
The value of coral reefs for coastal protection was estimated by calculating the total value of landand property that is at risk to loss from erosion along the shoreline within the bounds of the
7 The reliability of these estimates is difficult to ascertain due to the lack of detail provided in this report or in thereferenced report.8 Similar to a market price approach, the resulting values can be considered an estimate of producer surplus or netgains to service providers.
8/13/2019 CLME Marine Resource Valuation 2011 11 17
http://slidepdf.com/reader/full/clme-marine-resource-valuation-2011-11-17 28/61
21
Montego Bay Marine Park. The NPV of this land and property that is assumed to be protected bythe reef is estimated to be US$65 million. Summing these three values yields a total NPV ofUS$381 million, or US$8.93 million per hectare of reef. Non-use values associated with the reefare also estimated using CVM.9 The estimated NPV of the (reef) biodiversity in Montego BayMarine Park is estimated to be US$13.6 million to tourists and US$6.0 million to residents.
Pharmaceutical bioprospecting values are estimated using cost estimates, discovery hit rates andend-use values. Marine bioprospecting values are estimated to be approximately $70 million forthe Montego Bay reefs, of which roughly $7 million in value could be captured via royaltyregimes or rental agreements.10
Using similar methods (as part of WRIs Coastal Capital Project) Burke et al. (2008a) and Cooperet al. (2009) use the MP approach to estimate the economic value of reef ecosystems to fisheriesand tourism in Tobago, St. Lucia and Belize11 and apply the CA approach to value coastal protection services. In Tobago, where the authors assume that 40% of tourist visits areattributable to coral reefs, 2006 direct economic impacts from visitor spending are estimated to be US$43.5 million, with an additional indirect impacts of US$58 to US$86 million. In St. Lucia,25% of tourist visits are assumed to be attributed to reefs, generating US$91.6 million in direct
effects and US$68 to US$102 million in indirect effects. The total direct economic impact fromreef and mangrove associated tourism in Belize is estimated to be between approximatelyUS$150 and US$196 million.12 Revenues from reef (and mangrove) associated fisheries production and processing are estimated to be between US$14.2 and US$15.9 million per year inBelize, with over 70% attributable to exports. Economic impacts from reef fisheries in Tobagoand St. Lucia are considerably smaller, estimated to be between US$ 0.7 and US$1.1 million forTobago and between US$0.4 and US$0.7 million for St. Lucia. The estimated value of coastalreal estate that is protected by coral reefs is estimated to be between US$18 and US$33 millionin Tobago, between US$28 and US$50 million in St. Lucia, and between US$120 and US$180million in Belize.
Carleton and Lawrence (2005) attempt to estimate values associated with environmental resourceservices in the Turks and Caicos, including the amount of tourist spending attributable to coralreefs, fisheries values from reefs and the value of coral reefs for coastal erosion protection. Thevalue of coral reef biodiversity is estimated at $4.7 million per year, reef contribution to coastal protection is valued at $16.9 million per year, and reef fisheries are valued at $3.7 million peryear. Diving on coral reefs is estimated to be worth $8.3 million per year and other forms oftourism supported by reefs are estimated to be worth at least $9.8 million per year in Gross ValueAdded and consumer surplus. Total value of reefs in TCI is estimated to be $47.3 million peryear, of which $17.7 million per year contributes directly into GDP.13
9
The CVM survey was administered to a sample of 1058 locals and tourists. Average WTP for coral reefimprovement is reported as US$3.24 per person.10 Bioprospecting values are estimated to be $7,775 per species, or $2600 per sample with a typical success rate of 1in 30,000 samples. These estimates translate to $530,000/ha or $225,000/% coral abundance.11 In Belize the valuation pertains to both reef and mangrove ecosystems.12 The authors suggest that additional indirect impacts may be between US$26 and US$69 million per year.13 While this work contains some excellent discussion regarding the importance of valuation, the valuationmethodologies employed differ markedly from accepted practices and appear to be based largely on unjustified
8/13/2019 CLME Marine Resource Valuation 2011 11 17
http://slidepdf.com/reader/full/clme-marine-resource-valuation-2011-11-17 29/61
22
3.4.2 Reef recreation and tourism not specific to MPAs
While the majority of valuation studies related to reef-based recreation in the Caribbean pertainto recreation that takes place in marine protected areas, there are a few general reef recreationstudies that warrant mention. A review by Brader et al (2006) shows that the world average valueof coral reef recreation is $US 184.00 per visit (2000 dollars), with considerable variation across
location, method and goods and services. Coral reef recreation in the Caribbean has the highestmean value of all areas analyzed, roughly US$400.00 per visit. Of all recreational activitiesanalyzed, diving and snorkeling produce the highest values, typically over $200 depending onlocation. Although this level of detail is not provided by the authors, we can infer that diving andsnorkeling on reefs in the Caribbean will produce significantly large economic values.
3.4.2.1 Scuba diving and snorkeling
Divers’ willingness to pay for coral quality improvements in Barbados estimated by Schuhmannet al (2011) range from US$29 to US$195, depending on the baseline level of quality. Thesevalues are strikingly similar to those found by Parsons and Thur (2008) who valued changes incoral cover in Bonaire National Marine Park. In this latter study, potential aggregate annual
losses from degradations in coral quality are estimated to range from US$0.8 million to $5.2million per year, which is equivalent to a NPV of losses ranging from US$27 million to $173.4million. Casey et al. (2010) estimated the willingness of tourists in the Riviera Maya tocontribute to a coral trust. Schuhmann et al (2011) show that divers’ willingness to pay for high
levels of coral cover may be as high as US$195 per two-tank dive.
Beharry-Borg and Scarpa (2010) use a CM approach to estimate Willingness to pay for coastaland marine attributes by snorkelers and non-snorkelers in Tobago. Attributes in the CM includewater quality (chance of ear infection), water clarity (vertical visibility), coastline development,marine protected areas, fish abundance, coral cover, beach litter (plastics) and number of boats.Snorkelers are willing to pay up to $35.00 per trip for high fish diversity (up to 60 fishes), up to
$50.00 for high coral cover (45%), $40.00 for vertical visibility up to 10 meters, and 22.00 forwater quality that allows for a low chance of an ear infection. A high degree of heterogeneity in preferences and WTP is discovered across and between groups.
3.4.2.2 General reef-based tourism and recreation
van Beukering et al. (2009) and Bermuda Department of Conservation Services (2009) estimatethe value of reef-associated tourism in Bermuda using data from a reef-associated touristoperator survey (revenue data) and a tourist exit survey which assessed the importance of coralreefs to the visitation experience. Tourist exit survey data supported an application of the TCMto estimate consumer surplus, while reef operator data was used to estimate producer surplus viathe net factor income method.14 CVM was also applied to estimate WTP for coral reef
conservation. Separate results are provided for cruise ship and air tourism. In addition to value
assumptions. For example, coastal protection values are estimated using assumptions about erosion rates and potential damage from hurricanes, absent any details regarding the underlying scientific basis. Land and propertyvalues are derived from real estate magazines, presumably from listing prices which likely overstate true marketvalues. R eef values associated with tourism are estimated using assumptions about the percentage of visitors’
motivations that are attributable to reefs, which is based on the number of reef pictures in advertisements.14 Similar to the market price method, costs of production were subtracted from reported tourism expenditures.
8/13/2019 CLME Marine Resource Valuation 2011 11 17
http://slidepdf.com/reader/full/clme-marine-resource-valuation-2011-11-17 30/61
23
estimates, the authors report that 68% of all tourists reported being willing to pay additionalfunds to support activities that preserve Bermuda’s coral reefs. The average cruise ship tourist iswilling to pay US$28 per visit to Bermuda and the average airplane tourist is willing to payUS$19. The total annual value of coral reef-associated tourism is estimated to be US$ 409million.
Recreational and cultural values associated with reefs are also estimated by van Beukering et al.(2009) via an application of the CM approach to a survey of 400 Bermudian households.Attributes in the CM were recreational fishing, coral diversity/fish diversity, recreationalactivities (scuba diving/snorkeling), and water quality (described as coral diversity, fishdiversity, water clarity, and swimming restrictions). The payment vehicle was an environmentallevy. Households had an average WTP of US$ 42 per month for minimizing marine pollution(translated as the ability to swim anytime and anywhere) and US$ 32 per month per householdfor maintaining coral reef quality (i.e. coral and fish diversity). Average WTP for water clarity(maintained by a healthy coral reef system) was US$27 per month.15
Using market values of recreation and tourism activities combined with estimates of consumersurplus derived from an application of TCM, ETI (2007) reports that the value of reefs associatedwith recreation and tourism in Puerto Rico is US$ 939,776,410, the majority of which isattributable to beach uses and water sports (not including snorkeling). This value is slightly morethan half of the total value ascribed to Puerto Rico reefs in this study. Hargreaves-Allen (2010b) provides an estimate of the economic impact of nature-based tourism on the economy of theBahamas. Although not specifically attributed to coral reefs, we can assume that a significant percentage of the estimated $44 million in annual economic impacts are linked to reef-basedrecreation.16
3.4.2.3 Species-specific values associated with reef-based recreation
Diver preferences and willingness to pay for reef-related attributes such as fish abundance, coral
cover and encounters with specific species have been examined at select locations in theCaribbean. Rudd (2001) finds that the presence of spiny lobster ( Panulirus argus) have asignificant impact on the market share of various dive charter packages in the Turks and Caicos,indicating that spiny lobsters have non-extractive use value. Rudd and Tupper (2002) and Rudd,et al (2001) find evidence that the market share of dive profiles in the Turks and Caicos increaseswith Nassau grouper size and abundance. Viewing reef sharks and sea turtles also had a largeimpact on market share in the simulations. Schuhmann et al. (2011) use a CM approach to showthat divers may be willing to pay up to US$145 for encounters with marine turtles in Barbados.These results indicate the ability to charge higher prices or MPA admission fees if divers aretaken to sites with a higher probability of encountering these species. Rudd et al. (2001) suggestthat increased revenues from such fees may be enough to cover both the explicit costs of MPAexpansion and the opportunity costs to local fishers associated with lost fishing opportunities.
15 Less than half of respondents indicated that they would be willing to pay an environmental levy, suggesting a highdegree of protest zeros or non-response in this study.16 Although the valuation methodology is not clearly articulated, we can assume that tourism values are derivedusing something akin to the market price method, and as such may be more reliable than the benefits transferestimates detailed in the report.
8/13/2019 CLME Marine Resource Valuation 2011 11 17
http://slidepdf.com/reader/full/clme-marine-resource-valuation-2011-11-17 31/61
24
3.5 Marine protected areas
The majority of valuation studies associated with MPAs in the Caribbean involve estimates ofWTP associated with entrance fees and/or improvements in the quality of non-extractive usessuch as recreational scuba diving. Exceptions include general valuations and financial analyses.An interesting issue with regard to the valuation of marine parks and protected areas is whether it
is the existence of a park itself that is valued or if is simply the quality of the attributes and thefeatures of the natural environment that are directly related to the management of the park. 17
3.5.1 General valuations of MPAs
Beharry-Borg and Scarpa (2010) administered a CM survey to a sample of 284 locals andtourists in Tobago to understand WTP for amenities related to coastal waters. One of theattributes included in the CM was the presence of marine protected areas. Estimated WTP forsnorkelers was up to $34.00 for the presence of an MPA. Interestingly, the authors found is littledifference in WTP for the presence of an MPA based on whether or not the MPA allows fishing.In contrast, in an examination of MPAs in BVI, Saba, Guadeloupe and St. Lucia, van’t Hof(1998) finds that respondents generally did not indicate that the existence of the MPA itself wasan important factor in their decisions to visit the area or engage in various recreational activitiesin the area, and that if the same level of environmental quality could be achieved without aformal MPA, visitation and activity would likely be unaffected.
Spash (2000) and Spash et al. (2000) use CVM in Jamaica and Curacao to estimate WTP formarine biodiversity as provided by marine protected areas. Respondents were questioned aboutwillingness to pay into a trust fund to create a marine park that would improve biodiversity by25% within the boundaries of the park.18 The baseline, “no management” scenario was described
as a 15% reduction in biodiversity. In addition to the CVM scenario, locals and tourists wereasked to indicate the sources of value derived from marine parks, expressing categories as a percentage of total value. The highest percentages of value were from swimming (roughly 33%
on average), and from diving and snorkeling (12.5%). As might be expected, tourists tended toassociated higher value from recreational and aesthetic uses (swimming, sunbathing), whilelocals tended to assign higher values to extractive uses (fishing and seafood). Surprisingly, 28%of Jamaican locals assigned no benefits to the existence of a marine park. Average willingness to pay was roughly US$25 per person per year, and was relatively constant across the two nationsand between locals and tourists. Willingness to pay was found to be significantly related to age,education, knowledge of marine biodiversity, the number of sources of value derived frommarine parks, and a sense of duty to protect marine life and habitats.19
17
Pendleton (1995) notes that the economic benefit from marine protection areas should be measured as the avoidedlosses in reef value that would be incurred in the absence of the park, net of costs for protection.18 The WTP question was open-ended and respondents were told that payment would be annual for a period of fiveyears.19 A potential issue with this application is that many respondents were unfamiliar with the term biodiversity (62%and 63.5% in Jamaica and Curacao respectively), hence may not have appreciated what they were valuing. Thisinformation bias may render the results from unaware respondents less reliable. Further, each sample contained asignificant portion of zero bids and protest bids (27% and 32% in Jamaica and Curacao respectively), which biasesdownward the WTP values. Aggregation and benefits transfer were not attempted for a variety of reasons detailed in
8/13/2019 CLME Marine Resource Valuation 2011 11 17
http://slidepdf.com/reader/full/clme-marine-resource-valuation-2011-11-17 32/61
25
Raboteur and Rodes (2006) use CVM to estimate WTP for the creation of a nature reserve atPigeon Malendure to protect coral reefs. Based on a sample of 100 individuals averagehousehold annual willingness to pay ranges from approximately US$10.50 to US$15.00 perhousehold (2003).
3.5.2 Financial analysis of MPAs
Geoghegan (1998) summarizes experiences with protected area financing in the Caribbean, and provides guidelines for designing revenue generation strategies and a framework for selection ofappropriate funding mechanisms. Success stories are detailed in four case studies, which includesome estimates of revenues and costs. Case studies include: Nelson’s Dockyard National Park,Antigua, the British Virgin Islands Reef Conservation Fee, Saba Marine Park, NetherlandsAntilles, and Pigeon Island National Historic Park, St. Lucia.
Examples of financial analysis of specific parks include Woodfield (1997), who estimates netincome from Wreck of the Rhone Marine Park (WRMP) in the British Virgin Islands (BVI)using the market price method. National parks in the BVI require the use of mooring buoys,which have an associated “conservation fee” that is used by the National Parks Trust for reef
protection schemes. This fee is the primary source of revenue for the WRMP. Costs associatedwith the program include payroll, boat maintenance and fuel. Total income is estimated to be$179,478.26. Cost estimates of $82,768.59 yield an overall net income of $96,709.67 associatedwith the mooring buoy program. Buchan et al. (unknown date) examines income, expenses, netincome and income/expense ratios by income source for Saba Marine Park, NA, 20 which isestimated to produce US$1.9 million in income for the national economy, over 86% of whichcomes from dive tourism. Economic impacts of the park are estimated to sum to approximatelyUS$3.05 million, representing roughly 21% of the national economy.21
3.5.3 WTP and Recreation in Marine Protected Areas
Numerous valuation studies have been conducted in the Caribbean to analyze diver and/or
snorkeler preferences and willingness to pay for different aspects of marine quality in the contextof access to marine parks and protected areas. The general conclusion of these studies is thatvacationing recreationists have significant WTP for access to marine protected areas providedthat threshold levels of quality and limits on use are maintained. Green and Donnelly (2003)investigate the use of MPAs by scuba diving operators in the Wider Caribbean and Pacific coastof Central America and show that the capacity to generate revenue from Scuba diving user feesin this region has not yet been fully exploited. Despite the fact that half of all dives throughoutthe region take place within a MPA (approximately 7.5 million dives), only a minority of MPAscharge fees for use. Depondta and Green (2006) also note this phenomenon, indicating that only25% of Caribbean MPAs containing coral reefs charge divers entry or user fees. Perhaps of equal
the manuscript. This study employed appropriate CVM techniques though estimates of value are likely downwardly biased.20 Estimates of income/expense ratios show values greater than one for all tourism uses of the park except yachttourists. Local uses of the park appear to have negative net incomes, and as such cost the park money.21 A multiplier of 1.6 is used to estimate economic impacts of the park. If other tourism is attributed to the park, the
park may be responsible for nearly half of the islands total GDP.
8/13/2019 CLME Marine Resource Valuation 2011 11 17
http://slidepdf.com/reader/full/clme-marine-resource-valuation-2011-11-17 33/61
26
importance, those few MPAs that do charge fees, charge amounts well below estimated diverwillingness to pay.
Terk and Knowlton (2008) provide a more recent review of user fees for diving in CaribbeanMPAs, including a detailed list of MPAs in the Caribbean containing coral reefs. The presence offees, management type and fee structure are noted for each park. The authors find that diving
fees are levied in only 16 of the 38 countries and territories and in only 34 of the 194 identifiedMPAs, despite the fact that 82% of the MPAs in the region protect coral reefs.22
WTP values and consumer surplus estimates are often compared to park maintenanceexpenditures to make a case for tourist taxes as a source of park funding. It is apparent from theliterature that most Caribbean MPAs are underfunded and that user fees can serve as a source ofrevenue, often more than sufficient to cover operating expenses and park management. Forexample, Thur (2010) estimates divers’ willingness to pay for access to the Bonaire NationalMarine Park (BNMP) using CVM. Results suggest that divers are willing to pay significantlymore than the existing $10 annual user fee for access to the park. DaCosta (2010) uses CVM toestimate WTP to enter Buccoo Reef Marine Park, Tobago and finds that even nominal fees ofUS$3-$4 would result in revenues that are significantly larger than current budget allotments for park maintenance, suggesting that user-based financing is highly plausible. Woodfield (1997)finds that quality of the environment and marine life was indicated as “very important” for 86% of visitors to the Wreck of the Rhone Marine Park, and that 59% of visitors indicated awillingness to spend 10-50% more on overall expenses associated with the park. van’t Hof (1998) reports similar results for other Caribbean parks including the Saba Marine Park in the Netherlands Antilles, the Reserve Ilets Pigeon in Guadeloupe, the Soufriere Marine ManagementArea in St. Lucia, and the Virgin Island National Park in the U.S. Virgin Islands. Weilgus et al(2010) use CVM to estimate diver WTP to enter the La Caleta National Marine Park in theDominican Republic, and derive revenue-maximizing charges of US$52.70 for local divers andUS$58.80 for international visitors. Assuming that operating costs per diver would beapproximately US$10, the authors suggest that by curtailing fishing and focusing on tourismfishers could earn up to 90% of their fishing income from dive-related tourism alone. 23
Several studies note that despite significant WTP, fees that maximize revenues may besuboptimal because high fees may result in adverse impacts on national economies throughdecreased tourism (e.g. Edwards, 2008, Thur, 2010, Planter and Piña, 2006, Dharmaratne, et al.,2000).24 Importantly, these studies also show that nominal increases in fees can producesubstantial increases in revenues without significantly decreasing overall tourism demand.25
22 Where they exist, the average dive fee paid per day for a two tank dive was found to be $US 1.15±3.49, roughlyequivalent to the average price of a cup of coffee ($US 2.68±1.37).
23 This is assuming a significant recovery of fish stocks which induces higher visitation rates by divers.24 Planter and Piña (2006) use a CVM (payment card) survey to estimate respondents’ maximum willingness to payto enter the Natural Protected Areas in Mexico’s Caribbean coast. More than 85% of the tourists would still visit the
protected area if a US$2 fee were imposed. Estimated socially optimal fees are found to be lower than revenuemaximizing fees, generating more consumer surplus through higher visitation rates.25 For example, the $20 fee for the BNMP dive tag which was acceptable to 94% of divers would generate overUS$500,000 in revenues, which is nearly double the budget of the park. As a result of this study, the price of a divetag was increased to $25 in 2005.
8/13/2019 CLME Marine Resource Valuation 2011 11 17
http://slidepdf.com/reader/full/clme-marine-resource-valuation-2011-11-17 34/61
27
MPAs in Jamaica have received considerable attention in the literature, with principal focus onthe Montego Bay Marine Park (MBMP). Work by Ruitenbeek and Cartier (1999), Gustavson(1998) and Gustavson (2002) were detailed earlier in this report. Walling (1996) andDharmaratne, et al. (2000) use CVM to estimate WTP by first time visitors and repeat visitors foruse and non-use values associated with management of MBMP.26 Spash (2000) and Spash et al.
(2000)
27
use CVM to estimate WTP into a trust fund that would improve biodiversity by 25%within the boundaries of the park relative to a baseline, “no management” scenario of a 15%reduction in biodiversity. Average willingness to pay was roughly US$25 per person per year,with little difference in WTP between locals and tourists.28
Bunce and Gustavson (1998) and Bunce et al. (1999) detail the results of a rapid socioeconomicassessment of coral reef user groups (fishers, water sports operators and hoteliers) in the MBMPto ascertain social, cultural, and economic backgrounds, the type and nature of reef-relatedactivities, perceptions of reef management and economic dependence on the reef.29 The size ofeach user group, fishing effort by gear, and fisher average income (weekly and annual by gear)are also estimated.30
Reid-Grant and Bhat (2009) provide a review of funding sources for marine protected areas aswell as empirical analysis of potential funding sources for the MBMP. WTP for parkmaintenance and conservation by stakeholders is analyzed using a combination of the TCMapplied to cruise ship and air travel visitors, and CVM-like surveys administered to hoteliers andtourism-based businesses. Notably, despite considerable consumer surplus31, nearly half oftourists indicated that they would not be willing to donate to the park. Further, while three out offive hoteliers stated willingness to donate to conservation efforts or were willing to provide ameans of collecting donations from hotel guests, none were willing to donate funds directly tothe MBMP. Only 38% of tourism-based business owners indicated willingness to donate toconservation of the MBMP despite the fact that a majority indicated that the park was important
26 WTP by first time visitors is approximately double that of repeat visitors at roughly US$20 and US$10respectively. Non-use values are found to be comparably small at less than US$2.27 This study was also carried out in Curaçao for a hypothetical marine park.28 Willingness to pay was found to be significantly related to age, education, knowledge of marine biodiversity, thenumber of sources of value derived from marine parks, and a sense of duty to protect marine life and habitats. A
potential issue with this application is that many respondents were unfamiliar with the term biodiversity (62% and63.5% in Jamaica and Curacao respectively), hence may not have appreciated what they were valuing. Thisinformation bias may render the results from unaware respondents less reliable. Further, each sample contained asignificant portion of zero bids and protest bids (27% and 32% in Jamaica and Curacao respectively), which mayresult in downward bias of the WTP values. Aggregation and benefits transfer were not attempted for a variety ofreasons detailed in the manuscript.29 Sample sizes are relatively small, at 35, 11 and 6 respectively. Interview data were supplemented with data fromfocus groups with fishers and water sports operators, as well as phone interviews with hoteliers, and fieldobservation of user groups.30 Hotels account for the largest percentage of employment, with approximately 16,000 directly or indirectly related
jobs. Fishing is estimated to directly employ roughly 380 individuals providing an annual net income betweenUS$3,000 and US$4,500.30 Watersports operations in Montego Bay account for approximately 200 jobs.31 Net gains above trip costs are estimated to be US$586 or US$739 per person per trip. Estimates of the total annualconsumer surplus are US$189 and US$993 million for cruise travelers and air travelers respectively.
8/13/2019 CLME Marine Resource Valuation 2011 11 17
http://slidepdf.com/reader/full/clme-marine-resource-valuation-2011-11-17 35/61
28
to their business and recognized that anthropogenic activities had an adverse effect on the qualityof the park.
Numerous valuation studies have examined the Bonaire Marine Park (BMP), one of the fewCaribbean MPAs that is entirely financed by user fees. By all accounts, valuation studies playedan important role in establishing appropriate user fees which lead to self-financing of the BMP.
Indeed, at the time of the first valuation study (reported in Dixon et al., 1993, and Dixon et al.,1995 and Dixon et al., 2000), there was no entrance fee for the BMP.32 These initial studies provide estimates of the contribution of BMP to the local economy, the costs of maintenance ofBMP33 and divers’ WTP entrance park fees, and estimate threshold levels of dives beyond whichdamage to reefs would likely be induced. Prior to the implementation of any fees, meanreservation prices (maximum WTP) for entrance into the park estimated via CVM wereUS$27.40 per visitor year,34 and 92 percent of visitors agreed that a proposed $10 user fee wasreasonable.
Pendleton (1995) uses a simple TCM based on estimates of the number of visitors to Bonaire andannual visits to the marine park and calculates total annual consumer surplus to all visitors to theBonaire Marine Park as approximately US$19.2 million. Based on net profits that accrue tolocally-owned reef-related businesses and taxes levied on foreign-owned reef-related businesses,net annual benefits associated with dive-related tourism are estimated to range between US$7.92million and US$8.8 million.35 Uyarra (2002) and Uyarra et al. (2005) report that a large majorityof divers (97%) and non-divers (84%) in Bonaire show acceptance of the existing $10 entrancefee to BNMP, suggesting WTP values may exceed the fee, creating consumer surplus for mostvisitors.
Parsons and Thur (2008), use a CM survey administered to a sample of 211 U.S. Scuba diverswho had visited Bonaire in 2001 to estimate the economic loss to SCUBA divers associated withhypothetical declines in the quality of the coral reef ecosystem in Bonaire National Marine Park.Declines in quality from the status quo level to three inferior levels 36 are estimated to range from
US$45 to US$192. Aggregation suggests that the discounted present value associated with lossesin quality ranges from US$42 million to US$179 million.
Thur (2010) estimates willingness to pay for access to the BNMP by recreational scuba diversusing a CVM (payment card) survey administered to the same sample of 211 U.S. Scuba divers.
32 An annual fee of US$10/diver had been proposed but not yet implemented.33 Total gross revenues associated with dive tourism are estimated to be US$23.2 million in 1991, which iscomprised of US$10.4 million from hotels, US$4.8 million to dive operations, US$4.7 million from otherexpenditures including non-hotel restaurants, souvenirs and car rentals, and US$3.3 million for air transport.Government revenues from room, casino and departure taxes levied on visiting divers totaled an additional
US$340,000. Initial direct costs associated with the establishment and rehabilitation of the park were estimated to beapproximately US$ 518,000. Annual operating costs were estimated to be US$150,000.34 This value is derived excluding zero responses. When zeros were included in the sample, mean WTP wasUS$24.1.35 Data are from 1991.36 The status quo level of quality in Bonaire is defined as 35% coral cover, 300 fish, 45 corals and 100 foot visibility.Lower levels are “good quality” (30% coral cover, 225 fish , 40 corals and 75 foot visibility), “medium-quality”
(20% coral cover, 125 fish, 25 corals and 50 foot visi bility), and “poor quality” (5% coral cover, 50 fish , 10 coralsand 20 foot visibility. The experimental design was constructed such that only declines in the overall quality of thecoral reef system could be valued, under the assumption that changes in reef quality would affect all attributes.
8/13/2019 CLME Marine Resource Valuation 2011 11 17
http://slidepdf.com/reader/full/clme-marine-resource-valuation-2011-11-17 36/61
29
Results suggest that divers are willing to pay significantly more than the existing $10 annual userfee for access to the park, with 94% of respondents were willing to pay at least $20, over 75%willing to pay at least $30, and more than 50% willing to pay at least $50. Annual mean WTP isestimated to be $61.37 As a result of this study, the price of a Bonaire dive tag was increased to$25 in 2005. Finally, Uyarra et al. (2010) use CVM to estimate tourists’ WTP for entrance into
Bonaire Marine Park. A large majority of tourists (90%) indicated satisfaction with parkconditions and current fees, yet only 46% of divers and 40% of non-divers were willing to payhigher fees. Total WTP by divers is found to be significantly lower in 2008 than in 1991 (basedon Dixon, 1993), and WTP by U.S. divers is found to be significantly lower than in 2002 (basedon Thur, 2010). These results suggest that steady increases in entrance fees to BNMP haveeffectively captured a good portion of the total consumer surplus from visits to the park.
Waterman (2009) uses CM to estimate the economic value of hypothetical environmentalmanagement changes in Folkestone Marine Reserve (FMR), Barbados. Attributes included inthe CM design are sewage treatment, water sports zoning and facilities/information.38 Touristsare found to have slightly higher willingness to pay for additional sewage treatment and facilitiesthan residents. Notably, the author discovers negative willingness to pay by residents for
additional water sports zoning in FMR, suggesting that such measures would detract fromutility.39 Ranking of the WTP estimates suggests that of the three non-price attributes, additionalwater treatment is valued the highest and facilities/information is valued the lowest. In additionto the willingness to pay estimates, this study collected data that could prove useful in directingfuture valuation work, including respondents attitudes toward beach entrance fees, frequency ofvisits to the FMR, perceptions of the importance of beaches to the economy of Barbados, perceived magnitude of tourism-induced impacts on socioeconomic and environmentalconditions in Barbados, and attitudes toward economic growth.
While not providing explicit values, Pendleton (1994) estimates trip demand for dive sites in theSandy Bay/West End Marine Reserve in Roatan Honduras. Results of this study suggest that reefquality has a positive and significant effect on demand, and that divers are willing to trade offtravel time for increased coral cover and reef topography.
3.6 Coral reef ecosystem service values
Estimates of the value of Caribbean reefs associated with ecosystem services are largelyassociated with the protection of coastal property or the contribution to coastal property values.Coastal protection values are principally derived using the cost-avoidance (CA) approach.Attempts at estimating the value associated with reef biodiversity also exist in the literature, butare typically based on stated preference methods (e.g. Spash, 2000; Cartier and Ruitenbeek,
37 This is described as a conservative estimate by the author based on higher WTP estimates produced by otherelicitation formats and the potential for strategic bias by park users.38 Each attribute is expressed in terms of three qualitative levels (two higher quality deviations from the status quo).The payment vehicle was described as an environmental (conservation) levy, paid on an annual basis for residentsand a per trip basis for tourists. Separate models are estimated for residents and tourists. Sample sizes are 212 and163 respectively. The author does not report the sampling scheme or the dates of the sample period. 39 Tourists were willing to pay $61 for moderate increases in zoning but only $26 for total exclusion of watercraft inthe FMR.
8/13/2019 CLME Marine Resource Valuation 2011 11 17
http://slidepdf.com/reader/full/clme-marine-resource-valuation-2011-11-17 37/61
30
1999), which suggests some form of use or non-use value rather than ecosystem service value.The PF approach could be employed in this manner, and would require an understanding andexplicit modeling of the contributions of marine biodiversity to human well-being.
Regarding the value of coastal protection, included in the analysis by Cesar et al. (2003) areestimates of the NPV of coral reefs in the Caribbean region, based on benefits transfer from cost-
avoidance applications reported in Burke et al. (2002). The 19,000 km2 of reefs in the Caribbeanare reported to provide annual net benefits of US$720 million from coastal protection. This studyalso reports annual biodiversity values of US$79 million, though it is not clear how theseestimates were derived.
ETI (2007) also includes benefits transfer estimates from applications of the cost-avoidancemethods (Burke and Maidens, 2004), to estimate the value of reefs for coastal protection inPuerto Rico. This study reports an economic value of coral reefs associated with coastal protection is US$9,969,258.
Cartier and Ruitenbeek (1999) use the using the total value of land and property at risk to lossfrom erosion along the shoreline within the bounds of the Montego Bay Marine Park to estimate
the coastal protection value of coral reefs in Montego Bay.40
The NPV of this land and propertythat is assumed to be protected by the reef is estimated to be US$65 million. Also in Jamaica,Cesar, et al. (2000) estimate values associated with coastal protection in the Portland BightMarine Protected Area using benefits transfer. As their data are gathered from outside theCaribbean region, these estimates are likely unreliable and are not reported here. Carleton andLawrence (2005) use the CA approach to value coral reefs for coastal protection in Turks andCaicos. Coral reefs contribution to coastal protection is valued at $16.9 million per year.
van Beukering et al. (2009) and Bermuda Department of Conservation Services (2009)undertake a large study using a variety of valuation methods to derive the value of coral reefecosystems in Bermuda. Included in this analysis is an estimate of coastal protection using theCA approach. By estimating potential damages and associated economic losses from a storm
event, with and without the presence of a reef, the authors conclude that reefs provide US$266million in annual service values associated with storm protection. This study also estimates thecontribution of reefs to the amenity value of real estate using a hedonic price model applied todata from 593 house and condominium sales.41 Total amenity value is calculated as thedifference between the total price of the houses sold in the dataset and the extrapolatedcalculation of the house prices in a “deterioration” scenario whereby beaches disappear.
Recreational and cultural values associated with reefs are also estimated using a CM survey ofBermudian households. One of the attributes in the CM was water clarity maintained by ahealthy coral reef system. Households had an average WTP of US$27 per month for thisattribute.
WRI’s Coastal Capital series (Burke, et al., 2008a, Burke, et al., 2008b, Cooper, et al., 2008,Cooper, et al., 2009, Wielgus, et al., 2010, Waite, et al., 2011, Kushner, et al., 2011) includesvalues of coral reefs associated with shoreline protection in St. Lucia, Trinidad and Tobago,Jamaica and Belize and the Dominican Republic, estimated via the CA method. The value of
40 This appears to fit the description of the CA approach, though the authors it as a PF application.41 The authors assume that distance from house to beach is an accurate measure of the coral reef amenity.
8/13/2019 CLME Marine Resource Valuation 2011 11 17
http://slidepdf.com/reader/full/clme-marine-resource-valuation-2011-11-17 38/61
31
coastal property protected by reefs is estimated with a multistep process. First, using GIS, landsvulnerable to wave and storm damage and protected by reefs are estimated. Shoreline stability isthen calculated using an array of physical factors and storm probability, and a percentage of thatstability that is attributed to reefs is assigned by recalibrating stability in the absence of reefs.Avoided damages are calculated using the value of coastal real estate that is both vulnerable to
damage and protected by reefs, multiplied by the probability of a 25-year storm event. Coralreefs in Belize provide an estimated US$120 – $180 million in avoided damages per year. Usingthe HP approach, the costs of beach erosion to hotels in the Dominican Republic are estimated to be between US$52 and US$100 million of the next ten years (Weilgus et al., 2010). Coral reefdecline may hasten the speed of such erosion and economic losses.
The approach by Kushner et al. (2011) in Jamaica is to first model the contribution of reefdegradation to wave height via the loss of rugosity-induced friction, and subsequently predict thechange in beach erosion that would result. The value of potential changes in beach width is thenestimated using results from an earlier CM application by Edwards (2009). Average per visitorloss in consumer welfare due to beach erosion attributable to coral degradation is estimated to beUS$26.10 per vacation. The total loss of consumer surplus from current rates of reef degradation
is estimated to be in excess of US$19 million over 10 years, and up to US$33 million if erosionrates increase due to further reef degradation.
Hargreaves-Allen (2010b) employs benefits transfer to estimate the TEV of ecosystems, speciesand landscapes on Andros Island, based on ecosystem service values derived from the literature.Of the approximately $260 million in total economic value, only 7% is attributed to coral reefs.In terms of specific services, the author estimates that 25% comes from carbon storage, 19% isfrom the extraction of raw materials and 11% is attributable to biodiversity. Because themethodology is not clearly articulated in the report, it is difficult to assess the validity of theseresults. As discussed above, benefits transfer estimates can be unreliable if value estimates aretransferred to dissimilar study sites. Because such a small percentage of TEV is assigned to reefs,it seems unlikely that value estimates were derived from the Caribbean region.
3.7 Reef fishery valuation studies
3.7.1 Financial analysis of reef fisheries
Economic analysis of reef fisheries in the Caribbean is largely comprised of market basedestimates of costs, earnings and profit. These are typically associated with broader investigationsinto the socio-economic characteristics of particular fisheries and often combine fisher surveydata with primary or secondary landings data. Examples include Sary (2001) and Sary et al.(2003) who report economic data associated with a small scale reef fishery in Jamaica, Jiménezand Sadovy (1997) who analyze the effect of mesh size on the commercial value of the catch in a
Puerto Rico trap fishery, Parker and Franklin (unpublished) who analyze catch, effort, landingsand profitability in the Barbados trap fishery, Gill et al (2007) who profile catch, prices, costsand revenues for small-scale fishers in the Grenadine Islands, and Franklin (2007) who detailsseveral socio-economic factors of the lobster fishery of the BVI including costs, revenues, assets,catch and effort. Linkages between fishers and other economic sectors are commonly discussedin these reports, as are the social and economic importance of the fishery to stakeholders.
8/13/2019 CLME Marine Resource Valuation 2011 11 17
http://slidepdf.com/reader/full/clme-marine-resource-valuation-2011-11-17 39/61
32
Weilgus et al. (2010) use landings and price data to estimate the economic importance of reefand mangrove-dependent fisheries in the Dominican Republic. Gross income from reef-dependent fisheries has decreased significantly from over $41 million in the early 1990s to under$17 million in the early 2000s. With 99% of landing sold domestically, these fisheries serve asan important source of protein and contribute to food security. Waite et al. (2011) examine the
economic contribution of reef-related fisheries in Jamaica using gross revenues from reportedsales. The authors find that Jamaica’s reef -related fisheries were worth an estimated US$34.3million per year from 2001 to 2005, or roughly 0.3 percent of national GDP, and that fisheriesare a significant source of employment and food security.
3.7.2 Economic value and economic impacts
Other studies provide broader estimates of the economic value of fisheries, including Carletonand Lawrence (2005), who estimate that reefs fisheries in Turks and Caicos create $3.7 million per year in gross value added42 and Schuhmann et al (2011) who provide estimates of economicimpacts associated with spending and income in the Barbados trap fishery. The market value ofcoral reef-associated fisheries harvests in Bermuda was estimated by van Beukering et al. (2009)
using existing data from the Marine Resources Section and face to face interviews with sixfishermen.43 Reported average catch rates for reef associated species were multiplied by market prices to approximate value. Fishing costs were estimated to comprise between 40 and 80% ofthe gross value of total catch. The annual value of coral reef ecosystems as related to Reef-associated fisheries is estimated to be US$4.9 million.
As part of a broader reef valuation effort, Gustavson (2002) uses primary data from fishers andthe market price approach to estimate the value of Montego Bay coral reefs associated withnearshore artisanal fisheries. These values constitute estimates of net gains to fishers (producersurplus or rents), as economic costs of provision are deducted from revenues. The NPV ofMontego Bay nearshore artisanal fisheries (trap, net, hand line and spear) is estimated to rangefrom-US$1.66 million to US$7.49 million. ETI (2007) reports values associated with
commercial and artisanal reef fisheries in Puerto Rico based on fisheries market data. Valuesassociated with reef fisheries are small (US$407,415) relative to an estimated TEV of coral reefsand associated environments in Eastern Puerto Rico of over US$1.852 billion.
In a multi-country analysis, Agar et al. (2005) describe socio-economic characteristics of theU.S. Caribbean trap fishery (Puerto Rico and US Virgin Islands St. Croix, St. Thomas and St.John). Based on a sample of 100 randomly selected trap fishers, estimates of annual catch, effort,revenue, capital investments and costs are generated. Fishers are shown to be highly dependenton the fishery for income. While financial profits are modestly positive44, economic profits areshown to be largely negative, indicating that fishers are not covering the opportunity cost of theirtime and capital. This suggests overcapitalization in the fishery and a potentially tenuous futurefor fishers, and may also indicate that fishers derive non-monetary rewards from fishing.
42 This value is less than 8 percent of the estimated TEV of reefs in Turks and Caicos.43 Results are also reported in Bermuda Department of Conservation Services (2009). The small sample size used inthis study suggests estimates should be interpreted with caution.44 Annual fisher profits range from $4,760 to $32,467 in Puerto Rico, and from $3,744 to $13,652 in St. Thomas andSt. John. In St. Croix, annual profits range between $9,229 and $15,781.
8/13/2019 CLME Marine Resource Valuation 2011 11 17
http://slidepdf.com/reader/full/clme-marine-resource-valuation-2011-11-17 40/61
33
Cesar et al., 2003 uses benefits transfer based largely on interval estimates of value reported inBurke et al. (2002), to estimate NPV of coral reefs from fisheries in the Caribbean Region. The19,000 km2 of reefs in the Caribbean are reported to provide annual net benefits of US$391million from fisheries.45
3.7.3 Other reef values
Edwards (2008) uses CVM to estimate tourists’ willingness to pay an environmental tax to fundocean and coastal management activities. Results are used to predict how decreased coral reefquality might affect visitation decisions and the coastal tourism industry.46 The authors note thatattempts to capture the entire consumer surplus from visitors would cause visitation to declinesignificantly, but a modest visitor tax of $1 per person would cause only a minor decline invisitation generate revenues far in excess of existing government allocations for coastal zonemanagement.
3.7.4 Other applications of economics to reef resources in the CLME
Beyond monetary valuation, several analyses warrant mention in terms of their contribution to
understanding economics associated with the reef ecosystem in the CLME. Market data are usedin conjunction with bioeconomic modeling47 by Ley-Cooper and Chávez (2009) and Chávez(2007) to assess the Caribbean lobster stock, value of total Caribbean lobster harvest, annual profit and total employment. The authors also estimate the rate of harvest and effort that wouldmaximize economic and biological yield in the Chinchorro Bank (northwestern Caribbean coastof Mexico) commercial lobster fishery and recommend policy changes to restore stock andharvest rates to historical levels. Employment levels at different yields (e.g. MSY, MEY) are alsoevaluated. Caribbean lobster harvest is estimated to have a market value of US$ 286 million,generating annual profits of US$ 169 million, providing employment for 32,000 fishers.Simulation results for the Chinchorro Bank fishery suggest that a 29% reduction in fishingmortality could produce MSY, but only at the risk of socio-economic crisis in the fishery.
Moderate annual reductions in fishing effort and mortality (0.025% per year), potentially attained by shortening first fishing season by one week, could restore stocks to levels seen 30 years prior,and produce substantial economic gains (doubling of profits and fishers).
45 The reliability of these estimates is difficult to ascertain due to the lack of detail provided in this report or in thereferenced report.46 The CVM survey was administered to a sample of 481 tourists in 2007. Mean WTP is US$130.07 for a generaltourism is tax and $165.15 for an environmental tax, which translate to US$16.16 and $20.52 per person per day.Using estimates of the impact of these taxes on visitation, the authors suggest that an environmental tax of $1 per
person would cause a 0.1% decline in the visitation rate and would generate revenues of $1.7 million, which is
roughly 88% of the ‘‘best case’’ cost estimate for natural resource protection provided by coastal zone managers. A$2 per person tax would decrease visitation by 0.2% and generate revenues of $3.4 million. The authors note thatattempts to capture the entire consumer surplus from visitors would cause visitation to decline by 52.4%.47 Lobster catch data from the Chinchorro Bank, Mexico from 1982-2006 to calibrate models used in simulations(e.g. mortality, catch-at-age and recruitment functions). Costs of fishing, effort (number of trips) and market valuesof catch are used to estimate benefits from fishing. Benefit-cost ratios for different levels of catch are combined withestimates of fishing mortality to estimate fishing capacity (number of boats and number of fishers). Exploitationscenarios (MSY, MEY) are simulated in order to estimate resulting profits, employment and benefit-cost ratios.2004 FAO catch statistics from all 25 countries harvesting spiny lobster are used to generate aggregate values.
8/13/2019 CLME Marine Resource Valuation 2011 11 17
http://slidepdf.com/reader/full/clme-marine-resource-valuation-2011-11-17 41/61
34
The potential for economic incentives to aid in reef conservation has also been analyzed in theCaribbean. Niesten and Gjertsen (2010) summarize case studies employing three differentapproaches to providing marine resource users with economic incentives for conservation: buyouts, conservation agreements, and alternative livelihoods. Caribbean cases include the gillnet and trammel net buyout in St. Croix, USVI, and alternative livelihoods training at the Port
Honduras Marine Reserve, Belize and St. Croix East End Marine Park, USVI. de Groot andBush (2010) provide an overview of the concept of Entrepreneurial Marine Protected Areas(EMPAs), which achieve protection via private sector, market-driven coalitions and governance.Two cases in Curacao are used to detail the conditions under which conservation via privatesector governance can benefit both private and public interests. These conditions includelegitimate and durable authority, incentives for enforcement and investment in natural assets, public sector oversight and consumer education.
Highlighting the importance of understanding and predicting fisher behavior for policydevelopment, Salas et al. (2004) estimate a random utility model of daily species target selectionfor three fishing communities on Mexico’s Yucatan coast. This work recognizes the impact ofdaily decisions by fishers regarding (e.g. whether or not to go fishing, what species to target or
whether to engage in non-fishing employment or gear repair) on the efficacy of managementactions. Using data on expected CPUE and revenues from spiny lobster and octopus,opportunity costs of fishing for alternative targets, the opportunity cost of fishing (i.e. forgonenon-fishing earnings), travel costs and weather conditions, fisher responses to changes in species prices and CPUE are simulated. Target choice and target switching are found to be based onresource availability and revenues from prior trips. Decreases in species-specific revenues arefound to induce switching to alternative targets.48 Increases in the availability of species arefound to direct effort away from other species.49 Fisher behavior is heterogeneous acrosscommunities, indicating that results from modeling efforts such as this one may not applydirectly to other areas.
Ruitenbeek et al. (1999) use fuzzy logic modeling and economic optimization to estimatechanges in Montego Bay coral reef quality that would occur from interventions such as solidwaste collection, tree planting, sediment traps and construction of a large scale waste treatmentfacility. Results demonstrate that optimal intervention strategies may be dependent on coralquality targets; hence simply promoting low-cost management interventions may be suboptimal.Household solid waste collection, installation of an outfall, and the use of a river sediment trapare shown to be relatively cost-effective for the case of Montego Bay. 50
4 Values associated with the pelagic ecosystem
48 These effects are found to be non- linear. Price changes appear to have threshold effects on target decisionsdepending on the relative costs and skills required for targeting different species.49 Notably, an increase in the availability of octopus may affect the probability of targeting lobster for two reasons:increased probability of octopus catch and decreased likelihood of lobster catch due to predation by octopus.50 These interventions could achieve coral quality improvement greater than 10% at a cost (NPV) of US$12 million.Costs of marginal improvement in coral quality are shown to be non-linear: achieving the maximum potentialimprovement of 20% would entail present value costs of US$153 million.
8/13/2019 CLME Marine Resource Valuation 2011 11 17
http://slidepdf.com/reader/full/clme-marine-resource-valuation-2011-11-17 42/61
35
Relative to studies focused on nearshore reef ecosystems in the CLME, valuation of ecosystemgoods and services in the pelagic zone have received little attention. The valuation work thatdoes exist focuses largely on provisioning services associated with commercial fisheries.Exceptions include analyses of cultural services associated with tourism and recreation,especially sport fisheries and other recreational opportunities such as whale watching. Despite
the importance of the Caribbean pelagic ecosystem in terms of supporting and regulatingservices such as habitat provision, egg/larvae transport, atmospheric gas exchange and carbontransfer through the food web, there has been no attempt at valuing such services.
4.1 Pelagic fishery values and analyses
Estimates of market values associated with commercial fisheries in the Caribbean are availablefrom a variety of sources including FAO, CIA, Earthtrends, and the Caribbean RegionalFisheries Mechanism. These data include primary and secondary fisheries employment, the valueof fisheries output, imports and exports, and the contribution of fisheries to GDP. 51 Nationalfisheries offices likely have more reliable and recent data, though no attempt was made tocompile such data for this report.
4.1.1 Commercial fishery value estimates
As is the case with nearshore fisheries, many economic analyses of pelagic fisheries in theCLME focus on estimates of costs, revenues and profits. The Caribbean Regional FisheriesMechanism (CRFM) Fishery Reports contain numerous examples of commercial fisheriesvaluations. Other examples include Potts et al. (2003), who report market values (capital,operating costs, revenues, ROI) and employment in the Trinidad and Tobago pelagic flying fishfishery; Grant (2006) who reports commercial longline fishery values in Grenada (costs,expenditures, income), as well as fisher and community dependence. Schuhmann et al. (2010)report costs, net profit and return on investment in the Barbados longline fishery. Hargreaves-
Allen (2010b) uses a combination of the MP method and benefits transfer to estimate the TEV ofecosystems, species and landscapes on Andros Island, Bahamas. Estimates of the impact of theseecosystems on the economy of the Bahamas, are provided, including $70 million in grossrevenues attributable to commercial fishing.
4.1.2 Economic linkages and pelagic fisheries
A few notable studies have taken economic analysis beyond the relatively straightforwardinvestigation of costs, earning and return on investment. For example, Mahon et al. (2007)estimate the value added as fishery landings in Barbados move up the supply chain to the finalconsumer.52 Jaunky (2011) examines the causal relationship between the growth of fish exportsand economic growth in SIDS using data from 23 SIDS over the period 1989 – 2002.53 Results
51 These data are incomplete for many countries. As of fall 2011, data on primary and secondary fisheriesemployment was found for 14 Caribbean nations. Values of fisheries output, imports and exports were available for13 nations. The contribution of fisheries to GDP was available for 14 nations.52 Estimated value added is approximately US$19, which amounts to roughly 2.6 times the landed value of thefishery.53 Caribbean states included in the analysis are Antigua and Barbuda, The Bahamas, Barbados, Dominican Republic,Grenada, Haiti, Jamaica, St. Kitts and Nevis, St. Vincent and the Grenadines, and Trinidad and Tobago.
8/13/2019 CLME Marine Resource Valuation 2011 11 17
http://slidepdf.com/reader/full/clme-marine-resource-valuation-2011-11-17 43/61
36
show strong evidence of long-run bi-directional causality between the growth of fish exports andeconomic growth, indicating that fish exports may be a means for SIDS to sustain economicgrowth. By extension, proper fisheries management may be a critical component of economicgrowth for SIDS.
Nguyen and Jolly (2010) use FAO data to estimate aggregate seafood import demand functions
for Caribbean countries. Seafood import demand is shown to be price elastic. Seafood importsincrease with domestic income and tourist arrivals, and decrease with domestic fishery production. The effect of import tariffs and production support policies on seafood imports anddomestic fishery production are analyzed, and both policies are shown to increase producersurplus. Production expansion policies appear to increase consumer surplus, while import tariffsmay reduce consumer surplus.54
4.1.3 Fisheries multipliers
A potentially important resource understanding the economic impact of fisheries harvests is provided as part of an economic impact analysis for world marine capture fisheries conducted byDyck and Sumalia (2010).55 The authors provide estimates of economic impacts and household
income effects for each country in the world, which could serve as valuable inputs for economicimpact analysis of fisheries in the CLME. These values represent the total amount of outputsupported by fishery landings and total household income generated through indirect andinduced effects due to output from the fishing industry.56
4.2 Sport fishing values
Recreational fishing for pelagic species is a source of significant economic value in manyCaribbean nations, and a potentially untapped source of foreign exchange in many others. Forexample, Hargreaves-Allen (2010b) reports over $10 million in gross revenues from guidedrecreational fishing trips in Andros Island, Bahamas. Ditton and Clark (1994)57 use the market
price method and CVM to derive estimates of spending by participants in recreational billfishtournaments, consumer surplus from participation in billfishing and economic impacts of non-resident expenditures related to billfishing in Puerto Rico.58 Total annual expenditures sum to
54 The effects of expansion policies on fishery effort, stock and the overcapitalization are not analyzed.55 Their estimates of direct, indirect, and induced impacts suggest that the true economic impact of global marinecapture fisheries is nearly three times as large as the value of ex-vessel landings. In other words, each dollar ofoutput in the fisheries sector supports about three dollars of output through linkages with other sectors in the globaleconomy. 56 Calculation of economic impact multipliers and household income multipliers is straightforward using these
estimates. For example, in Table A4 of Dyck and Sumalia, the landed value of fisheries in Barbados is reported asUS$3.12 million, which generates economic impacts of US$3.79 million and an income effect of US$0.89 million.This implies that the output multiplier for fishery landings in Barbados is 1.215 (3.79 / 3.12) and the householdincome multiplier is 0.285 (0.89 / 3.12). That is, each dollar of fishery landings generates an additional 1.215 dollarsin total output and 0.285 dollars in household incomes.57 Also reported in Clark et al. (1994).58 Data were collected using a mail survey of 433 participants in billfishing tournaments held in Puerto Rico
between 1991 and 1992. The sample included 347 Puerto Rico residents and 86 non-residents. Average per tripspending on trips targeting billfish (net of tournament fees) was estimated to be $711 and $3,945 by resident and
8/13/2019 CLME Marine Resource Valuation 2011 11 17
http://slidepdf.com/reader/full/clme-marine-resource-valuation-2011-11-17 44/61
37
$26 million, with an additional $18 million in estimated consumer surplus.59 The economicimpact of recreational billfishing in Puerto Rico is estimated to be $4.75 million, with 200 jobsattributable to billfishing. The authors conclude that the recreational billfish fishery is worthmany times commercial value of catch. The magnitude of the consumer surplus estimatessuggests that additional revenues could be earned and transferred to local economies. Support for
this notion is provided by Gillet, et al. (2007) who use cost and revenue estimates for recreationalfishing in the BVI to suggest that the economic impact from the development of a recreationalfishing industry could exceed US$ 4 million.
4.3 Other recreation in the pelagic ecosystem
Whale watching is an important source of revenues in the Caribbean region, and takes place in asmany as 14 nations including TCI, USVI, BVI, Puerto Rico, Martinique, Grenada, and SVG,Antigua, Saint Lucia, Nevis, St. Barthélemy, and Guadeloupe, according to Vail (2005).Estimates for the Caribbean Region derived from Hoyt (2001) and Hoyt and Hvenegaard (2002)suggest that nearly 89,000 people went whale, dolphin or porpoise watching in the WiderCaribbean in 1999, generating revenues in excess of US$11 million. Total expenditure on whalewatching in the Dominican Republic alone was US$5.2 million in 1999, and was nearly US$3million and US$1 million in the Bahamas and Dominica respectively. More recent values fromAlie (2008) suggest that up to 568,000 individuals engaged in Caribbean whale watching in2006, generating nearly US$23 million in revenues. The industry has clearly shown significantgrowth, with the number of whale watchers increasing by over 100% per year in the early 1990sand over 40% per year on average from 1994 to 1998 (Hoyt and Hvenegaard, 2002). Normanand Catlin (2007) report a value of whale shark tourism in Belize of US$1.32 million.60 Cline(2008) reports that recreational diving with sharks in the Bahamas has generated roughlyUS$800 million in gross revenues since 1987, and is estimated to have generated US$78 millionin revenue in 2007 alone.
5 Values associated with the continental shelf ecosystem
Of the three ecosystems detailed in this report, the continental shelf ecosystem has received theleast attention by economists, perhaps because this system is far removed from economic driversand economic activity. Exceptions include analyses of commercial fisheries associated with theshelf. For example, Hutchinson (2008) who uses a PF approach to analyze the importance ofeffort and the price of shrimp (finfish) bycatch in determining the level of shrimp landings in theTrinidad and Tobago shrimp trawl fishery. Effort (trip days) is found to have a significant effect
non-resident anglers respectively (the latter including the costs of transportation to Puerto Rico). Spending per billfish caught is estimated to be $1,963 and $2,132 by resident and non-resident anglers. Annual consumer surplusfor non-resident anglers is estimated to be $11,135.59 The consumer surplus estimate was derived using data from a CVM question that asked if respondents werewilling to pay into a management fund that would finance law enforcement and research efforts in support of
billfish.60 Estimation method and data sources are not given.
8/13/2019 CLME Marine Resource Valuation 2011 11 17
http://slidepdf.com/reader/full/clme-marine-resource-valuation-2011-11-17 45/61
38
on landings of shrimp and finfish bycatch. Contrary to expectations and anecdotal evidence, therelative price of the two species was not found to be a significant determinant of landings.
Agar et al. (2005) describe socio-economic characteristics of the U.S. Caribbean trap fishery(Puerto Rico and US Virgin Islands St. Croix, St. Thomas and St. John). Based on a sample of100 randomly selected trap fishers, estimates of annual catch, effort, revenue, capital investments
and costs are generated. Fishers are found to be highly dependent on the fishery for income.Annual fisher profits range from $4,760 to $32,467 in Puerto Rico, and from $3,744 to $13,652in St. Thomas and St. John. In St. Croix, annual profits range between $9,229 and $15,781.Economic profits are shown to be largely negative, indicating that fishers are not covering theopportunity cost of their time and capital. This suggests overcapitalization in the fishery and a potentially tenuous future for fishers, and also indicates that fishers derive non-monetary rewardsfrom fishing.
6 Summary of Wider Caribbean Marine Resource Values
6.1 Overview of analysesTo date, economic valuations in the CLME have focused on only a limited number of benefitsderived from marine ecosystem goods and services, primarily benefits that are relatively easy tomeasure and convey to the public, such as recreation opportunities in nearshore protected areas,and benefits that are ascribed to easily measured market indicators such those derived from realestate and capture fisheries. Values associated with reefs have received far more attention thanthose associated with the pelagic or shelf ecosystems, no doubt due to the ease of access toassociated user groups by researchers and the relatively straightforward linkages betweenchanges in resource quality and well-being. Table 4 presents a summary of value knowledge bycountry for the reef and pelagic ecosystems. Table 5 presents a brief summary of the extent ofknowledge of Caribbean marine resource values as well as reference notes. Coupled with the
gaps identified in section 6.2 and the outline for modeling efforts detailed in section 7, hesetables provide a framework for guiding future valuation efforts in terms of targeting areas andecosystem services where value estimates are relatively scarce.
WTP and consumer surplus estimates from tourism and recreation are consistently significantacross countries, regardless of the valuation method employed. Even in areas where reef qualityis diminished, tourists appear to derive considerable net benefits from marine-based recreation inthe Caribbean. Reefs in marine protected areas have received particular attention, especially withregard to recreation and tourism. Protected areas in Jamaica and Bonaire have been the subject ofmultiple valuations over many years. It is clear from the literature that user fees as a basis forfinancing conservation are underutilized in the region, especially in the case of MPAs, with
Bonaire as a possible exception. Financial analyses of MPAs in the Caribbean suggest that theseareas provide favorable benefit-cost ratios, and that public investments in reef protection areworthwhile.
After recreation and tourism, the value of reefs for coastal protection and fisheries have garneredthe most value estimates, largely as a result of WRI’s Coastal Capital series in Belize, the
Dominican Republic, Jamaica, St. Lucia and Tobago. Value of reefs for shoreline protectionappears significant especially in tourist areas. If taken in isolation, shoreline protection valuescreate a potential quandary for conservation policy as the value and density of coastal
8/13/2019 CLME Marine Resource Valuation 2011 11 17
http://slidepdf.com/reader/full/clme-marine-resource-valuation-2011-11-17 46/61
39
development are correlated with increases in the value of reefs. The value of reefs for fishing islargely limited to market analyses of capture fisheries. It is clear that small scale fishers in theCaribbean are highly dependent on reefs for livelihoods, and that reef-dependent fisheries may be characterized as marginally profitable at best.
Valuation work in the pelagic and continental shelf ecosystems has been modest in comparison
to that in the near shore zones, and is limited to market values of capture fisheries and off-shorerecreation opportunities. Where the economics of bill fishing and whale watching have beenexamined, evidence points to viable market opportunities and economic contributions.
6.2 Gaps, unknowns and possibilities for future valuation work
Despite the great deal of valuation work in the WCR 61 and the increasing attention that economicvaluation is garnering by policy makers, it is clear that there a great deal remains unknown.Economic values associated with the pelagic and continental shelf ecosystems in the CLMEremain largely unspecified. As shown in Table 3, valuation work is absent for numerous nationsand territories in the CLME, most notably those in Central America.
Despite a plethora of market data and evidence of overfishing in the WCR (CARSEA, 2007), theeconomic impacts of overfishing remain largely unexplored. These include effects on nationaleconomies, employment, food security and tourism. Likewise, the economic practicality offisheries subsidies in terms of the relative values of contemporaneous support for livelihoods andfuture economic costs of overfishing remains unknown.
As overfishing could potentially lead to the loss of historic fishing heritage as well as animportant source of protection against exogenous economic shocks, understanding the valuesfrom the cultural and security benefits of small scale fisheries seems deserving of attention.Other cultural service values that remain largely unknown include the value of WCR marineecosystems to research and education and the amenity value of reefs to coastal property owners.
This latter value, estimable via the HP method, would appear to be an important partner tostudies that estimate the value of reefs for coastal protection.
Supporting and regulating services provided by the marine ecosystems of the WCR that have been recognized as important in the context of natural sciences, have not be linked to valuation.Examples include the contribution of Caribbean reefs and other coastal ecosystems to fisheries production, climate regulation and habitat provision. With appropriate modeling, the PF methodcould be applied to improve our understanding of these values.
Finally, despite the continued improvement of appropriate methodologies, estimates of non-usevalues for WCR marine ecosystem goods and services are in short supply.
61 Approximately 200 individual value estimates were reviewed for this study.
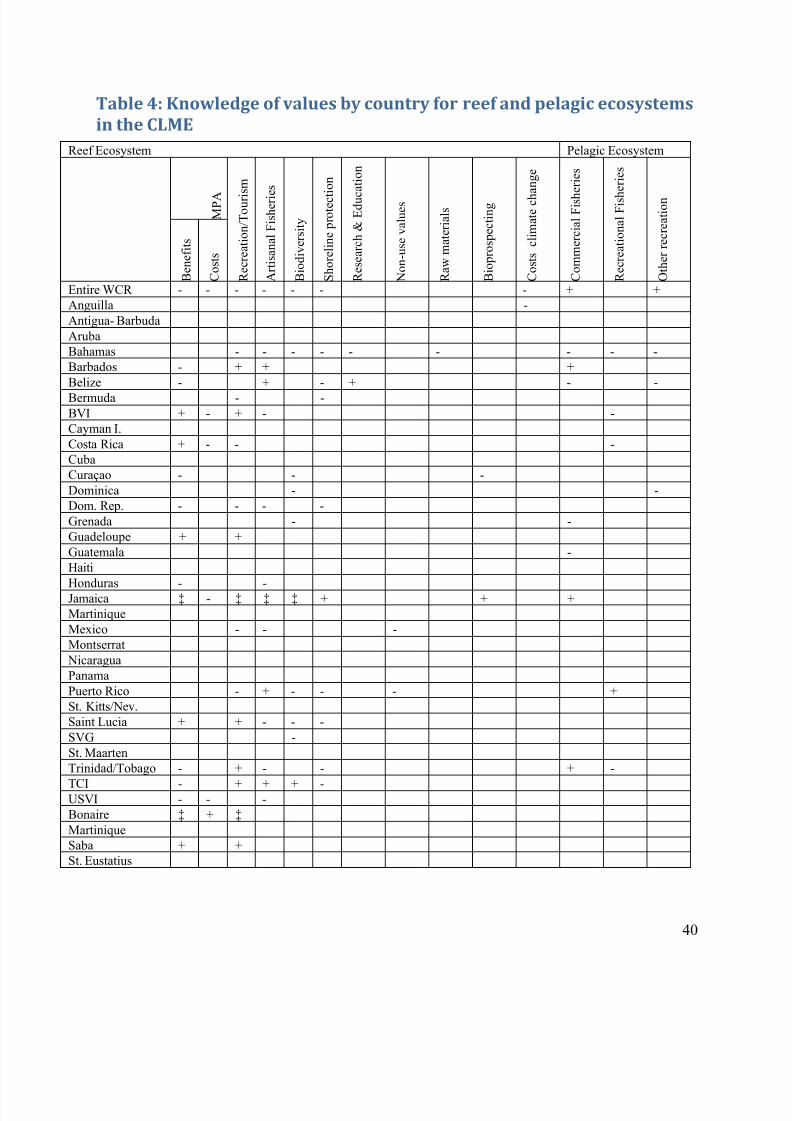
8/13/2019 CLME Marine Resource Valuation 2011 11 17
http://slidepdf.com/reader/full/clme-marine-resource-valuation-2011-11-17 47/61
40
Table 4: Knowledge of values by country for reef and pelagic ecosystems
in the CLME
Reef Ecosystem Pelagic Ecosystem
M P A
R e c r e a t i o n / T o u r i s m
A r t i s a n a l F i s h e r i e s
B i o d i v e r s i t y
S h o r e l i n e p r o t e c t i o n
R e s e a r c h & E d u c
a t i o n
N o n - u s e v a l u e s
R a w m a t e r i a l s
B i o p r o s p e c t i n g
C o s t s c l i m a t e c h a n g e
C o m m e r c i a l F i s h
e r i e s
R e c r e a t i o n a l F i s h
e r i e s
O t h e r r e c r e a t i o n
B e n e f i t s
C o s t s
Entire WCR - - - - - - - + +Anguilla -Antigua- BarbudaArubaBahamas - - - - - - - - -Barbados - + + +Belize - + - + - -
Bermuda - -BVI + - + - -Cayman I.Costa Rica + - - -CubaCuraçao - - -Dominica - -Dom. Rep. - - - -Grenada - -Guadeloupe + +Guatemala -Haiti
Honduras - -Jamaica ‡ - ‡ ‡ ‡ + + +MartiniqueMexico - - -Montserrat
NicaraguaPanamaPuerto Rico - + - - - +St. Kitts/Nev.Saint Lucia + + - - -SVG -St. MaartenTrinidad/Tobago - + - - + -
TCI - + + + -USVI - - -Bonaire ‡ + ‡
MartiniqueSaba + +St. Eustatius
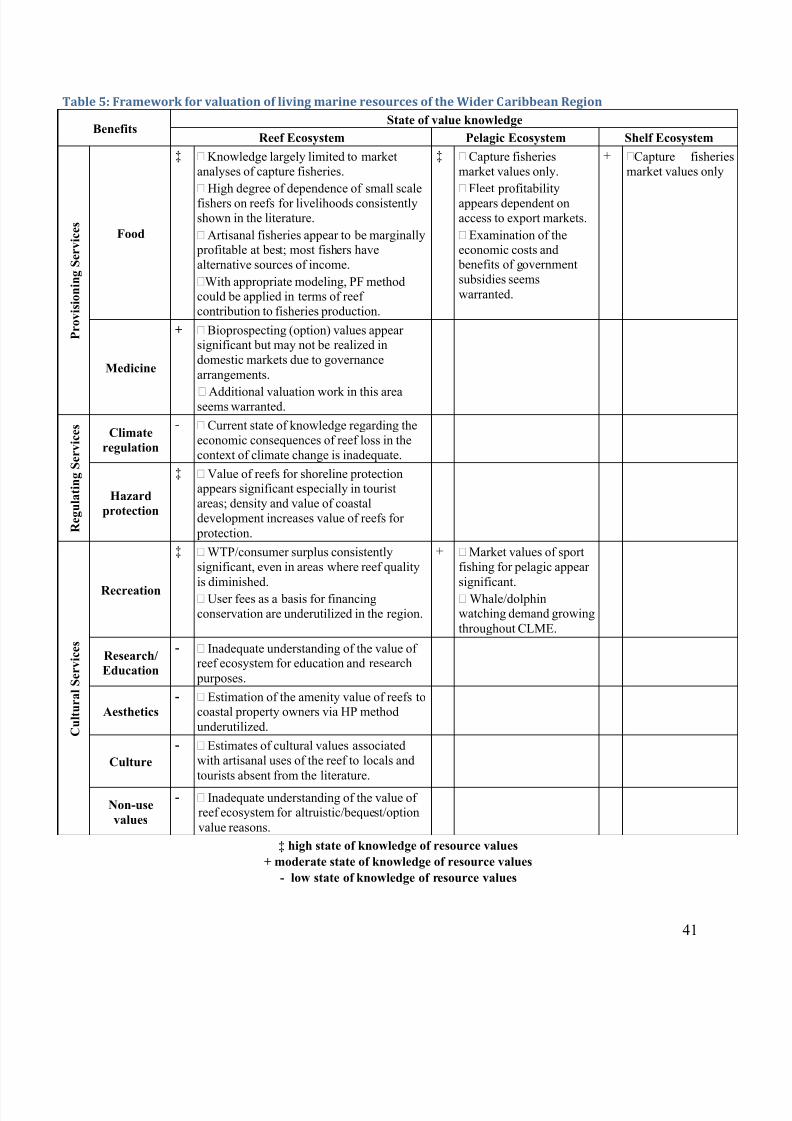
8/13/2019 CLME Marine Resource Valuation 2011 11 17
http://slidepdf.com/reader/full/clme-marine-resource-valuation-2011-11-17 48/61
41
Table 5: Framework for valuation of living marine resources of the Wider Caribbean Region
BenefitsState of value knowledge
Reef Ecosystem Pelagic Ecosystem Shelf Ecosystem
P r o v i s i o n i n g S e r v i c e s
Food
‡ Knowledge largely limited to marketanalyses of capture fisheries. High degree of dependence of small scalefishers on reefs for livelihoods consistentlyshown in the literature. Artisanal fisheries appear to be marginally
profitable at best; most fishers havealternative sources of income.With appropriate modeling, PF methodcould be applied in terms of reefcontribution to fisheries production.
‡ Capture fisheriesmarket values only. Fleet profitabilityappears dependent onaccess to export markets. Examination of theeconomic costs and
benefits of governmentsubsidies seemswarranted.
+ Capture fisheriesmarket values only
Medicine
+ Bioprospecting (option) values appearsignificant but may not be realized indomestic markets due to governancearrangements.
Additional valuation work in this areaseems warranted.
R e g u l a t i n g S e r v i c e s
Climate
regulation
- Current state of knowledge regarding theeconomic consequences of reef loss in thecontext of climate change is inadequate.
Hazard
protection
‡ Value of reefs for shoreline protectionappears significant especially in touristareas; density and value of coastaldevelopment increases value of reefs for
protection.
C u l t u r a l S e r v i c e s
Recreation
‡ WTP/consumer surplus consistentlysignificant, even in areas where reef qualityis diminished. User fees as a basis for financingconservation are underutilized in the region.
+ Market values of sportfishing for pelagic appearsignificant. Whale/dolphinwatching demand growingthroughout CLME.
Research/
Education
- Inadequate understanding of the value ofreef ecosystem for education and research
purposes.
Aesthetics
- Estimation of the amenity value of reefs tocoastal property owners via HP methodunderutilized.
Culture
- Estimates of cultural values associatedwith artisanal uses of the reef to locals andtourists absent from the literature.
Non-use
values - Inadequate understanding of the value of
reef ecosystem for altruistic/bequest/optionvalue reasons.
‡ high state of knowledge of resource values
+ moderate state of knowledge of resource values
- low state of knowledge of resource values
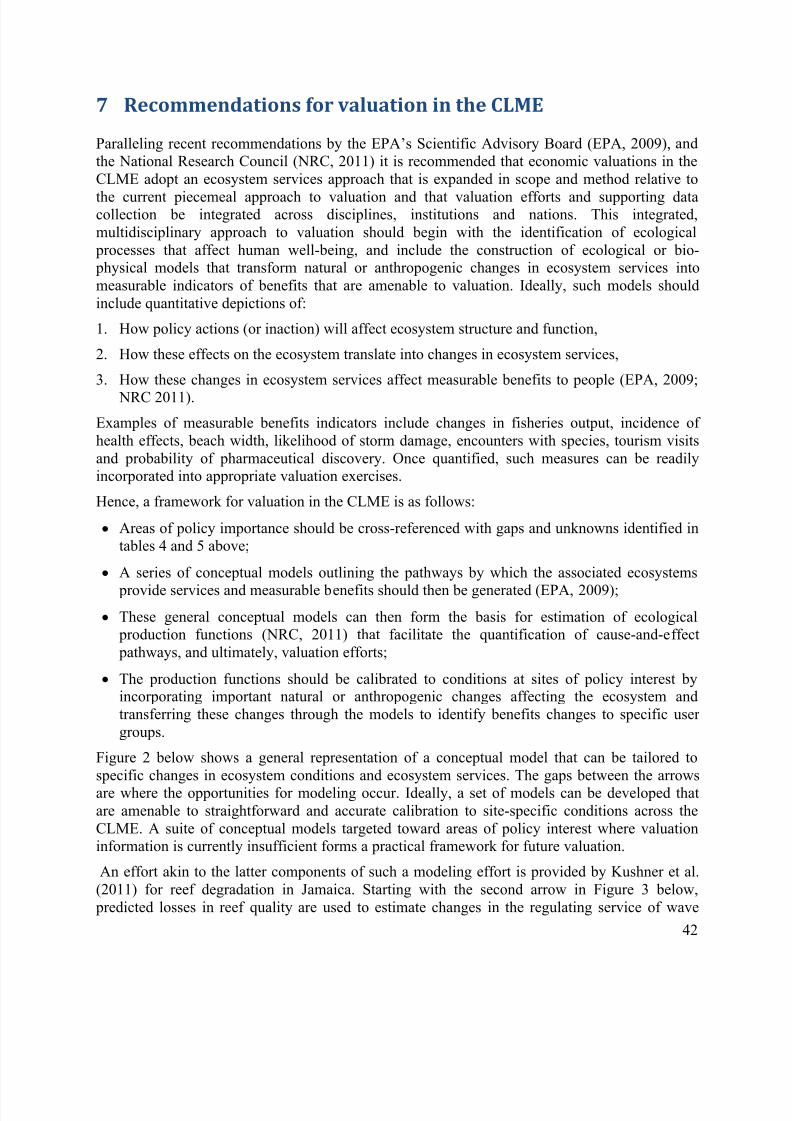
8/13/2019 CLME Marine Resource Valuation 2011 11 17
http://slidepdf.com/reader/full/clme-marine-resource-valuation-2011-11-17 49/61
42
7 Recommendations for valuation in the CLME
Paralleling recent recommendations by the EPA’s Scientific Advisory Board (EPA, 2009), andthe National Research Council (NRC, 2011) it is recommended that economic valuations in theCLME adopt an ecosystem services approach that is expanded in scope and method relative to
the current piecemeal approach to valuation and that valuation efforts and supporting datacollection be integrated across disciplines, institutions and nations. This integrated,multidisciplinary approach to valuation should begin with the identification of ecological processes that affect human well-being, and include the construction of ecological or bio- physical models that transform natural or anthropogenic changes in ecosystem services intomeasurable indicators of benefits that are amenable to valuation. Ideally, such models shouldinclude quantitative depictions of:
1. How policy actions (or inaction) will affect ecosystem structure and function,
2. How these effects on the ecosystem translate into changes in ecosystem services,
3. How these changes in ecosystem services affect measurable benefits to people (EPA, 2009;
NRC 2011).
Examples of measurable benefits indicators include changes in fisheries output, incidence ofhealth effects, beach width, likelihood of storm damage, encounters with species, tourism visitsand probability of pharmaceutical discovery. Once quantified, such measures can be readilyincorporated into appropriate valuation exercises.
Hence, a framework for valuation in the CLME is as follows:
Areas of policy importance should be cross-referenced with gaps and unknowns identified intables 4 and 5 above;
A series of conceptual models outlining the pathways by which the associated ecosystems
provide services and measurable benefits should then be generated (EPA, 2009); These general conceptual models can then form the basis for estimation of ecological
production functions (NRC, 2011) that facilitate the quantification of cause-and-effect pathways, and ultimately, valuation efforts;
The production functions should be calibrated to conditions at sites of policy interest byincorporating important natural or anthropogenic changes affecting the ecosystem andtransferring these changes through the models to identify benefits changes to specific usergroups.
Figure 2 below shows a general representation of a conceptual model that can be tailored tospecific changes in ecosystem conditions and ecosystem services. The gaps between the arrowsare where the opportunities for modeling occur. Ideally, a set of models can be developed thatare amenable to straightforward and accurate calibration to site-specific conditions across theCLME. A suite of conceptual models targeted toward areas of policy interest where valuationinformation is currently insufficient forms a practical framework for future valuation.
An effort akin to the latter components of such a modeling effort is provided by Kushner et al.(2011) for reef degradation in Jamaica. Starting with the second arrow in Figure 3 below, predicted losses in reef quality are used to estimate changes in the regulating service of wave
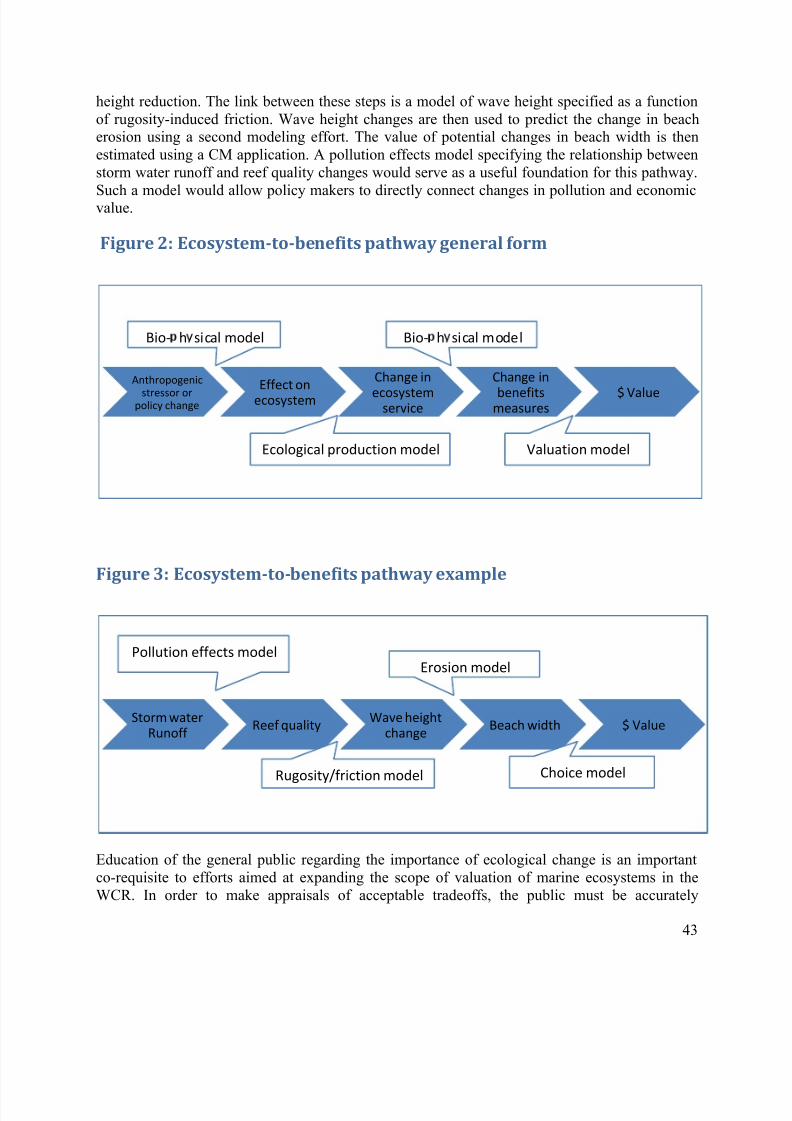
8/13/2019 CLME Marine Resource Valuation 2011 11 17
http://slidepdf.com/reader/full/clme-marine-resource-valuation-2011-11-17 50/61
43
height reduction. The link between these steps is a model of wave height specified as a functionof rugosity-induced friction. Wave height changes are then used to predict the change in beacherosion using a second modeling effort. The value of potential changes in beach width is thenestimated using a CM application. A pollution effects model specifying the relationship betweenstorm water runoff and reef quality changes would serve as a useful foundation for this pathway.
Such a model would allow policy makers to directly connect changes in pollution and economicvalue.
Figure 2: Ecosystem-to-benefits pathway general form
Figure 3: Ecosystem-to-benefits pathway example
Education of the general public regarding the importance of ecological change is an importantco-requisite to efforts aimed at expanding the scope of valuation of marine ecosystems in theWCR. In order to make appraisals of acceptable tradeoffs, the public must be accurately
Anthropogenic
stressor orpolicy change
Effect onecosystem
Change in
ecosystemservice
Change in
benefitsmeasures
$ Value
Storm waterRunoff
Reef qualityWave height
changeBeach width $ Value
Bio- h sical model
Ecological production model
Bio- h sical model
Valuation model
Rugosity/friction model
Pollution effects modelErosion model
Choice model
8/13/2019 CLME Marine Resource Valuation 2011 11 17
http://slidepdf.com/reader/full/clme-marine-resource-valuation-2011-11-17 51/61
44
informed of the human, social and ecological consequences at issue (EPA, 2009). Whenvaluations involve the use of survey instruments, interviews or focus groups, education effortsshould be directly incorporated. However, as such efforts most certainly involve sampling from alarger population, additional efforts should be made to inform the general public of the potentialfor changes in ecosystem services and the associated consequences in terms of costs and benefits
to households and society at large. Importantly, these education efforts should present a scientificappraisal of what stands to be gained or lost under the business-as-usual (BAU) paradigmrelative to that which can be accomplished with improved governance and resource management.
It is also recommended that these outreach efforts be used as an opportunity to identify benefitmeasures of particular concern to different user groups, so that subsequent valuation studies can be directed the indicators of most concern. Ranking or rating exercises that allow respondents toindicate the relative importance of potential effects of policy or BAU will allow researchers tominimize the complexity of valuation exercises and may lend insight into potential valuedifferences across user groups.
8 References
Adamowicz, W., Louviere, J., and Williams, M., 1994. Combining revealed and stated preference methods for valuing environmental amenities. Journal of Environmental Economics and Management 26, 271-292.
Agar, J.J., Shivlani, M., Waters, J.R., Valdés-Pizzini, M., Murray, T., Kirkley, J., and Suman, D.,2005. “U.S. Caribbean Fish Trap Fishery Costs and Earnings Study”, NOAA TechnicalMemorandum NMFS-SEFSC- 534, 127 pp.
Alie, K, 2008. “Whales: More Valuable Alive Than Dead? A Question for Decision Makers inEastern Caribbean Whale-Watching Destinations”, Business, Finance & Economics inEmerging Economies 3, 1.
Allport, R. C., Epperson J. E., 2003. “Willingness to Pay for Environmental Preservation byEcotourism-Linked Businesses: Evidence from the Caribbean Windward Islands”, Dept.
of Agricultural & Applied Economics College of Agricultural & Environmental SciencesUniversity of Georgia.
Arrow, K., Solow, R., Leamer, E., Portney, P. R., Radner, R., and Schuman, H. 1993. “Report of National Oceanic and Atmospheric Administration panel on the reliability of naturalresource damage estimates derived from contingent valuation,” Federal Register 58:4601-4614.
Barbier EB, Koch EW, Silliman B, et al. 2008. Coastal ecosystem based management with non-linear ecological functions and values. Science 319: 321 – 23.
Barbier E.B., Hacker S.D., Kennedy C., Koch E.W., Stier A.C., Silliman B. R., 2011. “The value
of estuarine and coastal ecosystem services”, The Ecological Society of America,
Ecological Monographs, 81, 2, p169-193.
Beekhuis, J.V. 1981. “Tourism in the Caribbean: impacts on the economic, social and naturalenvironments”, Ambio, (10) 6: 325-331
8/13/2019 CLME Marine Resource Valuation 2011 11 17
http://slidepdf.com/reader/full/clme-marine-resource-valuation-2011-11-17 52/61
45
Beharry-Borg, N., and Scarpa, R., 2010. “Valuing quality changes in Caribbean coastal watersfor heterogeneous beach visitors”, Ecological Economics, (69)5: 1124-1139.
Bermuda Department of Conservation Services, 2009. “A summary of the Economic Valuation
of Bermuda’s Coral Reefs” Summary information derived from van Beukering et al.2009. “Total Economic Value of Bermuda’s Coral Reefs”.
Birol, E., Karousakis, K. and Koundouri, P., 2006. “Using economic valuation techniques to
inform water resources management: A survey and critical appraisal of availabletechniques and an application, Science of the Total Environment , 365: 105 – 122.
Bockstael, N. E., M. W. Hanemann, and C. L. Kling. 1987. "Estimating the Value of WaterQuality Improvements in a Recreation Demand Framework." Water Resources
Research.23:951-60.
Bockstael, N. E., Freeman, A.M., Kopp, R.J., Portney, P.R. and Smith, V.K., 2000. "Onmeasuring economic values for nature." Environmental Science and Technology 34:
1384-1389.Boyd and Banzhaf, 2007 J. Boyd and S. Banzhaf, What are ecosystem services? Ecological
Economics, 63 2 – 3 (2007), pp. 616 – 626.
Braden, J., and Kolstad, C. 1991. "Environmental Demand Theory," in Braden and Kolstad(eds.), Measuring the Demand for Environmental Quality, North-Holland, Amsterdam.
Brander, L.M., Van Beukering, P., Cesar, H.S. J., 2006. “The Recreational value of Coral Reefs:A Meta-Analysis”, Ecological Economics, (63):1: 209-218.
Brouwer, Roy, “Environmental Value Transfer: State of the Art and Future Prospects,”
Ecological Economics, 32, 137-152, 2000.
Buchan K., Framhein R., Fernandes L., 1997. “An Economic and Social Study of the SabaMarine Park, Saba, Netherlands Antilles”. CANARI Technical Report No. 262:37 pp.
Bunce, L.L. and Gustavson, K.R. 1998. “Coral Reef Valuation: A Rapid SocioeconomicAssessment of Fishing, Watersports, and Hotel Operations in the Montego Bay MarinePark, Jamaica and an Analysis of Reef Management Implications”, World Bank ResearchCommittee Project #RPO 681-05.
Bunce L., Gustavson, K., Williams, J., and Miller, M., 1999. “The human side of reefmanagement: a case study analysis of the socioeconomic framework of Montego BayMarine Park.”, Coral Reefs, 18: 369-380.
Burke, L., Cooper, E., Greenhalgh, S., and Prager, D., 2008a. “Coastal Capital – Economic
Valuation of Coral Reefs in Tobago and St. Lucia”, World Resource Institute. Burke, L., Greenhalgh, S., Prager, D., Cooper, E., 2008b. “Coastal Capital: Tobago the
Economic Contribution of Tobago’s Coral Reefs”, World Resources Institute.
Burke L., Maidens J., 2004. “Reefs at Risk in the Caribbean”, World Resources Institute,
Washington, D.C.
8/13/2019 CLME Marine Resource Valuation 2011 11 17
http://slidepdf.com/reader/full/clme-marine-resource-valuation-2011-11-17 53/61
46
Burke, L., Selig, E., Spalding, M., 2002. “Reefs at Risk in Southeast Asia”, World ResourcesInstitute, Washington D.C.
Cabrera, M. A., Seijo J. C., Euan, J., and Pérez, E., 1998. “Economic Values of Ecological
Services from a Mangrove Ecosystem”, International Newsletter of Coastal Management,32.
Carleton, C. and Lawrence, K.S. 2005. “Economic Valuation of Environmental Resource
Services in the Turks and Caicos Islands”. Prepared for the Government of the Turks andCaicos Islands by Nautilus Consultants Ltd., Peebles, UK.
Carr, L. M. and Heyman, W. D., 2009. “Jamaica Bound? Marine Resources and Management ata Crossroads in Antigua and Barbuda”, The Geographical Journal , 175(1):17-38.
Carson, R.T. and Mitchell, R.C., 1993. "The Value of Clean Water: The Public's Willingness toPay for Boatable, Fishable, and Swimmable Quality Water," Water Resources Research,29(7): 2445-2454.
Carson, R.T., Wright, J.L., Carson, N., Alberini, A. and Flores, N. 1994. A Bibliography of
Contingent Valuation Studies and Papers. San Diego, CA: Natural Resource DamageAssessment, Inc.
Cartier C., and Ruitenbeek J., 1999. “Marine System Valuation: An Application to Coral ReefSystems in the Developing Tropics”, World Bank Research Committee Project RPO#682-22.
Cesar H., Burke L., Pet-Soede L., 2003. “The Economics of Worldwide Coral Reef
Degradation”, Cesar Environmental Economics Consulting.
Cesar, H. S. J., Öhman, M. C., Espeut, P. & Honkanen, M., 2000. “An Economic Valuation of
Portland Bight, Jamaica: an Integrated Terrestrial and Marine Protected Area”. Working paper 00/03, Institute for Environmental Studies, Free University, Amsterdam.
Chávez E.A., 2007. “Socio-economic Assessment for the Management of the Caribbean SpinyLobster”, Proceedings of the 60th Gulf and Caribbean Fisheries Institute.
Chiwaula, L. and Witt, R. 2010. Technical Guidelines for the Economic Valuation of inland
small-scale fisheries in developing countries, with input from Béné C., Ngoma P., Turpie J. and H. Waibel. Report for the project “Food security and poverty alleviation through
improved valuation and governance of river fisheries in Africa”.
Chong, C. K., Ahmed, M., and Balasubramanian, H., 2003 “Economic Valuation of Coral Reefsat the Caribbean: Literature Review and Estimation Using Meta-Analysis”, Paper presented at the Second International Tropical Marine Ecosystems ManagementSymposium (ITMEMS 2), Manilla, Philippines. March 24-27.
Clark, D. J., Ditton, R. B., Chaparro, R. S., 1994. “The Economic Importance of Recreational
Billfish Angling in Puerto Rico”, Proceedings of the Forty Sixth Annual Gulf and
Caribbean Fisheries Institute, pp. 47-59.
Cline,W. (2008). “Shark diving overview for the islands of the Bahamas”. Nassau, Report of theBahamas Ministry of Tourism. Nassau, Bahamas: Cline Marketing Group.
8/13/2019 CLME Marine Resource Valuation 2011 11 17
http://slidepdf.com/reader/full/clme-marine-resource-valuation-2011-11-17 54/61
47
Conservation International. 2008. “Economic Values of Coral Reefs, Mangroves, and
Seagrasses: A Global Compilation”, Center for Applied Biodiversity Science,Conservation International, Arlington, VA, USA.
Cooper, E., Burke, L. and Bood, N. 2009. “Coastal Capital: Belize. The Economic Contributionof Belize’s Coral Reefs and Mangroves.” WRI Working Paper. World Resources
Institute, Washington DC. 53 pp.[CTO] Caribbean Tourism Organization (2008). “Latest Statistics, 2008”, published October 22,
2008.
Da Costa, Dionne J., 2010. "An Economic Valuation Analysis of Buccoo Reef Marine Park,Tobago, West Indies", FIU Electronic Theses and Dissertations. 290 pp.
Daily, 1997 Nature's Services: Societal Dependence on Natural Ecosystems, Island Press,Washington, DC (1997).
de Groot J. and Bush, S.R., 2010. “The Potential for Dive Tourism Led Entrepreneurial Marine
Protected Areas in Curacao”, Marine Policy, 34: 1051-1059.
de Groot, R.S., Wilson, M.A., Boumans, R.M.J., 2002. A typology for the classification,description and valuation of ecosystem functions, goods and services. Ecological
Economics 41, 393 – 408.
Depondta, F. and Green, E., 2006. “Diving user fees and the financial sustainability of marine protected areas: Opportunities and impediments”, Ocean & Coastal Management 49:188 – 202.
Dharmaratne, G., Sang, F. Y. and. Walling, L. J. 2000. “Tourism Potentials for Financing
Protected Areas.” Annals of Tourism Research, 27 (3): 590-610.
Dharmaratne G. S. and Strand I., 1999. “Approach and Methodology for Natural Resources andEnvironmental Valuation”, UWI Cave Hill, Barbados & University of Maryland, USA.
Ditton, R. B., and Clark, D. J., 1994. “Characteristics, Attitudes, Catch and Release Behavior,and Expenditures of Billfish Tournament Anglers in Puerto Rico” Department of Wildlife
and Fisheries Sciences. Texas A&M University.
Dixon, J., Hamilton, K., Pagiola, S., and Segnestam L., 2001. “Tourism and the Environment inthe Caribbean: An Economic Framework”, Environmental Economics Series, WorldBank.
Dixon, J.A., Scura, L.F., and van’t hof, T.. 1993. Meeting ecological and economic goals—
marine parks in the Caribbean. Ambio, 22: 117 – 125.
Dixon J.A., Scura, L.F., and van’t Hof , T., 1995. “Ecology and Microeconomics as ‘JointProducts’: The Bonaire Marine Park in the Caribbean”, In Perrings, C.A., Mäler, K.G.,Folke, C.,
Holling, C.S., and Jansson, B.O. (eds.) Biodiversity Conservation: Problems and Policies.Kluwer Academic Publishers: Dordrecht.
8/13/2019 CLME Marine Resource Valuation 2011 11 17
http://slidepdf.com/reader/full/clme-marine-resource-valuation-2011-11-17 55/61
48
Dixon, J.A., Scura, L.F. and van’t Hof, T., 2000. “An Economic and Ecological Analysis of the
Bonaire Marine Park”, In: H.S.J. Cesar (ed). Collected Essays on the Economics of CoralReefs. CORDIO, Kalmar University, Sweden. p. 40-54.
Dumas, C.F., P.W. Schuhmann, and J.C. Whitehead, "Measuring the Economic Benefits ofWater Quality Improvement with the Benefit Transfer Method: An Introduction for Non-
Economists," in Larry R. Brown et al., editors, Effects of Urbanization on StreamEcosystems, Bethesda, MD: American Fisheries Society, 2005.
Dyck, A. J. and Sumaila U.R., 2010. “Economic Impact of Ocean Fish Populations in the GlobalFishery”, Journal of Bioeconomics, 12:227 – 243.
Edwards, P., 2008. “Sustainable Financing for Ocean and Coastal Management in Jamaica: ThePotential for Revenues from Tourist User Fees”, Marine Policy, 33: 376-385.
Edwards, P. 2009. “Measuring the Recreational Value of Changes in Coral Reef EcosystemQuality in Jamaica: The Application of Two Stated Preference Methods.” Doctor ofPhilosophy in Marine Studies thesis, University of Delaware.
[EPA] United States Environmental Protection Agency Scientific Advisory Board, 2009.“Valuing the Protection of Ecological Systems and Services: A R eport of the EPAScience Advisory Board”. United States Environmental Protection Agency, WashingtonD.C.
[ETI] Estudios Técnicos Inc. 2007. Valoración económica de los arrecifes de coral y ambientesasociados en el Este de Puerto Rico: Fajardo, Arrecifes La Cordillera, Vieques y Culebra.Informe final. Sometido al: Departamento de Recursos Naturales y Ambientales 27 dediciembre de 2007.
Farber, S., Costanza, R., Childers, D.L., Erickson, J., Gross, K., Grove, M., Hopkinson, C.S.,Kahn, J., Pincetl, S., Austin, T., Warren, P. and Wilson, M., 2006. Linking Ecology and
Economics for Ecosystem Management. Bioscience, 56(2), 121.Fedler, T. 2010. “The Economic Impact of Flats Fishing in The Bahamas”, Report prepared for
The Bahamian Flats Fishing Alliance.
Franklin, G. 2007. Determination of the socio-economic importance of the lobster fishery of theBritish Virgin Islands. CERMES Technical Report No. 8. 59pp.
Geoghegan T., 1998. “Financing Protected Area Management: Experiences from the Caribbean”,Caribbean Natural Resources Institute.
Ghermandi, A., Nunes, P. A. L. D., 2011. “A Global Map of Costal Recreation Values: ResultsFrom a Spatially Explicit Based Meta-Analysis”, Italy.
Gill, D. McConney, P. and Mahon, R., 2007. “Socio-economic profile of fisheries in theGrenadine Islands”, CERMES Technical Report No 11, UWI Cave Hill, Barbados.
Gillet, C.P., Delayney, R., Oxenford, H., 2007.“Recreational Fishing in the British Virgin
Islands: Current Status, Opportunities for Development and Constraints”, CERMESTechnical Report N° 3. University of the West Indies, Cave Hill Campus, Barbados.
Grant, S. 2006. “Managing small-scale fisheries in the Caribbean: the surface longline fishery inGouyave, Grenada”, PhD Dissertation, University of Manitoba, Winnipeg, Manito ba.
8/13/2019 CLME Marine Resource Valuation 2011 11 17
http://slidepdf.com/reader/full/clme-marine-resource-valuation-2011-11-17 56/61
49
Green, E. and Donnelly, R. (2003) “Recreational scuba diving in Caribbean Marine Protected
Areas: do the users pay?”, Ambio, 32(2):140 – 4.
Griffith, W., 2009. “Tourism Trends Issues and Challenges - Implications For CaribbeanEconomies”, International Labor Organization Tripartite Caribbean Conference, Jamaica.
Gustavson K.R., 1998. “Values Associated with the Local Use of the Montego Bay MarinePark”, World Bank Research Committee Project #RPO 681-05.
Gustavson, K. 2002. “Economic production from the artisanal fisheries of Jamaica”. Fisheries
Research 57:103-115.
Haites, E., Pantin, D., Attzs, M., Bruce, J., MacKinnon, J., 2002. “Assessment of the Economic
Impact of Climate Change on CARICOM Countries”, Margaree Consultants Inc.,Toronto, Canada.
Hanley, N., Schlapfer, F. and Spurgeon, J. 2003. “Aggregating the benefits of environmentalimprovements: distance-decay functions for use and non-use values”. Journal of
Environmental Management , 68:297-304.
Hargreaves-Allen V., 2010a. “Economic Values, Distributional Impacts and ConservationOutcomes for Coral Reef Marine Protected Areas.”, PhD Dissertation, Imperial CollegeLondon.
Hargreaves-Allen V., 2010b. “The Economic Valuation of the Natural Resources of Andros”,
Conservation Strategy Fund.
Heyman W.D., Granados-Dieseldorff, P., 2011. “The Manjúa Fishery of Guatemala’s Caribbean:Balancing the Needs for Regional Ecosystem Productivity and National Food Security”,
FOCUS on Geography, 54, 2.
Holder, J.S., 1988. “Pattern and impact of tourism on the environment of the Caribbean”
Tourism Management , (9)2: 119-127.Hoyt, E. 1999. “The potential of whale watching in the Caribbean: 1999+”. Bath, UK: Whale
and Dolphin Conservation Society.
Hoyt, E, 2001. “Whale Watching Worldwide Tourism Numbers, Expenditures and ExpandingSocioeconomic Benefits”, International Fund for Animal Welfare. UNEP.
Hoyt, E. and Hvenegaard G.T., 2002. “A Review of Whale-Watching and Whaling withApplications for the Caribbean”, Coastal Management , 30, 381-399.
Huber, R. 2005. “Capturing ecotourism benefit values in riverine and marine parks:socioeconomic and institutional context of two sites, Montego Bay Marine Park, Jamaica,and the Canaima National Park in Venezuela.” Presented at the symposium and
workshop of the North American Marine Protected Areas Network: benefits andfinancing of MPAs measuring the effectiveness of MPAs, Mexico.
Huber, R. M., & Ruitenbeek, H. J., (eds.) (1997) Marine System Valuation: An Application toCoral Reef Systems in the Developing Tropics. Interim Report to World Bank ResearchCommittee, Project #RPO 681 – 05, World Bank, Washington, D. C.
8/13/2019 CLME Marine Resource Valuation 2011 11 17
http://slidepdf.com/reader/full/clme-marine-resource-valuation-2011-11-17 57/61
8/13/2019 CLME Marine Resource Valuation 2011 11 17
http://slidepdf.com/reader/full/clme-marine-resource-valuation-2011-11-17 58/61
51
the Effects of the Deepwater Horizon Mississippi Canyon-252 Oil Spill on EcosystemServices in the Gulf of Mexico. National Academy Press, Washington, D.C.
Niesten, E., and Gjertsen, H., 2010. “Case Studies of Three Economic Incentive Approaches in
Marine Conservation”, Conservation International and Science to Action.
Nguyen, G.V., Jolly, C.M., 2010. “Seafood Import Demand in the Caribbean Region”,Department of Agricultural Economics and Rural Sociology, Auburn University,Alabama.
Norman, B., and Catlin, J., 2007. “Economic Importance of Conserving Whale Sharks”, Reportfor the International Fund for Animal Welfare (IFAW), Australia.
Parker, C. and Franklin, G. “Characterization of the fish pot fishery of Barbados: Historic trends, present status and recommended management directions”. Unpublished Report, 31pp.
Parsons, G.R. and Kealy, M.J. 1995. "A Demand Theory- for the Number of Trips in a RandomUtility Model of Recreation." Journal of Environmental Economics and Management.29:357-67.
Parsons, G. and Thur, S., 2008. “Valuing Changes in the Quality of Coral Reef Ecosystems: AStated Preference Study of SCUBA Diving in the Bonaire National Marine Park”
Environmental and Resource Economics 40: 593-608.
Pendleton, L.H., 1994. “Environmental Quality and Recreation Demand in a Caribbean Coral
Reef” Coastal Management , 399-404.
Pendleton, L.H. 1995. Valuing coral reef protection. Ocean and Coastal Management , 26(2):119-131.
Planter, M.R. and Piña, C.M., 2006. Fees for Reefs: Economic Instruments to Protect Mexico’s
Marine Natural Areas, Instituto Nacional de Ecología.
Plantier Santos, C. 2010. Ecosystem Services Visualized . PowerPoint Presentation. HarteResearch Institute for Gulf of Mexico Studies.
Plummer, M. L., 2009. “Assessing benefit transfer for the valuation of ecosystem services”, Front Ecol Environ, 7: 38-45.
Portney, P. R. 1994. “The Contingent Valuation Debate: Why Economists Should Care”, The
Journal of Economic Perspectives, 8(4): 3-17.
Potts, A. C., Thomas, A. D., and Nichols, E., 2003. “An Economic and Social Assessment of theFlying Fish (Pelagic) Fishery of Tobago, Trinidad and Tobago”, Proceedings of the Fifty
Fourth Annual Gulf and Caribbean Fisheries Institute, pp. 635-649.
Putterman, D.M., 1998. “Access to Marine Genetic Resources in Jamaica: Incorporating Genetic
Resources Utilization into Integrated Coastal Zone Management A Study of Policies andInstitutions”, Genetic Resources Consulting, World Bank, Washington DC.
Reid-Grant, K. and Bhat, M.G., 2009. “Financing Marine Protected Areas in Jamaica: AnExploratory Study”, Marine Policy, 33: 128-136.
8/13/2019 CLME Marine Resource Valuation 2011 11 17
http://slidepdf.com/reader/full/clme-marine-resource-valuation-2011-11-17 59/61
52
Raboteur, J. and Rodes, M-F. 2006. "Application of the contingent valuation method to coralreefs in the Caribbean: study applied to the area of Guadeloupe Pigeon", Vertigo 7(1): 1-17.
Rudd M. A., 2003. “Fisheries Landings and Trade of the Turks and Caicos Islands”, FisheriesCentre Research Reports, 11(6): 149:161.
Rudd, M. A., Danylchuk, A. J., Gore, S. A., and Tupper, M. H., 2001 “Are Marine Protected
Areas in the Turks and Caicos Islands Ecologically or Economically Valuable?”, In:Economics of Marine Protected Areas. - Vancouver, Canada : UBC Fisheries Centre.
Ruitenbeek, J. and Cartier, C. 1999. “Issues in applied coral reef biodiversity valuation:resultsfor Montego Bay, Jamaica”. World Bank Research Committee Project RPO# 682-22.
Ruitenbeek J., Ridgley, M., Dollar, S., Huber, R., 1999. “Optimization of Economic Policies andInvestment Projects using a Fuzzy Logic based Cost-effectiveness Model of Coral ReefQuality: Empirical Results for Montego Bay, Jamaica”, Final Report, World BankResearch Committee Project RPO# 680-08.
Sary, Z, 2001. “The Small Scale Reef Fishery on the Central North Coast of Jamaica in 2000-2001: A Biological and Socio-economic Survey” Caribbean Marine Protected AreasProject, British Virgin Islands. ICLARM Caribbean/ Eastern Pacific Office, Tortola,BVI.
Salas, S., Chuenpagdee, R., Seijo, J., and Charles, A. 2007. “Challenges in the assessment and management of small-scale fisheries in Latin America and the Caribbean”. Fisheries
Research, 87(1):5-16.
Salas, S., Sumaila, U.R., and Pitcher, T., 2004. “Short-term decisions of small-scale fishersselecting alternative target species: A choice model”, Can. J. Fish. Aquat. Sci., 61: 374 –
383.Sary, Z., Munro J. L., Woodley J. D., 2003. “Status Report on a Jamaican Reef Fishery: Current
Value and the Costs of Non-management”, Proceedings of the Fifty Fourth Annual Gulfand Caribbean Fisheries Institute, pp. 98-146.
Schuhmann, P.W. and J.E. Easley Jr., 2000. "Modeling Recreational Catch and Dynamic StockAdjustments: An Application to Commercial-Recreational Allocation", Land Economics,76(3): 430-447.
Schuhmann, P.W., Oxenford, H.A., Staskiewicz, T. and Walcott, J., 2009. “Economic Valuation
of the Fisheries of Barbados: Second Project Report, Landings, Costs, Net Profit andReturn on Investment in two Contrasting Fisheries: Part 1: The Longline Fishery.”
Barbados Fisheries Division.Schuhmann, P.W., H. A. Oxenford, T. Staskiewicz and D. Gill 2011. Landings, costs, net profit
and return on investment in two contrasting fisheries. Part 2: The trap fishery. Third project report on the economic valuation of fisheries in Barbados, Fisheries Division,Ministry of Agriculture, Barbados, 59pp.
8/13/2019 CLME Marine Resource Valuation 2011 11 17
http://slidepdf.com/reader/full/clme-marine-resource-valuation-2011-11-17 60/61
53
Schuhmann, P., Casey, J., Horrocks, J. and Oxenford, H. 2011. “The Economic Value of Marine
Biodiversity to Recreational SCUBA Divers in Barbados”, unpublished manuscript,University of North Carolina Wilmington.
Shultz, S., Pinazzo, J. and Cifuentes, M., 1998. “Opportunities and Limitations of ContingentValuation Surveys to Determine National Park Entrance Fees: Evidence from Costa
Rica”, Environment and Development Economics, 3: 131-149.Smith, V.K., W.H. Desvousges, and M.P. McGivney. 1983. The Opportunity Cost of Travel
Time in Recreational Demand Models. Land Economics 59(3):259 – 77.
Spash, C.L., 2000. “Assessing the Benefits of Improving Coral Reef Biodiversity: TheContingent Valuation Method” In: H.S.J. Cesar (ed). Collected Essays on the Economics
of Coral Reefs. CORDIO, Kalmar University, Sweden. p. 40-54.
Spash, C.L., Bosch, v., Westmacott, S., and Ruitenbeek, J., 2000. “Lexicographic preferencesand the contingent valuation of coral reef biodiversity in Curaçao and Jamaica”. In K.Gustavson, R. M. Huber and J. Ruitenbeek (eds.) Integrated Coastal Zone Managementof Coral Reefs: Decision Support Modelling Washington DC: The World Bank, 2000 pp.97-117.
Steiner A., McCormick S. J., Johnson I., 2004. “How Much is an Ecosystem Worth?: Assessing
the Economic Value of Conservation”, The World Bank, Washington, DC.
TEEB, 2009. The Economics of Ecosystems and Biodiversity for National and InternationalPolicy Makers – Summary: Responding to the Value of Nature”. United NationsEnvironment Programme.
Terk, E. and Knowlton, N. 2008. “The role of SCUBA diver user fees as a source of sustainable
funding for coral reef marine protected areas” Tropical Conservancy, 11(1): 78-84.
Thur, S.M., 2010. “User Fees as Sustainable Financing Mechanisms for Marine Protected Areas:
An Application to the Bonaire National Marine Park”, Marine Policy, 34: 63-69.Tsounta, E., 2008. “What Attracts Tourists to Paradise?”, IMF Working Paper WP/08/277,
International Monetary Fund Western Hemisphere Department.
[U.N.] United Nations, 2004. “Marine Mineral Resources: Scientific Advances and EconomicPerspectives”, United Nations Division for Ocean Affairs and the Law of the Sea, Office
of Legal Affairs, and the International Seabed Authority.
Uyarra, M.C. 2002. Evaluation of the potential economic impacts of climate change on thetourism industry on two Caribbean islands: Bonaire and Barbados. MSc thesis,University of East Anglia, Norwich, UK.
Uyarra, M.C., Côté, I.M., Gill, J.A., Tinch, R.R.T., Viner, D., & Watkinson, A.R. 2005. “IslandSpecific Preferences of Tourists for Environmental Features: Implications of ClimateChange for Tourism-Dependent States”. Environmental Conservation, 32: 11-19.
Uyarra, M.C., Gill, J.A., Côté, I.M., 2010. “Charging for Nature: Marine Park Fees and
Management from a User Perspective”, AMBIO, 39, 515-523.
8/13/2019 CLME Marine Resource Valuation 2011 11 17
http://slidepdf.com/reader/full/clme-marine-resource-valuation-2011-11-17 61/61
Vail C.S., 2005. “Socio-Economic Assessment of Marine Mammal Utilization in the WiderCaribbean Region: Captivity, Viewing and Hunting”, United Nations EnvironmentProgram.
van Beukering, P.J.H., S. Sarkis, E. McKenzie, S. Hess, L. Brander, M. Roelfsema, L.Looijenstijn-van der Putten, and T. Bervoets 2009. “Total Economic Value of Bermuda’s
Coral Reefs: Valuation of Ecosystem Services”. Report provided to the BermudaDepartment of Conservation Services.
van’t Hof, T., 1998. “Social and Economic Impacts of Marine Protected Areas: A Study andAnalysis of Selected Cases in the Caribbean”, CANARI technical Re port No. 252.
Vergara, W., Deeb, A.M., Mira-Salama, D., 2008. “The Consequences of Climate-InducedCoral Loss in the Caribbean by 2050-2080”, World Bank.
Vogel, J., 1997. “The successful use of economic instruments to foster sustainable use of biodiversity: six case studies from Latin America and the Caribbean”. Biopolicy Journal ,2:1.
Waite, R., E. Cooper, N. Zenny and L. Burke. 2011. Coastal Capital: Jamaica. The EconomicValue of Jamaica’s Coral Reef -Related Fisheries. Working Paper. Washington, DC:World Resources Institute and The Nature Conservancy.
Wallace, 2007 K.J. Wallace, Classification of ecosystem services: problems and solutions. Biological Conservation, 139 (2007), pp. 235 – 246.
Walling L. J., 1996. “A Total Economic Assessment of the Conser vation Benefits of theMontego Bay Marine Park, Montego Bay, Jamaica”, Master’s Thesis, University of theWest Indies.
Waterman, T., 2009. “Assessing Public Attitudes and Behavior Toward Tourism Development inBarbados: Socio-Economic and Environmental Im plications”, Central Bank of Barbados.
Wielgus, J., Cooper, E., Torres, R., and Burke, L. 2010. “Coastal Capital: Dominican Republic.
Case studies on the economic value of coastal ecosystems in the Dominican Republic.”Working Paper. Washington, DC: World Resources Institute.
Whitehead, J.C., 2000, A Practitioner’s Primer on Contingent Valuation, Working Papers, EastCarolina University, Department of Economics.
Woodfield, N.K., 1997. “The Wreck of the Rhone Marine Park, British Virgin Islands”,
CANARI.
Woodward, R. T., and Wui, Y., 2001. “The economic value of wetland services: a meta-analysis”, Ecological Economics, 37: 257 – 270
[WRI] World Resources Institute, 2005. Millennium Ecosystem Assessment: Living beyond OurMeans - Natural Assets and Human Well-Being. Washington (DC): World ResourcesInstitute.


![Poster Presentation: Caribbean Large Marine Ecosystem (CLME) Project [IWC4 Innovation Marketplace]](https://img.pdfslide.net/doc/110x75/55aaffb41a28ab8e288b4610/poster-presentation-caribbean-large-marine-ecosystem-clme-project-iwc4-innovation-marketplace.jpg)