Embed Size (px)
Citation preview

Cloning, Expression and Production of Vicia faba Leghemoglobin B
Master’s thesis in Applied Biochemistry, KBK820
Name: Gustav Lindéus
Supervisor: Nélida Leiva Eriksson
Examiner: Leif Bülow

2
Abstract In this thesis a preliminary evaluation of the potential of a leghemoglobin (Lb) for the
development of a blood substitute in humans, resembling hemoglobin (Hb) in red blood cells,
was conducted. Leghemoglobin B (VfLbB), a gene from Vicia faba, was cloned into a pET-
DEST42 vector, using the Gateway™ recombination technology. The recombinant vector
containing VfLbB was sequenced and confirmed. Then it was transformed into an Escherichia
coli BL21-DE3 strain. Seven shake flasks experiments, with volumes ranging from 250 to 660
ml, were conducted. One experiment was dedicated to constructing a bacterial growth curve and
the rest to express VfLbB. In four out of these six protein expression experiments, various
parameters related to the induction of VfLbB expression were optimized. The two last shake
flasks experiments were conducted with the optimized conditions. After the shake flask
experiments, the production was scaled up to a five liter fermenter, where three fermentations
were carried out. The first fermentation was dedicated to construct a bacterial growth curve and
the other two to express VfLbB. Cells from the optimized shake flask cultivations and from the
fermentations were sonicated in order to extract VfLbB. Attempts were done to purify VfLbB by
carrying out ion exchange chromatography. Two different media were used: CaptoS (cation
exchange) and QFF (anion exchange). Unfortunately, no positive results were obtained
indicating that the purification needs to be further optimized.

3
Table of Contents Abstract ......................................................................................................................................................... 2
Purpose .......................................................................................................................................................... 5
Background ................................................................................................................................................... 5
Hemoglobin............................................................................................................................................... 5
Plant hemoglobins ..................................................................................................................................... 6
Leghemoglobins ........................................................................................................................................ 7
Vicia faba – broadbean ............................................................................................................................. 8
Recombination based cloning ................................................................................................................... 8
Material and methods .................................................................................................................................... 9
Choice of gene .......................................................................................................................................... 9
Gene cloning ............................................................................................................................................. 9
Plasmid cloning ..................................................................................................................................... 9
Digestion and restricted plasmid recovery .......................................................................................... 10
Recombinant plasmid construction ..................................................................................................... 11
Shake flask cultivations .......................................................................................................................... 13
Growth curve of E. coli with pET-DEST42-VfLbB ............................................................................ 14
VfLbB expression: initial optimization ............................................................................................... 14
Time of Induction optimization .......................................................................................................... 15
IPTG concentration optimization ........................................................................................................ 15
Ala concentration optimization ........................................................................................................... 15
Optimized conditions .......................................................................................................................... 15
Sonication ............................................................................................................................................... 16
VfLbB expression analysis ..................................................................................................................... 16
CO essay ................................................................................................................................................. 16
Fermentation ........................................................................................................................................... 17
Media and pre-culture ......................................................................................................................... 18
Growth curve of E. coli with pET-DEST42-VfLbB ............................................................................ 18
VfLbB expression in fermentor .......................................................................................................... 18
Purification .............................................................................................................................................. 18
Results and discussion ................................................................................................................................ 20
Gene cloning ........................................................................................................................................... 20
pCloneEZ-VfLbB cloning and linearization ........................................................................................ 20
4
Expression plasmid construction ........................................................................................................ 21
Shake flask experiments ......................................................................................................................... 23
Growth curve of E. coli with pET-DEST42-VfLbB ............................................................................ 23
VfLbB expression: initial optimization ............................................................................................... 25
Time of Induction optimization .......................................................................................................... 25
IPTG concentration optimization ........................................................................................................ 25
Ala concentration optimization ........................................................................................................... 26
Optimized conditions .......................................................................................................................... 27
Fermenter ................................................................................................................................................ 27
Bacterial growth curve of E. coli with pET-DEST42 ......................................................................... 27
VfLbB expression ............................................................................................................................... 29
Dynamics interpretation ...................................................................................................................... 29
CO essay ................................................................................................................................................. 31
Purification results .................................................................................................................................. 32
Future research ........................................................................................................................................ 34
References ................................................................................................................................................... 35
Appendix 1 .................................................................................................................................................. 37
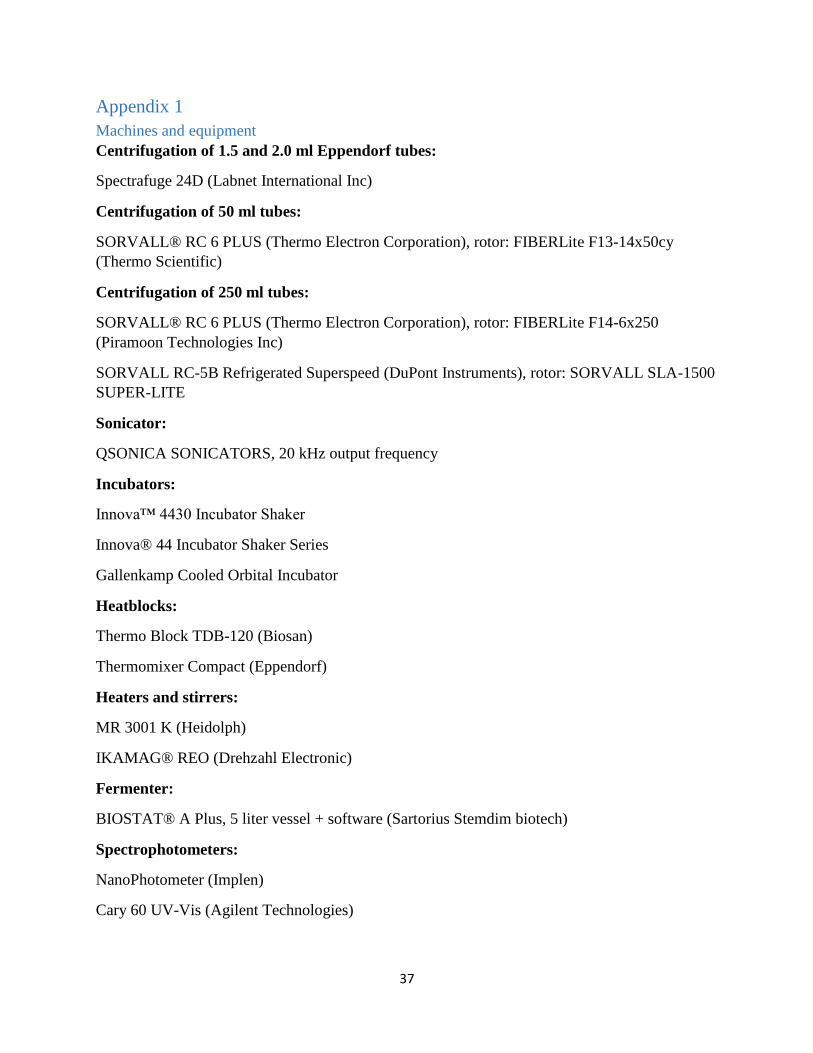
Machines and equipment ........................................................................................................................ 37
Appendix 2 .................................................................................................................................................. 39
VfLbB expression: initial optimization................................................................................................... 39
Time of Induction optimization .............................................................................................................. 41
IPTG concentration optimization ............................................................................................................ 42
Ala concentration optimization ............................................................................................................... 43
Optimized conditions .............................................................................................................................. 44
Appendix 3 .................................................................................................................................................. 46
VfLbB spectra ......................................................................................................................................... 46
Appendix 4 .................................................................................................................................................. 49
Fermentation data .................................................................................................................................... 49
Appendix 5 .................................................................................................................................................. 52
Chromatograms ....................................................................................................................................... 52
Appendix 6 .................................................................................................................................................. 56
Microbial kinetics calculations: .............................................................................................................. 56

5
Purpose The purpose of this thesis is to clone the gene of Leghemoglobin B from Vicia faba (VfLbB) in
Escherichia coli BL21-DE3 in order to over-express it and purify it. The project is a preliminary
stage to evaluate the potential of a leghemoglobin (Lb) for the development of a blood substitute
in humans, resembling hemoglobin (Hb) in red blood cells.
Background
Hemoglobin
Hemoglobin (Hb) is a protein found in red blood cells, which are a major fraction of the blood.
Its main function is to transport oxygen in the body, but it also has a function to carry hydrogen
ions and carbon dioxide. In highly evolved vertebrates, Hb is a tetramer, i.e. consists of four sub-
units: two α- and two β-chains. The α- and β-chains differ from each other. They, however, share
a homology which is called the globin fold. Globins consist of eight α-helices with loop
structures linked in between. Six of these helices are in a bundle and two are paired in an
antiparallel manner. These structures altogether create an active site (Berg, et al., 2006) (Branden
& Tooze, 1999).
Each sub-unit contains heme, a prosthetic group. This is located in the active site of the globin
fold. The structure of heme has a centrally located iron atom, where the oxygen binds. This atom
is surrounded by an organic component, which consists of four pyrrole rings. The components in
heme build up a plane, in which the unoxidized iron, Fe2+, does not fit within. When oxygen
binds to the iron atom, it oxidizes the iron from a larger Fe2+ to a slightly smaller Fe3+ ion. This
decrease in size of the iron atom enables it to fit within the heme plane and consequently the
heme structure changes. Thus, hemoglobin has two forms, deoxyhemoglobin, which has no
oxygen bound, and oxyhemoglobin, which has the oxygen bound (Berg, et al., 2006).
Moreover, a proximal histidine is linked to the heme-group. Oxygen is bound to Hb in a
cooperative manner between the four sub-units. This means that once the first oxygen molecule
has been bound to the first sub-unit, the binding of the next molecule is facilitated to the second
sub-unit, followed by the third and the fourth (Berg, et al., 2006). Hb has a 250 times greater
affinity for carbon monoxide (CO) than for oxygen. Consequently, Hb binds carbon monoxide

6
instead of oxygen when it is present and this gives rise to hypoxia, followed by death (Kim &
Greenburg, 2013).
Another oxygen carrying protein in the human body is myoglobin (Mb). The main function of
Mb is to store oxygen. It consists of one sub-unit which is structurally similar to the sub-units of
Hb, i.e. also contain a globin fold with heme (Berg, et al., 2006). In humans, two Hbs exists:
adult Hb (AHb) and fetal Hb (FHb). FHb is formed in fetuses and its oxygen affinity is higher
than AHb. Due to the higher affinity, oxygen transport to the fetus is facilitated during
pregnancies (Alberts, et al., 2007). A single mutation in one of the two α-chains gives rise to this
affinity difference (Kim & Greenburg, 2013).
Using Hb as a blood substitute has been a research phenomenon since the end of the 19th century.
This field is now known as hemoglobin based oxygen carriers (HBOC). Introducing free Hb into
the bloodstream has, however, throughout the years, showed toxic effects. Free Hb is, due to its
small size, filtered out by the kidneys and it is also toxic to the nephrons. Furthermore, being
encapsulated by red blood cells seems to be a crucial factor for Hb. The reducing enzymes found
inside the red blood cells seems to be more prominent than those found in blood plasma, e.g.
toxic reactive oxygen species and also the non-oxygen binding methylated Hb tend to form in
plasma. Crossing the blood vessel barriers is another drawback of having Hb in a free form. To
prevent these toxic effects, research dedicated to modify the Hb molecule, e.g. PEGylation, have
been conducted (Kim & Greenburg, 2013).
Plant hemoglobins
Hb also exists in plant species and there are three variants: non-symbiotic (nsHb), truncated
(trHb) and symbiotic (sHb). Among these three types of plant Hbs, functional and structural
studies of nsHbs and trHbs have not been widely conducted, in contrast to sHbs.
SHbs are present in root noodles of plants. These noodles are in symbiosis with the nitrogen-
fixing bacteria genera rhizobia (Hoy & Hargrove, 2008). The rhizobia bacteria convert the
atmospheric nitrogen to ammonia via a nitrogenase enzyme and consequently the plant is able to
grow in nitrogen limiting soil. The extent of converted nitrogen is dependent on the amount of
expressed sHb (Willey, et al., 2010). Due to the fact that the concentration of free oxygen must
be kept low for the nitrogenase in order to function, the sHb have a high oxygen affinity, i.e. low
dissociation and high oxygen association rates (Hoy & Hargrove, 2008).

7
In nsHbs and trHbs, this symbiotic relationship does not occur. These are located in multiple
parts in the plants, including in the noodles. Expression of trHbs and nsHbs are induced by
various factors, e.g. hypoxia and hormone signals (Hoy & Hargrove, 2008). Leiva Eriksson et al.
(2014) showed e.g. that nsHbs in sugar beets are expressed differentially. sHbs and nsHbs are
similar in a manner that they both have the conventional globin fold structure. TrHbs, on the
other hand, have a truncated fold structure (Hoy & Hargrove, 2008). Similarly to the typical fold
structure, there are two antiparallel α-helices, but the bundle is built up from four α-helices rather
than six. Thus, the structure is truncated and slightly shorter in amino acid sequence (Milani, et
al., 2001). The oxygen affinities among nsHbs differ and they are divided into two groups: class
I and class II. The first class has higher oxygen affinity than the second (Hoy & Hargrove, 2008).
Leghemoglobins
The plants that usually contain sHbs are the family Leguminosae, i.e. legumes. Thus, the most
common definition of sHbs is leghemoglobins (Lb) (Hoy & Hargrove, 2008). Lbs are
monomeric and includes heme, hence structurally similar to Mb (Vinogradov & Kapp, 2012). In
order to supply a microaerobic environment to the nitrogen fixing bacteria, which is required by
the nitrogenases, the oxygen affinity of Lbs is high (Willey, et al., 2010). Compared to nsHbs,
which vary in oxygen affinities, different kinds of Lbs have similar affinities (Vinogradov &
Kapp, 2012).
Recombinant leghemoglobins have been produced from several legumes, including soybean and
Lupinus luteus, yellow lupine. To enable over-expression of the Lbs, these experiments used an
isopropyl β-D-1-thiogalactopyranoside (IPTG) inducible promoter in their expression systems,
E. coli BL21-DE3 (Hoy & Hargrove, 2008) (Kundu, et al., 2004) (Sikorski, et al., 1995)
(Prytulla, et al., 1996). Experiments of other recombinant Hbs have shown that expression levels
and yields can be enhanced, e.g. Ratanasopa (2015) demonstrated that by adding CO and δ-
aminolevulinic acid (Ala) when producing human FHb. Ala is involved in the synthesis of heme
and can be depleted.
Soybean Lb is the most studied Lb. Hargrove et al. (1997) applied site-directed mutagenesis to
His61 soybean Lb, in order to evaluate how the oxygen binding kinetics was affected. Hargrove
et al. (1997) also compared different spectra of soybean Lb in different conformation states. The
maxima for the oxy-state, Fe(II)O2 and the carbon monoxide state, Fe(II)CO, occur at different
8
wavelengths: 409 and 416 nm. Deoxygenation of Hbs can be achieved by introducing sodium
dithionite (NaD) to the molecules. This method is beneficial because the protein structure is
preserved (Wireko & Abraham, 1992).
Vicia faba – broadbean
Vicia faba, also called broad bean, is a legume of high popularity in Europe and Middle East. In
Sweden, it was a common source of food until the 1940s and is now gradually making a
comeback (Oregon State University, 2010) (Wikipedia, 2016). There exists several Lb genes in
V. faba and they are all expressed in different amounts in the legume noodles (Kuhse & Pühler,
1987) (Perlick & Pühler, 1993). The VfLbB is a protein with a size of 15.8 kDa and a pI of 7.7,
which is close to the pI of human Hb (Frühling, et al., 1997). Its oxygen affinity has not been
determined and there is no extinction coefficient available.
Recombination based cloning
In this project, the Gateway® Technology will be used in the gene cloning phase. This is a
cloning strategy that solely relies on recombination, i.e. no restriction enzyme or ligase is
needed, and is derived from the recombination system in the lambda phage (Invitrogen (a),
2010).
The DNA fragments involved in this technology are the gene of interest, i.e. VfLbB, a donor
vector and a destination vector. All these include attachment (att) recombination sites. There are
two recombinations in this technology: the BP and the LR reaction. Firstly, the gene of interest
recombines with the donor vector, pDONR, creating an entry clone. Secondly, the entry clone
recombines with the destination vector, pET-DEST42, creating the expression clone. The first
reaction is catalyzed by the BP Clonase™ II and the second by the LR Clonase™ II. After each
of the two recombination reactions, the resulting DNA is transformed into competent cells,
followed by selection on LB plates. The donor vector has a kanamycin resistance gene and the
pET-DEST42 vector has an ampicillin resistance gene. Furthermore, the pET-DEST42 vector
has a T7-lac promoter (Invitrogen (a), 2010) (Invitrogen (b), 2010).

9
Material and methods
In this section a detailed methodology of the experiments will be presented. The list and details
of the equipment used is presented in appendix 1. The experiments were conducted at the
Division of Pure and Applied Biochemistry at Faculty of Engineering, Lund University.
Choice of gene
The Division of Pure and Applied Biochemistry at Faculty of Engineering, Lund University,
aimed to produce a recombinant leghemoglobin. The underlying decision to choose the VfLbB
gene was based on discussion with responsible persons at the division. These discussions were
based on previous research conducted in the field. The main reasons to choose the VfLbB gene
were that its protein has not been produced recombinantly before and that it has a pI which is
close to the one of human Hb.
Gene cloning
Plasmid cloning
The purpose of conducting the plasmid cloning step was to obtain a high initial plasmid
concentration. VfLbB (GenBank Accession No. Z54157 (NCBI, 2005)) was custom synthesized
by Epoch Biolabs and was obtained within a plasmid, containing attB recombination sites,
pCloneEZ-VfLB (Fig. 1). 2 µl of plasmid (50 ng/µl) was transformed into E. coli TG1 cells (200
µl) using heat-shock transformation. First, the cells were incubated together with ice for 30 min.
Then, they were heated in a 42oC heating block for 90 seconds and subsequently cooled down on
ice for approximately one minute. Afterwards, 800 µl of LB media was added and the tube was
horizontally shook for 60 min at 37oC and 225 rpm, from this 200 µl was plated onto LB plates,
containing 100 µg/ml ampicillin. After the plates had dried, they were inverted and kept
overnight in a 37oC incubator. A positive and a negative control were also plated. Five colonies
were picked and transferred into a glass tubes each containing 5 ml LB media plus ampicillin
(100 µg/ml). These tubes were cultivated 16 hours in a horizontally shaking incubator, 150 rpm,
at 37oC.

10
Figure 1. pCloneEZ-VfLb, the original plasmid. The blue bars in the right side of the figure
indicate the location of the VfLbB gene and the PvuI restriction site is located at position 1493
(Epoch Biolabs, 2016).
The pCloneEZ-VfLB plasmid was isolated from the cells using the E.Z.N.A. ® Plasmid DNA
Mini Kit I. The extraction was done according to the manual with two exceptions. First, the
membranes of the used columns were activated with 100 µl 3M NaOH; second, the plasmids
were eluted with 50 µl of sterile MilliQ water. The plasmid was eluted twice with the same 50 µl
in order to obtain a higher plasmid concentration. The concentrations of the samples were
measured spectrophotometrically and the DNA fragments were separated on a 1.5% agarose gel
at 110 V. The remaining pDNA samples were stored at -18oC.
Digestion and restricted plasmid recovery
Three samples of the purified plasmids were cut by the restriction enzyme PvuI (Table 1). This
enzyme cuts once at position 1493bp, outside the positions VfLbB occupies (327 to 849bp) (Fig.
1). The online tool Webcutter 2.0 was used to find the enzyme (Heiman, 1997). Thus, the whole
plasmid was linearized. The reactions were set up as showed in Table 1.

11
Table 1. Digestion reaction with PvuI.
Sample DNA
(µl)
10x buffer
(µl)
Autoclaved H2O
(µl)
Enzyme
(µl)
Total volume
(µl)
1 27.9 3.5 2.6 1.0 35
4 24.2 3.0 1.8 1.0 30
5 16.2 2.0 0.8 1.0 20
The three reactions were incubated in a heat block at 37oC for 30 minutes. The digested plasmids
mixed with loading dye 6X were loaded on two 1.5% agarose gels with 110 V. In the first gel, to
visualize the results, 5ul plasmid was used. The rest of the samples were loaded on the second
gel in order to recover only the linearized plasmid containing VfLbB from the agarose.
This recovery was carried out according to the instructions in the manual of Nucleospin® Gel
and PCR Clean-up with some exceptions. The linearized plasmids were eluted with 25 µl of
sterile MilliQ water, this was repeated twice. The concentrations of the linearized plasmids were
measured spectrophotometrically and then stored at -18oC.
Recombinant plasmid construction
BP reaction
The main purpose of this reaction is to create the entry clone pDONR-VfLbB. VfLbB will
recombine with the donor vector (pDONR). The first linearized plasmid containing VfLbB, was
mixed on ice with the following components, supplied by Invitrogen™, see table 2:
Table 2. Components in the BP reaction, BP clonase enzyme not included.
Component Sample 1 Sample 2 Positive control Negative control
DNA
(79.2 ng from 16.9
ng/µl)
4.7 µl 4.7 µl - 4.7 µl
pDONR 1 µl 1 µl 1 µl 1 µl
pEXP7-tet - - 2 µl -
TE buffer 2.3 µl 2.3 µl 5 µl 4.3 µl

12
To calculate of the amount of DNA needed in BP reaction, equation 1, was used:
m = (fmol)(N)(660 𝑓𝑔
𝑓𝑚𝑜𝑙)(
1 𝑛𝑔
106 𝑓𝑔) (1)
where m is the mass in ng. 50 fmol was used, since an equimolar relation to the donor vector
would be used. The letter N stands for base pair and is the number of base pairs in the linearized
fragment, derived from the digestion. The calculated required amount of DNA was 79.2 ng.
After these components were mixed, 2 µl of BP Clonase™ enzyme was added to the two
samples and the positive control. The reaction mixtures were then incubated in a heating block
for 16.5 hours at 25oC. The reactions were stopped by adding 1 µl Proteinase K to each of the
tubes. All the resulting reaction mixtures were used to transform each 55 µl of One Shot®
OmniMAX™ 2 T1 Phage-Resistant E. coli cells according to the instructions given in the
Gateway clonase II manual (Invitrogen (a), 2010).
The transformed cells were spread onto LB plates, which had kanamycin (50 µg/ml). These
plates were then incubated for 17 hours at 37oC. Five colonies, probably containing VfLbB
inserted to pDONR, were picked and transferred into five glass tubes containing 5 ml LB media
and 50 µg/ml kanamycin. These tubes were cultivated 17 hours in a horizontally shaking
incubator at 37oC and 150 rpm. The plasmid of these cultivations were extracted as described
above. The concentrations of the Entry Clones (pDONR-VfLbB), were spectrophotometrically
measured and the DNA fragments analyzed on a 1.5% agarose gel with 110 V.
LR reaction
The main purpose of this reaction is to create the final clone, pET-DEST42-VfLbB. For this
pDONR-VfLbB will recombine with the destination vector (pET-DEST42). The components of
the LR reaction, supplied by Invitrogen™, were mixed according to Table 3 and kept on ice.
After these components were mixed, 2 µl of LR Clonase™ enzyme was added to the two
samples and the positive control. The reaction mixtures were then incubated in a heating block
for 16.5 hours at 25oC. The reactions were stopped by adding 1 µl Proteinase K to each of the
tubes and then transformed into 55 µl One Shot® OmniMAX™ 2 T1 Phage-Resistant Cells
according to the instructions given in the Gateway clonase II manual (Invitrogen (a), 2010).
13
The transformed cells including the positive and the negative controls were spread onto LB
plates containing ampicillin (100 µg/ml). These plates were then incubated for 17 hours at 37oC.
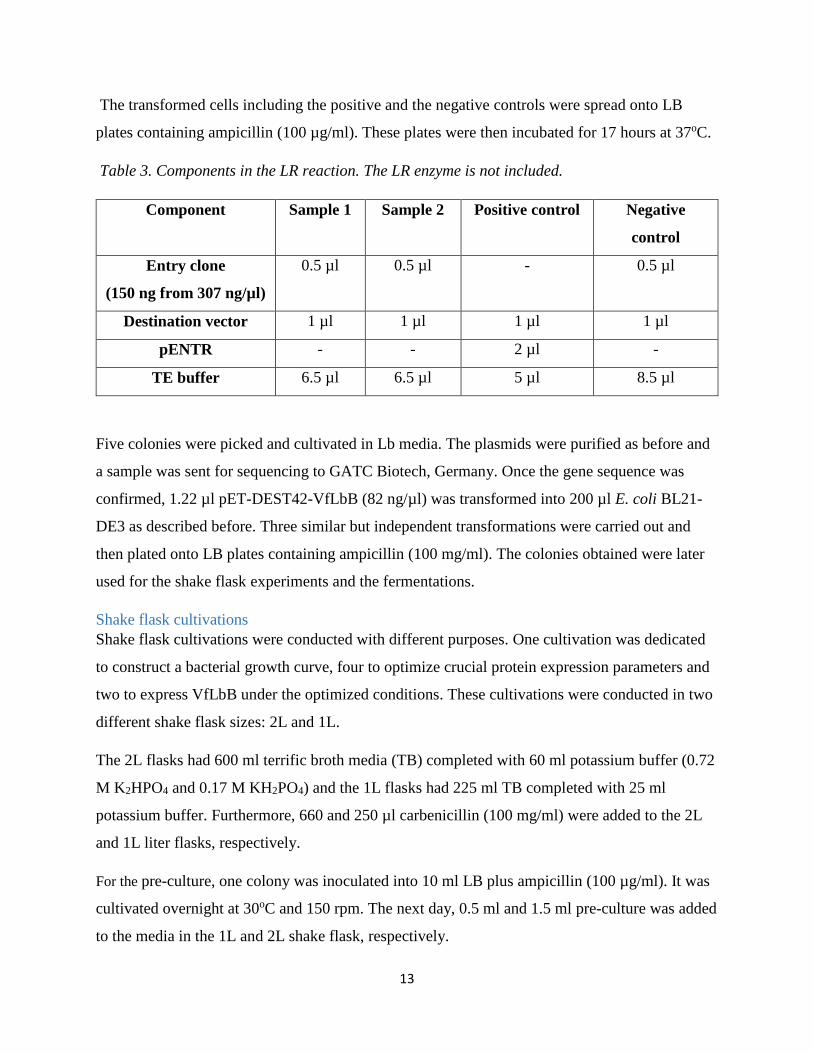
Table 3. Components in the LR reaction. The LR enzyme is not included.
Five colonies were picked and cultivated in Lb media. The plasmids were purified as before and
a sample was sent for sequencing to GATC Biotech, Germany. Once the gene sequence was
confirmed, 1.22 µl pET-DEST42-VfLbB (82 ng/µl) was transformed into 200 µl E. coli BL21-
DE3 as described before. Three similar but independent transformations were carried out and
then plated onto LB plates containing ampicillin (100 mg/ml). The colonies obtained were later
used for the shake flask experiments and the fermentations.
Shake flask cultivations
Shake flask cultivations were conducted with different purposes. One cultivation was dedicated
to construct a bacterial growth curve, four to optimize crucial protein expression parameters and
two to express VfLbB under the optimized conditions. These cultivations were conducted in two
different shake flask sizes: 2L and 1L.
The 2L flasks had 600 ml terrific broth media (TB) completed with 60 ml potassium buffer (0.72
M K2HPO4 and 0.17 M KH2PO4) and the 1L flasks had 225 ml TB completed with 25 ml
potassium buffer. Furthermore, 660 and 250 µl carbenicillin (100 mg/ml) were added to the 2L
and 1L liter flasks, respectively.
For the pre-culture, one colony was inoculated into 10 ml LB plus ampicillin (100 µg/ml). It was
cultivated overnight at 30oC and 150 rpm. The next day, 0.5 ml and 1.5 ml pre-culture was added
to the media in the 1L and 2L shake flask, respectively.
Component Sample 1 Sample 2 Positive control Negative
control
Entry clone
(150 ng from 307 ng/µl)
0.5 µl 0.5 µl - 0.5 µl
Destination vector 1 µl 1 µl 1 µl 1 µl
pENTR - - 2 µl -
TE buffer 6.5 µl 6.5 µl 5 µl 8.5 µl
14
The expression of VfLbB was induced with IPTG and Ala. After induction, the temperature was
decreased to 22oC and the incubator was covered to keep the flasks in darkness. The cells were
incubated overnight after induction and harvested the next morning.
For harvesting, 250 ml centrifuge bottles were used. These were filled with around 200 ml media
and centrifuged for 10 min. at 10000 rpm. The replicates of each experiment were harvested
together, unless the color of the pellets where very different within a condition. This was usually
decided by pre-evaluating the color of the pellet in 1.5 ml Eppendorph tubes. This pellet, was a
result from 4.5 ml culture taken from each flask and centrifuged three times at 10 000 rpm for 1
min each time discarding the supernatant in between.
The pellets of the 250 ml bottles were then transferred to 50 ml Sarstedt tubes. This transference
was aided by the addition of 5 ml lysis buffer. The 50 ml tubes, containing the pellet, were
centrifuged for 15 minutes at 12 000 rpm, the supernatants were discarded, and the tubes
inverted over paper to absorb all the liquid. The wet paste weight was determined and then the
tubes were snap-frozen in liquid nitrogen and stored at -80oC.
Growth curve of E. coli with pET-DEST42-VfLbB
The first experiment was to determine the growth curve of E. coli carrying the recombinant
plasmid. Three independent cultivations in 2L liter shake flasks, each with a total volume of 660
ml, were carried out. In this experiment optical density measurements at OD600 were taken every
hour for 31 hours with an exception between hour 14 and 23. The expression of VfLbB was not
induced. From this experiment, the specific growth rate and generation time were calculated to
be 1.37 h-1 and 30.3 minutes, using the formulas presented in appendix 6.
VfLbB expression: initial optimization
A first experiment was carried out under pre-determined conditions as initial point in order to see
if VfLbB was expressed. The cultivation was done in 2L flaks, and the cells were induced after
six hours of cultivation at OD600 3 ± 0.5. IPTG and Ala were added to a final concentration of 0.5
mM and 0.3 mM, respectively and the cells were bubbled with CO (20-30 sec). The entire
cultivation was done at 150 rpm and in triplicate.
Since the addition of CO helps the heme to be attached to the globin apo-protein, the time of
addition of this gas was tested. Thus CO was added by the time of induction or just after
harvesting the cells. For this, VfLbB was cultivated in 1L shake flasks and its expression induced

15
at OD600 0.8 and 1.5. Additionally, two different stirring speeds were tried during the entire
cultivation, 80 and 150 rpm. The flasks were induced with 0.5 mM IPTG and 0.3 mM Ala. Each
condition described here was carried out in duplicate. In total sixteen flaks were cultivated
(Appendix 2, Tables 12-22).
Time of Induction optimization
VfLbB was induced at three different OD600. At the beginning of the cultivation, 1.0 and 2.0. In
this case, CO was also added either by induction or harvesting. The concentration of IPTG and
Ala was the same as in the initial optimization. The stirring rate was 150rpm. These experiments
were carried out in 1L shake flasks and triplicates. Each of the six different conditions was done
in triplicates (Appendix 2, Tables 23-30).
IPTG concentration optimization
Four different IPTG concentrations were investigated: 0.1, 0.3, 0.6 and 0.9 mM. The OD600 for
induction was between 1.5 and 2.0. A final Ala concentration of 0.3 mM was used and CO was
added by induction. This experiment was done in 1L shake flasks and in triplicates for each
IPTG concentration.
Multiple OD600 samples were taken during the cultivation and to enhance the accuracy as well as
compensate for the decrease in volume, the volume which the calculated IPTG concentrations
was based on was 240, rather than 250, (Appendix 2, Tables 31-36).
Ala concentration optimization
By induction, which was when the OD600 was in the interval of 1.5 to 2.0, four different Ala
concentrations were tested: 0.1, 0.3, 0.6 and 0.9 mM. IPTG was added to a final concentration of
0.3 mM and CO was added by induction.
The entire cultivation was stirred at 150 rpm. Each condition, was done in triplicates in 1L shake
flasks. The volume for final ALA concentration was corrected as with IPTG optimization to
240ml. The induced amount of IPTG was 72 µl 1 M IPTG (0.3 mM), the stirring rate was 150
rpm, (Appendix 2, Tables 37-42).
Optimized conditions
Two separate cultivations were conducted with the optimized conditions from previous shake
flask experiments. The induction was done at OD600 between 1.5 and 2.0, CO was added by
16
induction and the stirring rate was 150rpm. IPTG and Ala were added to a final concentration of
0.3 and 0.9 mM, respectively.
The volume was corrected to 650ml/flask as previously done with IPTG and Ala concentration
optimizations. The cultivation had a total of 4L equally distributed in six 2L shake flasks,
(Appendix 2, Tables 43-45).
Sonication
The frozen cells were thawed in water baths at room temperature. To normalize the protein
content, the volume of lysis buffer was twice the pellet weights, e.g. six ml buffer was added to
three grams of cells. The cells were completely resuspended in the buffer by vortexing. The cells
were then sonicated with a two second ON pulse and three second OFF pulse with an output
frequency of 20 kHz. The sonication amplitude of the samples was ranging from 40 to 65%,
going from lower to higher.
After sonication, the lysates were centrifuged at 12 000 rpm, 4oC, for 40 minutes, followed by
transferring the supernatant, crude extract, to new tubes.
VfLbB expression analysis
CO essay
The crude extract was spectrophotometrically analyzed to determine the leghemoglobin content.
Lysis buffer was used as blank and for dilution of the samples. A first absorbance of the sample
was taken and then a second one after the addition of a few grains of NaD and bubbling with 1
ml of CO gas.
To obtain a quantitative measure of VfLbB in the crude extract a three-point drop correction was
used. This correction uses an interpolation concept between those adjacent wavelengths,
according to figure 2 and equation 2, note that it is essential to use the equation together with the
figure (Owen, 1996). In this correction, two absorbance values at appropriately chosen
wavelengths are taken into account, except from the analytical absorbance, i.e. VfLbB at
approximately 420 nm. Although, a high absorbance is reached, there may be interfering
background of contaminants to a various extent and this correction method corrects for this
background.

17
Figure 2. Three-point correction.
𝑅𝑒𝑎𝑙 𝑎𝑏𝑠𝑜𝑟𝑏𝑎𝑛𝑐𝑒 = 𝐶 − 𝐴+𝐵
2 (2)
In the initial optimization, the Lb content was compared using real absorbance volume per grams
of cells (AbsV/W). In the following expression analyses the extinction coefficient from Lb of L.
luteus at wavelength 417 nm and pH 8.5 was used. This coefficient is 190 mM-1 cm-1 and
enabled conversion of the real absorbance values to concentration units (Fasman, 1989). From
the concentration, c, milligrams of VfLbB per gram of cells (mg LbB/gr) was used as the
evaluation unit.
These calculations were conducted according to formula 3-4:
𝑐 = 𝐴
𝜀∗𝑙∗ 𝐷𝐹 (3)
𝑚 =(𝑐∗𝑀)
1000∗ 𝑉 (4)
Where A stands for real absorbance, ɛ, the extinction coefficient, l the cuvette length, DF, the
dilution factor, m, the mass in mg, M the molecular weight of VfLbB and V the volume of the
VfLbB sample. The cuvette length was 1 cm.
Fermentation
Three fermentations were conducted: one was dedicated to construct a bacterial growth curve
and two to express VfLbB. The fermentations were conducted according to a fermentation

18
protocol (Leiva Eriksson, 2016). In this protocol there are also recipes for the used solutions and
media.
Media and pre-culture
A pre-culture was made by transferring one colony into a 10 ml LB tube containing 100 µg/ml
ampicillin. The pre-cultures were cultivated between 8 to 14 hours at 30oC and 150 rpm- This
pre-culture was added into a 300 ml DM starter which was incubated for another 11 to 15 hours
at 30oC and 150 rpm. The DM starter was inoculated to the fermenter containing three liter DM
media. The fermentations were conducted in fed-batch mode with a gradual addition of 70%
glucose solution. The feeding profiles were manually written with percentage as the main unit.
One percent is equal to 10 ml/hour.
Growth curve of E. coli with pET-DEST42-VfLbB
OD600 samples were taken every hour, except from a break between hours 14 to 23, see appendix
4. Using the formulas in appendix, the specific growth rate and generation time were calculated
to 0.32 h-1 and 2.14 hours. The oxygen sensor did not work during this fermentation and
therefore parameters such as the base, pH, and glucose concentration had to be carefully
observed. Therefore, the glucose profile for the growth curve was changed multiple times, see
appendix 4.
VfLbB expression in fermentor
Two fermentations were carried out where the two different OD600 were tested: 30 and 50. These
values was obtained by graphically comparing the logarithmic bacterial growth curves from
fermenter and shaking flasks (Fig 8 and 10). The bacteria were induced with 0.3 mM IPTG and 4
mM Ala. Before induction, the temperature was 30oC, and after it was changed to 22oC. Also the
oxygen was set to 2.5% and the cells were protected from light. Compared to the fermentation
where the growth curve was generated, the oxygen sensor worked and the two fermentations
could thus rely more on automation, see appendix 4 for parameter details. The cells of
fermentation two and three were harvested and independently lysed in a similar manner as the
shaking flasks.
Purification
The purpose of this phase is to partially separate VfLbB from other molecules. One sample from
the shake flasks experiments with optimized conditions and the two samples (OD600 30 and
OD600 50) from the fermenter were purified. After lysing, the resulting crude extracts were
19
dialyzed. The three samples were split into half each, i.e. six samples, and dialyzed against to
two different four liter buffers: NaP (Na2HPO4-NaH2PO4) 10 mM pH 6.0 and Tris-HCl 50 mM
pH 8.5. Due to the fact that the molecular weight of VfLbB is 15.8 kDa, the dialysis membranes
were chosen to have a molecular cut off weight of 6-8 kDa. The dialysis was conducted for 17
hours at 4oC with continuous stirring.
The clarified samples were analyzed by the CO essay to confirm the LbB activity. Cation
(CaptoS) and anion (QFF) exchange chromatography were then conducted. The CaptoS used a
10 mM NaP pH 6.0 solution as equilibrium and binding buffer. The elution buffer was 70 mM
NaP pH 7.8. Regarding the QFF, a 50 mM Tris-HCl pH 8.5 solution was used as equilibrium and
binding buffer. For the elution, a 50 mM Tris-HCl pH 7.8 buffer with 0.1 M NaCl was used.

20
Results and discussion In this section the experimental results and discussion will be presented. The results are in
chronological order, i.e. from the cloning phase, to shake flasks and fermentation. Additional
data, e.g. sub-results are presented in appendix 1-5.
Gene cloning
pCloneEZ-VfLbB cloning and linearization
Bacterial colonies appeared onto the LB plates. Moreover, colonies were absent on the negative
control and present on the positive one. The plasmid purification results from the - plasmid
cloning are presented in table 4 and its corresponding gel in figure 3. Among the five samples,
sample three had a low A260/A230 ratio, which means that it had contamination of organic
components, ethanol in particular. A possible reason why this ratio was low, could be that the
drying step in the plasmid purification was too short. The A260/A280 ratios were high, which
means that the samples had low protein contamination. Furthermore, when observing the gel, the
plasmids in sample two do not seem to be entire. Thus, because of the low A260/A230 ratio in
sample three and non-entire plasmids in sample two, sample one, four and five were decided to
be used in the following experiment, the PvuI restriction enzyme digestion.
Table 4. Sample concentration and absorbance ratios after the plasmid purification of
pCloneEZ-VfLbB. Samples 1, 4, and 5 were chosen to be digested with PvuI.
Sample [DNA] ng/µl A260/A280 A260/A230
1 35.8 1.946 1.532
2 45.7 1.917 1.586
3 87.0 1.862 0.941
4 41.3 2.202 1.627
5 61.6 1.968 1.425
Figure 3. Purified pCloneEZ-VfLbB, after plasmid cloning.

21
The results from the PvuI digestion are presented in table 5 and figure 4. All the three bands are
located below bp 2500, which concludes that the digestion was successfully conducted, since the
size of the linear fragment is 2402 bp (Fig. 1). There is a weak band above the digested plasmids
and this is most likely representing undigested plasmids. In order to avoid contamination, this
band was not extracted from the gel, only the properly restricted and linearized plasmids were
extracted. In contrast to the previous plasmid purification, all the purified DNA samples had
rather low A260/A230 ratios, indicating high ethanol content in the samples. As before, the
reason for this could be a too short drying step. A suggestion for improvement would be to
increase the drying time from one minute to two minutes. Sample one, the one with the highest
A260/A230 ratio, was decided to be used in the next following experiment, the BP reaction.
Table 5. DNA concentrations and ratios, after digestion with PvuI and extraction from agarose
gel. Sample 1, 4, and 5 from table 4, were used for restriction
Sample [DNA] ng/µl A260/A280 A260/A230
1 (1 in table 4) 16.9 2.000 0.493
2 (4 in table 4) 17.9 1.895 0.316
3 (5 in table 4) 21.4 1.792 0.361
Figure 4. After digestion by the restriction enzyme.
Expression plasmid construction
BP reaction
After the BP reactions and their transformation, colonies appeared on the sample LB plates.
Furthermore, the positive control had also colonies while in the negative control colonies were

22
absent indicating that the transformation was successful. Five colonies were picked from the LB
reaction plate for further cultivation. Three of these were purified, since two of the tubes were
transparent, indicating no bacterial growth.
The entry clone concentrations of the three purified samples are presented in table 6 and the
results from its corresponding gel in figure 5. This purification was successfully conducted, since
all three samples had high DNA concentrations and absorbance ratios. Sample two was decided
to be used in the following experiment, the LR reaction, since it had the highest A260/A230
ratio.
Table 6. Entry clone concentration measurements and ratios. Sample one from Table 4 was used
for BP reaction.
Sample [DNA] ng/µl A260/A280 A260/A230
1 460 1.896 2.190
2 307 1.893 2.227
3 214 1.878 1.963
Figure 5. Purified entry clone.
LR reaction
The LR reaction was successfully conducted. The positive control had colonies and the negative
one no colonies, simultaneously as colonies appeared onto the sample LB plates. Five colonies of
these were picked for further cultivation and three of these resulting cultivations were decided to
be purified, since two of the tubes were transparent, indicating no bacterial growth.
The results from the plasmid purification of the final clone, pET-DEST42-VfLbB, are presented
in table 7 and its corresponding gel in figure 6. The concentrations and ratios were lower,
23
compared to the ones after the BP reaction. Furthermore, sample three did not have entire
plasmids. Sample two, containing pET-DEST42-VfLbB, were sent for sequencing and was
confirmed to be correct, along with sample two, among the entry clone samples. The colonies
from this transformation were used in the cultivation experiments.
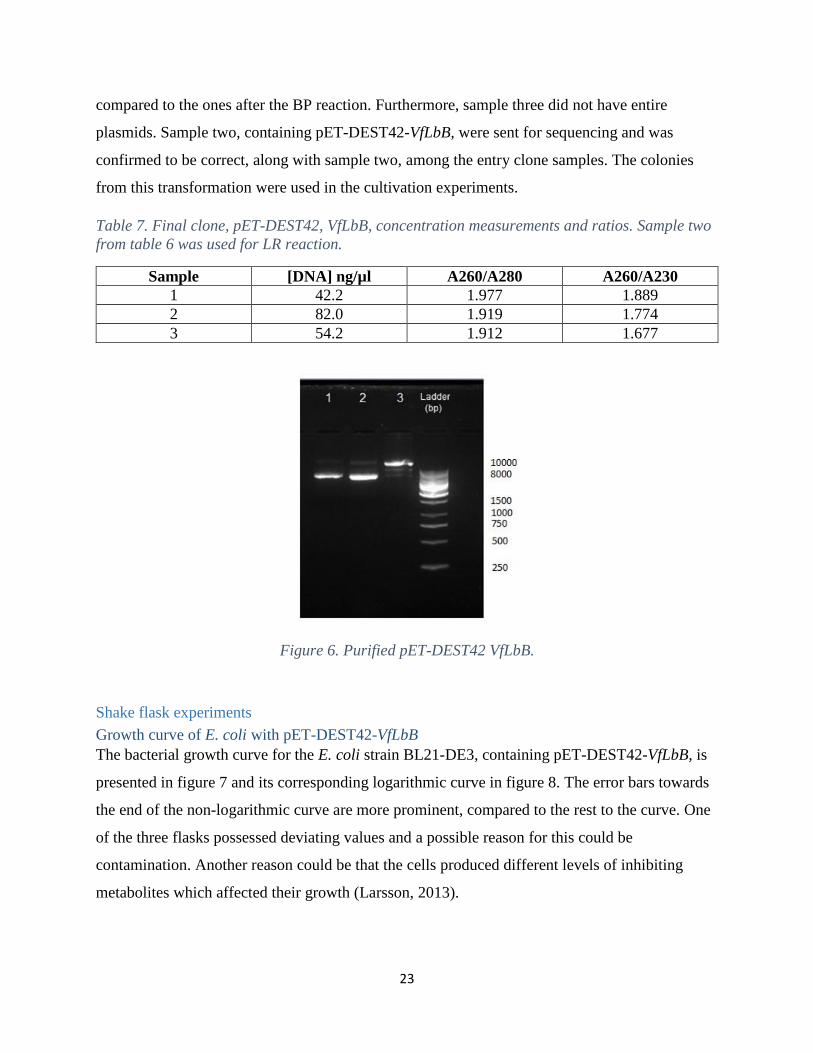
Table 7. Final clone, pET-DEST42, VfLbB, concentration measurements and ratios. Sample two
from table 6 was used for LR reaction.
Sample [DNA] ng/µl A260/A280 A260/A230
1 42.2 1.977 1.889
2 82.0 1.919 1.774
3 54.2 1.912 1.677
Figure 6. Purified pET-DEST42 VfLbB.
Shake flask experiments
Growth curve of E. coli with pET-DEST42-VfLbB
The bacterial growth curve for the E. coli strain BL21-DE3, containing pET-DEST42-VfLbB, is
presented in figure 7 and its corresponding logarithmic curve in figure 8. The error bars towards
the end of the non-logarithmic curve are more prominent, compared to the rest to the curve. One
of the three flasks possessed deviating values and a possible reason for this could be
contamination. Another reason could be that the cells produced different levels of inhibiting
metabolites which affected their growth (Larsson, 2013).
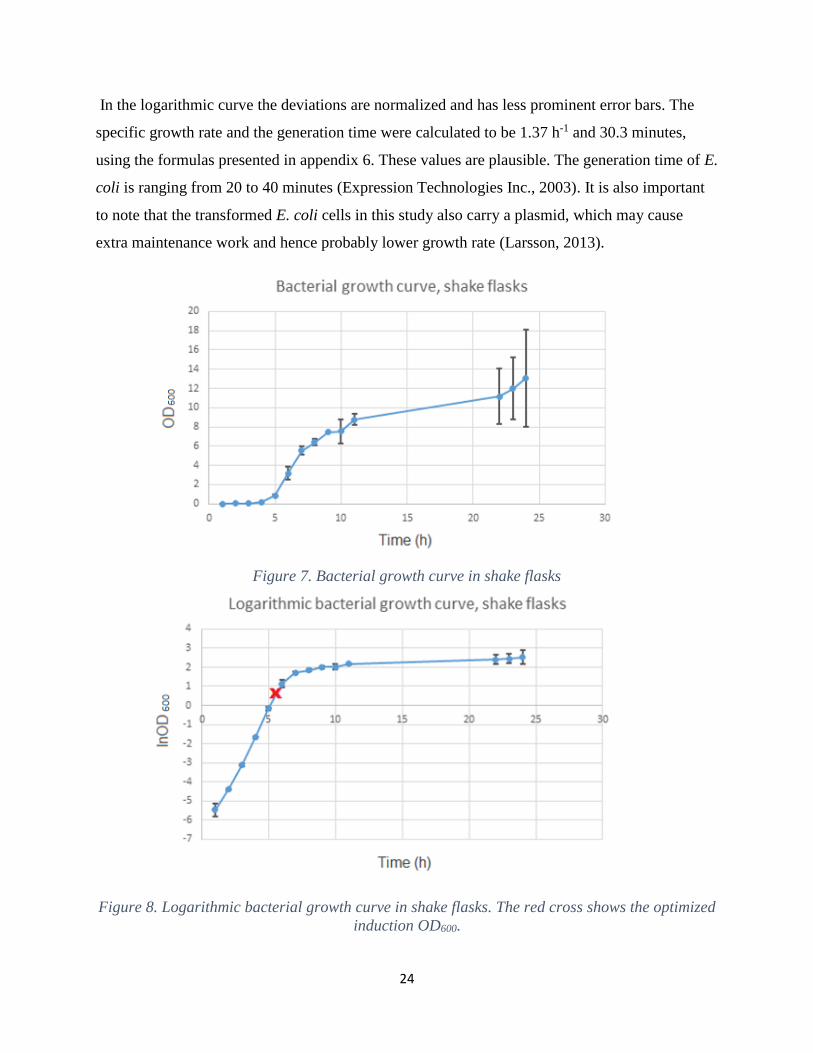
24
In the logarithmic curve the deviations are normalized and has less prominent error bars. The
specific growth rate and the generation time were calculated to be 1.37 h-1 and 30.3 minutes,
using the formulas presented in appendix 6. These values are plausible. The generation time of E.
coli is ranging from 20 to 40 minutes (Expression Technologies Inc., 2003). It is also important
to note that the transformed E. coli cells in this study also carry a plasmid, which may cause
extra maintenance work and hence probably lower growth rate (Larsson, 2013).
Figure 7. Bacterial growth curve in shake flasks
Figure 8. Logarithmic bacterial growth curve in shake flasks. The red cross shows the optimized
induction OD600.
25
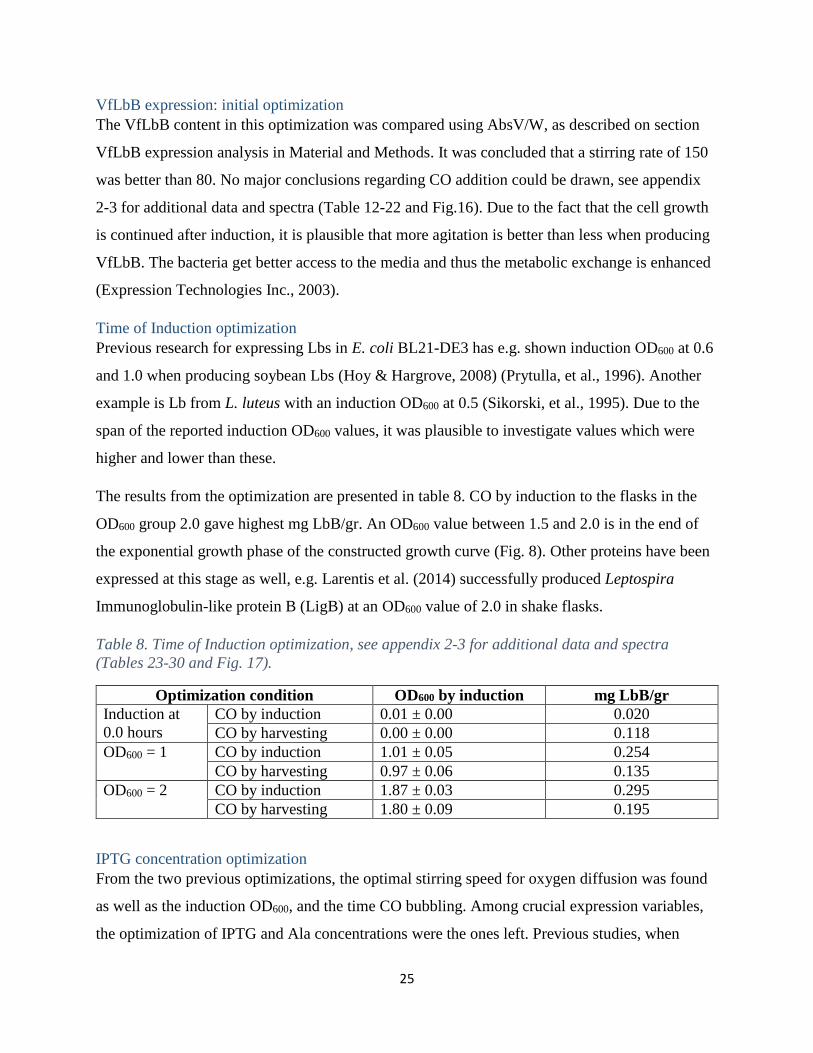
VfLbB expression: initial optimization
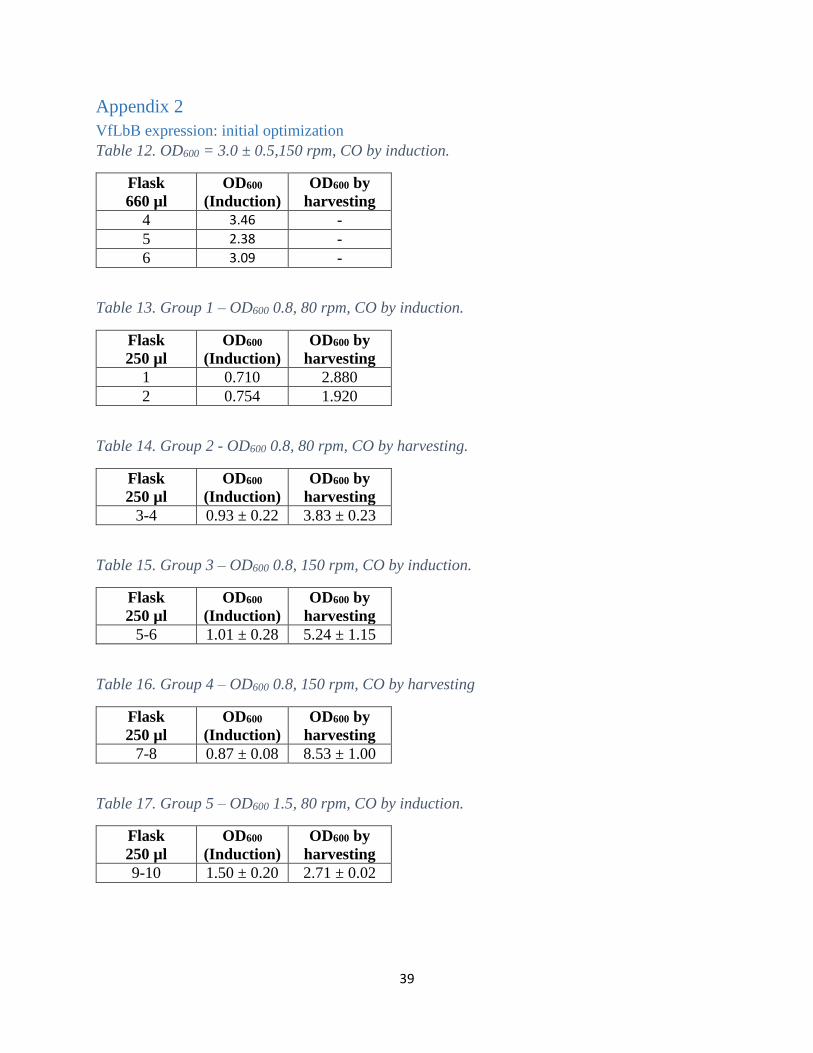
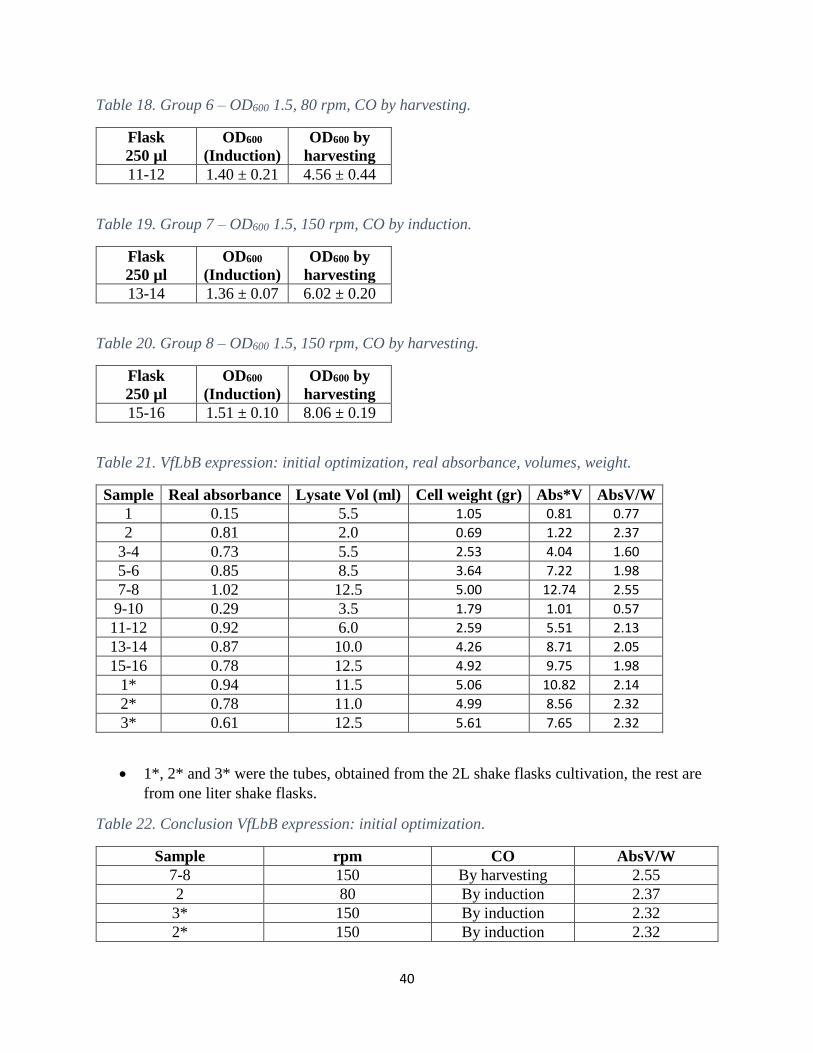
The VfLbB content in this optimization was compared using AbsV/W, as described on section
VfLbB expression analysis in Material and Methods. It was concluded that a stirring rate of 150
was better than 80. No major conclusions regarding CO addition could be drawn, see appendix
2-3 for additional data and spectra (Table 12-22 and Fig.16). Due to the fact that the cell growth
is continued after induction, it is plausible that more agitation is better than less when producing
VfLbB. The bacteria get better access to the media and thus the metabolic exchange is enhanced
(Expression Technologies Inc., 2003).
Time of Induction optimization
Previous research for expressing Lbs in E. coli BL21-DE3 has e.g. shown induction OD600 at 0.6
and 1.0 when producing soybean Lbs (Hoy & Hargrove, 2008) (Prytulla, et al., 1996). Another
example is Lb from L. luteus with an induction OD600 at 0.5 (Sikorski, et al., 1995). Due to the
span of the reported induction OD600 values, it was plausible to investigate values which were
higher and lower than these.
The results from the optimization are presented in table 8. CO by induction to the flasks in the
OD600 group 2.0 gave highest mg LbB/gr. An OD600 value between 1.5 and 2.0 is in the end of
the exponential growth phase of the constructed growth curve (Fig. 8). Other proteins have been
expressed at this stage as well, e.g. Larentis et al. (2014) successfully produced Leptospira
Immunoglobulin-like protein B (LigB) at an OD600 value of 2.0 in shake flasks.
Table 8. Time of Induction optimization, see appendix 2-3 for additional data and spectra
(Tables 23-30 and Fig. 17).
Optimization condition OD600 by induction mg LbB/gr
Induction at
0.0 hours
CO by induction 0.01 ± 0.00 0.020
CO by harvesting 0.00 ± 0.00 0.118
OD600 = 1 CO by induction 1.01 ± 0.05 0.254
CO by harvesting 0.97 ± 0.06 0.135
OD600 = 2 CO by induction 1.87 ± 0.03 0.295
CO by harvesting 1.80 ± 0.09 0.195
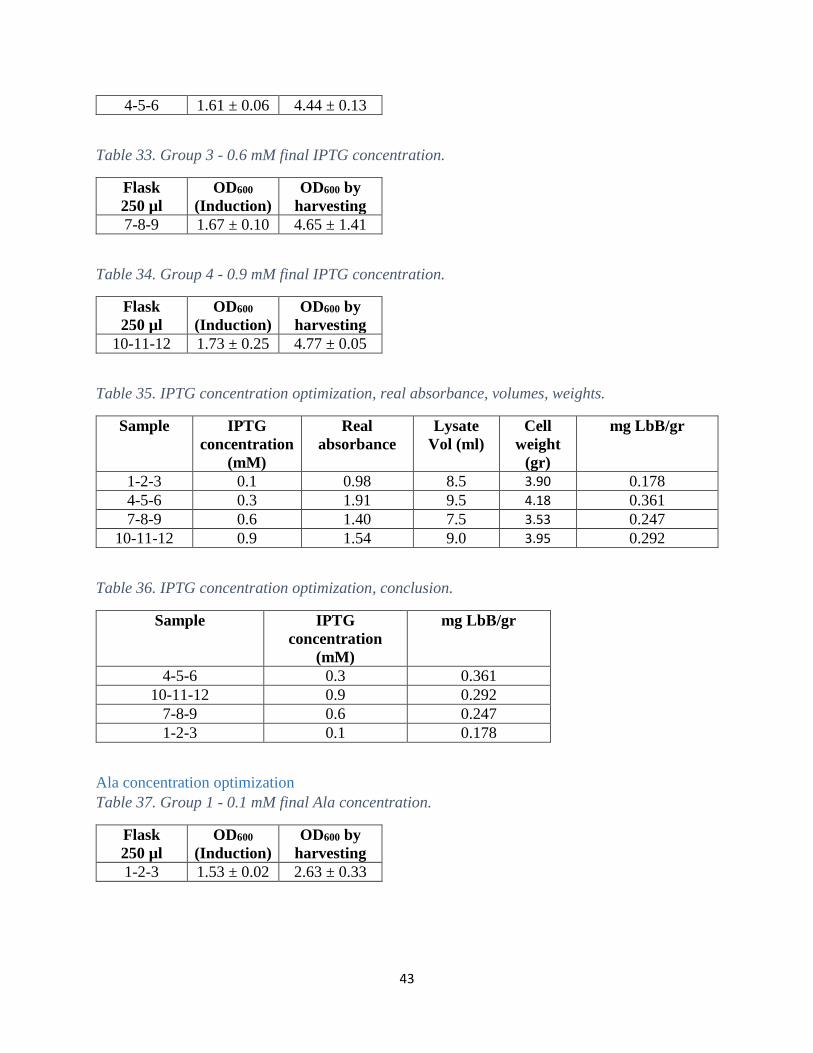
IPTG concentration optimization
From the two previous optimizations, the optimal stirring speed for oxygen diffusion was found
as well as the induction OD600, and the time CO bubbling. Among crucial expression variables,
the optimization of IPTG and Ala concentrations were the ones left. Previous studies, when
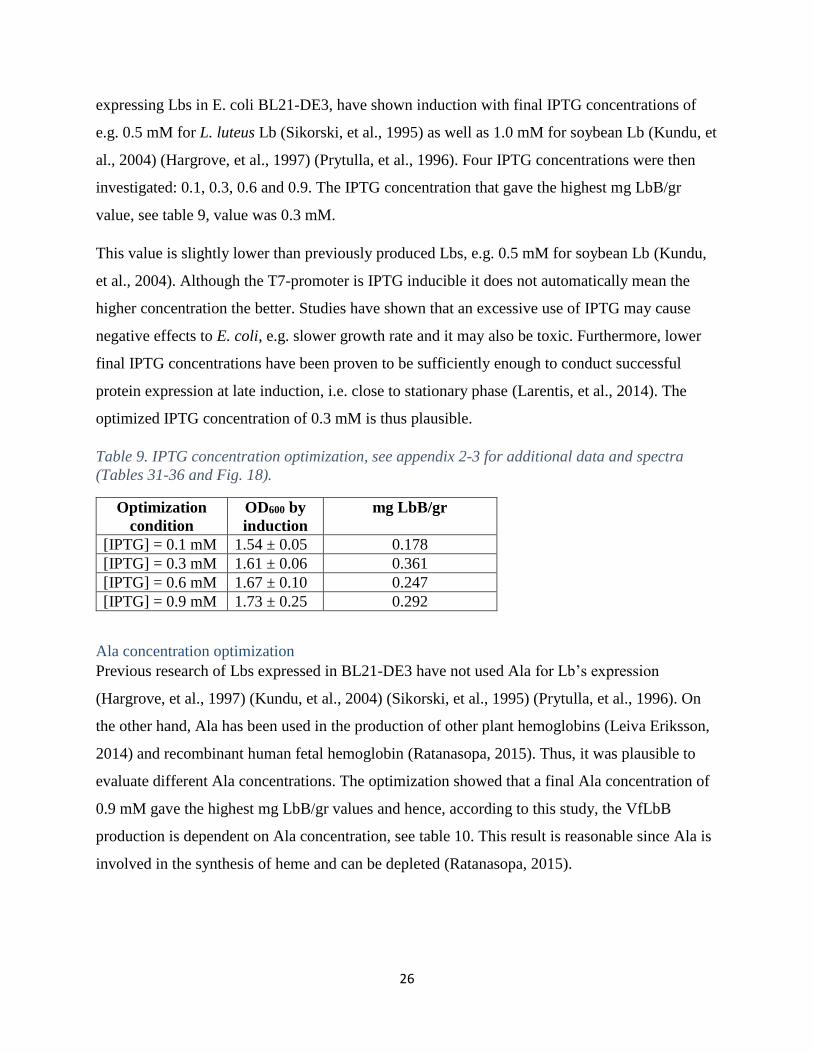
26
expressing Lbs in E. coli BL21-DE3, have shown induction with final IPTG concentrations of
e.g. 0.5 mM for L. luteus Lb (Sikorski, et al., 1995) as well as 1.0 mM for soybean Lb (Kundu, et
al., 2004) (Hargrove, et al., 1997) (Prytulla, et al., 1996). Four IPTG concentrations were then
investigated: 0.1, 0.3, 0.6 and 0.9. The IPTG concentration that gave the highest mg LbB/gr
value, see table 9, value was 0.3 mM.
This value is slightly lower than previously produced Lbs, e.g. 0.5 mM for soybean Lb (Kundu,
et al., 2004). Although the T7-promoter is IPTG inducible it does not automatically mean the
higher concentration the better. Studies have shown that an excessive use of IPTG may cause
negative effects to E. coli, e.g. slower growth rate and it may also be toxic. Furthermore, lower
final IPTG concentrations have been proven to be sufficiently enough to conduct successful
protein expression at late induction, i.e. close to stationary phase (Larentis, et al., 2014). The
optimized IPTG concentration of 0.3 mM is thus plausible.
Table 9. IPTG concentration optimization, see appendix 2-3 for additional data and spectra
(Tables 31-36 and Fig. 18).
Optimization
condition
OD600 by
induction
mg LbB/gr
[IPTG] = 0.1 mM 1.54 ± 0.05 0.178
[IPTG] = 0.3 mM 1.61 ± 0.06 0.361
[IPTG] = 0.6 mM 1.67 ± 0.10 0.247
[IPTG] = 0.9 mM 1.73 ± 0.25 0.292
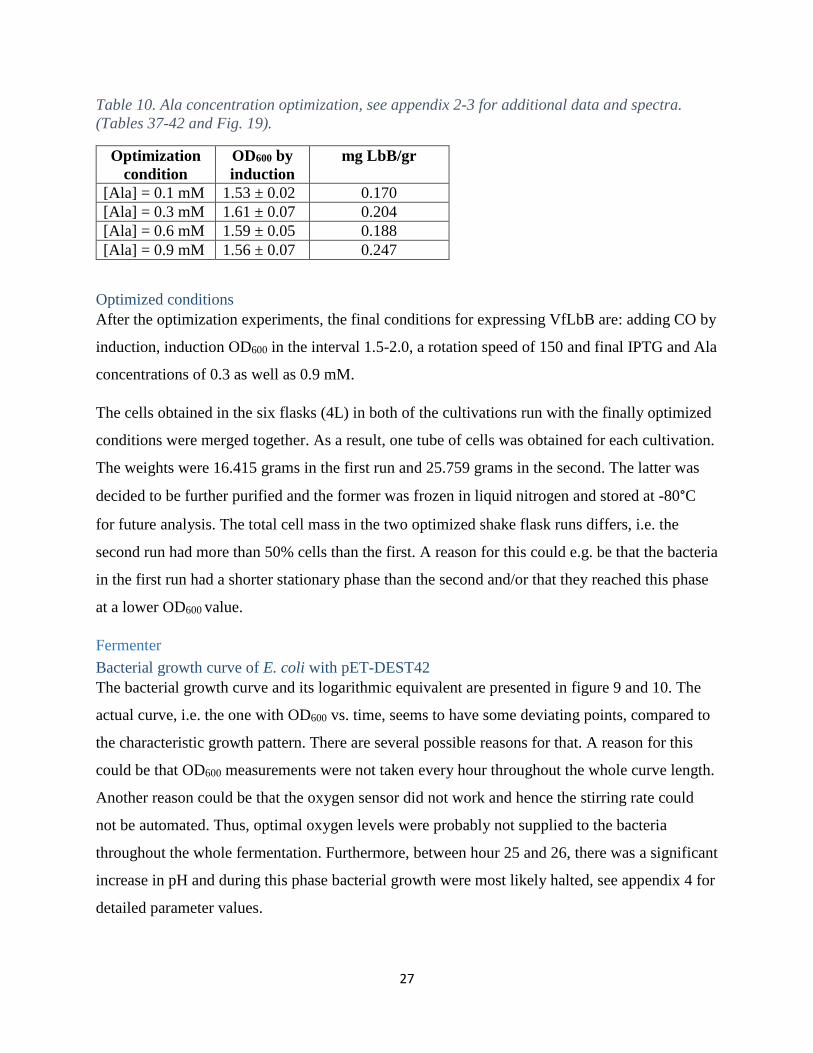
Ala concentration optimization
Previous research of Lbs expressed in BL21-DE3 have not used Ala for Lb’s expression
(Hargrove, et al., 1997) (Kundu, et al., 2004) (Sikorski, et al., 1995) (Prytulla, et al., 1996). On
the other hand, Ala has been used in the production of other plant hemoglobins (Leiva Eriksson,
2014) and recombinant human fetal hemoglobin (Ratanasopa, 2015). Thus, it was plausible to
evaluate different Ala concentrations. The optimization showed that a final Ala concentration of
0.9 mM gave the highest mg LbB/gr values and hence, according to this study, the VfLbB
production is dependent on Ala concentration, see table 10. This result is reasonable since Ala is
involved in the synthesis of heme and can be depleted (Ratanasopa, 2015).
27
Table 10. Ala concentration optimization, see appendix 2-3 for additional data and spectra.
(Tables 37-42 and Fig. 19).
Optimized conditions
After the optimization experiments, the final conditions for expressing VfLbB are: adding CO by
induction, induction OD600 in the interval 1.5-2.0, a rotation speed of 150 and final IPTG and Ala
concentrations of 0.3 as well as 0.9 mM.
The cells obtained in the six flasks (4L) in both of the cultivations run with the finally optimized
conditions were merged together. As a result, one tube of cells was obtained for each cultivation.
The weights were 16.415 grams in the first run and 25.759 grams in the second. The latter was
decided to be further purified and the former was frozen in liquid nitrogen and stored at -80°C
for future analysis. The total cell mass in the two optimized shake flask runs differs, i.e. the
second run had more than 50% cells than the first. A reason for this could e.g. be that the bacteria
in the first run had a shorter stationary phase than the second and/or that they reached this phase
at a lower OD600 value.
Fermenter
Bacterial growth curve of E. coli with pET-DEST42
The bacterial growth curve and its logarithmic equivalent are presented in figure 9 and 10. The
actual curve, i.e. the one with OD600 vs. time, seems to have some deviating points, compared to
the characteristic growth pattern. There are several possible reasons for that. A reason for this
could be that OD600 measurements were not taken every hour throughout the whole curve length.
Another reason could be that the oxygen sensor did not work and hence the stirring rate could
not be automated. Thus, optimal oxygen levels were probably not supplied to the bacteria
throughout the whole fermentation. Furthermore, between hour 25 and 26, there was a significant
increase in pH and during this phase bacterial growth were most likely halted, see appendix 4 for
detailed parameter values.
Optimization
condition
OD600 by
induction
mg LbB/gr
[Ala] = 0.1 mM 1.53 ± 0.02 0.170
[Ala] = 0.3 mM 1.61 ± 0.07 0.204
[Ala] = 0.6 mM 1.59 ± 0.05 0.188
[Ala] = 0.9 mM 1.56 ± 0.07 0.247

28
The logarithmic growth curve, which takes the errors into account, looks more plausible, in
comparison to the non-logarithmic one. The logarithmic growth curve from the fermenter (Fig.
10) was compared to the curve generated from shake flasks (Fig. 8), in order to convert the
optimized induction OD600 value to an equivalent one. This value was decided to be 30. The
specific growth rate and the generation time were calculated to 0.32 h-1 and 2.14 hours.
Compared to the values obtained in the shake flasks (Section Growth curve of E. coli with pET-
DEST42-VfLbB), the specific growth rate is lower and the generation time longer. This is
plausible since e.g. the temperature in the shaking flasks was 37oC and in the fermenter it was
30oC, the latter is not optimal for cell growth. Furthermore, parameters such as the media
differed: TB media was used in the shaking flasks and DM in the fermenter (Expression
Technologies Inc., 2003) .
Figure 9. Bacterial growth curve in fermenter.

29
Figure 10. Logarithmic bacterial growth curve in fermenter. The red cross in the figure shows
the converted, optimized induction OD600.
VfLbB expression
The cell concentration in the harvested volumes were 110 ± 6 grams per liter. The values from
these duplicates were similar and thus, from these experiments, it can be concluded that the
different induction OD600 values do not affect the total cell concentrations.
Dynamics interpretation
In figure 11-13, continuously registered fermentation parameters are presented for the three runs.
As stated before, the oxygen sensor did not work during the first run and this parameter is thus
absent in figure 11. This can be related to the stirring pattern, since the stirrer is automated to a
fixed pO2 value. As a result, the stirring in the second and third run (Fig. 12 and 13) was
fluctuating more than the first run. Regarding the pO2 curves in the second and third run, they are
at a constant pace during the first hours, indicating cell growth. By induction, the O2 set-point
was manually decreased to 2.5%, which can also be observed in the figures. The glucose
concentration was manually measured throughout the fermentations. Once the glucose was
depleted the fed-batch mode was started, where after the introduced glucose volume increased
over time. In all of the three fermentations, the base automatically increased over time as a result
of a pH set-point. It is plausible that the base volume increases gradually and this due to the
bacterial production of acidic overflow metabolites, e.g. lactic acid and acetic acid, and hence a
30
decrease in pH (Larsson, 2013).
Figure 11. Fermentation parameters, first run.
Figure 12. Fermentation parameters, second run.

31
Figure 13. Fermentation parameters, third run.
CO essay
In figure 14, a spectra of VfLbB after dialysis and sterile filtration is shown. After NaD and CO
were added to the samples, the spectra shifted to the right. Hardgrove et al. (1997) demonstrated
this with soybean Lb. The absorbance maxima for soybean Lb in the oxy-state was 409 and 416
in the CO-state. VfLbB has a smaller shift to the right. Its Fe(II)O2 peak is located at 415 and its
Fe(II)CO peak at 417.
Figure 14. CO shift, peak characterization.
0
0.5
1
1.5
2
2.5
3
350 400 450 500 550 600
CO shift
Abs VfLb Abs VfLb, NaD + CO
32
Purification results
In table 11, the mg LbB/gr values are presented for the dialysed and filtered samples. The second
fermentation run with induction OD600 at 30.0 showed the highest mg LbB/gr after dialysis,
independently of the buffer used (NaP or Tris-HCl). Theoretically, the shaking flasks should
have given the same LbB/gr values as the second fermentation run, since this fermentation was
based on the optimized conditions from the shaking flasks, e.g. the final IPTG concentration and
time of induction OD600.
The difference in LbB/gr between the second fermentation run and the shaking flasks is just a
minor one. They are in the same range. However, a reason for this small deviation, that shaking
flasks produce less, could be that six individual samples of cell pellets were merged together into
one tube. Although these shake flask samples had the same conditions, one or two deviating ones
may affect the average.
Moreover, the third fermentation gave the lowest mg LbB/gr values compared to the second
fermentation (Table 11) and the only difference between them was the induction OD600. A
concluding remark from this is that the bacteria should rather be induced at OD600 30, instead of
50, in order to obtain as high Lb concentration as possible. As stated before, an OD600 value of
30 is in the end of the exponential growth phase of the growth curve. Thus, a value of 50 is at the
very beginning of the stationary phase or in the interphase of the two. The exponential growth
phase seems to have an influence in protein production in this case.
Table 11. Dialyzed and filtered samples, Tris-HCl and NaP buffers. The spectra are available in
Fig. 20-21, Appendix 3.
Sample mg LbB/gr
Shake flasks (NaP buffer) 0.227
Shake flasks (Tris buffer) 0.264
Fermentation 2 (NaP
buffer)
0.266
Fermentation 2 (Tris
buffer)
0.296
Fermentation 3 (NaP
buffer)
0.179
Fermentation 3 (Tris
buffer)
0.236

33
In figure 15, the results from the QFF column for the shake flask sample is presented. VfLbB,
represented by a blue line in the chromatogram, did not bind the column successfully. Other
proteins, detected at 280nm and represented by a purple line, did bind better on the other hand.
This was also the result for the QFF of the second fermentation sample and for both the samples
analyzed in the CaptoS exchange chromatography experiments, see the other chromatograms in
appendix 5 (Figs. 22-25).
Figure 15. QFF, VfLbB from shake flasks.
It was unexpected that VfLbB neither bound to the CaptoS nor the QFF. The pI value of VfLbB
is, as stated before, 7.7 (Frühling, et al., 1997) and both the ion-exchange buffers were designed
according to that. A possible reason why the VfLbB did not bind any of the columns could be
that a component in the buffers interfere with the protein to some extent or that the column
interfere with some parts of the three dimensional structure of VfLbB. Arredondo-Peter et al.
(1997) used a purification procedure consisting of several steps, when purifying recombinant
34
Cowpea Lb II. This purification included precipitation with ammonium sulphate,
chromatography and electrophoresis. Regarding the chromatography methodology in this study,
both ion-exchange and hydrophobic variants were used.
Future research
In this project, gene cloning, shake flask optimizations, production in a fermenter and initial
purification were conducted. Due to time constraints, neither optimization of the fermenter
conditions, e.g. glucose feeding profile, oxygen concentration, pH, temperature, nor
characterization experiments, except from CO peak shift characterization, of VfLbB could be
carried out. Thus, this is a suggestion for future research.
Regarding the future characterization, kinetics studies of VfLbB would be plausible to conduct.
When parameters such as the oxygen association and dissociation rates have been determined,
further modifications of the VfLbB molecule, e.g. PEGylation, should be conducted, in order to
evaluate if this could be a blood substitute candidate. The pI value of VfLbB is 7.7, which is
close to the one of Hb in human blood, is a promising characteristics.
Furthermore, optimization in the ion-exchange purification process, e.g. in a similar systematic
manner as for the induction parameters in the shaking flasks, could also be another thing to
consider. Another suggestion is conduct affinity exchange chromatography, as an extension to
ion-exchange chromatography, and also using ammonium sulphate precipitation. Protein
engineering techniques could also be applied to the VfLbB gene, in order to obtain other
desirable characteristics of the protein molecule.
Eventually, determine an extinction coefficient for VfLbB would be plausible as future research.
In this thesis the extinction coefficient for L. luteus Lb was used and an extinction coefficient
would enable calculations of correct concentrations.

35
References Alberts, B., Johnson, A. & Lewis, J., 2007. Molecular Biology of the Cell. 5th ed. Garland Publishing Inc.
Arredondo-Peter, R. et al., 1997. Molecular Cloning of the Cowpea Leghemoglobin II Gene and Expression of
Its cDNA in Escherichia coli (Purification and Characterization of the Recombinant Protein). Plant physiology,
114(2), pp. 493-500.
Berg, J. M., Tymoczko, J. L. & Stryer, L., 2006. Biochemistry. 6 ed. W.H. Freeman.
Branden, C. & Tooze, J., 1999. Introduction to protein structure. 2 ed. Garland Pub.
Brown, T., 2010. Gene cloning and DNA analysis: an introduction. 6 ed. John Wiley & Sons.
Epoch Biolabs, 2016. USA.
Expression Technologies Inc., 2003. Bacterial E.coli Growth Media. [Online]
Available at: http://www.exptec.com/Expression%20Technologies/Bacteria%20growth%20media.htm
[Accessed 1 June 2016].
Fasman, G. D., 1989. Practical handbook of biochemistry and molecular biology. CRC press.
Frühling, M. et al., 1997. The Vicia faba leghemoglobin gene VfLb29 is induced in root noudles and in roots
colonized by the arbuscular mycorrhizal fungus Glomus fasciculatum. Molecular plant-microbe interactions,
10(1), pp. 124-131.
Hargrove, M. S. et al., 1997. Characterization of recombinant soybean leghemoglobin a and apolar distal
histidine mutants. Journal of molecular biology, 266(5), pp. 1032-1042.
Heiman, M., 1997. Webcutter 2.0. [Online]
Available at: http://rna.lundberg.gu.se/cutter2/
Hoy, J. A. & Hargrove, M. S., 2008. The structure and function of plant hemoglobins. Plant Physiology and
Biochemistry, 46(3), pp. 371-379.
Invitrogen (a), 2010. Gateway Technology with Clonase II: user manual. Sweden.
Invitrogen (b), 2010. pET-DEST42 Gateway Vector. Sweden.
Kim, H. W. & Greenburg, A. G., 2013. Hemoglobin-based oxygen carriers as red cell substitutes and oxygen
therapeutics. Springer Science & Business Media.
Kuhse, J. & Pühler, A., 1987. Conserved sequence motifs in the untranslated 3'end of leghemoglobin
transcripts isolated from broadbean noudles. Plant Science, 49(2), pp. 137-143.
Kundu, S. et al., 2004. Tyrosine B10 inhibits stabilization of bound carbon monoxide and oxygen in soybean
leghemoglobin. Biochemistry, 43(20), pp. 6241-6252.
Larentis, A. L. et al., 2014. Evaluation of pre-induction temperature, cell growth at induction and IPTG
concentration on the expression of a leptospiral protein in E. coli using shaking flasks and microbioreactor.
BMC research notes, 7(1), p. 671.
36
Larsson, G., 2013. Cultivation Technology. 3 ed. Div. Bioprocess Engineering, School of Biotechnology, Royal
Institute of Technology (KTH), Stockholm, Sweden.
Leiva Eriksson, N., 2014. Biochemical and Physiological Characterization of Nonsymbiotic Plant Hemoglobins.
Doctoral Dissertation, the Division of Pure and Applied Biochemistry, the Faculty of Engineering, Lund
University .
Leiva-Eriksson, N. et al., 2014. Differential expression patterns of non-symbiotic hemoglobins in sugar beet
(Beta vulgaris ssp. vulgaris). Plant and Cell Physiology.
Leiva Eriksson, N., 2016. Fermentation Protocol.
Milani, M., Pesce, A., Bolognesi, M. & Ascenzi, P., 2001. Truncated hemoglobins: trimming the classical ‘three-
over-three’globin fold to a minimal size. Biochemistry and Molecular Biology Education, 29(3), pp. 123-125.
NCBI, 2005. V.faba mRNA for leghemoglobin B.
Oregon State University, 2010. Beans, Fava. [Online]
Available at: http://horticulture.oregonstate.edu/content/beans-fava
[Accessed 21 January 2016].
Owen, T., 1996. Fundamentals of UV-visible spectroscopy. Germany: Hewlett-Packard.
Perlick, A. M. & Pühler, A., 1993. A survey of transcripts expressed specifically in root noudles of broadbean
(Vicia faba L.). Plant molecular biology, 22(6), pp. 957-970.
Prytulla, S., Jane Dyson, H. & Wright, P. E., 1996. Gene synthesis, high‐level expression and assignment of
backbone 15N and 13C resonances of soybean leghemoglobin. FEBS letters, 399(3), pp. 283-289.
Ratanasopa, K., 2015. Human Fetal Hemoglobin: Biochemical Characterization and Recombinant Production.
Doctoral dissertation, Division of Pure and Applied Biochemistry, Faculty of Engineering, Lund University.
Sikorski, M. M. et al., 1995. Cloning and expression of plan leghemoglobin cDNA of Lupinus luteus in
Escherichia coli and purification of the recombinant protein. Plant Science, 108(1), pp. 109-117.
Vinogradov, S. N. & Kapp, O. H., 2012. Structure and function of invertebrate oxygen carriers. Springer Science
& Business Media.
Wikipedia, 2016. Vicia faba. [Online]
Available at: https://en.wikipedia.org/wiki/Vicia_faba
[Accessed 21 January 2016].
Willey, J. M., Sherwood, L. M. & Woolverton, C. J., 2010. Prescott's Microbiology. 8 ed. McGraw-Hill
Publishers.
Wireko, F. C. & Abraham, D. J., 1992. The crystal state binding of dithionite to deoxy-hemoglobin. Protein
engineering, 5(1), pp. 3-5.
37
Appendix 1
Machines and equipment
Centrifugation of 1.5 and 2.0 ml Eppendorf tubes:
Spectrafuge 24D (Labnet International Inc)
Centrifugation of 50 ml tubes:
SORVALL® RC 6 PLUS (Thermo Electron Corporation), rotor: FIBERLite F13-14x50cy
(Thermo Scientific)
Centrifugation of 250 ml tubes:
SORVALL® RC 6 PLUS (Thermo Electron Corporation), rotor: FIBERLite F14-6x250
(Piramoon Technologies Inc)
SORVALL RC-5B Refrigerated Superspeed (DuPont Instruments), rotor: SORVALL SLA-1500
SUPER-LITE
Sonicator:
QSONICA SONICATORS, 20 kHz output frequency
Incubators:
Innova™ 4430 Incubator Shaker
Innova® 44 Incubator Shaker Series
Gallenkamp Cooled Orbital Incubator
Heatblocks:
Thermo Block TDB-120 (Biosan)
Thermomixer Compact (Eppendorf)
Heaters and stirrers:
MR 3001 K (Heidolph)
IKAMAG® REO (Drehzahl Electronic)
Fermenter:
BIOSTAT® A Plus, 5 liter vessel + software (Sartorius Stemdim biotech)
Spectrophotometers:
NanoPhotometer (Implen)
Cary 60 UV-Vis (Agilent Technologies)

38
Electrophoresis:
Equipment from Bio-Rad
Chemicals:
From SigmaAldrich
Cloning kit, Gateway Technology:
From Invitrogen
Chromatography:
ÄKTA, GE Healthcare
HiPrep™ Q FF 16/10 (anion exchange column), GE Healthcare
HiScreen™ Capto™ S (cation exchange column), GE Healthcare
Dialysis:
Spectra/Por®1 Dialysis Membrane. Standard RC Tubing. Molecular cut off weight: 6-8 kD
Plasmid purification kits:
Nucleospin® Gel and PCR Clean-up (Macherey-Nagel-07/2015 Rev.03)
E.Z.N.A. ® Plasmid DNA Mini Kit I
39
Appendix 2
VfLbB expression: initial optimization
Table 12. OD600 = 3.0 ± 0.5,150 rpm, CO by induction.
Flask
660 µl
OD600
(Induction)
OD600 by
harvesting
4 3.46 -
5 2.38 -
6 3.09 -
Table 13. Group 1 – OD600 0.8, 80 rpm, CO by induction.
Flask
250 µl
OD600
(Induction)
OD600 by
harvesting
1 0.710 2.880
2 0.754 1.920
Table 14. Group 2 - OD600 0.8, 80 rpm, CO by harvesting.
Flask
250 µl
OD600
(Induction)
OD600 by
harvesting
3-4 0.93 ± 0.22 3.83 ± 0.23
Table 15. Group 3 – OD600 0.8, 150 rpm, CO by induction.
Flask
250 µl
OD600
(Induction)
OD600 by
harvesting
5-6 1.01 ± 0.28 5.24 ± 1.15
Table 16. Group 4 – OD600 0.8, 150 rpm, CO by harvesting
Flask
250 µl
OD600
(Induction)
OD600 by
harvesting
7-8 0.87 ± 0.08 8.53 ± 1.00
Table 17. Group 5 – OD600 1.5, 80 rpm, CO by induction.
Flask
250 µl
OD600
(Induction)
OD600 by
harvesting
9-10 1.50 ± 0.20 2.71 ± 0.02
40
Table 18. Group 6 – OD600 1.5, 80 rpm, CO by harvesting.
Flask
250 µl
OD600
(Induction)
OD600 by
harvesting
11-12 1.40 ± 0.21 4.56 ± 0.44
Table 19. Group 7 – OD600 1.5, 150 rpm, CO by induction.
Flask
250 µl
OD600
(Induction)
OD600 by
harvesting
13-14 1.36 ± 0.07 6.02 ± 0.20
Table 20. Group 8 – OD600 1.5, 150 rpm, CO by harvesting.
Flask
250 µl
OD600
(Induction)
OD600 by
harvesting
15-16 1.51 ± 0.10 8.06 ± 0.19
Table 21. VfLbB expression: initial optimization, real absorbance, volumes, weight.
Sample Real absorbance Lysate Vol (ml) Cell weight (gr) Abs*V AbsV/W
1 0.15 5.5 1.05 0.81 0.77
2 0.81 2.0 0.69 1.22 2.37
3-4 0.73 5.5 2.53 4.04 1.60
5-6 0.85 8.5 3.64 7.22 1.98
7-8 1.02 12.5 5.00 12.74 2.55
9-10 0.29 3.5 1.79 1.01 0.57
11-12 0.92 6.0 2.59 5.51 2.13
13-14 0.87 10.0 4.26 8.71 2.05
15-16 0.78 12.5 4.92 9.75 1.98
1* 0.94 11.5 5.06 10.82 2.14
2* 0.78 11.0 4.99 8.56 2.32
3* 0.61 12.5 5.61 7.65 2.32
1*, 2* and 3* were the tubes, obtained from the 2L shake flasks cultivation, the rest are
from one liter shake flasks.
Table 22. Conclusion VfLbB expression: initial optimization.
Sample rpm CO AbsV/W
7-8 150 By harvesting 2.55
2 80 By induction 2.37
3* 150 By induction 2.32
2* 150 By induction 2.32

41
1* 150 By induction 2.14
11-12 80 By harvesting 2.13
13-14 80 By induction 2.05
5-6 150 By induction 1.98
15-16 150 By harvesting 1.98
3-4 80 By harvesting 1.60
1 80 By induction 0.77
9-10 80 By induction 0.57
Time of Induction optimization
Table 23. Group 1 – immediate induction, CO by induction.
Flask
250 µl
OD600
(Induction)
OD600 by
harvesting
13-14-15 0.01 ± 0.00 1.53 ± 0.01
Table 24. Group 2 - immediate induction, CO by harvesting.
Flask
250 µl
OD600
(Induction)
OD600 by
harvesting
17-18-19 0.00 ± 0.00 3.11 ± 0.24
Table 25. Group 3 - OD600 1, CO by induction.
Flask
250 µl
OD600
(Induction)
OD600 by
harvesting
2-3-4 1.01 ± 0.05 5.81 ± 2.15
Table 26. Group 4 - OD600 1, CO by harvesting.
Flask
250 µl
OD600
(Induction)
OD600 by
harvesting
6-7-8 0.97 ± 0.06 9.57 ± 1.17
Table 27. Group 5 - OD600 2, CO by induction.
Flask
250 µl
OD600
(Induction)
OD600 by
harvesting
10-11-12 1.87 ± 0.03 4.44 ± 1.17

42
Table 28. Group 6 - OD600 2, CO by harvesting.
Flask
250 µl
OD600
(Induction)
OD600 by
harvesting
1-5-9 1.80 ± 0.09 9.80 ± 1.84
Table 29. Time of Induction optimization, real absorbance, volumes, weights.
Sample OD600
(Induction)
CO Real
absorbance
Lysate Vol
(ml)
Cell weight
(gr)
mg
LbB/gr
1-5-9
2 By
harvesting 1.01
16.0 6.68 0.195
2-3-4
1
By
induction 1.30
9.5 4.05 0.254
6-7-8
1 By
harvesting 0.68
18.5 7.98 0.135
10-11-12
2 By
induction 1.57
9.0 3.98 0.295
13-14-15
Immediate By
induction 0.11
4.0 1.80 0.020
17-18-19
Immediate
By
harvesting 0.61
7.5 3.23 0.118
Table 30. Time of Induction optimization, conclusion.
Sample OD600 (Induction) CO mg LbB/gr
10-11-12 2 By induction 0.295
2-3-4 1 By induction 0.254
1-5-9 2 By harvesting 0.195
6-7-8 1 By harvesting 0.135
17-18-19 Immediate By harvesting 0.118
13-14-15 Immediate By induction 0.020
IPTG concentration optimization
Table 31. Group 1 - 0.1 mM final IPTG concentration.
Flask
250 µl
OD600
(Induction)
OD600 by
harvesting
1-2-3 1.54 ± 0.05 4.81 ± 0.23
Table 32. Group 2 - 0.3 mM final IPTG concentration.
Flask
250 µl
OD600
(Induction)
OD600 by
harvesting
43
4-5-6 1.61 ± 0.06 4.44 ± 0.13
Table 33. Group 3 - 0.6 mM final IPTG concentration.
Flask
250 µl
OD600
(Induction)
OD600 by
harvesting
7-8-9 1.67 ± 0.10 4.65 ± 1.41
Table 34. Group 4 - 0.9 mM final IPTG concentration.
Flask
250 µl
OD600
(Induction)
OD600 by
harvesting
10-11-12 1.73 ± 0.25 4.77 ± 0.05
Table 35. IPTG concentration optimization, real absorbance, volumes, weights.
Sample IPTG
concentration
(mM)
Real
absorbance
Lysate
Vol (ml)
Cell
weight
(gr)
mg LbB/gr
1-2-3 0.1 0.98 8.5 3.90 0.178
4-5-6 0.3 1.91 9.5 4.18 0.361
7-8-9 0.6 1.40 7.5 3.53 0.247
10-11-12 0.9 1.54 9.0 3.95 0.292
Table 36. IPTG concentration optimization, conclusion.
Sample IPTG
concentration
(mM)
mg LbB/gr
4-5-6 0.3 0.361
10-11-12 0.9 0.292
7-8-9 0.6 0.247
1-2-3 0.1 0.178
Ala concentration optimization
Table 37. Group 1 - 0.1 mM final Ala concentration.
Flask
250 µl
OD600
(Induction)
OD600 by
harvesting
1-2-3 1.53 ± 0.02 2.63 ± 0.33

44
Table 38. Group 2 - 0.3 mM final Ala concentration.
Flask
250 µl
OD600
(Induction)
OD600 by
harvesting
4-5-6 1.61 ± 0.07 3.49 ± 0.16
Table 39. Group 3 - 0.6 mM final Ala concentration.
Flask
250 µl
OD600
(Induction)
OD600 by
harvesting
7-8-9 1.59 ± 0.05 2.56 ± 0.27
Table 40. Group 4 – 0.9 mM final Ala concentration.
Flask
250 µl
OD600
(Induction)
OD600 by
harvesting
10-11-13 1.56 ± 0.07 3.49 ± 0.21
Table 41. Ala concentration optimization, real absorbance, volumes, weights.
Sample Ala
concentration
(mM)
Real
absorbance
Lysate
Vol (ml)
Cell
weight
(gr)
mg LbB/gr
1-2-3 0.1 0.95 6.5 3.02 0.170
4-5-6 0.3 1.21 7.0 3.46 0.204
7-8-9 0.6 1.03 7.0 3.19 0.188
10-11-13 0.9 1.47 7.0 3.47 0.247
Table 42. Ala concentration optmization, conclusion.
Sample Ala concentration
(mM)
mg LbB/gr
10-11-13 0.9 0.247
4-5-6 0.3 0.204
7-8-9 0.6 0.188
1-2-3 0.1 0.170
Optimized conditions
Table 43. Optimized shake flask conditions, round 1.
Flask
660 µl
OD600
(Induction)
OD600 by
harvesting
1-2-3-4-5-
6
1.61 ± 0.09 2.52 ± 0.03

45
Table 44. Optimized shake flask conditions, round 2.
Flask
660 µl
OD600
(Induction)
OD600 by
harvesting
1-2-3-4-5-
6
1.56 ± 0.07 5.81 ± 0.81
Table 45. Weights, pellet merged flasks, optimized conditions.
Sample Weight (g)
1-2-3-4-5-6 (first run) 16.42
1-2-3-4-5-6 (second run) 25.76

46
Appendix 3
VfLbB spectra
Figure 16. Spectra, VfLbB expression: initial optimization.
Figure 17. Spectra, OD600 by induction and CO addition optimization.
47
Figure 18. IPTG concentration optimization.
Figure 19. Ala concentration optimization.

48
Figure 20. Dialysed and filtered samples, NaP buffer.
Figure 21. Dialysed and filtered samples, Tris buffer.

49
Appendix 4
Fermentation data
The fermenter was started at 8:10 on April 20 and stopped at 15:30
O2 sensor not behaving, max O2: 474%
At 3 hours, the stirring was increased to 405 rpm and airflow to 7 liters per minute
At 6 hours, the stirring was increased to 700 rpm.
The profile was started at 8.5 hours, due to low glucose levels
At 8 hours, the airflow was increased to 9 liters per minute.
At 10 hours the profile was changed to 5% 2h, 3% 4h, 2%, 6h, 1% 14h
At 11 hours the profile was changed to 4% 0h, 3% 1h, 2% 5h, 1% 8h
At 15 hours, the profile was changed to 4% 0h, 3% 2h, 2% 10h, 1% 12h
Something might interfere with the glucose: 1/10 and dilution showed “low” on the
glucose device and ½ dilution as well as no dilution showed “E-3”, which means either
extremely high value or device/strip error.
Fermentation 1
Hours OD600 pH base
glu
(ml)
glu
(mM)
profile
(%)
air (1
bar) stirr
pO2
(%)
cells
(mg/ml)
0 0.237 7.4 0 0 52 0 5 21 -
2.5 1.262 7.17 0 0 44 0 5 87 - 4.8
3 1.551 7.01 0 0 43 0 7 406 - 5
4 3.72 6.86 0 0 37 0 7 406 - 7.6
5 5.08 6.64 12 0 27 0 7 406 - 9.6
6 6.5 6.71 78 0 17.8 0 7 703 - 9.2
7.1667 9.88 6.7 87 0 4.2 0 7 703 - 15
8 11.2 6.86 90 3 - 1.5 9 704 - 16.7
9 18.2 6.71 90 45 21.7 5.2 9 704 - 26.8
10 26.3 6.7 101 102 43 5.7 9 704 - 36.6
11 34.6 6.7 112 160 71 5.5 9 704 - 46.5
12 49 6.7 124 204 62 3.4 9 704 - 53.7
13 53.8 6.7 137 237 41 2.8 9 704 - 63.9
14 58.2 6.7 147 260 16 2.6 9 704 - 69.4
14.5 63.1 6.7 155 278 11.1 2.5 9 704 - 71.1
23.33 69.5 6.7 238 545 - 2.2 9 704 - 84.6
24.33 80 6.7 246 565 - 2.1 9 704 - 85.9
27.33 89.8 6.98 248 629 17.3 5 9 704 - 95
28.33 91.6 6.61 248 688 41 6.2 9 704 - 98.2
29.33 86 6.51 254 763 91 7.4 8 704 - 97
30.33 89.5 6.5 263 792 103
7.1
(off) 8 704 - 107.4
31.33 90.8 6.5 272 792 99.9
5.3
(off) 8 704 - 92.8

50
At 23 hours, it was noticeable that the base had accumulated in the pellet.
The glucose pump was turned off at 24.5 hours.
The glucose pump was started at 26.5 hours
The glucose pump was stopped at 29.5 hours, due to high glucose value.
Fermentation 2
hours OD600 pH base
glu
(ml)
glu
(mM) profile
air (1
bar) stirr
pO2
(%)
cells
(mg/ml)
0 0.595 7.23 0 0 0 5 21 40.5
11 13.9 6.37 9 115 26.4 5 10 750 39.7 29.7
12 21.8 6.51 16 167 21.8 6 10 810 37.4 31.5
13 29.2 6.49 25 236 17.4 7 10 814 14.9 45.3
15.5 44.7 6.5 53 355 17.1 3 8 740 2.2 66.6
17.5 61.3 6.49 72 419 19.5 2.8 8 810 1.5 91.7
19.5 88.6 6.5 91 450 28.6 2.6 8 810 0 126.4
21.5 94.1 6.78 97 487 low 2.4 8 810 32.7 142.8
34 98 6.5 229 730 high 1.7 8 405 0 136.1
pO2 check, 80.2% (11 L min and 800 rpm)
The fermenter was started at 20:30 on April 25 and stopped at 06:30 on April 27.
The pH meter was recalibrated to 7.55 after the first sampling.
At 11 hours, the airflow was changed from 5 liters per minute to 10 liters per minute.
The pH was switched on (pH meter was accidentally turned off) and set to 6.5 and auto.
At 13.5 hours, the airflow was changed to 8 liters per minute.
At 18.5 hours, the glucose pump was turned off (profile on)
At 19 hours, the pump was switched on again (profile still on)
At 19 hours (5 minutes after previous), the pump was switched off again due to high
glucose value.
At 20.5 hours, the pump was switched on due to low glucose levels and high pH (7.15)
At 21 hours, 10 ml glucose was added manually, thereafter auto.
At 22 hours, 5 ml glucose was added manually
At 22 hours, the stirring was changed from 100% MAX to 30%MAX (810 rpm to
approx. 405)
The induction was conducted at approximately OD600 30, at 13.5 hours. The IPTG
concentration was 0.3 mM and Ala 4 mM. Dark conditions, 22oC and O2 set-point of
2.5%.
The harvested volume was measured to 3.6 L

51
Fermentation 3
hours OD600 pH base
glu
(ml)
glu
(mM) profile
air (1
bar) stirr
pO2
(%)
cells
(mg/ml)
0 0.386 6.63 0 0 0 5 21 67.5
11 25.4 6.5 39 135 32.4 5.3 5 810 17.8 36.9
12 34 6.5 47 173 18.6 5.9 5 815 0.5 44.8
13 46.6 6.5 60 248 19.1 7 10 815 0.1 64.6
15.5 63.6 6.5 87 384 16.3 2.9 8 800 2 77.8
17.5 73.6 6.5 105 424 15.1 1.3 8 810 0 105.7
19.5 76.4 6.5 125 453 14.9 1.7 8 811 0 121.4
21.5 94.5 6.5 142 485 19.6 1.3 8 811 0.1 127
34 96.4 6.5 290 685 1 8 405 0 130.2
pO2 check, 91.0%
The fermenter was started at 20:30 on April 27 and stopped at 06:30 on April 29.
Small leakage during the night, to volume of approximately 3 liter.
At 13 hours the airflow was changed to 10 L min.
The profile before induction was: 8h 0.1%, 9h 3%, 11h 5%, 13h 7%, 15h 8%
The profile after induction was: 0h 5%, 2h 3%, 10h 2%, 14h 1%, 16h 2%, 18h 1%, 29h
2%, 22h 1%
At 21.5 hours, the stirring max was changed to 30% (from 800 to 400 rpm).
The induction was conducted at approximately OD600 50, at 13.5 hours. The IPTG
concentration was 0.3 mM and Ala 4 mM. Dark conditions, 22oC and O2 set-point of
2.5%.
Due to the spill, the harvested volume was measured to 3.1 L
Table 46. Total grams of cells and concentration of cells per liter, fermentation 2 and 3
Fermentation 2 Fermentation 3
Sample Weight (g) Weight (g)
1 33.12 18.72
2 44.32 30.881
3 22.62 23.629
4 32.063 33.033
5 39.56 31.88
6 28.344 30.202
7 26.893 31.355
8 29.42 30.433
9 24.656 26.812
10 37.023 38.53
11 37.851 31.399
12 28.912
13 27.22
Total weight (g) 412.002 326.874
g/L 114.445 105.4432
52
Appendix 5
Chromatograms
Figure 22. CaptoS VfLbB, shake flask cultivation chromatogram.

53
Figure 23. QFF VfLbB, shake flask cultivation chromatogram.

54
Figure 24. CaptoS VfLbB fermentation, OD600 30, chromatogram.
55
Figure 25. QFF VfLbB fermentation, OD600 30, chromatogram.

56
Appendix 6
Microbial kinetics calculations:
The following formulas were used to calculate the specific growth rate, µ, and the generation time, tg:
𝜇 =ln
𝑥2𝑥1
𝑡2 − 𝑡1
where letter x stands for cell mass, e.g. OD600, and t for time. The numbers 1 and 2 are indices.
𝑡𝑔 =ln 2
𝜇
(Larsson, 2013)