Embed Size (px)
Citation preview
Close range digital photogrammetry for the measurement of erosion to historic adobe structures
R.A. Burt & P . Woods Department of Construction Science Texas A&M UniversiQ USA
Abstract
Unbaked earth structures, like adobe structures are found in abundance throughout the world. Like most structures, they are subject to deterioration through time. The preservation of historic adobe structures requires careful attention and evaluation of several factors, but material erosion is the main concern. In order to calculate the amount of erosion, accurate measurement of the structures is required. Any measurement method used to quantify erosion needs a level of accuracy to detect the small changes in the surface of the structures.
Digital photograrnrnetry is the measurement of objects by digital image analysis using specialized software packages. Historic preservationists and architects use digital photogrammetry to measure historic structures. The accuracy of the measurement process is crucial, especially when an accuracy of less than 118" of an inch is required. Erosion measurements of historic adobe wall ruins at Fort Davis National Historic Site requires this level of accuracy in order to quantify volume differences that are used to calculate erosion rates.
An experiment was conducted to investigate how; the combination of photographs taken from different positions; the resolution of digital images and the dimensional control withm the image effects the accuracy of the measurements. The experiment compared measurements from a model eroded adobe wall using digital photogrammetry with measurements obtained using a 3D digitizer, a method whose accuracy is assumed to be perfect. Multiple regression models identified factors affecting accuracy and precision, and magnitude of the effect. The results of the regression models were used to make
Transactions on the Built Environment vol 55, © 2001 WIT Press, www.witpress.com, ISSN 1743-3509

474 Structural Studies, Repairs and Maintenance of Historical Buildings
recommendations for field measurements. An adobe wall ruin at Fort Davis National Historic Site was measured to test the recommendations.
1 Introduction
Unbaked earth structures, like adobe, are found in abundance throughout the world. Like all structures, they are subject to deterioration through time. The preservation of historic adobe structures requires careful attention and evaluation of several factors, of which erosion is the main concern. In order to evaluate the condition and calculate the amount of erosion, accurate measurement of the structures is required. Any measurement method used to quantify erosion needs to be accurate enough to detect the small changes in the surface of the structures. The measurement method also needs to be remote in nature as contact with the structures can also cause erosion. A previous study to identify adobe wall erosion by the authors identified the factors influencing the accuracy and precision of measurements obtained using Digital Photogrammetry. The recommendations made in this study were used to measure an adobe wall ruin at Fort Davis National Historic Site.
A variety of photogrammetric techniques used to quantify erosion at Fort Selden National Historic Site in New Mexico, suggested that by comparing the size of structures over time, the percentage erosion from the original size could be calculated (MC Dougall & Jensen, 1989). Traditional measurement techniques were used to calculate the volume of adobe wall ruins at Fort Davis National Historic Site in Texas (Burt & Woods, 1997). The volume of the wall was compared with the assumed original volume of the wall to calculate the percentage of erosion. A further study at Fort Davis compared volumetric measurements from 1993 and 1997 to calculate volume of erosion occurring over a four-year period (Burt, Warden & Woods, 1998). The same study expressed concerns regarding the measurement technique and made recommendations for future research.
Any successful method of measurement needs to resolve two fundamental measurement problems. The first problem is that the surface of an adobe wall is very irregular. The absence of straight and level surfaces from which to establish measurement datum makes the measurement process difficult. The second problem is that adobe ruins are very fragile, and any measurement process that involves making contact with the adobe is likely to cause damage. Any method of measurement therefore needs to be non- intrusive. Figure 1 shows a typical adobe wall ruin at Fort Davis National Historic Site in West Texas.
A previous study of erosion to an historic adobe wall at Fort Davis showed that a wall lost 0.6 inches of its width over a four-year period (Burt et al., 1998). If the erosion were assumed to be equal on both sides, then the annual erosion rate would be 0.075 inches. Any measurement method used to quantify the annual rate of erosion would need to be accurate enough to detect this amount of volumetric change.
Transactions on the Built Environment vol 55, © 2001 WIT Press, www.witpress.com, ISSN 1743-3509

Digital Photogrammetry is a surveying technique that obtains three- dimensional coordinate data by manipulating digital images. Common points on an object are marked on several digital images. Algorithms within the Digital Photogrammetry program calculate the position of the cameras taking the photographs. The program then calculates the three-dimensional position of the marked points on the images. An accuracy study of a Digital Photogrammetry program called Photomodeler by Eos Systems showed its accuracy level's suitable to detect small volumetric changes to an adobe wall (Henke, 1998).
By using Digital Photogrammetry the two fundamental measurement problems mentioned earlier are resolved. Digital Photogrammetry does not rely on straight and level surface datum from which to take reference measurements. The three-dimensional position of marked points are found relative to datum points (control points) that are spaced around the object being measured. The three-dimensional position of these control points is established using other surveying instruments. The establishment and measurement of the control points is the only intrusive part of the measurement process, and, in order to keep the intrusion to a minimum, Burt and Woods study (2000) identified how the number and position of the control points affects the accuracy of measurement. As the measurements are obtained by manipulating computer images, the vast majority of the measurement process is therefore non-intrusive.
Figure 1. Remains of the North Wall of the Forage House, Fort Davis, Texas
The literature accompanying the Digital Photogrammetry software (Photomodeler) suggests there are several factors that influence the accuracy of the measurements (Eos Systems Inc, 1997). These factors are: camera position relative to the object of interest, number of photographs, image resolution, spacing of control points and control point precision. Camera position is a series of factors that describe the spatial relationship between the camera and the object being photographed. The factors that describe the spatial relationship are: The average length of the centerline vector between the camera and the target,
Transactions on the Built Environment vol 55, © 2001 WIT Press, www.witpress.com, ISSN 1743-3509
476 Stmctz~ral Studies, Repairs and Maintenance of Historical Buildings
the average angle between centerline vectors of camera pairs and the maximum angle between centerline vectors of camera pairs projected onto the XY, XZ and YZ planes. Control points are points that are used as reference points. The true X, Y and Z coordinates for the control points are known. The control points are used by the program to create the three-dimensional model. Image resolution is the resolution at which the photographic images are scanned as digital images. The precision of the control points is set to either fix the position of the control points or allow repositioning to accommodate the model.
The authors carried out a study on the accuracy of the Photomodeler digital photogrammetry software for measuring adobe wall ruins in 1999 (Burt & Woods, 2000). The study found that digital photogrammetry had a suitable level of accuracy for measuring adobe wall erosion. The study made recommendations for the positioning of the camera in relation to the wall, the number of photographs required for processing, and the arrangement of control points whose three-dimensional position is obtained using another form of three-dimensional measurement such as a total station theodolite.
2 Method
To test the method developed by Burt and Woods (2000) an adobe wall ruin at Fort Davis National Historic Site in West Texas was measured in August 2000. The recommendations made by Burt and Woods were followed regarding the position of the camera talung the images of the wall and the positioning of control points. A digital camera was used to take images of the wall. The image resolution of the camera was 1600 x 1200 pixels therefore the scanning resolution of the images was not an issue.
The wall chosen was the north wall of the former Forage House. The construction of this building was completed in 1886. At the time of the creation of the National Historic Site in 1960, this building still had a roof over part of the building. The Forage House was not included as part of the initial restoration of the site and as a result the building deteriorated rapidly. Repair logs at the site show the wall ruins were stabilized with cement-adobe veneers and caps in 1968 and 1972. Epoxy sprays have also been used as a preservation treatment.
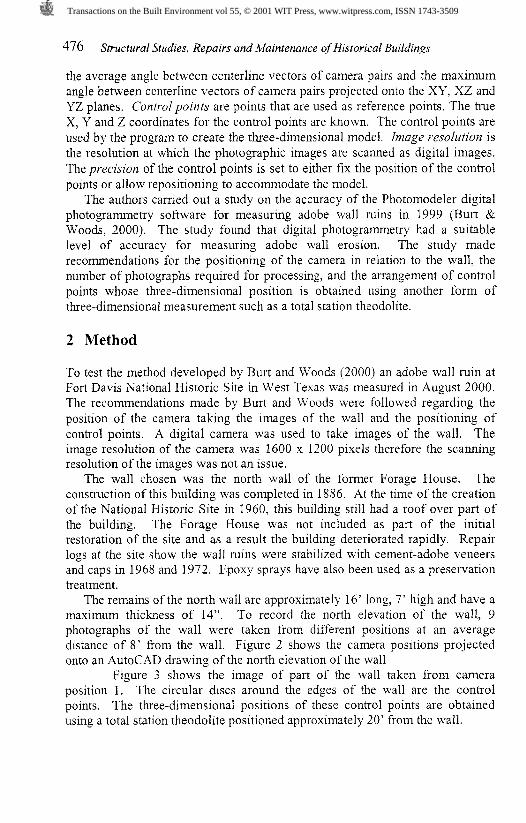
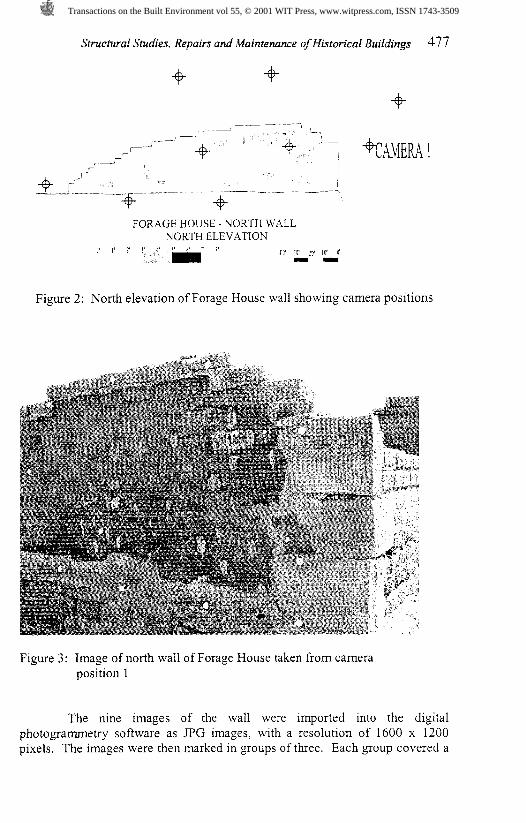
The remains of the north wall are approximately 16' long, 7' high and have a maximum thickness of 14". To record the north elevation of the wall, 9 photographs of the wall were taken from different positions at an average distance of 8 ' from the wall. Figure 2 shows the camera positions projected onto an AutoCAD drawing of the north elevation of the wall
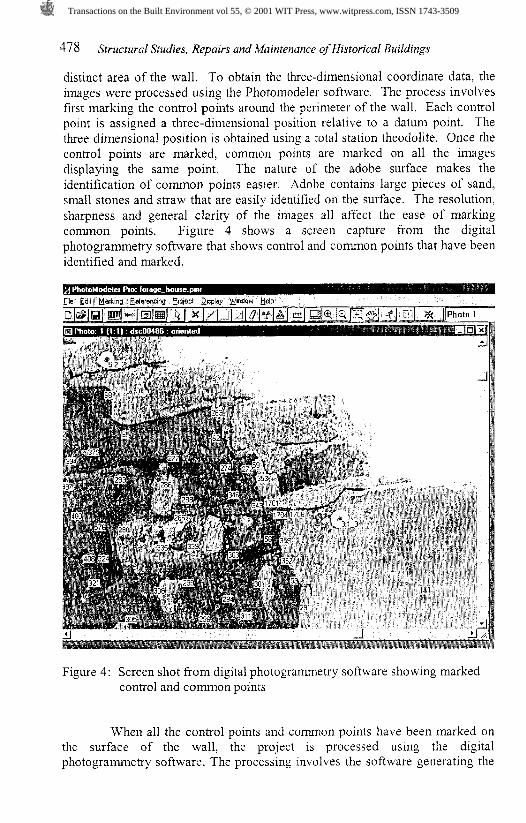
Figure 3 shows the image of part of the wall taken from camera position 1. The circular discs around the edges of the wall are the control points. The three-dimensional positions of these control points are obtained using a total station theodolite positioned approximately 20' from the wall.
Transactions on the Built Environment vol 55, © 2001 WIT Press, www.witpress.com, ISSN 1743-3509
Stnrc&ral Studies, Repairs and Maintenance afHistoi-ieal Buildings 477
FORAGE HOUSE - NORTH WALL NORTH ELEVATION
G' I * Y Y r I I, 1r C' T I V I I I
Figure 2: North elevation of Forage House wall showing camera positions
Figure 3: Image of north wall of Forage House taken from camera position 1
The nine images of the wall were imported into the digital photogrammetry software as P G images, with a resolution of 1600 X 1200 pixels. The images were then marked in groups of three. Each group covered a
Transactions on the Built Environment vol 55, © 2001 WIT Press, www.witpress.com, ISSN 1743-3509
478 Structural Studies, Repairs and Maintenance ofHistorica1 Buildings
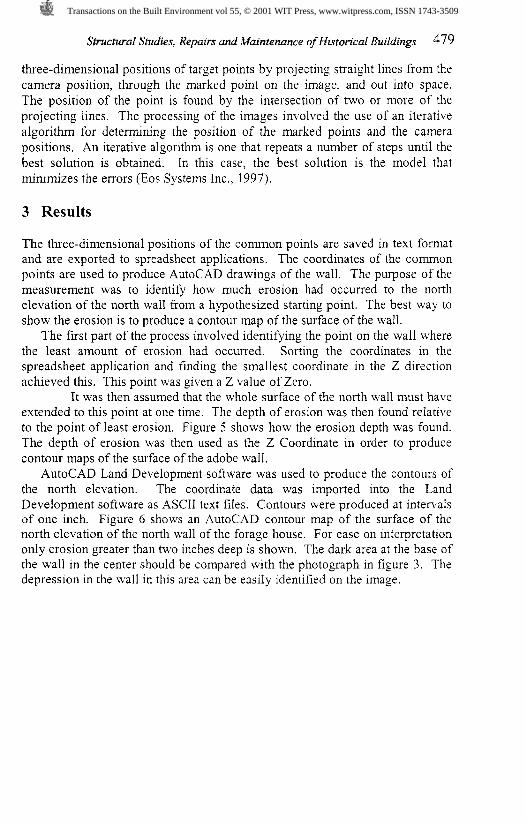
distinct area of the wall. To obtain the three-dimensional coordinate data, the images were processed using the Photomodeler software. The process involves fnst marking the control points around the perimeter of the wall. Each control point is assigned a three-dimensional position relative to a datum pomt. The three dimensional position is obtained using a total station theodolite. Once the control points are marked, common points are marked on all the images displaying the same point. The nature of the adobe surface makes the identification of common points easier. Adobe contains large pieces of sand, small stones and straw that are easily identified on the surface. The resolution, sharpness and general clarity of the images all affect the ease of marking common points. Figure 4 shows a screen capture from the digital photogrammetry software that shows control and common points that have been identified and marked.
Figure 4: Screen shot from digital photogrammetry software showing marked control and common points
When all the control points and common points have been marked on the surface of the wall, the project is processed using the digital photogrammetry software. The processing involves the software generating the
Transactions on the Built Environment vol 55, © 2001 WIT Press, www.witpress.com, ISSN 1743-3509
three-dimensional positions of target points by projecting straight lines from the camera position, through the marked point on the image, and out into space. The position of the point is found by the intersection of two or more of the projecting lines. The processing of the images involved the use of an iterative algorithm for determining the position of the marked points and the camera positions. An iterative algorithm is one that repeats a number of steps until the best solution is obtained. In this case, the best solution is the model that minimizes the errors (Eos Systems Inc., 1997).
3 Results
The three-dimensional positions of the common points are saved in text format and are exported to spreadsheet applications. The coordinates of the common points are used to produce AutoCAD drawings of the wall. The purpose of the measurement was to identify how much erosion had occurred to the north elevation of the north wall from a hypothesized starting point. The best way to show the erosion is to produce a contour map of the surface of the wall.
The first part of the process involved identifying the point on the wall where the least amount of erosion had occurred. Sorting the coordinates in the spreadsheet application and finding the smallest coordinate in the Z direction achieved this. This point was given a Z value of Zero.
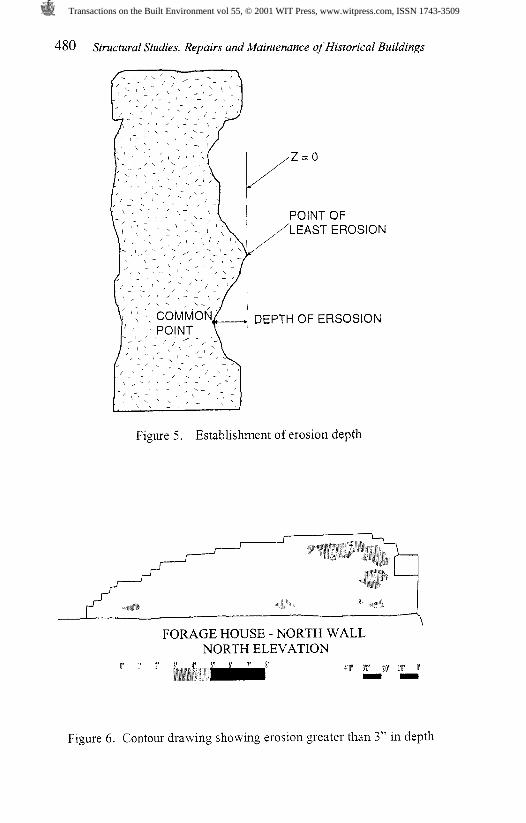
It was then assumed that the whole surface of the north wall must have extended to this point at one time. The depth of erosion was then found relative to the point of least erosion. Figure 5 shows how the erosion depth was found. The depth of erosion was then used as the Z Coordinate in order to produce contour maps of the surface of the adobe wall.
AutoCAD Land Development software was used to produce the contours of the north elevation. The coordinate data was imported into the Land Development software as ASCII text files. Contours were produced at intervals of one inch. Figure 6 shows an AutoCAD contour map of the surface of the north elevation of the north wall of the forage house. For ease on interpretation only erosion greater than two inches deep is shown. The dark area at the base of the wall in the center should be compared with the photograph in figure 3. The depression in the wall in this area can be easily identified on the image.
Transactions on the Built Environment vol 55, © 2001 WIT Press, www.witpress.com, ISSN 1743-3509
480 Structural Studies, Repairs and Maintenance of Historical Buildings
Figure 5. Establishment of erosion depth
-&a j -
*
FORAGE HOUSE - NORTH WALL NORTH ELEVATION
Figure 6. Contour drawing showing erosion greater than 3" in depth
Transactions on the Built Environment vol 55, © 2001 WIT Press, www.witpress.com, ISSN 1743-3509
4 Discussion
The results show that digital photogrammetry can obtain the three-dimensional position of the surface of an eroded wall. The remote nature of the measurement t e c h q u e avoids contact with the fragile adobe surface. The coordinate data is used to produce contour maps of the surface of the wall that show areas where erosion is greatest.
The next phase in the research is to record 19 adobe wall ruins at Fort Davis National Historic Site. Contour maps of each elevation will be produced to show how much erosion has occurred from the point of least erosion. These contour maps will then be used as a base to record the rate at which the walls erode in the future. The measurement of the walls will commence in August 200 1.
References
Burt, R. & Woods. P. Presenting Erosion Occurring to Historic Adobe Walls at Fort Davis National Historic Site Using Graphical and Computer Representations. Proceedings of the 1997 ARCC Spring Research Co~zference, eds. C. W . Berryman, University of Nebraska: Lincoln, pp. 107-1 12. 1997.
Burt, R., Warden, R. & Woods, P. Three-Dimensional Modeling of Erosion to Historic Adobe Wall Ruins at Fort Davis, Texas, The Journal of Presewation Techrtology, XXIX, pp. 35-38, 1998.
Eos Systems Inc.. PhotoModeler Pro User Manual. Eos Systems Inc.:Vancouver, 1997.
Hanke, K. Accuracy study project of Eos systems ' Photomodele~ (Electronic technical report). Eos Systems Inc.: Vancouver, 1998.
MC Dougall, K. & Jensen, J. Phorogrammetrzc Feasibiliv Study of Fort Selden for the Getty Consewation Institute. The University of Queensland.: Brisbane, 1989.
Transactions on the Built Environment vol 55, © 2001 WIT Press, www.witpress.com, ISSN 1743-3509