Embed Size (px)
DESCRIPTION
Closing the Achievement Gap. 2011 Connecticut Mastery Test Results and Analysis: Elementary, Intermediate, and Middle School 2008 - 2011 Connecticut Assessment Performance Test Results/Analysis for Secondary Schools - Grade 10 A Comparison Between Bloomfield and the State of Connecticut - PowerPoint PPT Presentation
Citation preview
BLOOMFIELD PUBLIC SCHOOLS B Learning and Growing Together
1
Closing the Achievement Gap• 2011 Connecticut Mastery Test Results and Analysis:
Elementary, Intermediate, and Middle School
• 2008 - 2011 Connecticut Assessment Performance Test Results/Analysis for Secondary Schools - Grade 10
• A Comparison Between Bloomfield and the State of Connecticut
• Establishing Annual Targets and Timelines for CMT and CAPT District Wide Achievement
September 2011
Dr. James ThompsonSuperintendent of Schools
BLOOMFIELD PUBLIC SCHOOLS B Learning and Growing Together
2
Today, I will share with you…• A comparison of 3 years of Connecticut Mastery Test data
• Reading (Grades 3-8)• Mathematics (Grades 3-8)
• Sample Matched Cohort Data for At or Above Goal for Reading and Mathematics
• A Comparison of 4 year of Connecticut Assessment Performance Test in Reading and in Math.
• Strengths, Concerns, and Implications/Next Steps for each content area
• The Achievement Gap between Bloomfield and the State in Reading and Mathematics, as evidenced by the:
• Connecticut Mastery Test (CMT)• Connecticut Academic Performance Test (CAPT)
• Establish Annual Targets and Timelines to Close the Achievement Gap
September 2011
BLOOMFIELD PUBLIC SCHOOLS B Learning and Growing Together
• Laurel Elementary (Grades 3-4)• Carmen Arace Intermediate (Grades 5-6)• Carmen Arace Middle (Grades 7-8)
3
2011 CONNECTICUT MASTERY TEST RESULTS AND ANALYSISELEMENTARY, INTERMEDIATE, AND MIDDLE SCHOOL
September 2011
BLOOMFIELD PUBLIC SCHOOLS B Learning and Growing Together
4
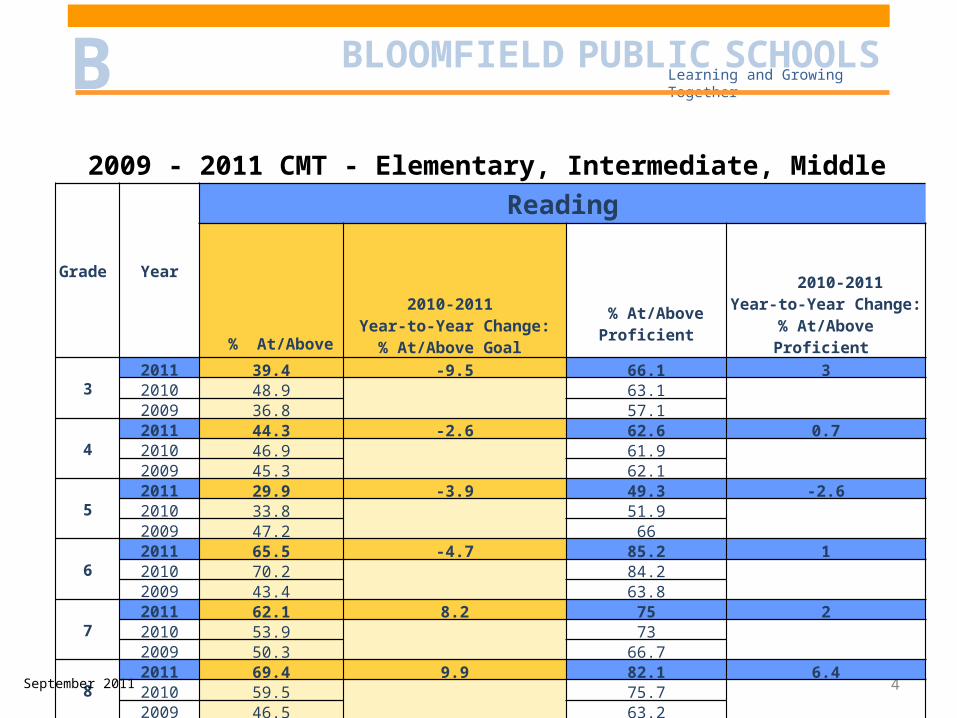
2009 - 2011 CMT - Elementary, Intermediate, Middle School Results
Grade Year
Reading
% At/Above Goal
2010-2011 Year-to-Year Change:
% At/Above Goal
% At/Above
Proficient
2010-2011 Year-to-Year Change:
% At/Above Proficient
32011 39.4 -9.5 66.1 32010 48.9
63.1
2009 36.8 57.1
42011 44.3 -2.6 62.6 0.72010 46.9
61.9
2009 45.3 62.1
52011 29.9 -3.9 49.3 -2.62010 33.8
51.9
2009 47.2 66
62011 65.5 -4.7 85.2 12010 70.2
84.2
2009 43.4 63.8
72011 62.1 8.2 75 22010 53.9
73
2009 50.3 66.7
82011 69.4 9.9 82.1 6.42010 59.5
75.7
2009 46.5 63.2
September 2011
BLOOMFIELD PUBLIC SCHOOLS B Learning and Growing Together
5
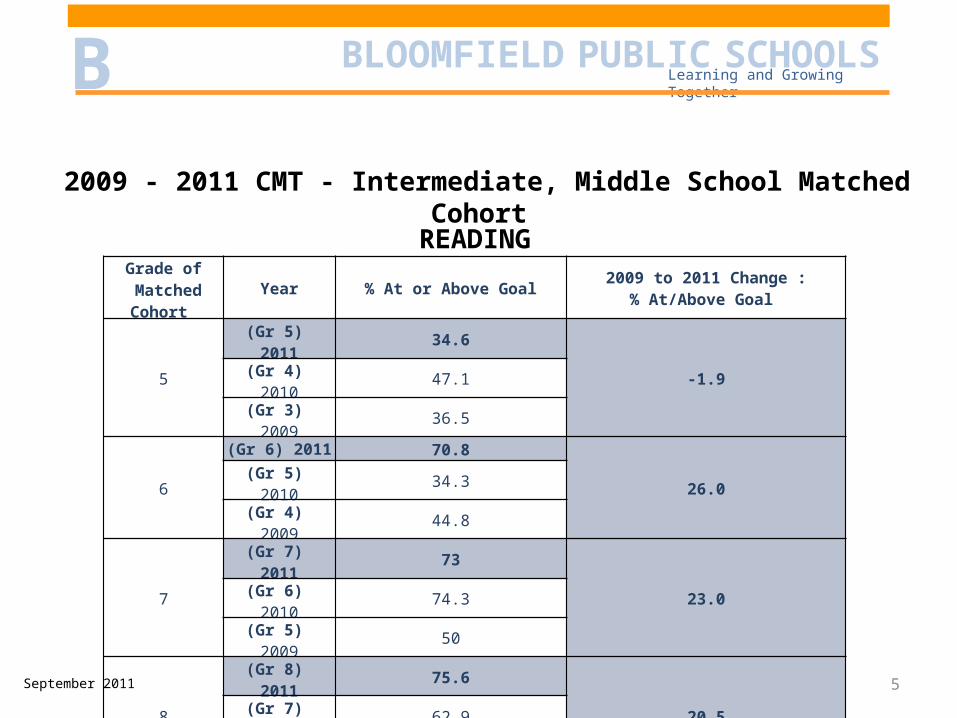
2009 - 2011 CMT - Intermediate, Middle School Matched Cohort
READINGGrade of
Matched Cohort Year % At or Above Goal 2009 to 2011 Change :% At/Above Goal
5
(Gr 5) 2011 34.6-1.9(Gr 4) 2010 47.1
(Gr 3) 2009 36.5
6
(Gr 6) 2011 70.826.0(Gr 5) 2010 34.3
(Gr 4) 2009 44.8
7
(Gr 7) 2011 7323.0(Gr 6) 2010 74.3
(Gr 5) 2009 50
8
(Gr 8) 2011 75.620.5(Gr 7) 2010 62.9
(Gr 6) 2009 55.1
September 2011
BLOOMFIELD PUBLIC SCHOOLS B Learning and Growing Together
6
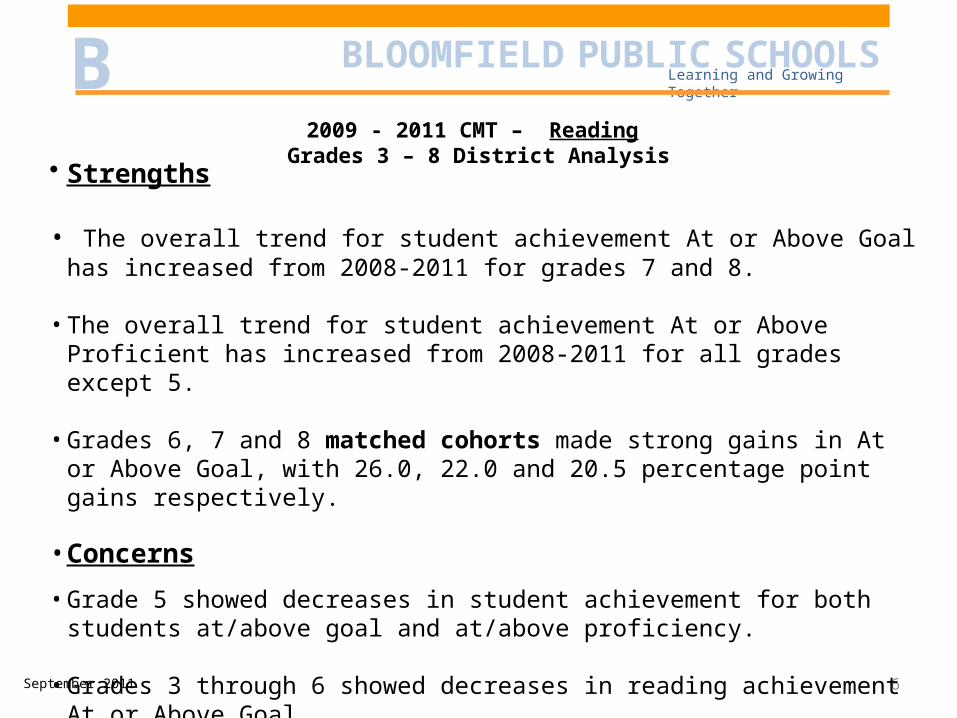
2009 - 2011 CMT – Reading Grades 3 – 8 District Analysis• Strengths
• The overall trend for student achievement At or Above Goal has increased from 2008-2011 for grades 7 and 8.
• The overall trend for student achievement At or Above Proficient has increased from 2008-2011 for all grades except 5.
• Grades 6, 7 and 8 matched cohorts made strong gains in At or Above Goal, with 26.0, 22.0 and 20.5 percentage point gains respectively.
• Concerns
• Grade 5 showed decreases in student achievement for both students at/above goal and at/above proficiency.
• Grades 3 through 6 showed decreases in reading achievement At or Above Goal.
September 2011
BLOOMFIELD PUBLIC SCHOOLS B Learning and Growing Together
7
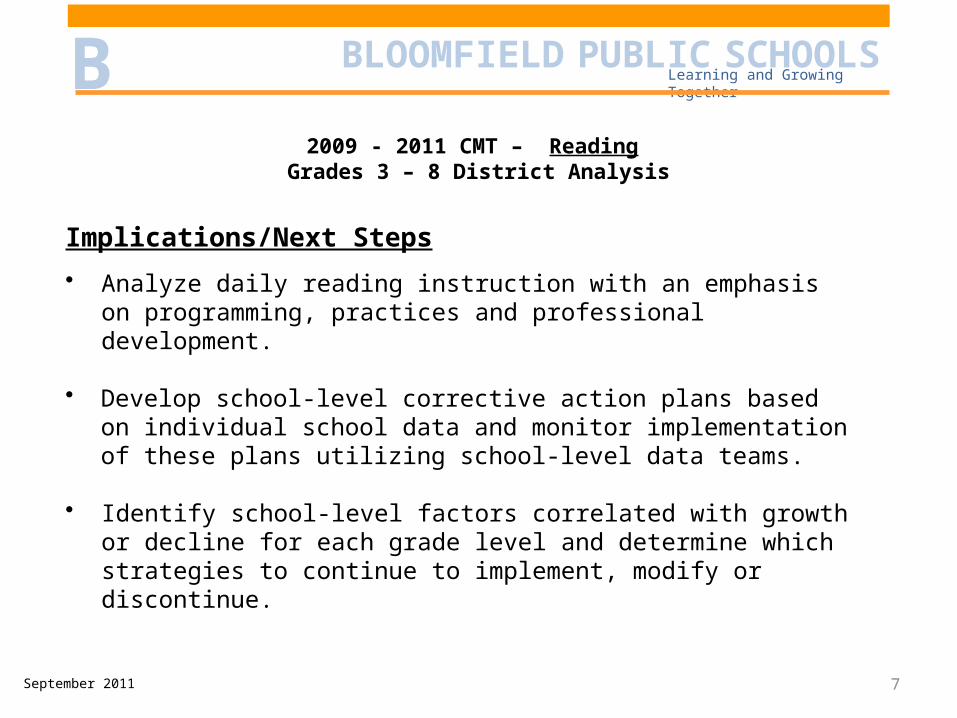
2009 - 2011 CMT – Reading Grades 3 – 8 District Analysis
Implications/Next Steps
• Analyze daily reading instruction with an emphasis on programming, practices and professional development.
• Develop school-level corrective action plans based on individual school data and monitor implementation of these plans utilizing school-level data teams.
• Identify school-level factors correlated with growth or decline for each grade level and determine which strategies to continue to implement, modify or discontinue.
September 2011
BLOOMFIELD PUBLIC SCHOOLS B Learning and Growing Together
Implications/Next Steps (continued)
• Implement and monitor effective teaching strategies to increase student engagement in English Language Arts and math.
• Monitor student progress by establishing data teams at all schools and grade levels.
• Implement walkthrough protocols for effective classroom environments and monitor follow through.
2009 - 2011 CMT – Reading Grades 3 – 8 District Analysis
September 2011 8
BLOOMFIELD PUBLIC SCHOOLS B Learning and Growing Together
9
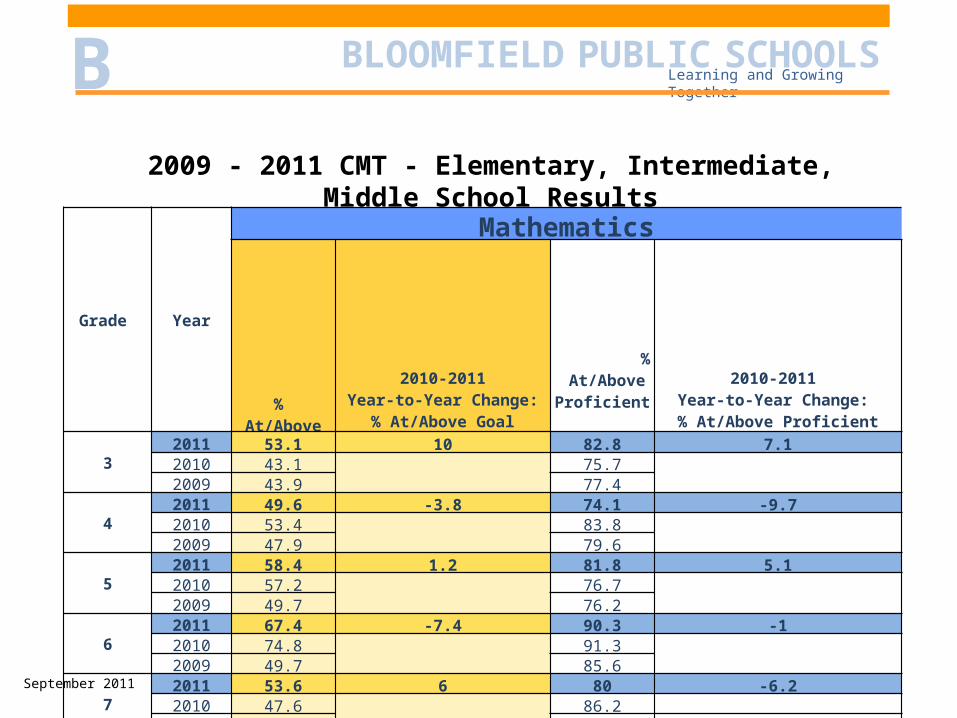
2009 - 2011 CMT - Elementary, Intermediate, Middle School Results
Grade Year
Mathematics %
At/Above Goal
2010-2011Year-to-Year Change:
% At/Above Goal
% At/Above
Proficient
2010-2011 Year-to-Year Change: % At/Above Proficient
32011 53.1 10 82.8 7.12010 43.1
75.7
2009 43.9 77.4
42011 49.6 -3.8 74.1 -9.72010 53.4
83.8
2009 47.9 79.6
52011 58.4 1.2 81.8 5.12010 57.2
76.7
2009 49.7 76.2
62011 67.4 -7.4 90.3 -12010 74.8
91.3
2009 49.7 85.6
72011 53.6 6 80 -6.22010 47.6
86.2
2009 48.6 81.1
82011 37.8 -9.9 77.8 -3.42010 47.7
81.2
2009 44.4 73.3September 2011
BLOOMFIELD PUBLIC SCHOOLS B Learning and Growing Together
10
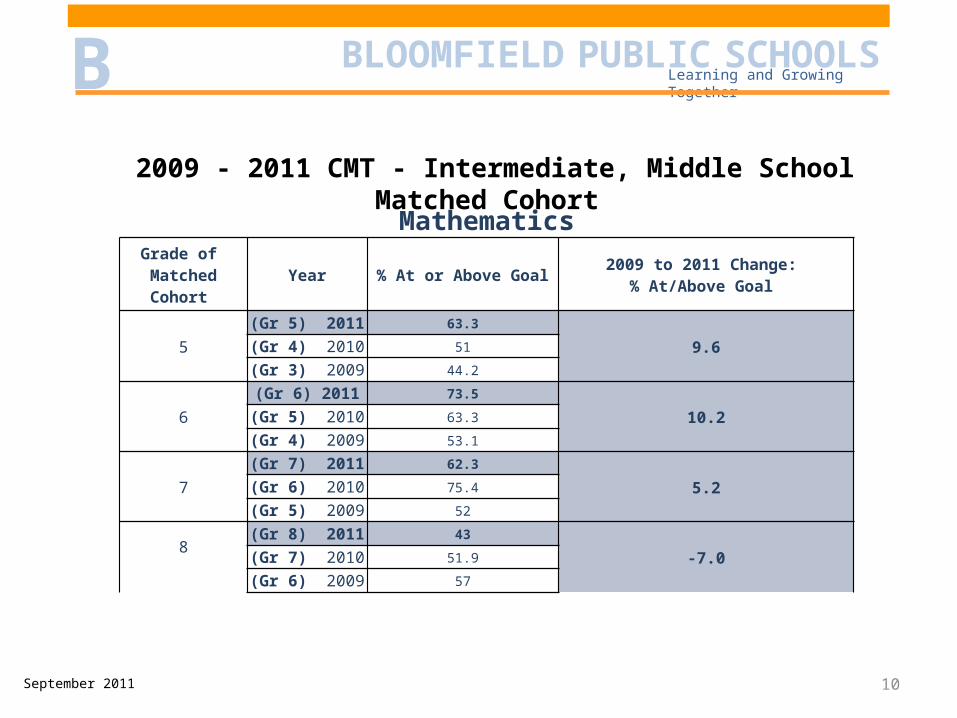
2009 - 2011 CMT - Intermediate, Middle School Matched Cohort
MathematicsGrade of
Matched Cohort Year % At or Above Goal 2009 to 2011 Change: % At/Above Goal
5
(Gr 5) 2011 63.3
9.6(Gr 4) 2010 51
(Gr 3) 2009 44.2
6
(Gr 6) 2011 73.5
10.2(Gr 5) 2010 63.3
(Gr 4) 2009 53.1
7
(Gr 7) 2011 62.3
5.2(Gr 6) 2010 75.4
(Gr 5) 2009 52
8
(Gr 8) 2011 43
-7.0(Gr 7) 2010 51.9
(Gr 6) 2009 57
September 2011
BLOOMFIELD PUBLIC SCHOOLS B Learning and Growing Together
11
2009 - 2011 CMT – MathematicsDistrict Analysis Grades 3 - 8
Strengths
•Three of the four Matched cohorts showed a positive upward trend for At or Above Goal (cohorts from grades 5,6 and 7)
•Grade 3 progress of 10 percentage points for students At or Above Goal, is especially commendable.
Concerns
•Mathematics achievement did not show the desired growth at the At or Above Goal level of achievement in Grades 4 and 8.
•The matched cohort data shows that the 8th grade cohort has had a steady decline at the goal level of achievement for the past three years
September 2011
BLOOMFIELD PUBLIC SCHOOLS B Learning and Growing Together
12
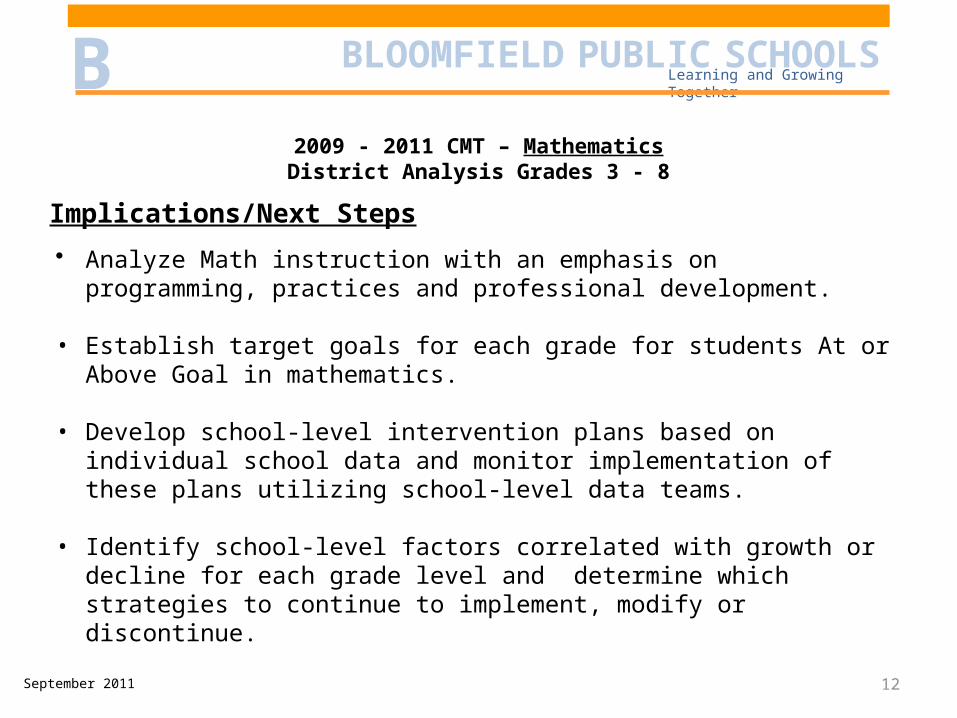
2009 - 2011 CMT – MathematicsDistrict Analysis Grades 3 - 8
Implications/Next Steps
• Analyze Math instruction with an emphasis on programming, practices and professional development.
• Establish target goals for each grade for students At or Above Goal in mathematics.
• Develop school-level intervention plans based on individual school data and monitor implementation of these plans utilizing school-level data teams.
• Identify school-level factors correlated with growth or decline for each grade level and determine which strategies to continue to implement, modify or discontinue.
September 2011
BLOOMFIELD PUBLIC SCHOOLS B Learning and Growing Together
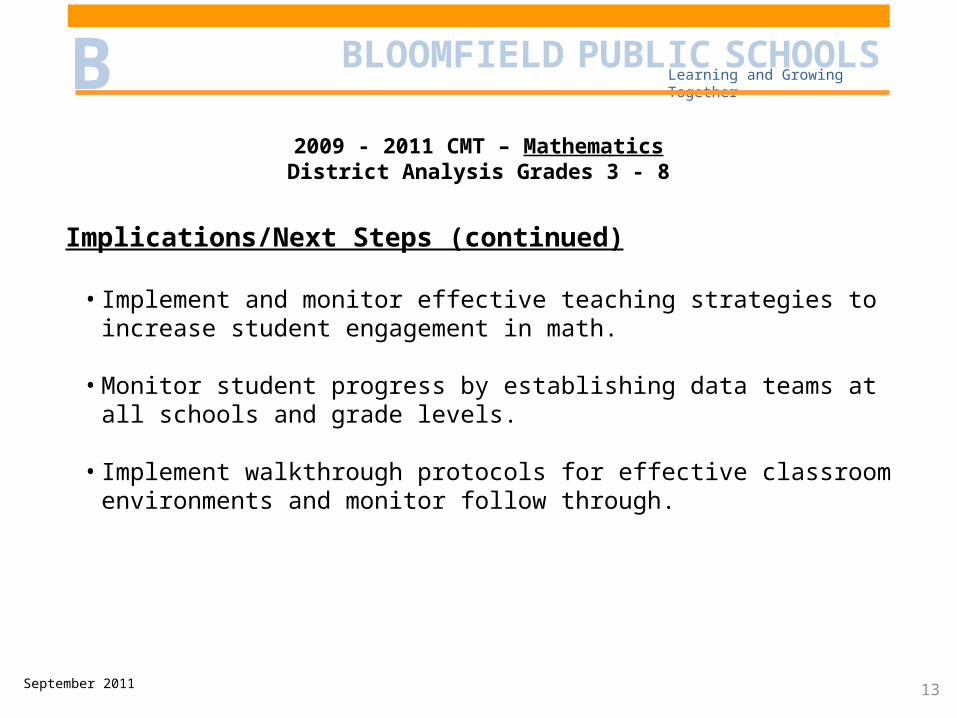
Implications/Next Steps (continued)
• Implement and monitor effective teaching strategies to increase student engagement in math.
• Monitor student progress by establishing data teams at all schools and grade levels.
• Implement walkthrough protocols for effective classroom environments and monitor follow through.
2009 - 2011 CMT – MathematicsDistrict Analysis Grades 3 - 8
September 2011 13
BLOOMFIELD PUBLIC SCHOOLS B Learning and Growing Together
• Big Picture High School• Bloomfield High School
14
2008 - 2011 CONNECTICUT ASSESSMENT PERFORMANCE TEST RESULTS/ANALYSIS FOR SECONDARY SCHOOLS
GRADE 10
September 2011
BLOOMFIELD PUBLIC SCHOOLS B Learning and Growing Together
15
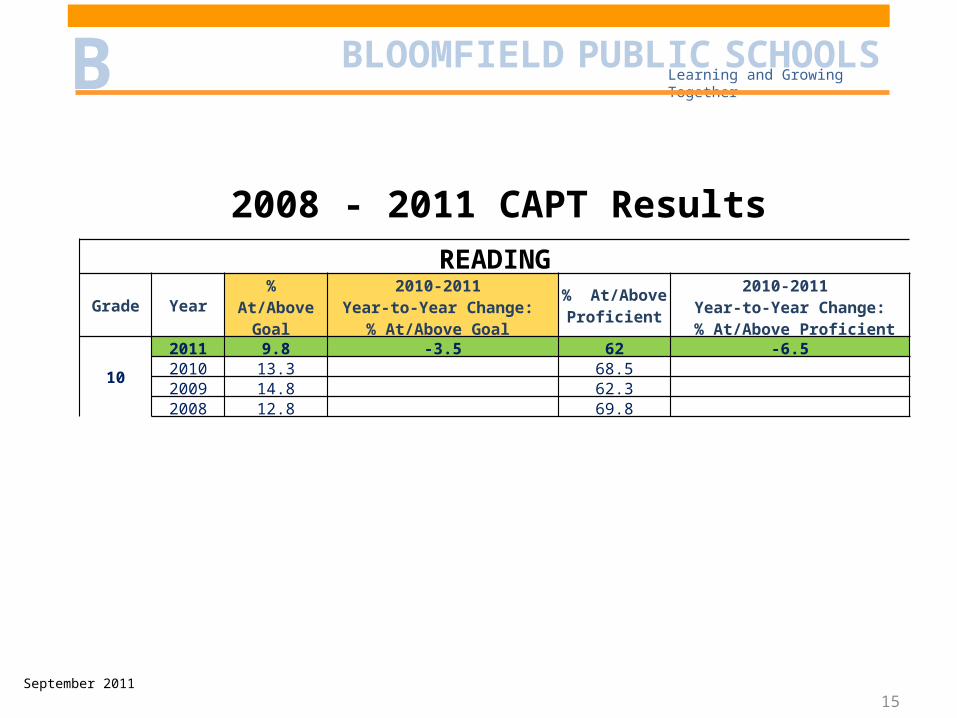
2008 - 2011 CAPT ResultsREADING
Grade Year % At/Above Goal
2010-2011 Year-to-Year Change:
% At/Above Goal % At/Above
Proficient2010-2011
Year-to-Year Change: % At/Above Proficient
10
2011 9.8 -3.5 62 -6.52010 13.3 68.5 2009 14.8 62.3 2008 12.8 69.8
September 2011
BLOOMFIELD PUBLIC SCHOOLS B Learning and Growing Together
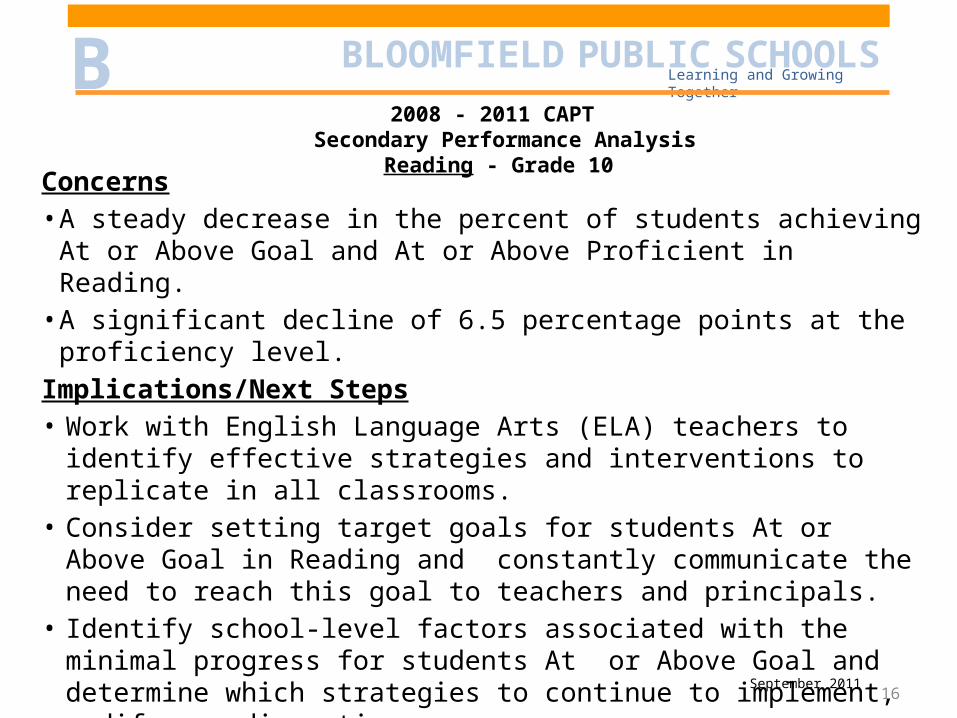
Concerns• A steady decrease in the percent of students achieving At or Above Goal and At
or Above Proficient in Reading.• A significant decline of 6.5 percentage points at the proficiency level.Implications/Next Steps• Work with English Language Arts (ELA) teachers to identify effective strategies
and interventions to replicate in all classrooms. • Consider setting target goals for students At or Above Goal in Reading and
constantly communicate the need to reach this goal to teachers and principals.• Identify school-level factors associated with the minimal progress for students
At or Above Goal and determine which strategies to continue to implement, modify or discontinue.
• Develop specific strategies for improvement of Grade 10 Reading by further analyzing the data and determining specific areas of skill sets and subsets that need to be addressed.
16September 2011
2008 - 2011 CAPT Secondary Performance Analysis
Reading - Grade 10
BLOOMFIELD PUBLIC SCHOOLS B Learning and Growing Together
17
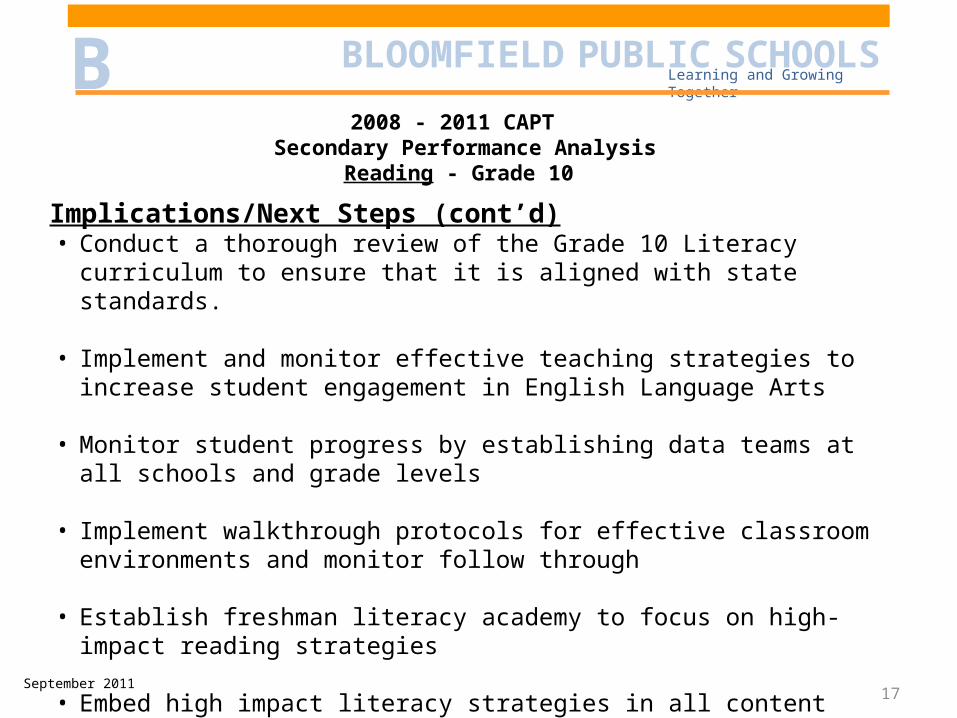
Implications/Next Steps (cont’d)• Conduct a thorough review of the Grade 10 Literacy curriculum to ensure that it is
aligned with state standards.
• Implement and monitor effective teaching strategies to increase student engagement in English Language Arts
• Monitor student progress by establishing data teams at all schools and grade levels
• Implement walkthrough protocols for effective classroom environments and monitor follow through
• Establish freshman literacy academy to focus on high-impact reading strategies
• Embed high impact literacy strategies in all content areas for students in grades 9 and 10 through disciplinary literacy approach.
2008 - 2011 CAPT Secondary Performance Analysis
Reading - Grade 10
September 2011
BLOOMFIELD PUBLIC SCHOOLS B Learning and Growing Together
1818
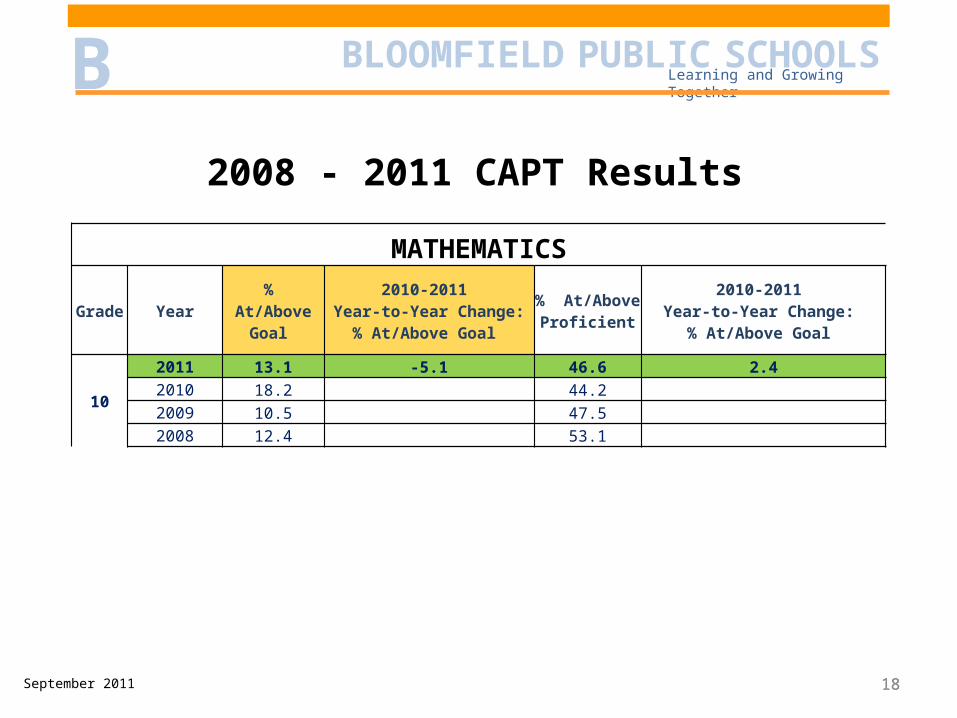
2008 - 2011 CAPT Results
MATHEMATICS
Grade Year % At/Above Goal
2010-2011 Year-to-Year Change: %
At/Above Goal % At/Above
Proficient2010-2011
Year-to-Year Change: % At/Above Goal
10
2011 13.1 -5.1 46.6 2.42010 18.2 44.2 2009 10.5 47.5 2008 12.4 53.1
September 2011
BLOOMFIELD PUBLIC SCHOOLS B Learning and Growing Together
19
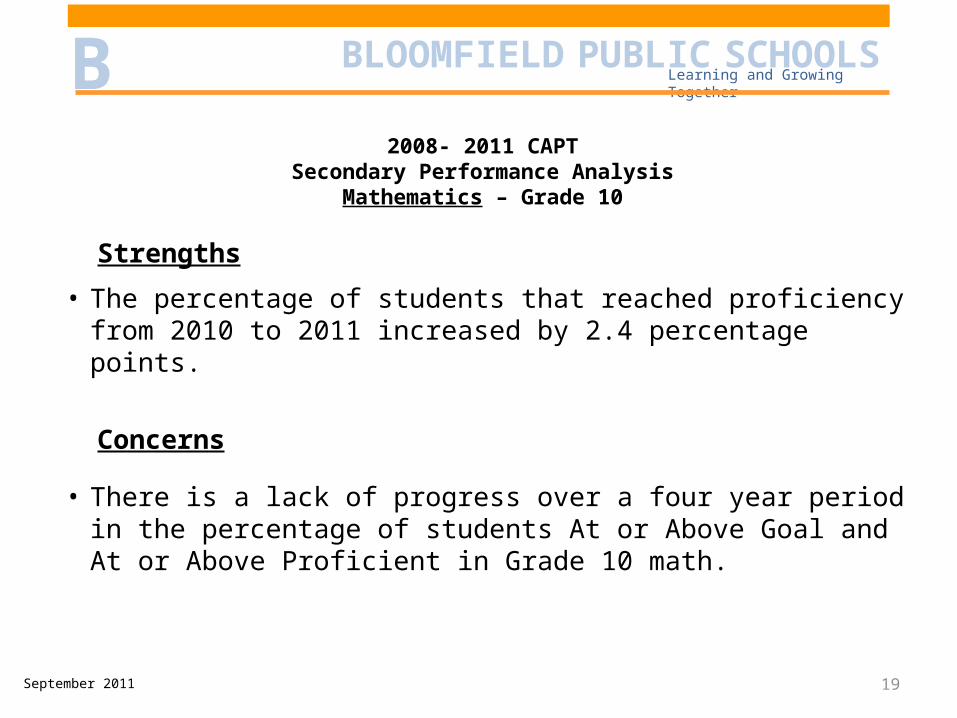
Strengths
• The percentage of students that reached proficiency from 2010 to 2011 increased by 2.4 percentage points.
Concerns
• There is a lack of progress over a four year period in the percentage of students At or Above Goal and At or Above Proficient in Grade 10 math.
2008- 2011 CAPTSecondary Performance Analysis
Mathematics – Grade 10
September 2011
BLOOMFIELD PUBLIC SCHOOLS B Learning and Growing Together
20
Implications/Next Steps•Conduct an analysis of math instruction in both secondary schools with particular
review of instructional programming and practices as well as the professional development offered to teachers.
•Consider offering specialized math instruction for students experiencing problems as evidenced by test data.
•Consider establishing a district-wide target for Grade 10 math that demonstrates incremental growth for the percentage of students At or Above Goal.
•Develop school-level corrective action plans based on individual school data and monitor implementation of these plans utilizing school-level data teams.
• Identify students who are not only experiencing problems but also those who are close to reaching At or Above Goal and provide specialized instruction for them to help get them to goal.
2008- 2011 CAPTSecondary Performance Analysis
Mathematics – Grade 10
September 2011
BLOOMFIELD PUBLIC SCHOOLS B Learning and Growing Together
2008- 2011 CAPTSecondary Performance Analysis
Mathematics – Grade 10
Implications/Next Steps
• Implement and monitor effective teaching strategies to increase student engagement in math
• Monitor student progress by establishing data teams at all schools and grade levels
• Implement walkthrough protocols for effective classroom environments and monitor follow through
• Embed high impact literacy strategies in all content areas for students in grades 9 and 10 through disciplinary literacy approach
21September 2011
BLOOMFIELD PUBLIC SCHOOLS B Learning and Growing Together
A Comparison Between Bloomfield and the State of Connecticut
Establishing Annual Targets and Timelines for CMT and CAPT District Wide Achievement
September 2011
22
BLOOMFIELD PUBLIC SCHOOLS B Learning and Growing Together
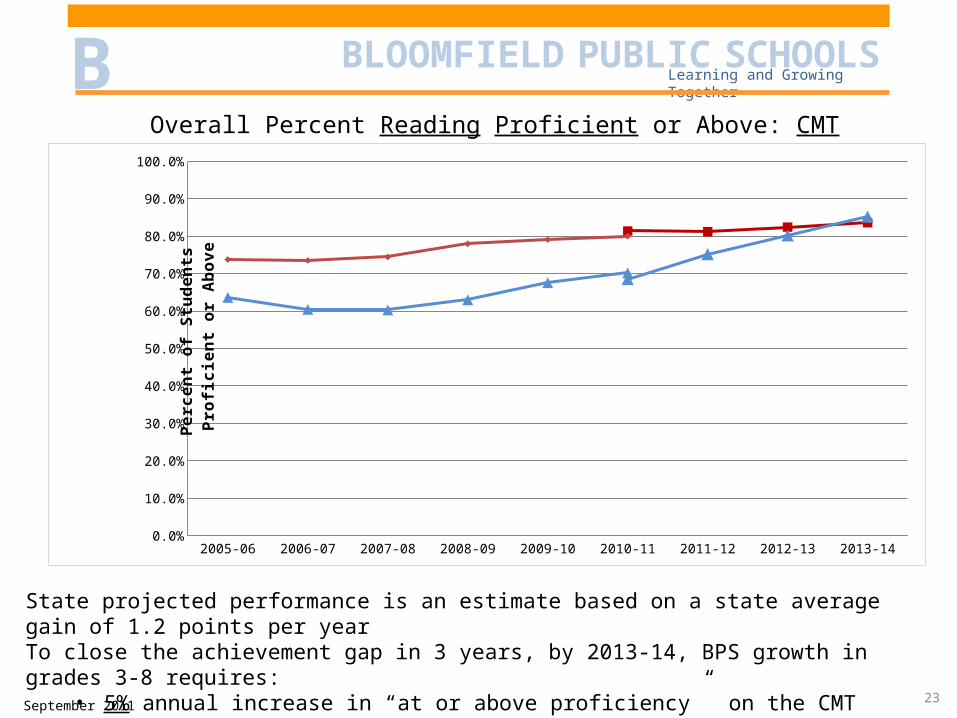
Overall Percent Reading Proficient or Above: CMT
23
State projected performance is an estimate based on a state average gain of 1.2 points per year To close the achievement gap in 3 years, by 2013-14, BPS growth in grades 3-8 requires:
• 5% annual increase in “at or above proficiency” on the CMT
2005-06 2006-07 2007-08 2008-09 2009-10 2010-11 2011-12 2012-13 2013-14
CMT Reading State Pro-jected
NaN NaN NaN NaN NaN 0.813827266627529
0.812000000000001
0.824000000000001
0.836000000000001
CMT Reading State Ac-tual
0.737532359472507
0.735236799722781
0.7444074728142
0.779510179824871
0.790827266627529
0.8 NaN NaN NaN
CMT Reading Bloomfield Pro-jected
NaN NaN NaN NaN NaN 0.685555029585801
0.752000000000002
0.802 0.852000000000001
CMT Reading Bloomfield Ac-tual
0.636533270852859
0.604282651072125
0.602872173058016
0.630200442967887
0.675555029585801
0.702000000000001
NaN NaN NaN
5.0%15.0%25.0%35.0%45.0%55.0%65.0%75.0%85.0%95.0%
Percent o
f S
tudents
Profi
cie
nt o
r A
bove
September 2011
BLOOMFIELD PUBLIC SCHOOLS B Learning and Growing Together
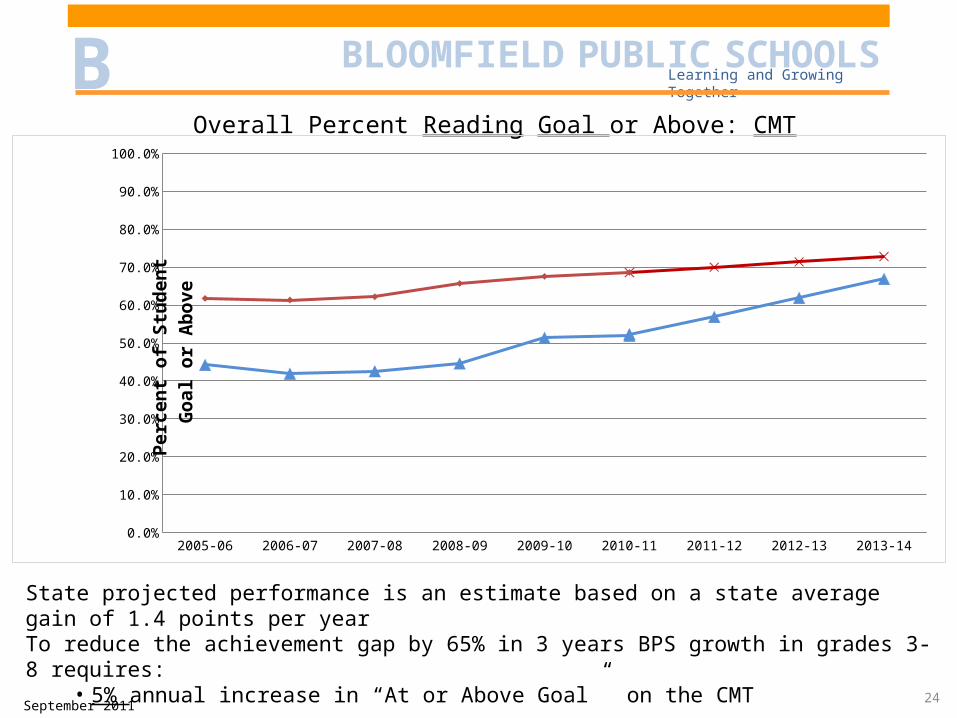
Overall Percent Reading Goal or Above: CMT
24
State projected performance is an estimate based on a state average gain of 1.4 points per year To reduce the achievement gap by 65% in 3 years BPS growth in grades 3-8 requires:
• 5% annual increase in “At or Above Goal” on the CMT
2005-06 2006-07 2007-08 2008-09 2009-10 2010-11 2011-12 2012-13 2013-14
CMT Read-ing State Pro-jected
NaN NaN NaN NaN NaN 0.685716371718527
0.700000000000001
0.714000000000001
0.728000000000001
CMT Read-ing State Actual
0.617727566141492
0.613427248349106
0.621921238733904
0.65692954954431
0.675716371718528
0.686 NaN NaN NaN
CMT Read-ing Bloomfield Pro-jected
NaN NaN NaN NaN NaN 0.523646153846154
0.569000000000001
0.619000000000002
0.669000000000003
CMT Read-ing Bloomfield Actual
0.442222118088097
0.419013645224173
0.425744346116027
0.44607973421927
0.513646153846154
0.519 NaN NaN NaN
5.0%15.0%25.0%35.0%45.0%55.0%65.0%75.0%85.0%95.0%
Pe
rce
nt
of
Stu
de
nt
Go
al o
r A
bo
ve
September 2011
BLOOMFIELD PUBLIC SCHOOLS B Learning and Growing Together
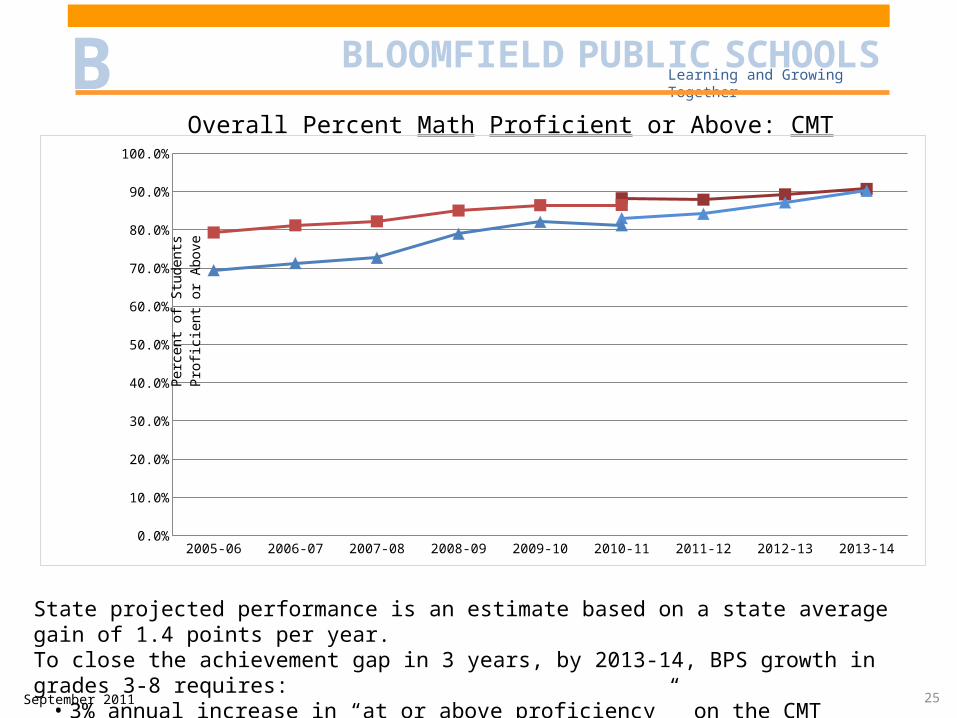
Overall Percent Math Proficient or Above: CMT
State projected performance is an estimate based on a state average gain of 1.4 points per year.To close the achievement gap in 3 years, by 2013-14, BPS growth in grades 3-8 requires:
• 3% annual increase in “at or above proficiency” on the CMT
25
2005-06 2006-07 2007-08 2008-09 2009-10 2010-11 2011-12 2012-13 2013-14
CMT Math State Pro-jected
NaN NaN NaN NaN NaN 0.882781131557379
0.879000000000002
0.893 0.907
CMT Math State Ac-tual
0.793081994921565
0.811978412683438
0.82234890048779
0.850533336355357
0.864781131557381
0.865000000000002
NaN NaN NaN
CMT Math Bloom-field Pro-jected
NaN NaN NaN NaN NaN 0.830881395348838
0.842000000000001
0.872000000000002
0.902
CMT Math Bloom-field Ac-tual
0.694500931098697
0.713240038872692
0.726815581854043
0.789630718954248
0.820881395348838
0.812000000000001
NaN NaN NaN
5.0%15.0%25.0%35.0%45.0%55.0%65.0%75.0%85.0%95.0%
Pe
rce
nt
of
Stu
de
nts
Pro
ficie
nt
or
Ab
ove
September 2011
BLOOMFIELD PUBLIC SCHOOLS B Learning and Growing Together
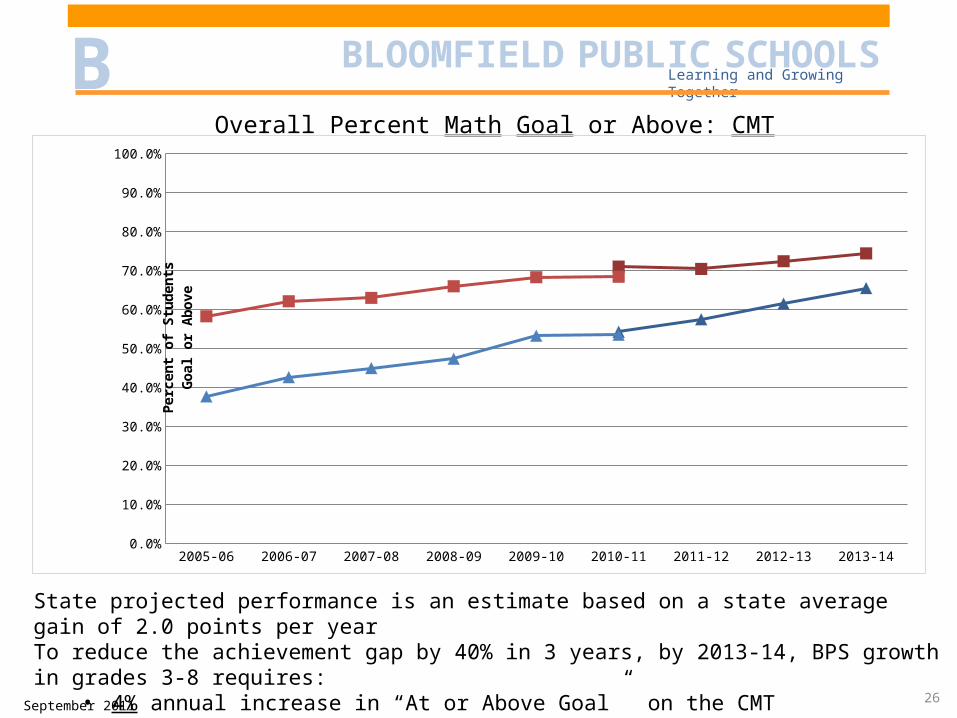
Overall Percent Math Goal or Above: CMT
State projected performance is an estimate based on a state average gain of 2.0 points per year To reduce the achievement gap by 40% in 3 years, by 2013-14, BPS growth in grades 3-8 requires:
• 4% annual increase in “At or Above Goal” on the CMT26
2005-06 2006-07 2007-08 2008-09 2009-10 2010-11 2011-12 2012-13 2013-14
CMT Math State Pro-jected
NaN NaN NaN NaN NaN 0.709932650743263
0.704000000000001
0.724000000000001
0.744000000000002
CMT Math State Ac-tual
0.582806388547035
0.621084607338904
0.629660978438758
0.659711736028982
0.682932650743263
0.684 NaN NaN NaN
CMT Math Bloomfield Pro-jected
NaN NaN NaN NaN NaN 0.542740697674423
0.575000000000001
0.615000000000002
0.655000000000002
CMT Math Bloomfield Ac-tual
0.377151769087524
0.42665986394558
0.449824457593689
0.473796296296296
0.532740697674423
0.535 NaN NaN NaN
5.0%15.0%25.0%35.0%45.0%55.0%65.0%75.0%85.0%95.0%
Percen
t o
f S
tu
den
ts
Go
al
or A
bo
ve
September 2011
BLOOMFIELD PUBLIC SCHOOLS B Learning and Growing Together
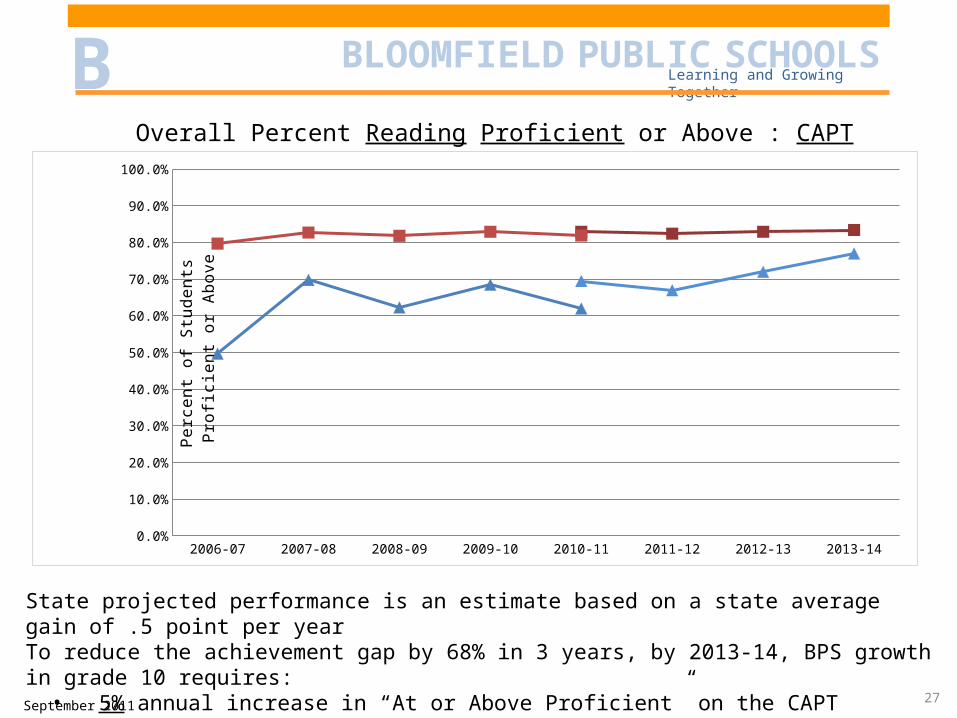
Overall Percent Reading Proficient or Above : CAPT
27
State projected performance is an estimate based on a state average gain of .5 point per year To reduce the achievement gap by 68% in 3 years, by 2013-14, BPS growth in grade 10 requires:
• 5% annual increase in “At or Above Proficient” on the CAPT
2006-07 2007-08 2008-09 2009-10 2010-11 2011-12 2012-13 2013-14
CAPT Read-ing State Pro-jected
NaN NaN NaN NaN 0.829000000000001
0.824 0.829000000000001
0.834000000000001
CAPT Read-ing State Actual
0.797 0.827000000000001
0.818 0.829000000000001
0.819 NaN NaN NaN
CAPT Read-ing Bloomfield Pro-jected
NaN NaN NaN NaN 0.695000000000001
0.670000000000003
0.720000000000001
0.770000000000002
CAPT Read-ing Bloomfield Actual
0.497000000000001
0.698 0.623000000000002
0.685 0.620000000000002
NaN NaN NaN
5.0%15.0%25.0%35.0%45.0%55.0%65.0%75.0%85.0%95.0%
Perc
ent
of
Stu
dents
Pro
ficie
nt
or
Above
September 2011
BLOOMFIELD PUBLIC SCHOOLS B Learning and Growing Together
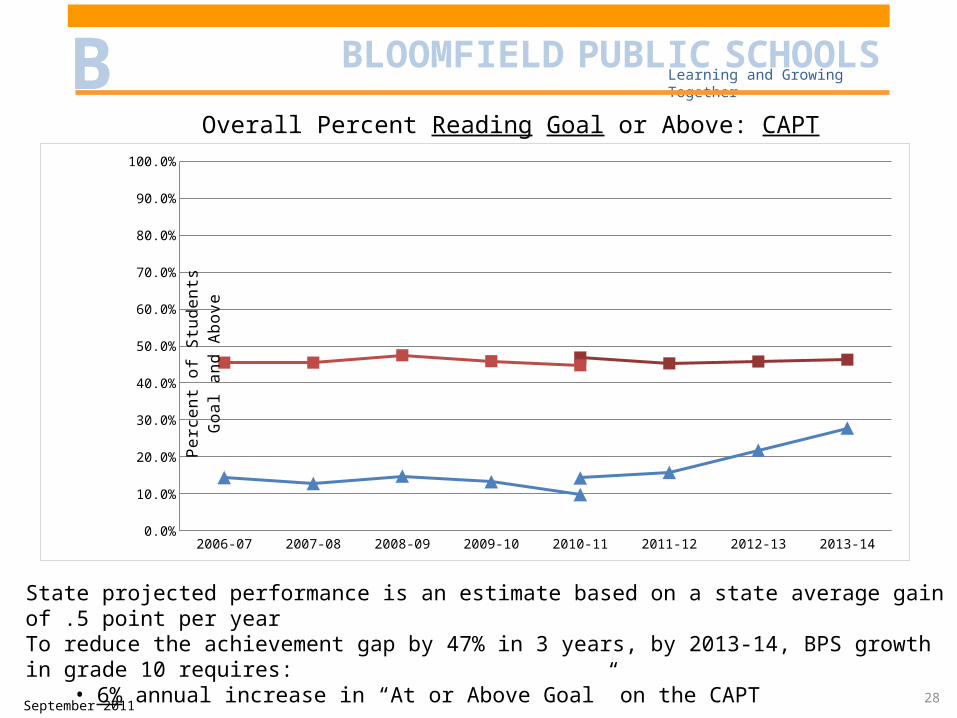
Overall Percent Reading Goal or Above: CAPT
28
State projected performance is an estimate based on a state average gain of .5 point per year To reduce the achievement gap by 47% in 3 years, by 2013-14, BPS growth in grade 10 requires:
• 6% annual increase in “At or Above Goal” on the CAPT
2006-07 2007-08 2008-09 2009-10 2010-11 2011-12 2012-13 2013-14
CAPT Reading State Projected NaN NaN NaN NaN 0.469 0.453 0.458 0.463
CAPT Reading State Actual 0.455 0.455 0.475 0.459 0.448 NaN NaN NaN
CAPT Reading Bloomfield Pro-jected
NaN NaN NaN NaN 0.143 0.158000000000001
0.218 0.278
CAPT Reading Bloomfield Ac-tual
0.144 0.128 0.148 0.133 0.0980000000000002
NaN NaN NaN
5.0%
15.0%
25.0%
35.0%
45.0%
55.0%
65.0%
75.0%
85.0%
95.0%
Perc
ent
of
Stu
dents
Goal a
nd A
bove
September 2011
BLOOMFIELD PUBLIC SCHOOLS B Learning and Growing Together
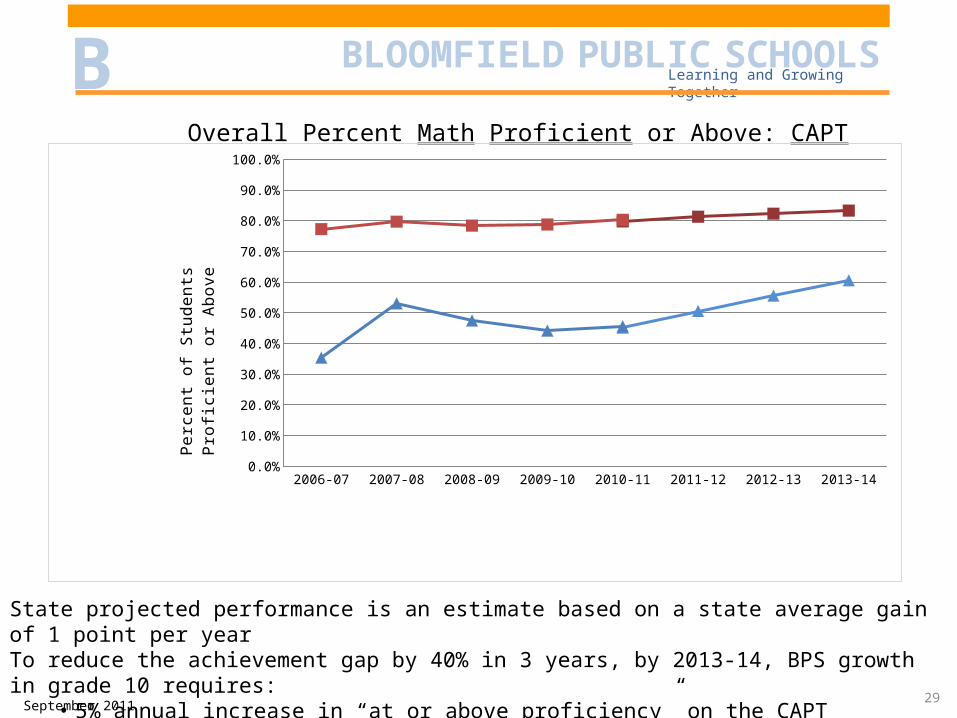
Overall Percent Math Proficient or Above: CAPT
State projected performance is an estimate based on a state average gain of 1 point per year To reduce the achievement gap by 40% in 3 years, by 2013-14, BPS growth in grade 10 requires:
• 5% annual increase in “at or above proficiency” on the CAPT
29
2006-07 2007-08 2008-09 2009-10 2010-11 2011-12 2012-13 2013-14
CAPT Math State Projected
NaN NaN NaN NaN 0.798 0.813000000000001
0.823000000000001
0.833000000000001
CAPT Math State Actual
0.773000000000002
0.797 0.784 0.788 0.803 NaN NaN NaN
CAPT Math Bloomfield Pro-jected
NaN NaN NaN NaN 0.452 0.506 0.556 0.606000000000001
CAPT Math Bloomfield Ac-tual
0.354 0.531 0.475 0.442 0.456 NaN NaN NaN
5.0%
15.0%
25.0%
35.0%
45.0%
55.0%
65.0%
75.0%
85.0%
95.0%Perc
ent
of
Stu
dents
Pro
ficie
nt
or
Above
September 2011
BLOOMFIELD PUBLIC SCHOOLS B Learning and Growing Together
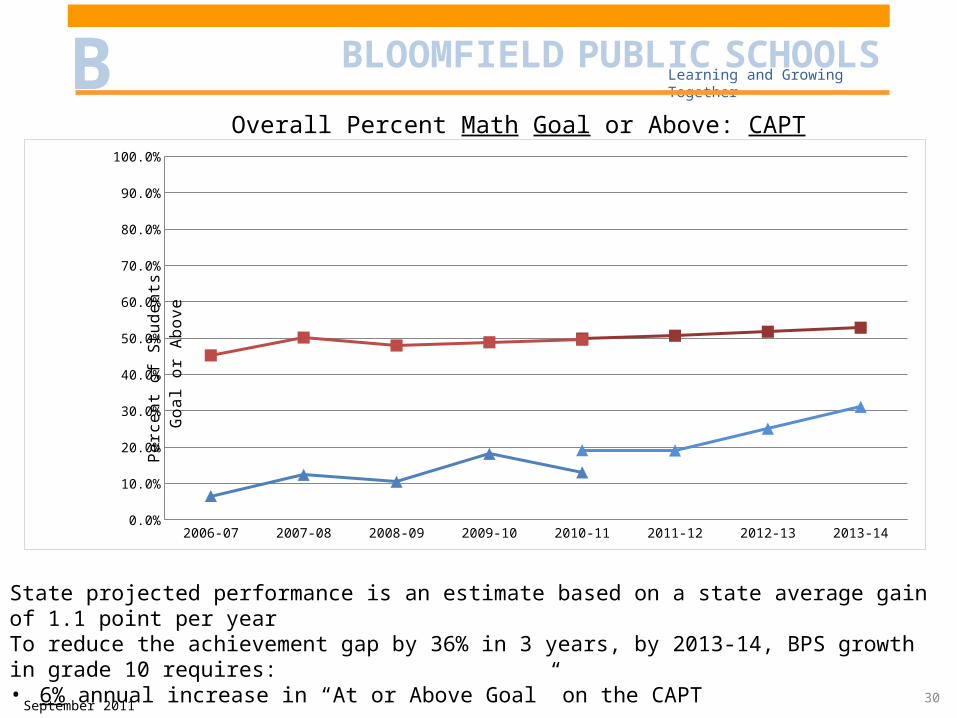
Overall Percent Math Goal or Above: CAPT
State projected performance is an estimate based on a state average gain of 1.1 point per year To reduce the achievement gap by 36% in 3 years, by 2013-14, BPS growth in grade 10 requires:• 6% annual increase in “At or Above Goal” on the CAPT
30
2006-07 2007-08 2008-09 2009-10 2010-11 2011-12 2012-13 2013-14
CAPT Math State Projected NaN NaN NaN NaN 0.499000000000001
0.507 0.518 0.529
CAPT Math State Actual 0.453 0.502 0.48 0.489 0.496000000000001
NaN NaN NaN
CAPT Math Bloomfield Pro-jected
NaN NaN NaN NaN 0.192 0.191 0.251 0.311000000000001
CAPT Math Bloomfield Actual 0.066 0.124 0.105 0.182 0.131 NaN NaN NaN
5.0%
15.0%
25.0%
35.0%
45.0%
55.0%
65.0%
75.0%
85.0%
95.0%Perc
ent
of
Stu
dents
G
oal o
r A
bove
September 2011
BLOOMFIELD PUBLIC SCHOOLS B Learning and Growing Together
To Summarize…
31
Bloomfield Public Schools can eliminate the Achievement Gap in 2 Areas within 3 years:
• Reading Proficient or Above on the CMT• Math Proficient or Above on the CMT
Bloomfield Public Schools will close the Achievement Gap in Reading and Math, in both achievement levels, for the CMT and the CAPT within 8 years if the CMT and CAPT were to remain as the state assessment tools.
September 2011
BLOOMFIELD PUBLIC SCHOOLS B Learning and Growing Together
Paying attention to data improves student achievement.
September 2011 32