Embed Size (px)
Citation preview

CLOSING THEFISCAL POLICY LOOP:A LONG-RUN ANALYSIS
Technical Analysis PaperDecember 1977
Congress of the United StatesCongressional Budget OfficeWashington, D.C.

CLOSING THE FISCAL POLICY LOOP:A LONG-RUN ANALYSIS
The Congress of the United States
Congressional Budget Office
For sale by the Superintendent of Documents, U.S. Government Printing OfficeWashington, D.C. 20402

PREFACE
Closing the Fiscal Policy Loop; A Long-Run Analysis des-cribes an analytical tool for improving the usefulness of long-range projections of the federal budget.
In the past, long-range budget projections have employeda set of assumptions about future economic conditions and haveprojected the revenues and outlays that might be expected ifthese economic assumptions were somehow realized. Past studieshave not gone on to ask whether the projected budget provided toolittle or too much economic stimulus to be consistent with theeconomic assumptions. The present study does ask this question,and constructs a simple model for estimating how much addition to,or reduction in, a projected budget would be necessary for con-sistency with its underlying economic assumptions. Since theseestimates of required change in the budget depend critically on thestrength of demands in the private sector, the model is designed tohighlight the connection between fiscal stimulus and key measuresof the strength of private demands.
The report was prepared as background for Budget Option'sfor Fiscal Year 1978, Chapter II, CBO Report, February 1977. Inaccordance with CBO's mandate to provide objective analysis, thisreport offers no recommendations.
The report was prepared by David M. Rowe while he was a memberof the Fiscal Analysis Division of the Congressional Budget Office.It was typed by Debra Blagburn and Dorothy Kornegay and edited byPatricia Johnston.
Alice M. RivlinDirector
iii


TABLE OF CONTENTS
Page
Preface ill
Summary xi
Chapter I. Past Analysis of the Budget and the Economy... 1
Chapter II. Alternative Five-Year Scenarios—A Supplementto the Current Policy Budget Projections 4
Chapter III. Characterizing the Strength of NonfederalDemand 6General Overview of the Approach 6Different Approaches for Various Nonfederal
Demand Components 7Consumption 9Investment 13State and Local Purchases 17Net Exports 20
Nonfederal Demand Parameters and FederalBudget Policy 24
Implicit Multiplier Properties of the Model... 24
Chapter IV. Alternative Five-Year Scenarios: 1978-1982... 28Current Policy Expenditures 30$50 Billion Lower Federal Spending byFiscal Year 1982 33
$50 or $100 Billion In New Federal Programsby Fiscal Year 1982 33
General Implications 38Implications for the Next Five Years 39
Chapter V. Recent Evidence on Nonfederal Demand 40Consumption 40Investment 42State and Local Government Purchases 43Net Exports 44
Appendix A. Model Equations 49Appendix B. Glossary 59Appendix C. Detailed Solution Results 65

TABLES
Page
1. Five-Year Average Saving Rates 10
2. Five-Year Average Growth Rates in Real InvestmentAnd Real GNP 14
3. Five-Year Average Growth Rates in Real Non-Grant-Induced State and Local Government Purchases 18
4. Five-Year Average Net Exports 22
5. Response to Expenditure Changes 25
6. Response to Tax Changes 26
7. Economic Assumptions, Fiscal Years 1977 to 1982 29
8. Current Policy Expenditures, Fiscal Years 1978To 1982. 32
9. $50 Billion Lower Federal Expenditures by FiscalYear 1982 34
10. $50 Billion Additional Federal Expenditures byFiscal Year 1982 36
11. $100 Billion Additional Federal ExpendituresBy Fiscal Year 1982 37
APPENDIX TABLES
C-l Baseline GNP Path & Strong Non-Federal DemandExpenditures At Current Policy Levels 67
C-2 Baseline GNP Path & Moderate Non-Federal DemandExpenditures At Current Policy Levels 68
C-3 Baseline GNP Path & Weak Non-Federal DemandExpenditures At Current Policy Levels 69
vii

APPENDIX TABLES, continued
C-4 Less Vigorous GNP Path & Strong Non-FederalDemand Expenditures At Current Policy Levels 70
C-5 Less Vigorous GNP Path & Moderate Non-FederalDemand Expenditures At Current Policy Levels 71
C-6 Less Vigorous GNP Path & Weak Non-Federal DemandExpenditures At Current Policy Levels 72
C-7 Baseline GNP Path & Strong Non-Federal Demand$50 Billion Lower Federal Expenditures ByFiscal Year 1982 73
C-8 Baseline GNP Path & Moderate Non-Federal Demand$50 Billion Lower Federal Expenditures ByFiscal Year 1982 74
C-9 Baseline GNP Path & Weak Non-Federal Demand$50 Billion Lower Federal Expenditures ByFiscal Year 1982 75
C-10 Less Vigorous GNP Path & Strong Non-FederalDemand $50 Billion Lower Federal ExpendituresBy Fiscal Year 1982 76
C-ll Less Vigorous GNP Path & Moderate Non-FederalDemand $50 Billion Lower Federal ExpendituresBy Fiscal Year 1982 77
C-12 Less Vigorous GNP Path & Weak Non-Federal Demand$50 Billion Lower Federal Expenditures ByFiscal Year 1982 78
C-13 Baseline GNP Path & Strong Non-Federal Demand$50 Billion Additional Federal ExpendituresBy Fiscal Year 1982 79
C-14 Baseline GNP Path & Moderate Non-Federal Demand$50 Billion Additional Federal ExpendituresBy Fiscal Year 1982 80
viii

APPENDIX TABLES, continued
C-15 Baseline GNP Path & Weak Non-Federal Demand$50 Billion Additional Federal ExpendituresBy Fiscal Year 1982 81
C-16 Less Vigorous GNP Path & Strong Non-FederalDemand $50 Billion Additional FederalExpenditures By Fiscal Year 1982 82
C-17 Less Vigorous GNP Path & $50 Billion AdditionalFederal Expenditures By Fiscal Year 1982 83
C-18 Less Vigorous GNP Path & Weak Non-FederalDemand $50 Billion Additional FederalExpenditures By Fiscal Year 1982 84
C-19 Baseline GNP Path & Strong Non-Federal Demand$100 Billion Additional Federal ExpendituresBy Fiscal Year 1982 85
C-20 Baseline GNP Path & Moderate Non-Federal Demand$100 Billion Additional Federal ExpendituresBy Fiscal Year 1982 86
C-21 Baseline GNP Path & Weak Non-Federal Demand$100 Billion Additional Federal ExpendituresBy Fiscal Year 1982 87
C-22 Less Vigorous GNP Path & Strong Non-FederalDemand $100 Billion Additional FederalExpenditures By Fiscal Year 1982 88
C-23 Less Vigorous GNP Path & Moderate Non-FederalDemand $100 Billion Additional FederalExpenditures By Fiscal Year 1982 89
C-24 Less Vigorous GNP Path & Weak Non-FederalDemand $100 Billion Additional FederalExpenditures By Fiscal Year 1982 90
ix

FIGURE
1. Model Flow Chart.
Page
8

SUMMARY
This paper describes a model designed to incorporate varyingassumptions about the behavior of nonfederal demand (consumption,investment, state and local government purchases, and net exports)into the analysis of long-range projections for the federalbudget. The model is used to illustrate how different assumptionsabout nonfederal demand behavior can influence economic andbudgetary goals during the 1978-1982 period. After presentingsome general implications of the analysis, the paper concludeswith a discussion of recent nonfederal demand performance andsuggests indicators worth monitoring during the next year.
Long-range projections for the federal budget have beenprepared for many years. They generally represent the estimatedexpenditures for specific programs and tax revenues, under existinglaws, and some reasonable, but essentially arbitrary, assumptionsabout relevant economic variables. There is no compelling reasonto consider the impact of an individual program on the economicvariables, since any one program is usually small relative to thewhole economy. When all programs are combined into total budgetprojections, however, the link from the budget to the economybecomes extremely important. Traditional long-range budget esti-mates have ignored this linkage, partly because of the greatuncertainty surrounding this issue. I/
The departures from current policy budget estimates 2J re-quired to achieve the economic assumptions are dependent, however,on the autonomous strength of nonfederal demand during the projec-tion period. Consumer spending, private investment, state andlocal spending, and net exports are, of course, influenced byfiscal policy, but they are also affected by the strength of
iy Reports of past projections often would point out that such alink existed and was being ignored, but they would devote noanalysis to its implications.
_2/ See p. 3 for an explanation of current policy budget projec-tions.
xi

consumer and investor confidence, technological development,inflationary expectations, and such unpredictable events ascrop failures and oil embargoes. In addition, monetary policyplays an important role in influencing the strength of nonfederaldemand, especially demand for investment goods. Similarly, netexports depend heavily on the strength of foreign demand, inflationabroad, and other international developments.
Autonomously strong nonfederal demand contributes directlyto rapid economic growth and attainment of federal budget balance.Weakness of nonfederal demand hinders progress toward both goals.For any given nonfederal demand environment, however, rapid eco-nomic growth and federal budget balance are conflicting, notcomplementary goals.
Unfortunately, it is not possible to project the autono-mous strength of nonfederal demand with much confidence formore than 18 months to two years into the future. On the otherhand, historical experience can provide some guidance as to aplausible range for the strength of autonomous nonfederal demandover a longer period. We can determine, for example, whetherstated goals for economic growth and the budget deficit wouldrequire moderate, optimistic, or unprecedented autonomous strengthof nonfederal demand when measured against historical experience.Having made explicit assumptions about economic growth and autono-mous nonfederal demand strength, the model described here makes itpossible to determine what departures from current policy expendi-tures and/or revenues would be required to reach the GNP target.
Analysis of projections for the period 1978 through 1982,using two different GNP targets, three sets of assumptions aboutautonomous nonfederal demand, and four sets of federal expendituresassumptions, has proved very illuminating. In essence, it indi-cates that achievement of both low unemployment (the high GNPtarget) and a balanced federal budget by the end of the projectionperiod would require a relatively optimistic but historicallyprecedented performance by the nonfederal sectors.
xii

General implications of the analysis include the followingpoints:
The greater the vigor of the nonfederal sectors:
o The easier the achievement of a high GNP with less federalaction.
o The smaller the deficit or the greater the surplus for anyGNP goal and federal expenditure strategy.
o The less the federal flexibility for increasing expendi-tures or decreasing taxes, given the GNP target.
The higher the desired level of federal expenditures (givennonfederal demand behavior):
o The easier the achievement of high GNP through federalaction.
o The smaller the deficit or the greater the surplus neededto attain a specified GNP growth path.
o The smaller the opportunity to cut taxes.
The higher the GNP goal and the lower the unemployment goal(given nonfederal demand behavior):
o The greater the deficit or the smaller the surplus for anydesired level of federal expenditures.
o The greater the federal flexibility for increasing expendi-tures or decreasing taxes.
o The greater the likelihood of continuing or acceleratinginflation.
xiii
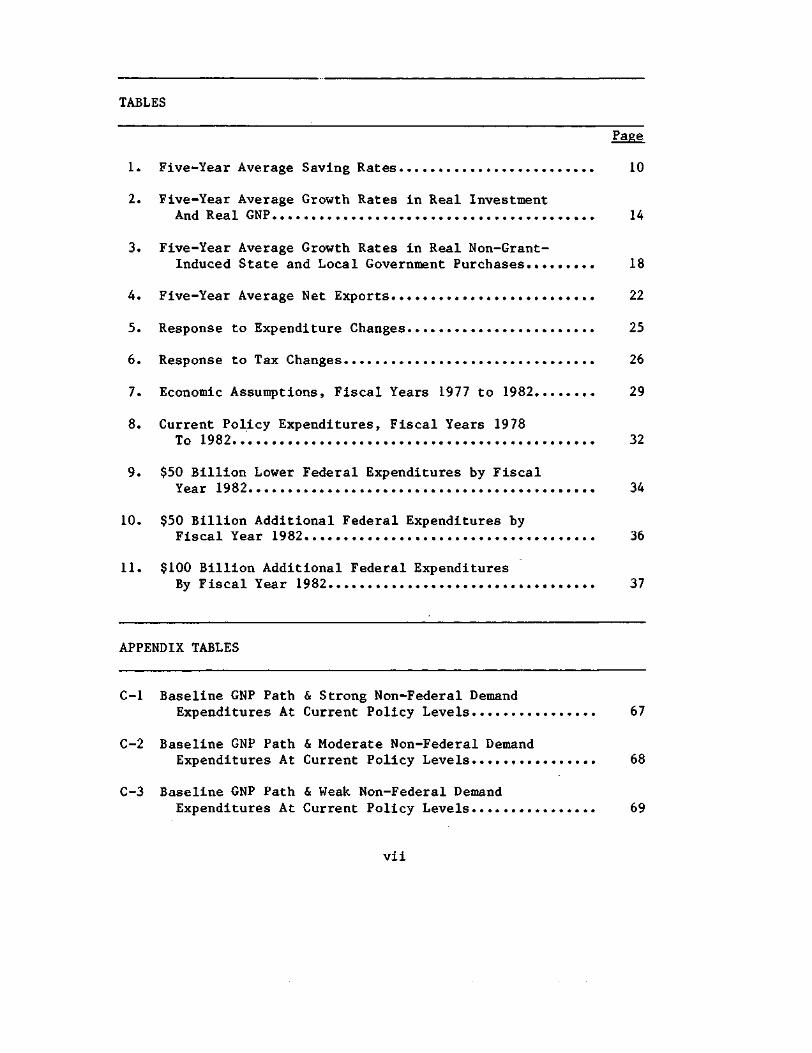
Various approaches are used to characterize the autonomousstrength of different components of nonfederal demand. For con-sumption, strength is characterized in terms of a marginal propen-sity to consume out of disposable income. In the case of invest-ment, strength is characterized in terms of a rate of growthrelative to growth in total GNP. For state and local governmentpurchases, strength is expressed in terms of the rate of growth ina major autonomous component. In the final case (net exports),strength is specified in terms of the level of spending.
The model also enforces the relationships that must holdamong different variables. The most important such relationship isthat which requires the sum of consumption, investment, governmentpurchases (federal and state and local combined) and net exports toequal total GNP. (The flow diagram that appears as Figure 1 onpage 8 of the text may be helpful to many readers.)
The approach described here also corrects a very inappropriateuse of the traditional five-year projections. Frequently, thedifference between current policy revenues and expenditures hasbeen used to measure the "room" for new programs, that is thestronger the assumed level of economic activity, the larger theapparent leeway for greater federal spending. Unfortunately, thisis very misleading. The danger in initiating too many new federalprograms is that nonfederal demand might prove too strong, not tooweak. If nonfederal demand were weak, new federal programs wouldlargely serve to mobilize otherwise idle resources. If nonfederaldemand were strong, however, new federal programs would be compet-ing directly for the limited physical resources of the economy. Inthis case, a tax increase might well be required to restraininflationary pressures. Even so, the new federal programs wouldinvolve shifting effectively employed resources from the privateto the public sector.
Recent evidence is mixed concerning the strength of variouscomponents of nonfederal demand. Consumption has proved quitestrong in the current recovery, with the saving rate falling fromrecord highs during the 1974-1975 recession, to unusually lowlevels in recent quarters. Housing investment has recovered well,but most forecasters look for only limited growth in the nearfuture. The recovery in business fixed investment was delayedunusually long after production reached its low point and has beenonly moderately strong since its recovery began. Wide disagreementexists over whether continued strengthening or eventual decline inbusiness fixed investment is the more likely prospect. State andlocal government spending has grown very slowly in the last
xiv

several quarters. While somewhat faster growth is widely expected,this is not likely to be a major source of nonfederal demandstrength in the next several years. Net exports recovered well in1976, but showed unprecedented weakness in the first half of1977. While some support for domestic growth may arise from thissector, no major strength is likely until foreign economic activitybegins to grow more rapidly.
xv

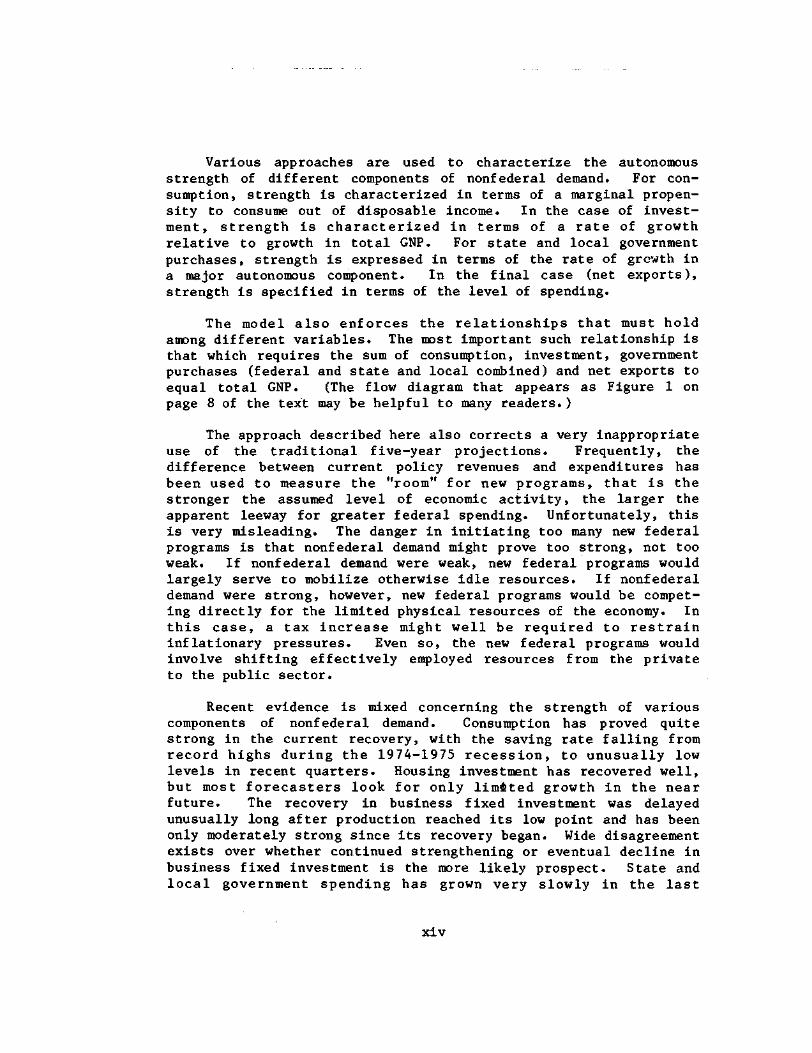
CHAPTER I. PAST ANALYSIS OF THE BUDGET AND THE ECONOMY
It is widely recognized that the federal budget and theeconomy are entwined in a two-way causal relationship (the fiscalpolicy loop). The effect of the economy on the budget is clear andfairly precise. Obviously the level of corporate profits andpersonal income are major determinants of federal profits tax andpersonal income tax receipts. In addition, expenditures on variousentitlement programs are sensitive to the level of economic acti-vity and the inflation rate. Examples of such programs are unem-ployment compensation, which is tied to the level of unemployment,and social security benefits, which are linked to the inflationrate (as measured by the Consumer Price Index).
The impact of the budget on the economy is also widelyrecognized. Unfortunately, this effect is more complex and moreuncertain than the economy's impact on the budget. Federal pur-chases can mobilize idle resources if the economy is operatingbelow full capacity. Purchases from the private sector or in-creased federal employment can, in such a situation, increase thereal quantity of physical output in the economy. If production isalready at its physical maximum, additional government demand withno increase in taxes will lead to inflationary pressures. On thereceipts side, lower personal tax rates raise people's disposableincomes and encourage higher consumption demand. Similarly,higher investment tax credit rates will reduce corporate taxcollections but encourage higher investment spending. Theseare only a few of the many ways the budget can influence thelevel of economic activity.
Two stated purposes of the Congressional Budget Act are:
o to establish national priorities; and
o to provide for the Congressional determination eachyear of the appropriate level of federal revenues andexpenditures.
Clearly these two objectives are related to each other. Theappropriate levels of federal expenditures and revenues restrictthe range of available options for dealing with various national
99-357 O - 77 - 2

priorities. As will be discussed later, appropriate levels offederal expenditures and revenues are closely tied to the strengthof the nonfederal sectors of the economy. Beyond this, however,a given pattern of nonfederal behavior leaves open a range offederal budgets that would reasonably be consistent with growth andinflation goals. Which of this range of budgets should be chosen,or whether the growth and inflation goals themselves should bealtered to allow achievement of certain budgetary goals, is adecision properly left to the American people acting through thepolitical process.
The Congressional Budget Act specifically requires a number ofreports and documents to assist the Congress in carrying out itsbudgetary responsibilities. These include the one-year currentservices budget from the Office of Management and Budget (OMB),the five-year projections in the President's budget, and CBO'sfive-year projections report and annual report. !_/ The onlyportion of these reports specifically required to consider thebudget's impact on the economy is the CBO annual report, and thisis only required for the fiscal year in progress and the immedi-ately following one.
The act requires that the OMB current services projections beaccompanied by the economic and programmatic assumptions underlyingthe estimated outlays and proposed budget authority, such as therate of inflation, the rate of real economic growth, the unemploy-ment rate, program caseloads and pay increases.
Specific programmatic assumptions are to be onesconsistent with continuation of all programs andactivities.... during such ensuing fiscal year atthe same level as the fiscal year in progress andwithout policy changes in such programs and acti-vities.
The act is silent, however, concerning the basis for theeconomic assumptions to be employed. In their current servicesbudget estimates released in November 1975 and November 1976, OMBhas employed four alternate sets of economic assumptions. These
— The most recent of these are Five-Year Budget Projections:Fiscal Years 1978-1982 (December 1976) and Budget Optionsfor Fiscal Year 1978 (February 1977).

have included a high and low economic growth rate combined witheither a high or low inflation rate. Their reports have not statedthe criteria for choosing these assumptions. It is reasonable tosay, however, that the assumptions have represented a plausiblerange of economic outcomes consistent with the fiscal policyimplications of a current services federal budget. Similarly, theshort-term portion, generally the first of 12 to 24 months of CBOfive-year projections, have reflected a fully integrated forecastof the path for the economy, given a current policy budget.(The CBO "current policy" concept used here assumes continuation ofexpenditures on all federal programs at current levels, adjustedfor growth caused by inflation, demographic change, and futurespending of existing multi-year appropriations. Current policyrevenues are those that would be generated by the assumed economicactivity levels in combination with continuation of the existingstructure of the tax laws.)
The long-range portion of past five-year projections, boththose in the President's budget and those prepared by CBO, have notbeen prepared on this basis. These projections have concentratedexclusively on the impact of a fixed set or sets of economicassumptions on current policy expenditures and revenues. There hasbeen no stated implication that the current policy budget figureswould support the assumed economic activity levels. On the con-trary, it has been stated that only exceptionally strong nonfederaldemand would allow realizations of the activity levels in conjunc-tion with actual implementation of a current policy budget forfive years. It is, thus, appropriate to say that the impact of thebudget on the economy has been ignored by both OMB and CBO in thelong-term portion of past projections.
The major thrust of this study is to examine what depar-tures from either current policy expenditures or revenues wouldbe necessary to achieve the assumptions about growth in output(GNP) and decline in unemployment that underlie the budget projec-tions. This question is considered in combination with a range ofprojected behavior patterns for the nonfederal sectors (that is,consumers, investors, state and local governments, and net ex-ports) .

CHAPTER II. ALTERNATIVE FIVE-YEAR SCENARIOS—A SUPPLEMENT TOTHE CURRENT POLICY BUDGET
Past neglect of the budget's impact on economic activityin a long-range context stems directly from the serious uncertain-ties involved in such analysis. Historical evidence on the accu-racy of economic forecasts clearly indicates a widening range ofuncertainty the farther ahead such forecasts are extended. Thisshould come as no surprise to anyone, given the increasing risk ofunforeseeable events, such as international political conflict andcrop failures, to name only two. In addition to external uncer-tainties, we have only limited understanding of what determinesfluctuations in consumption and investment behavior. Confidence,inflationary expectations, and similar psychological factors playan important role, but they are hard to measure and even harder topredict. Small errors on these and other variables can build up asa forecast is extended forward.
The growing uncertainties in long-term forecasts limit theirvalue. Indeed the ease with which inappropriate precision can beimputed to such forecasts could make them an obstacle to effectivebudget analysis. On the other hand, historical experience canprovide guidance as to a plausible range for the strength of demandby the nonfederal sectors. This is important because, in the finalanalysis, it is the behavior of nonfederal demand (consumption,investment, state and local government spending, and net exports)that governs the environment within which Congressional budgetdecisions must be made, and that determines the necessary compro-mises among goals for economic growth, the size of federal expendi-tures, and the deficit.
Because of the great uncertainties involved in long-runfiscal analysis, the approach to fiscal policy decisions mustnecessarily be rather different from that which is appropriate forallocative budget decisions. Our current knowledge does permitlong-range planning of allocative decisions in the sense thatcurrent actions are directly influenced by projected out-year

budget effects of various alternatives. Aggregate fiscal policy,on the other hand, cannot be planned in the same way over a five-or six-year horizon. Unfortunately, the uncertainties are simplytoo great to make such an approach practical. A more reasonableapproach to planning fiscal policy involves monitoring economicevents as they unfold, using an initial set of internally consis-tent projections as a benchmark. Comparison of the benchmarkscenarios with actual economic data, as they become known, willprovide evidence on how nonfederal demand is behaving and hence onthe probable compromises among economic and budgetary goals thatwill be required in the future. This should also provide theperspective required to make timely changes in fiscal policy on ashort-term basis as the need arises.
The following chapter documents CBO's current mechanismfor generating the range of prospective departures from eithercurrent policy expenditures or revenues that would allow realiza-tion of specified economic growth goals.

CHAPTER III. CHARACTERIZING THE STRENGTH OF NONFEDERAL DEMAND
GENERAL OVERVIEW OF THE APPROACH
As already emphasized, any approach to examining the consis-tency between five-year economic assumptions and associated budgetprojections must focus on the autonomous strength of nonfederaldemand. A method for characterizing demand strength in each of thenonfederal sectors is described in this chapter. Each of the fourmajor components of nonfederal demand—consumption, investment,state and local government purchases, and net exports—is charac-terized by a simple functional relationship. The relationships arenot intended to represent carefully considered behavioral func-tions. Rather, they are simply a basis for characterizing eachnonfederal demand component as autonomously strong, moderate,or weak in light of U.S. economic experience since World WarII.
The strength of demand is characterized differently for eachof the four components. In the case of consumption, strength ischaracterized in terms of marginal propensity to spend disposableincome. In the second case, investment, strength is specified interms of a rate of growth relative to growth in total GrossNational Product (GNP). For state and local government purchases,strength is expressed as the rate of growth in a major autonomouscomponent. In the final case of net exports, strength is charac-terized in terms of a level of spending that is assumed to beconsistent with a specific GNP path.
The model also enforces the full set of relationships requiredfor consistency among different variables. Thus, for example,values for wages and salaries, other labor income, interest income,rental income, dividends and proprietors' income that are containedin or consistent with the economic assumptions of a traditionalfive-year projection are combined with the values for transfers andtaxes contained in the budget projections to determine disposablepersonal income. Disposable income is then the major determinateof consumer expenditures. The most important relationship of thiskind is that which equates total purchases, federal plus nonfede-ral, with the assumed GNP path.

The solution procedure, as illustrated in Figure 1, differsfrom that which is traditional for this kind of model. NormallyGNP is a major internally determined variable. In this context,GNP is an assumed target that is fixed in advance of the solution.A set of parameters for each of the nonfederal demand relationshipsis also chosen. The model fixes either federal expenditures(solution mode A) or federal taxes (solution mode B) and solves forthe level of taxes or expenditures respectively that is needed tobring total demand into equality with targeted GNP.
DIFFERENT APPROACHES FOR VARIOUS NONFEDERAL DEMAND COMPONENTS
The strength of the various components of nonfederal demandcannot be characterized by a uniform method. Consumption, forexample, is effectively subject to an income constraint in a waythat investment is not, since investment is largely financed byborrowing in addition to internally generated funds. Furthermore,the expected response to alternate GNP levels differs among finaldemand components. Higher GNP should result in a higher level ofinvestment and consumption for any basic "strength" of these twofinal demand components. On the other hand, net exports are likelyto be lower at higher GNP levels, since greater domestic economicactivity encourages larger imports and higher domestic prices tendto discourage exports.
The following subsections outline the criteria used to charac-terize the strength of consumption, investment, state and localspending, and net exports, and the specific manner in which thesecriteria are implemented for each category. A technical appendixpresents the complete set of model equations.
Monetary policy is not explicitly treated in the model. Thisshould not be construed as an attempt to minimize its importance.Monetary policy plays a key role in determining the strength ofprivate investment as that is characterized here. Some economistsargue it can have a similar influence on the consumption sectoras well. As the model is currently constructed, monetary policyshould be viewed as one of the important determinants of whetherthe autonomous vigor of nonfederal demand turns out to be strong,moderate, or weak during the projection period.

Figure 1
MODEL FLOW CHART
AdjustFederalTaxes
'Total Demand[= Assumed GNP
[NO
SolutionMode
A or B?
AdjustFederal
Spending
or
AssumedGNP Level
Yes I FStop or
'roceed to Solve ]Next Period

Consumption
The most common measure of the strength of consumer demand isthe saving rate which is published on a regular quarterly basis bythe Commerce Department. l^/ Since 1946 that rate has varied from alow of 2.9 percent in 1947 to a high of 8.0 percent in 1973. On afive-year average basis, 2^1 it has varied from 4.8 percent for theyears 1947 through 1951 to 7.4 percent for 1971 through 1975.Table 1 shows the five-year average values for the saving rate forperiods ending in 1951 through 1975.
_!/ The saving rate is defined as:
((YDP - E)/YDP) *100
where YDP = disposable personal incomeE = personal expenditures.
2f The five-year figures presented here are simple averages of~~ the annual saving rates rather than calculations based on
five-year averages of disposable income and expenditures. Thelatter procedure would put greater weight on the saving ratesnear the end of any five-year period than on those near thebeginning, assuming income grew during the period.

TABLE 1. FIVE-YEAR AVERAGE SAVING RATES
Years
1947-19511948-19521949-19531950-19541951-1955
1952-19561953-19571954-19581955-19591956-1960
1957-19611958-19621959-19631960-19641961-1965
1962-19661963-19671964-19681965-19691966-1970
1967-19711968-19721969-19731970-19741971-1975
Rate
4.8085.5775.8016.2986.333
6.3676.3526.3656.2676.154
5.9165.6385.2045.2805.586
5.7676.2066.5676.4856.677
6.9286.6596.9247.2807.359
1972-1976 7.110
10

As can be seen from the data, a five-year average savingrate below 6 percent must be viewed as corresponding to a strongconsumption pattern. On the other hand, rates over 7 percent are areflection of weak consumption demand by historical standards.Thus this study characterizes the strength of consumption demand asfollows: 3/
Strength of Consump-Saving Rate tion Demand
Under 6.0 percent Strong6.0 percent to 7.0 percent ModerateOver 7 percent Weak
The following is the consumption relationship in the model:
EA = (1.04) **(YEAR-1973) *(PGNP/1.0592)*200.0
E EA + CMPE*YDP -.20(NWI-NWIC)
C = E * C/E
_3/ It should be noted that the saving rate is a somewhat ambig-uous measure of consumption strength. Lower income tends tolower the saving rate in the short-run, since people onlyadjust their consumption to the lower income with a lag.Similarly, higher income results in some tendency towardhigher saving rates. Thus any specific assumption aboutconsumption strength results in a somewhat higher saving ratewith higher rather than with lower disposable personalincome. The ranges shown above are based on an assumption ofnormal growth in income. Particularly rapid or particularlyslow growth in disposable income in a projection can push thesaving rate outside the range indicated for the consumptionstrength assumed.
11

where
EA = autonomous consumption.
YEAR = the fiscal year corresponding to the periodbeing solved (e.g., 1978).
PGNP = GNP price deflator (1972 = 1.0).
E = total consumer expenditures, including interestpaid by consumers and personal transfers to for-eigners.
CMPE = consumer marginal propensity to spend.
Value 4/ Consumption Strength
.704 Strong
.697 Moderate
.690 Weak
= disposable personal income.YDP
NWI
NWIC
nonwage income (proprietors' income + rental income +personal interest income + dividends).
current policy nonwage income.
These values for CMPE were chosen because they generatedthe desired saving rates, when the model was solved for1978-1982 period, in those cases where growth in dispos-able income was neither exceptionally rapid nor exception-ally slow.
It would have been possible to treat consumer expenditures as(l-SAVRATE/100)* YDP. This would have resulted, however, invery large implicit multipliers for GNP relative to a changein taxes or transfers. The above approach was adopted toavoid this problem. The last section of this chapter dis-cusses the model's implicit multiplier properties in moredetail.
12

C/E = assumed ratio of personal consumption expendi-tures to total personal expenditures
C = personal consumption expenditures.
Autonomous consumption is assumed to be $200 billion in1973 and to grow at 4 percent per year plus the rate of infla-tion. It is assumed that consumer prices rise at the same rateas the GNP deflator. The value 1.0592 is the level of the GNPdeflator in 1973.
Total personal expenditures equal autonomous consumption plusthe marginal propensity to spend times disposable personal incomeminus .20 *(NWI-NWIC). NWI only differs from NWIC by virtue ofcorporate tax changes causing an increase or decrease in dividends.The final term makes the marginal propensity to spend dividends .20lower than the marginal propensity to spend total disposableincome.
Total personal expenditures (E) include interest paid byconsumers and personal transfers to foreigners in addition topersonal consumption expenditures (C). It is assumed that theratio of consumption to total expenditures remains constant atC/E, which is set equal to .974 throughout the solution. C/Ecould, however, be allowed to vary from year to year if desired.
Investment
There is no single measure, such as the saving rate forconsumption, that is commonly used to characterize the strength ofprivate investment demand. For this purpose CBO has chosen to usethe differences between the five-year average growth rate in real(price adjusted) private investment and the corresponding growthrate in real GNP. Historical data on this series appear in Table2. 5/
_5/ The average growth rates are calculated as follows:
5-l) *100 for GNP
and similarly for investment.
13
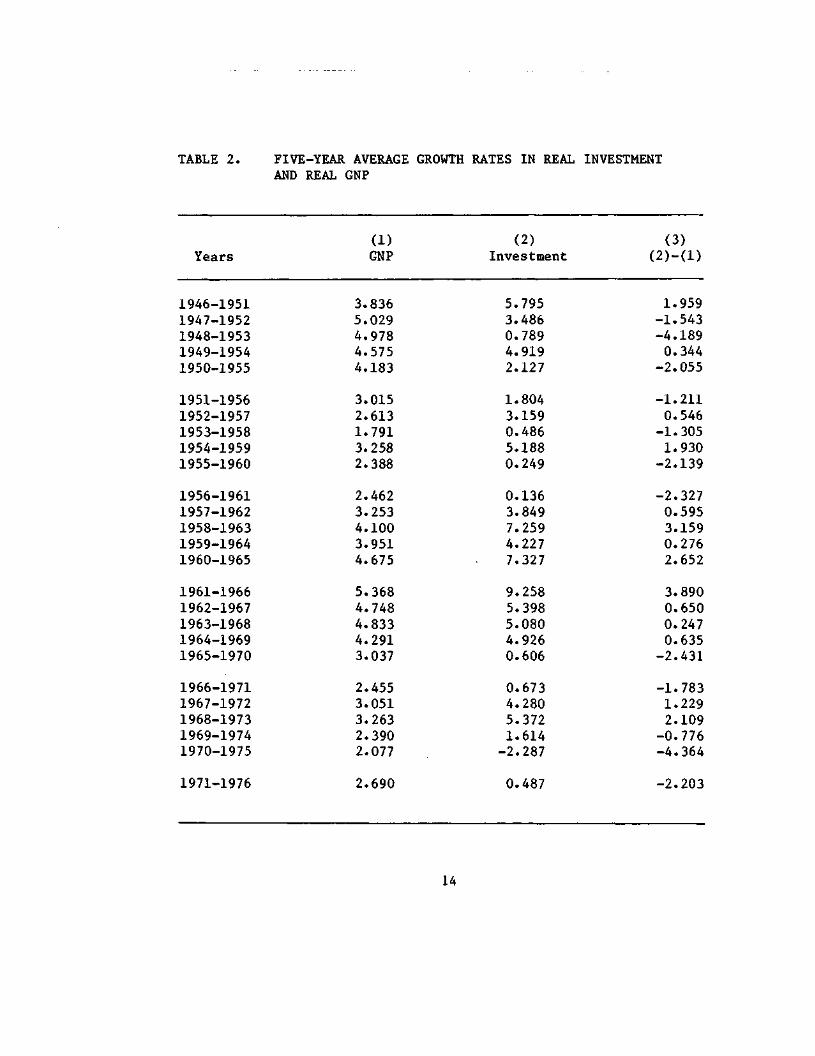
TABLE 2. FIVE-YEAR AVERAGE GROWTH RATES IN REAL INVESTMENTAND REAL GNP
Years
1946-19511947-19521948-19531949-19541950-1955
1951-19561952-19571953-19581954-19591955-1960
1956-19611957-19621958-19631959-19641960-1965
1961-19661962-19671963-19681964-19691965-1970
1966-19711967-19721968-19731969-19741970-1975
1971-1976
(1)GNP
3.8365.0294.9784.5754.183
3.0152.6131.7913.2582.388
2.4623.2534.1003.9514.675
5.3684.7484.8334.2913.037
2.4553.0513.2632.3902.077
2.690
(2)Investment
5.7953.4860.7894.9192.127
1.8043.1590.4865.1880.249
0.1363.8497.2594.2277.327
9.2585.3985.0804.9260.606
0.6734.2805.3721.614-2.287
0.487
(3)
1.959-1.543-4.1890.344-2.055
-1.2110.546-1.3051.930-2.139
-2.3270.5953.1590.2762.652
3.8900.6500.2470.635-2.431
-1.7831.2292.109-0.776-4.364
-2.203
14

On four occasions, real investment growth has averagedmore than 2 percent per year faster than real GNP growth over afive-year period. Three of these four occasions are the five-year periods ending in 1963, 1965, and 1966, respectively. Clearlythese periods were heavily influenced by a variety of tax measures,including the first introduction of the investment tax credit in1962.
The last of the four periods noted above is 1968-1973.During these years real investment growth averaged 2.1 percentper year greater than real GNP growth. It thus appears thatreal investment growth of 2 percent per year in excess of real GNPgrowth must be considered on the high end of a "normal" investmentboom.
In some cases, average real investment growth has beenlower than the growth in real GNP. Since 1956, however, thishas only occurred when comparing a recession or immediate post-recession year with a nonrecession year five years earlier. Thus,for example, GNP growth was higher than real investment growth inthe five-year periods ending in 1958, 1960, 1961, 1970, 1971,1974, and 1975. For a period of sustained expansion in real GNPit appears appropriate to characterize investment strength asfollows:
Investment Growth Rate Strength ofMinus GNP Growth Rate Investment Demand
2.0 percent per year Strong1.0 percent per year Moderate0.0 percent per year Weak
The investment equation is as follows:
1C = IC(-1)*(GNP72/GNP72(-1) + %CH(I-GNP)/100)*(PGNP/PGNP(-1))
t-1I = 1C + £ b(i)* (TFCC(t-i) - TFC(t-i))
i=0
i = 0 1 2 3 4b(i) = .10 .15 .10 .10 .05
15

where
1C
GNP72
%CH(I-GNP) =
current policy total nominal investment (IC(0)is an exogenous value for total nominal invest-ment in the year preceding the first period ofthe solution
real GNP (1972$)
growth in real investment in excess of thegrowth in real GNP.
Value
2.001.000.00
Investment Strength
StrongModerateWeak
PGNP = GNP price deflator
I = solution value for total nominal investment
TFC = solution value for corporate profits taxes
TFCC = current policy corporate profits taxes
t = the number of the period currently being solved.This assumes values from 1 to 5 in a five-yearsolution.
Since the values for b(i) sum to 0.5, they reflect an assump-tion that 50 percent of additional after tax corporate profits iseventually reflected in higher investment. This only happens,however, with a considerable lag. The other 50 percent of aftertax profits is assumed to appear in the form of higher dividendsand hence higher disposable income, again with a lag.
It is also assumed that the deflator for investment goodsrises at the same rate as the total GNP deflator.
16

State and Local Government Purchases
A measure of autonomous state and local purchases shouldat tempt to correct actual purchases for the impact of federa lgrants-in-aid. In this analysis, 40 percent of federal grants-in-aid is deducted from state and local purchases and the differ-ence is deflated by the state and local purchases deflator. Theresulting series is referred to as real non-grant-induced stateand local purchases. ^/ Table 3 shows the average five-yeargrowth rates in this series since 1946-1951.
While non-grant-induced purchases grew at average annualrates above 6 percent per year in many of the five-year periodssince the mid-1940s, there has been a marked slowdown since1968. Average annual growth rates for the five-year periodsending in 1973 through 1976 have only been in the 2.5 to 3.5percent per year range. There are many reasons for these lowergrowth rates. For example, demographic changes have slowedschool construction and reduced the growth in education pay-rolls. This trend should continue to have an influence through1982. An additional fac to r is the much publicized f inancialdifficulty of New York City as well as other states and munici-palities. Thus, 3.75 percent growth in real non-grant-inducedstate and local purchases appears to be a high projection duringthe period in question. Growth of 3 percent per year wouldcorrespond to the average rate of increase from 1967 through 1976,while growth of only 2.25 percent per year would correspond tofurther slowing in the expansion of state and local purchases.Thus real non-grant-induced state and local purchases are allowedto grow as follows in the alternative five-year scenarios:
Annual Growth Rate inReal Non-Grant-Induced Strength of State
State and Local Purchases and Local Demand
3.75 percent Strong3.00 percent Moderate2.25 percent Weak
The assumption that 40 percent of general federa l grantsto states are ref lec ted in purchases is based on micro-economic studies.
17
99-357 O - 77 -

TABLE 3. FIVE-YEAR AVERAGE GROWTH RATES IN REAL NON-GRANT-INDUCED STATE AND LOCAL GOVERNMENT PURCHASES
Years Rate
1946-1951 8.121947-1952 6.201948-1953 6.001949-1954 4.931950-1955 4.89
1951-1956 5.421952-1957 6.011953-1958 6.441954-1959 5.261955-1960 4.76
1956-1961 5.181957-1962 4.781958-1963 4.361959-1964 5.241960-1965 5.76
1961-1966 6.691962-1967 6.171963-1968 6.281964-1969 5.521965-1970 4.65
1966-1971 4.231967-1972 3.521968-1973 3.031969-1974 3.221970-1975 2.94
1971-1976 2.41
18

The equation for state and local government purchases isas follows:
GSPN = GSPN(-1)*(1+%CHGSPN/100)*
(1+((PGNP/PGNP(-1))-!)*!.5)
GSP = GSPN + .40 * GFG
where
GSPN = non-grant-induced state and local purchases( G S P N ( O ) equals an exogenous value for nominalstate and local purchases in the year prior to thef i rs t period of the solution minus .40 timesgrants-in-aid during the same interval).
%CHGSPN = the assumed annual growth rate in real non-grant-induced state and local purchases.
Value
3.753.002.25
State and LocalDemand Strength
StrongModerateWeak
PGNP = GNP price deflator.
GSP = nominal state and local government purchases,
GFG = federal grants-in-aid to state and local govern-ments.
As can be seen from the equations, the price deflator forstate and local government purchases is assumed to grow 50 per-cent faster than the GNP price deflator. This is in line withhistorical experience. It is also assumed that 40 percent of
19

federal grants-in-aid is translated into additional state andlocal purchases. An additional 40 percent appears in the formof lower state and local taxes, l_l and 20 percent implicitlycontributes to accumulation of financial assets or reduction ofoutstanding liabilities.
One shortcoming of this characterization is that it does notfully recognize the balanced budget restriction in effect in moststates and localities. Greater non-grant-induced state and localspending does result, in the model, in an increase in state andlocal personal taxes. l_l Such spending is almost certainly asso-ciated with increases in sales, property, and excise taxes as well,which are not captured by the existing model structure. Because ofthese combined tax increases, it is unlikely that strong state andlocal spending could be a major source of support for both rapideconomic growth and progress toward a balanced federal budget.
Net Exports
One problem in treating net exports is that they tend tobe reduced by rapid growth in GNP and to be raised by slow growthin GNP. This is because rapid economic growth raises imports withno immediate corresponding increase in total exports. In fact, ifthe rapid growth is accompanied by higher prices, this may actuallyreduce total exports. The handling of net exports is primarilymotivated by a desire to have them respond in the expected fashionwhen the model is solved for different GNP paths. Specifically, agiven pattern of net exports is assumed to be consistent with 4percent per year growth in real GNP and 5 percent per year infla-tion. This pattern can differ depending on the assumed strength ofnonfederal demand. This net export pattern is adjusted downwardfor any annual growth j.n projected current dollar GNP in excess of9 percent and adjusted upward for any growth below that rate.
— See Appendix A for the equation determining state and localpersonal taxes (TSP).
20

Table 4 shows the five-year average values for net exportssince 1951. The U.S. typically experienced positive net exportsduring the last 30 years. The OPEC oil price increase, however,seriously threatens our ability to continue such a performance inthe future. On the other hand, the U.S. is the world's major cropproducer, and population growth is certain to continue to increaseglobal food demand. Thus agricultural exports could largelyoffset the rising volume and price of U.S. oil imports.
Recognizing that this is the part of the analysis thatsome people will question most seriously, CBO has used the follow-ing net export assumptions in its three different nonfederal demandscenarios:
NET EXPORTS AT 4 PERCENT PER YEAR REAL GROWTHAND 5 PERCENT INFLATION
Fiscal Year
19781979198019811982
Strong
1315171921
Values
Moderate
89101112
Weak
33333
Deviations from these figures in the actual scenarios are theresult of the current dollar GNP path deviating from the 9 percentper year rate of increase which is assumed to be consistent withthe above numbers.
21

TABLE 4. FIVE-YEAR AVERAGE NET EXPORTS:DOLLARS
IN BILLIONS OF CURRENT
Years
1947-19511948-19521949-19531950-19541951-1955
1952-19561953-19571954-19581955-19591956-1960
1957-19611958-19621959-19631960-19641961-1965
1962-19661963-19671964-19681965-19691966-1970
1967-19711968-19721969-19731970-19741971-1975
Average Values
6.0154.1722.9882.1422.206
2.2933.0283.4033.1173.547
3.8553.7164.4826.1606.804
6.6546.5665.7634.3243.595
2.8961.2502.2223.3656.670
1972-1976 7.680
22

The equation for net exports is as follows:
GNP9%
NX
where
GNP9%
NX9%
GNP
GNP9%(-1) * (1.09)
NX9%-((GNP/GNP9%)-1) * .07 *GNP9%
current dollar GNP assuming 4 percent per yearreal growth and 5 percent per year inflation start-ing in period 1*(GNP9%(0) = GNP(O) = current dollarGNP in the year prior to the first period of thesolution.)
current dollar net exports at 4 percent real growthand 5 percent inflation. (This is set equal to thevalues shown above for different assumptions aboutthe strength of net export demand.)
assumed current dollar gross national product
Current dollar net exports that are consistent with 4 percentper year growth and 5 percent per year inflation are specifiedexogenously at levels determined by the assumed strength ofnonfederal demand. If current dollar GNP is above (below) this 9percent per year growth path, net exports are adjusted down (up)by a specific amount. The adjustment used here assumes importsare 10 percent of current dollar GNP and that they have an elasti-city of .7 with respect to changes in GNP. JJ/
In fact the specification is consistent with a slightly lowerimport elasticity with respect to GNP plus slightly lowercurrent dollar exports because higher GNP results in higherdomestic prices.
23

NOMFEDERAL DEMAND PARAMETERS AND FEDERAL BUDGET POLICY
The model described here requires an explicit choice ofparameter values for the behavior of nonfederal demand beforethe solution begins. These behavioral parameters are then fixedduring the solution process, regardless of the federal budgetpolicy required to achieve the GNP target. This characteristic ofthe model has been critized by some analysts.
Unfortunately, there is great uncertainty over how non-federal demand parameters should be expected to react to federalbudget policies. Some argue that short-term stimulus from budgetdeficits raises capacity utilization and encourages strongerinvestment. If the short-term stimulus raises employment, it mayalso serve to strengthen consumption demand. Others argue thatlarge federal deficits create fears of inflation and may have anegative psychological impact in and of themselves. Thus, it isargued, nonfederal demand may be weakened by an expansive fiscalpolicy. In addition, whatever causal connecting links existbetween federal budget policy and nonfederal demand parameters,external shocks may have effects that reinforce or offset theinfluence of various fiscal policy alternatives.
For all the above reasons, CBO has simply chosen to varynonfederal demand parameters over some plausible range to illus-trate their influence on the prospects for achieving goals of rapideconomic growth and a declining federal budget deficit. No onesolution should be viewed as a forecast. Rather the whole range ofsolutions should be considered as a benchmark against which tojudge economic events as they unfold.
IMPLICIT MULTIPLIER PROPERTIES OF THE MODEL
Since the model solves for federal expenditures or federaltaxes rather than GNP, it is not possible to generate fiscalpolicy multipliers in the usual sense. It is possible, however,to solve the model for two different GNP paths, look at theresultant differences in spending or taxes, apply a set of consen-sus multipliers to these spending or tax changes, and compare theimplied changes in GNP with the actual differences between thetwo GNP paths. This is, in fact, one procedure that was used tojudge the reasonableness of the parameters chosen for variousrelationships.
24

Tables 5 and 6 show these calculations for spending and taxesrespectively. Figures represent differences between correspondingseries in two solutions, one using the "baseline" GNP path and theother using the "less vigorous" GNP path. _9/
TABLE 5. RESPONSE TO EXPENDITURE CHANGES: IN BILLIONS OFCURRENT DOLLARS PER YEAR
Implied GNP Differ-Fiscal Expenditure GNP ences Using StandardYear Differences aj Differences Multipliers b/
1978 4.8 5.0 5.31979 29.3 35.6 35.11980 58.2 78.8 82.11981 84.0 123.4 130.31982 112.5 178.0 180.0
aj Using the two different GNP paths, taxes were held at currentpolicy levels and expenditures were adjusted to generatesufficient demand to support the assumed GNP.
_b/ Implied GNP differences are based on assumed multipliersfor a sustained increase in government spending of 1.1,1.7, and 1.8 for the first, second, and third years, respec-tively. The expenditure increases are spread among purchases,transfers, and grants-in-aid in the same ratio as these bearto one another in the current policy projections.
_9_/ See page 28 for explanations of "baseline" and "less vigor-ous" GNP paths.
25

TABLE 6. RESPONSE TO TAX CHANGESDOLLARS PER YEAR
IN BILLIONS OF CURRENT
Implied GNPInduced Net Exogenous GNP Differences
Fiscal Tax In- Tax Tax Re- Differ- Using StandardYear crease a_/ Loss b_/ duction £/ ences Multipliers d_/
19781979198019811982
3.914.820.932.347.4
4.531.458.072.681.1
8.446.278.9
104.9128.5
5.035.678.8
123.4178.0
5.936.580.9
127.6170.7
a/ This is the d i f ference between current policy taxes inthe baseline and the less vigorous GNP paths.
b_/ In this case, expenditures were held at current policylevels and taxes were adjusted to generate sufficient aggre-gate demand to support each of the two GNP paths. This columnis the difference between tax collections in these two solu-tions. Departures from current policy taxes were distributedbetween personal and corporate taxes in the ratio these taxesbear to one another in the current policy projections.
_c_/ This column is necessary since traditional tax multipliersare calculated relative to the gross tax change, not thenet tax revenue gain or loss.
d_/ Implied GNP d i f fe rences are based on assumed multipliersfor a sustained decrease in federal taxes (without adjust-ment for induced tax increases due to resulting higherincome levels) of 0.7, 1.2, 1.4, and 1.5 in the firstthrough fourth years, respectively.
26

While the implied and actual GNP differences are not exactlyequal, they are sufficiently close to argue that the multiplierson which the implied differences are based can be viewed as theapproximate implicit multipliers in the underlying model, as shownbelow:
APPROXIMATE DYNAMIC GNP MULTIPLIERS FORA SUSTAINED SPENDING OR TAX CHANGE
Change in GNP/Change -(Change in GNP/Year in Government Spending Change in Taxes)
1st 1.1 0.72nd 1.7 1.23rd 1.8 1.44th 1.8 1.5
27

CHAPTER IV. ALTERNATIVE FIVE-YEAR S C E N A R I O S , FISCAL YEARS1978 to 1982
This section discusses 24 scenarios for fiscal years 1978through 1982. _!/ These combine a high and a low GNP path withstrong, moderate, and weak nonfederal demand.
The high or baseline economic path is consistent with thelong-range economic assumptions used by both Committees on theBudget for the Second Concurrent Resolution on the 1977 Budget(see Table 7). This path would involve a real economic growthrate averaging 5.1 percent over the next five years and an unem-ployment rate falling to 4.1 percent by the end of fiscal year1982. It would imply an annual ra te of inf la t ion (ConsumerPrice Index) that is below 5.0 percent initially but rises toabove 5.5 percent by the end of the five-year period. The low orless vigorous path involves a slower economic expansion. Theannual rate of economic growth would average almost one percentlower than in the baseline path. The unemployment rate at the endof the five-year period would be 5.5 percent , but the pace ofinflation would moderate to 4.6 percent by 1982. 2^1
In the first six of the 24 scenarios, federal spending isheld at current policy levels. In the second six scenariosspending is reduced below current policy levels in $10 billionincrements each fiscal year from 1978 through 1982. Thus spendingis $50 billion below the current policy level by fiscal year1982. In the final two sets of scenarios, spending is increasedabove current policy levels in $10 billion and $20 billion incre-ments, respectively, each fiscal year. Spending thus reaches $50or $100 billion above current policy levels by fiscal year 1982.
All spending increments are divided among purchases, trans-fe r s to persons, and grants-in-aid in the same proport ions asthese categories display relative to one another in the current
_!/ Complete details on the results of all 24 solutions arecontained in Appendix C.
_2/ The high GNP path is that r e f e r r ed to as the "baseline"path in the CBO Report, Five-Year Budget Projections; FiscalYears 1978-1982 (December 1976). The low path is that re-ferred to as "less vigorous economic expansion" in the samereport. See pp. 4-6.
28

TABLE 7. ECONOMIC ASSUMPTIONS, FISCAL YEARS 1977 TO 1982
vo
Economic Variables
Baseline AssumptionsGross National Product (GNP)
Current Dollar GNP(Billions of Dollars)
Real GNP(Billions of 1972 Dollars)
Growth Rate of RealGNP (Percent)
Unemployment Rate (Percent)Consumer Price Index
(Annual Percent Change)
Less Vigorous Economic ExpansionGross National Product (GNP)
Current Dollar GNP(Billions of Dollars)
Real GNP(Billions of 1972 Dollars)
Growth Rate of Real GNP(Percent)
Unemployment Rate (Percent)
1977
1,835.6
1,318.4
5.57.0
5.06
1,835.6
1,318.4
5.57.0
1978
2,034.2
1,392.2
5.66.1
4.8
2,029.2
1,388.8
5.36.1
1979
2,247.2
1,468.8
5.55.5
4.7
2,211.6
1,446.6
4.25.9
1980
2,484.8
1,548.2
5.44.9
4.9
2,406.0
1,504.5
4.05.8
1981
2,740.5
1,622.9
4.84.5
5.2
2,617.1
1,564.6
4.05.7
1982
3,026.0
1,696.5
4.54.2
5.7
2,848.0
1,627.2
4.05.5
Consumer Price Index(Annual Percent Change) 5.0 4.8 4.6 4.6 4.6 4.6

policy expenditure path. This is not to be interpreted as arecommended procedure for increasing spending. Rather it ischosen as the most obviously neutral assumption about the mix ofnew spending. To allow the spending mix to change for a given GNPpath would come close to prejudging various allocational issues,which is not the intent of this analysis.
Once the spending level is established, personal incometaxes and corporate profits taxes are raised or lowered to bringtotal aggregate demand into equality with the target values forGNP. The changes in taxes are allocated between personal andcorporate in the same proportion that these taxes bear to oneanother on a current policy basis.
CURRENT POLICY EXPENDITURES 3/
The first budget strategy examined is that of holding expendi-tures at the current policy level for the next five years and usingtax changes to achieve the target rates of growth. This means thatall government programs currently on the books (except those thatare explicitly temporary) would be continued and the expendituresfor them would be adjusted for inflation and the effects of demo-graphic changes. k_l For example, social security expenditureswould be adjusted not only for increases in the cost of living butalso for increases in the number of persons eligible for social
/ The rest of this chapter is taken almost exactly from ChapterII of the CBO annual report, Budget Options for Fiscal Year1978. The tables presented in Appendix C show exhaustivedetails on all scenarios and also include all combinations ofGNP and nonfederal demand. As indicated in the annualreport, those scenarios that show high GNP and weak nonfede-ral demand with massive fiscal stimulus and those which showstrong nonfederal demand but low GNP due to massive fiscalrestraint are quite unrealistic. For this reason they werenot shown in the annual report. They are included in Appen-dix C for the purpose of complete coverage, but should beviewed in light of the above caution.
_4/ For a more complete description of current policy expendi-tures and revenues, see Five-Year Budget Projections.
30

security. If current policy expenditures were maintained, federalspending would rise at a slower rate than would GNP under either ofthe growth paths considered here. Federal expenditures as afraction of GNP would decline from the present 22.5 percent to alevel between 19.3 and 20.6 percent in fiscal year 1982, dependingon which GNP path was used.
If current policy expenditures were maintained, a balancedbudget in fiscal year 1982 could be attained only if the nonfede-ral sectors were strong (see Table 8). Even in this case, main-taining the higher economic growth rate would require substantialtax cuts late in the period to offset the normal revenue increasesthat result from rising incomes and a progressive personal incometax structure. If such tax cuts were not made, the federal budgetwould exert a restraining influence on the economy and economicgrowth would suffer.
If demand by the nonfederal sectors proved only moderatelystrong, an increasing federal deficit involving still largercuts in taxes would be necessary to achieve the baseline GNPpath. If the nonfederal sectors were weak, still larger deficitswould be required; indeed, it seems unlikely that the baselineeconomic path could be achieved at all if nonfederal sector demandwere weak.
If, however, the economic goals were less ambitious—ifthe nation were willing to settle for the less vigorous economicgrowth path over the next five years—it would be easier tobalance the budget with a declining ratio of federal spending toGNP. With only moderately strong demand by the nonfederal sectorsof the economy, continued current policy expenditures combinedwith modest tax cuts would bring the budget close to balance byfiscal year 1982. Indeed, if the nonfederal sectors were strong,the federal budget could run a substantial surplus without endan-gering the attainment of this less vigorous economic path. Onlyif the nonfederal sectors were weak would it be necessary to run alarge and increasing federal deficit even to attain the lessvigorous path.
31

TABLE 8. CURRENT POLICY EXPENDITURES, FISCAL YEARS 1978 TO 1982: IN BILLIONS OF DOLLARS
Ratio ofExpendi-
FiscalYear
19781979198019811982
19781979198019811982
FederalExpendi-tures
451.0480.0514.0548.0586.0
451.0483.0519.0552.0587.0
tures toGNP (Per-cent)
22.21.20.19.19.
22.21.21.21.20.
13693
28506
Strong
BudgetSurplusorDeficit
- 15.8- 13.2- 20.6- 11.3+ 1.0
c/c/c/c/c/
BASELINE GNP PATH
ModerateNonfederal Demand Nonfederal Demand
RequiredTax In-
(+) creasesor De-
(-) creases
+ 28.1+ 2.7- 32.6- 57.3- 80.9
(+)
(-)
a/a/a/a/a/
LESS VIGOROUS GNP
c/c/c/c/
£/
BudgetSurplus (+)orDeficit (-)
- 49.8- 57.6- 77.2- 81.6- 86.1
PATH
- 45.3- 29.0- 24.3- 13.6- 5.6
RequiredTax In-creases (+)or De-creases (-) a/
- 5- 41- 89-127-168
+ 0+ 0- 10- 23- 39
.8
.6
.2
.6
.1
.5
.0
.4
.3
.2
Weak Nonfederal Demand
BudgetSurplus (+)orDeficit (-)
b/b/b/b/b/
- 79.9- 73.2- 79.6- 81.4- 88.0
RequiredTax In-creases (+)or De-creases (-)
b/b/b/b/b/
- 34.0- 44.1- 65.7- 91.1-121.6
&_l Figures in this column are differences from current policy tax collections.
_b/ The deficits and tax cuts in this column are too large to be regarded as plausible and are, therefore, omitted from thetable.
c_/ A tax policy that generates substantial surpluses would be required to keep the economy from growing at a faster rate.

$50 BILLION LOWER FEDERAL SPENDING BY FISCAL YEAR 1982 5/
A second budget strategy would involve spending cuts of$50 billion below CBO's current policy estimates by fiscal year1982. This is somewhat below the long-term expenditure pathcontained in the fiscal year budget submitted by the Ford Admin-istration in January 1977. Such a path would imply a reduction inthe ratio of federal spending to the gross national product from22.5 percent to between 17.7 and 18.8 percent by 1982 dependingupon which GNP path is used.
As may be seen in Table 9, no matter what is assumed aboutthe strength of nonfederal demand, the lower expenditures impliedby this budget strategy would have to be accompanied by evenlarger tax cuts than those required by current policy expendituresto keep the economy growing even at the less vigorous rate.Indeed, near balance in the federal budget could be achieved bythe end of the period only if nonfederal demand were strong or ifa growth path below the less vigorous one used here were accepted.Moderate nonfederal demand would require large and growing deficitsto achieve the baseline GNP path. Smaller and shrinking deficitswould, however, be consistent with moderate nonfederal demand andattainment of less vigorous economic growth.
$50 or $100 BILLION IN NEW FEDERAL PROGRAMS BY FISCAL YEAR 1982
Current policy spending allows for normal growth in theprograms already enacted, but not for new programs—unless theseare substituted for existing programs. In the past, of course, thefederal government has periodically taken on increasing responsibi-lities, and at present there is support for further expanding thoseresponsibiities. To illustrate the consequences of such increases,this section analyzes two expenditure strategies that raise federalspending $50 billion and $100 billion, respectively, above current
j>/ In this and the following section, it is assumed that changesin expenditures from a current policy path are dividedamong purchases of goods and services, transfers to persons,and grants-in-aid in the same ratios as these categories bearto one another in the current policy projections.
33

TABLE 9. $50 BILLION LOWER FEDERAL EXPENDITURES BY FISCAL YEAR 1982: IN BILLIONS OF DOLLARS
Ratio ofExpendi-
FiscalYear
19781979198019811982
19781979198019811982
FederalExpendi-tures
441.0460.0484.0508.0536.0
441.0463.0489.0512.0537.0
tures toGNP (Per-cent)
21.20.19.18.17.
21.20.20.19.18.
64457
79358
Strong
BudgetSurplusorDeficit
- 20.4- 21.0- 30.6- 11.3- 10.5
c/c/c/c/
£/
BASELINE GNP PATH
ModerateNonfederal Demand Nonfederal Demand
RequiredTax In-
(+) creasesor De-
(-) creases
+ 13.5- 25.0- 72.6-108.3-142.5
(+)
(-)
a/a/a/a/a/
LESS VIGOROUS GNP
c/c/c/c/c/
BudgetSurplus (+)orDeficit (-)
- 54.5- 65.6- 87.4- 92.9- 97.9
PATH
- 49.9- 36.7- 34.2- 24.7- 17.2
RequiredTax In-creases (+)or De-creases (-) a/
- 20- 69-129-178-229
- 14- 27- 50- 74-100
.5
.6
.4
.9
.9
.0
.6
.3
.4
.8
Weak Nonfederal Demand
BudgetSurplus (+)orDeficit (-)
Wb/b/b/
w
- 84.6- 81.0- 89.7- 92.6- 99.9
RequiredTax In-creases (+)or De-creases (-)
b/b/b/b/b/
- 48.7- 71.9-105.8-142.3-183.5
a^l Figures in this column are differences from current policy tax collections.
J>/ The deficits and tax cuts in this column are too large to be regarded as plausible and are, therefore, omitted from thetable.
c./ A tax policy that generates substantial surpluses would be required to keep the economy from growing at a faster rate.

policy levels by fiscal year 1982. The lower of these two levelsassumes that successive increments of $10 billion are added tocurrent policy spending each year through fiscal year 1982, repre-senting an average growth in federal expenditures of 9.0 percent ayear; this is comparable to the average rate of increase exper-ienced from fiscal years 1960 through 1976. This rate of increasewould imply approximate constancy in the ratio of federal spendingto GNP; that ratio would be 21.0 percent to 22.3 percent of GNP by1982, depending on which GNP path is used.
The higher level of spending assumes an increase of $20billion over current policy spending levels in each year, or anaverage growth rate of federal spending of 10.7 percent per yearbetween fiscal years 1977 and 1982. This is roughly the same asthe average rate of increase between 1970 and 1976, but above thecorresponding figure for earlier periods. It would imply a risein the ratio of federal spending to GNP from its current 22.5percent to between 22.6 percent and 24.1 percent, depending onwhich GNP path is used.
As shown in Tables 10 and 11, the basic story would remainthe same, even when expenditures were growing faster than currentpolicy. Attaining a higher baseline growth path while balanc-ing the budget would be possible only if nonfederal demand werestrong. If nonfederal demand were only moderate, it would benecessary either to settle for the less vigorous GNP growth pathor to run a federal deficit. With higher spending, however, thedeficit would not need to be as large as under current policy toachieve a particular growth path. The cuts below current policytaxes shown in Tables 10 and 11 are considerably smaller thanthose shown in Table 8. Moreover, as may be seen in Table 11,if private demand were strong and the higher federal expenditurelevel were desired, taxes must actually be raised to keep theeconomy from growing faster than the baseline rate. Failure toimplement such tax increases in this situation would lead tointense inflationary pressures as rapidly expanding federalprograms competed with the nonfederal sectors for the fullyemployed resources of the economy.
35

TABLE 10. $50 BILLION ADDITIONAL FEDERAL EXPENDITURES BY FISCAL YEAR 1982: IN BILLIONS OF DOLLARS
FiscalYear
19781979198019811982
19781979198019811982
FederalExpendi-tures
461.0500.0544.0588.0636.0
461.0503.0549.0592.0637.0
Ratio ofExpendi-tures toGNP (Per-cent)
22.622.221.821.421.0
22.722.722.822.622.3
Strong
BudgetSurplusorDeficit
- 11.2- 5.4- 10.6- 0.2+ 12.5
c/£/c/c/c/
BASELINE GNP PATH
ModerateNonfederal Demand Nonfederal Demand
RequiredTax In-
(+) creases (+)or De-
(-) creases (-)
+ 42.7 a/+ 30.5 a/+ 7.3 a/- 6.2 a/- 19.4 aj
LESS VIGOROUS GNP
sJc/c/c/c/
BudgetSurplus (+)orDeficit (-)
- 45.2- 49.7- 67.0- 70.3- 74.2
PATH
- 40.7- 21.2- 14.5- 2.6+ 5.9
RequiredTax In-creases (+)or De-creases (-) a/
+ 8.7- 13.7- 49.0- 76.3-106.2
+ 15.1+ 27.8+ 29.3+ 27.6+ 22.3
Weak Nonfederal Demand
BudgetSurplus (+)orDeficit (-)
b/wb/b/b/
- 75.2- 65.3- 69.5- 70.1- 76.1
RequiredTax In-creases (+)or De-creases (-)
b/b/b/b/b/
- 19.3- 16.2- 25.6- 39.8- 59.7
&J Figures in this column are differences from current policy tax collections.
W Th,e deficits and tax cuts in this column are too large to be regarded as plausible and are, therefore, omitted from thetable.
c^l A tax policy that generates substantial surpluses would be required to keep the economy from growing at a faster rate.

TABLE 11. $100 BILLION ADDITIONAL FEDERAL EXPENDITURES BY FISCAL YEAR 1982: IN BILLIONS OF DOLLARS
BASELINE GNP PATH
ModerateStrong Nonfederal Demand Nonfederal Demand
FiscalYear
19781979198019811982
FederalExpendi-tures
471.0520.0574.0628.0686.0
Ratio ofExpendi-tures toGNP (Per-cent)
23.123.123.122.922.6
RequiredBudget Tax In-Surplus (+) creases (+)or or De-Deficit (-) creases (-)
- 6.7+ 2.3- 0.6+ 10.7+ 24.1
+ 57.2+ 58.3+ 47.3+ 44.7+ 42.1
a/a/a/a/a/
LESS VIGOROUS GNP
19781979198019811982
471.0523.0579.0632.0687.0
23.223.624.024.124.1
c/c/
£/c/c/
c/c/c/c/c/
BudgetSurplus (+)orDeficit (-)
- 40.5- 41.8- 56.8- 59.0- 62.4
PATH
- 36.1- 13.5- 4.6+ 8.3+ 17.5
RequiredTax In-creases (+)or De-creases (-)
+ 23.+ 14.- 8.- 25.- 44.
+ 29.+ 55.+ 69.+ 78.+ 83.
41804
75269
Weak Nonfederal Demand
Budget. Surplus (+)
ora/ Deficit (-)
b/b/b/b/
b./
- 70.5- 57.4- 59.5- 58.8- 64.2
RequiredTax In-creases (+)or De-creases (-)
b/b/b/b/b/
- 4.+ 11.+ 14.+ 11.+ 2.
66341
a/ Figures in this column are differences from current policy tax collections.
_b/ The deficits and tax cuts in this column are too large to be regarded as plausible and are, therefore, omitted from thetable.
j:/ A tax policy that generates substantial surpluses would be required to keep the economy from growing at a faster rate.

GENERAL IMPLICATIONS
The key point for Congressional decison-making that arisesfrom the preceding analysis is that, no matter what the strengthof nonfederal demand, the federal government faces a wide range ofbudget possibilities over the next five years. Because not allcombinations of desired economic and budgetary goals can beachieved, however, tradeoffs must be made.
The greater the vigor of the nonfederal sectors:
o The easier the achievement of a high GNP with lessfederal action.
o The smaller the deficit or the greater the surplusfor any GNP goal and federal expenditure strategy.
o The less the federal flexibility for increasingexpenditures or decreasing taxes, given the GNPtarget.
The higher the desired level of federal expenditures (givennonfederal demand behavior):
o The easier the achievement of high GNP through federalaction.
o The smaller the deficit or the greater the surplusneeded to attain a specified GNP growth path.
o The smaller the opportunity to cut taxes.
The higher the GNP goal and the lower the unemploymentgoal (given nonfederal demand behavior):
o The greater the deficit or the smaller the surplusfor any desired level of federal expenditures.
o The greater the federal flexibility for increas-ing expenditures or decreasing taxes.
o The greater the likelihood of continuing or acceler-ating inflation.
38

IMPLICATIONS FOR THE NEXT FIVE YEARS
Unless the nonfederal sectors of the economy prove extra-ordinarily strong, a possible but optimistic prospect, the Congresswill have some very hard choices to make in formulating a budgetstrategy over the next five years. A less than strong performanceby the nonfederal sectors would make it impossible simultaneouslyto maintain a high rate of economic growth, expand federal programswithout increasing the relative size of the federal sector, andbalance the budget. The Congress would then be forced to compro-mise among these goals. New programs would have to be chosen withspecial care and room made in the budget through phasing out someexisting programs and finding more effective ways to accomplishobjectives.
39

CHAPTER V. RECENT EVIDENCE ON NONFEDERAL DEMAND
An important use of the scenarios presented here is toprovide a consistent benchmark against which economic eventscan be judged as they unfold. As has been pointed out repeatedly,it is the performance of the nonfederal sectors that ultimatelydetermines the feasibility of achieving both rapid economic growthand progress toward a balanced federal budget. Frequently, how-ever, many policymakers have concentrated great attention onfederal budget decisions, and given comparatively little considera-tion to emerging evidence concerning behavior of the nonfederalsectors. It is exactly such evidence on the strength of nonfederaldemand, however, that is the key to whether sustained economicgrowth and progress toward federal budget balance is becoming moreor less likely.
The remainder of this chapter considers recent evidence oneach of the major components of nonfederal demand. It examineshow the strength of each sector has changed over the last eightto ten quarters, and points out some key indicators that areworth close attention in the coming 12 to 18 months.
CONSUMPTION
The saving rate has exhibited the following pattern inthe past 10 quarters: _!/
JV Data presented earlier in this paper is based on the nationalincome accounts prior to the July 1977 revisions. Thischapter, however, relates to recent performance rather thanhistorical averages and incorporates the 1977 NIA revisons.
40

1975 Quarters 1976 Quarters 1977 Quarters1 2
SavingRate 6.4 9.4 7.0 6.7 6.3 6.0 5.4 4.6 4.1 5.5
The 9.4 percent level in the second quarter of 1975 wasartificially high because the one-time tax rebates created asurge in real income that was not immediately reflected in consump-tion. Since that time the rate has fallen from the 7.0 percentrange to very low values of 4.6 and 4.1 percent in the last quarterof 1976 and first quarter of 1977 respectively. In terms of theclassifications used here, this represents a shift from weak tovery strong consumption demand. Some of the recent drop in thesaving rate, however, may be due to special circumstances. Growthin disposable income has been fairly slow since mid-1976, whichtends to lower the saving rate if consumption only adjusts with alag. In. addition, farm income has actually fallen. Since it isgenerally believed that a greater fraction of farm income is savedthan is true for total income, this decline tends to lower thesaving rate. Finally, some of the high consumption in late 1976and early 1977 may reflect higher than normal spending on fuel dueto the unusually cold weather. For all of these reasons, it isbest to say that consumption has moved from being weak in most of1975 to being in the strong range in 1976 and early 1977. Manyanalysts are currently looking for the saving rate to stabilize inthe 5.5 to 6 percent range in the near term. This would representcontinued strong consumption demand as defined here. Analysis ofthe saving rate over the next year should give a good indication ofwhether this optimistic view of consumption strength is beingfulfilled.
41

INVESTMENT
Investment fluctuates more than other final demand componentsover the course of a business cycle. For this reason, comparisonof investment growth during the first nine quarters of economicrecovery with five-year average growth rates is not a very usefulexercise.
When compared with other recovery periods, investment hasnot improved as strongly as expected. On the other hand, ithas not been as weak as many popular discussions have indicated.
Housing starts have recovered from low levels below onemillion units per year to the range of 1.7 to 2.0 million peryear. This has represented a pattern of steady improvement,but most forecasters expect little further increase (and possiblysome significant declines) in the next two years.
Many analysts have expressed extreme disappointment withthe recovery in business fixed investment. It is true that,measured relative to its value at the cyclical low point forGNP, business investment seems to have recovered very slowly.The following quarterly pattern of that recovery is interesting,however:
ANNUAL GROWTH RATES IN REAL GNP ANDREAL BUSINESS FIXED INVESTMENT
1975 Quarters 1976 Quarters 1977 Quarters3 4 1 2 3 4 1 2
Real GNP
Real Busi-ness FixedInvestment
-9.6 6.4 11.4 3.0 8.8 5.0 3.9 1.2 7.5 6.4
-22.1 -14.9 -3.5 1.1 8.9 8.0 9.3 1.7 19.0 9.0
These figures show that real business fixed investment continued todecline for two quarters after real GNP began to recover and grewonly very slowly in the third quarter after the trough in GNP.
42

For the first nine months of 1976, on the other hand, real businessfixed investment grew at rates in the 8 to 9 percent per yearrange. The slow growth in investment in the fourth quarter of 1976apears to have been mainly the result of reduced automobile delive-ries. The preliminary data for the first half of 1977 showsa resumption of growth in business fixed investment at roughly a 9percent annual rate, with the very high growth in the first quarterof 1977 reflecting a catch up in automobile deliveries to busines-ses. Since the last quarter of 1975, real nonresidential fixedinvestment has grown at a 9.2 percent annual rate.
The quarter-to-quarter growth rates support a view thatthe recovery in business fixed investment was delayed for anunusual length of time after the trough in real GNP, but thatthe growth in 1976 and early 1977 was fairly strong.
The next 12 to 18 months will reveal a great deal aboutprospects for sustained strength in business investment. Oneresult of the recession's severity is that business capacityutilization rates are still fairly low and most businesses cancomfortably expand production for several more quarters withexisting facilities. Assuming the recovery continues into 1978,capacity utilization will improve. The Congress should monitor howbusiness investment responds as capacity pressures build. Thisresponse will be an important clue to whether development of astrong investment boom in the late 1970s and early 1980s is anincreasingly likely propsect or a fading hope.
STATE AND LOCAL GOVERNMENT PURCHASES
It should be a surprise to no one that state and localgovernment purchases have shown slow growth in the past two years.Much publicized municipal financial problems and the effect of therecession on tax revenues have both had an influence. If 40percent of grants-in-aid is deducted from state and local purchasesand the remainder is adjusted for inflation, then these expendi-tures actually fell from 1975 to 1976. Obviously, this is belowCBO's weak state and local spending assumption. On the otherhand, this is only one year's performance, not a five-year average.It is also heavily influenced by the aftermath of New York's severefinancial problems, and some recovery in state and local spendingis likely.
43

CBO concludes that state and local demand has recently beenweak and may well continue to be so for some time. The long-term strength of state and local spending, however, could stillfall anywhere in the hypothetical range.
NET EXPORTS
As pointed out earlier, net exports are the source of espe-cially large uncertainties. The importance of foreign trade forthe U.S. economy has risen significantly in the past 10 years.Our increased dependence on foreign oil is only one example, albeita very dramatic one, of this growing importance. A broader indica-tion of the expanded role of foreign trade is implicit in thefollowing table. In 1966 the sum of imports and exports amountedto 10.7 percent of GNP. In 1976 the corresponding figure was justover 18 percent.
RELATION OF EXPORTS AND IMPORTS TO GNP:IN BILLIONS OF CURRENT DOLLARS PER YEAR
1966 1976
Exports
Imports
GNP
(I + E) /GNP(percent)
42.8
37.7
753.0
10.7
162.9
155.1
1706.5
18.6
44

Exports and imports during the past ten quarters have been asfollows:
(In Billions of Current Dollars Per Year)
1975 Quarters 1976 Quarters 1977 Quarters1 2
Exports 147.4 142.7 146.9 152.1 153.9 160.6 168.4 168.5 170.4 175.4
Imports 131.9 118.3 126.1 131.3 143.7 150.4 160.6 165.6 178.6 183.5
Net Exports 15.4 24.3 20.8 20.8 • 10.2 10.2 7.9 3.0 -8.2
The very high net exports in 1975 were largely the result ofdepressed imports due to the recession and its aftermath. As wemoved into 1976, exports continued to grow at a moderate rate, butimports grew much faster, causing a decline in net exports.
In the first half of 1977, the United States has experiencedhuge balance of trade deficits. This has been partly offset by asurplus in the services account. Nevertheless, net exports ofgoods and services have turned sharply negative, to a recorddeficit of over $8 billion per year for two quarters.
This recent performance must be called extremely weak. Whilemost forecasters expect some improvement in net exports, littlereal strength appears likely in the near future, since foreigneconomic recovery is generally lagging behind that in the UnitedStates.
45
99-357 O - 77 .


APPENDIXES


APPENDIX A. MODEL EQUATIONS
In the following equations, a label ending in C generallyindicates a current policy projection for a given series preparedby the CBO Budget Analysis Division or the CBO Tax AnalysisDivision. This may or may not differ from a final solution valuefor the same series. An asterisk (*) indicates a "baseline" valuefor a given series. "Baseline" refers to estimates for a currentpolicy projection that include a full national income account(NIA) translation of federal expenditures. It is sometimesnecessary to run the model for an alternate set of assumptions forGNP and current policy expenditures on a unified basis, without acorresponding NIA expenditures translation. The procedure in thiscase is to modify the baseline ratios of purchases, transfers, andgrants to total expenditures based on the relationship between thealternate and baseline real GNP assumptions. (If, for example,alternate GNP is less than baseline GNP then the ratio of trans-fers to total expenditures is raised while the ratios for pur-chases and grants are correspondingly lowered.) The new ratiosare then used to derive an estimated NIA translation of thealternate current policy expenditures.
M = Solution type parameter.
0 = Assume current policy taxes and solve forexpenditures.
1 = Assume current policy expenditures and solvefor taxes.
2 = Set expenditures at a specified proportionof GNP and solve for taxes.
2.5 = Set expenditures at the maximum of currentpolicy levels or a specified proportion ofGNP and solve for taxes.
3 = Set expenditures at a specified amount aboveor below current policy levels and solve fortaxes.
49

YEAR
GNP72
GNP72*
GNP
PGNP
W&S
NWIC
NWI(t)
Fiscal Year (e.g., 1977)
Real GNP (1972$)
Baseline Real GNP (1972$)
Nominal GNP (Current $)
(Ex)
(Ex)
(Ex)
GNP deflator = GNP/GNP72 (1972 = 1.0)
Wages and Salaries (Ex)
Current Policy Nonwage Income (Ex)
t-1NWIC(t)+ £ a(i)* (TFCC(t-i) -TFC(t-i))
i=0
i = 0 1 2 3 4a(i) = .06 .11 .16 .11 .06
t = Solution period index which varies from 1to 5 as succeeding years are solved.
GFUC* = Baseline current policy federal ex-penditures (unified). (Ex)
GFNC* = Baseline current policy federal ex-penditures (NIA). (Ex)
GN-U = Adjustment to unified expenditures =GFNC* - GFUC*.
GFUC = GNP based current policy federal ex-penditures (unified). (Ex)
50
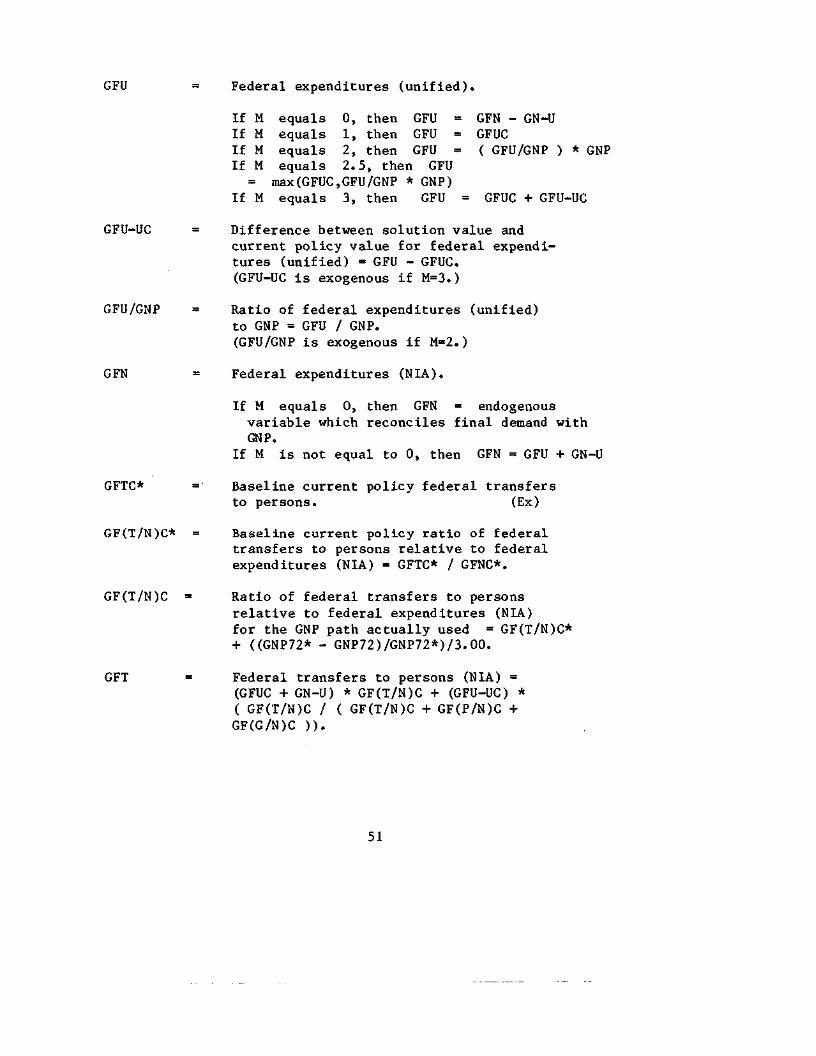
GFU
GFU-UC
GFU/GNP
GFN
GFTC*
GF(T/N)C* =
GF(T/N)C
GFT
Federal expenditures (unified).
If M equals 0, then GFU = GFN - GN-UIf M equals 1, then GFU = GFUCIf M equals 2, then GFU = ( GFU/GNP ) * GNPIf M equals 2.5, then GFU
= max(GFUC,GFU/GNP * GNP)If M equals 3, then GFU = GFUC + GFU-UC
Difference between solution value andcurrent policy value for federal expendi-tures (unified) = GFU - GFUC.(GFU-UC is exogenous if M=3.)
Ratio of federal expenditures (unified)to GNP = GFU / GNP.(GFU/GNP is exogenous if M=2.)
Federal expenditures (NIA).
If M equals 0, then GFN = endogenousvariable which reconciles final demand withGNP.
If M is not equal to 0, then GFN = GFU + GN-U
Baseline current policy federal transfersto persons. (Ex)
Baseline current policy ratio of federaltransfers to persons relative to federalexpenditures (NIA) = GFTC* / GFNC*.
Ratio of federal transfers to personsrelative to federal expenditures (NIA)for the GNP path actually used = GF(T/N)C*+ ((GNP72* - GNP72)/GNP72*)/3.00.
Federal transfers to persons (NIA) =(GFUC + GN-U) * GF(T/N)C + (GFU-UC) *( GF(T/N)C / ( GF(T/N)C + GF(P/N)C +GF(G/N)C )).
51

GF(T/N)
GFPC*
GF(P/N)C* =
GF(P/N)C =
GFP
GF(P/N)
GFGC*
GF(G/N)C* =
GF(G/N)C =
GFG
Solution value for the ratio of federaltransfers to persons to federal expendi-tures (NIA) = GFT / GFN.
Baseline current policy federal purchases(NIA). (Ex)
Baseline current policy ratio of federalpurchases to federal expenditures (NIA) =GFPC* / GFNC*.
Current policy ratio of federal purchases tofederal expenditures (NIA) for the GNP pathactually used= GF(P/N)C* - ( ( GF(T/N)C - GF(T/N)C* )
* ( GF(P/N)C* / (1 - GF(T/N)C*) )),
Federal purchases (NIA) = ( GFUC + GN-U ) *GF(P/N)C + (GFU-UC) * ( GF(P/N)C /( GF(T/N)C + GF(P/N)C + GF(G/N)C )).
Solution value for the ratio of federalpurchases to federal expenditures (NIA) =GFP / GFN.
Baseline current policy federal grants-in-aid to state and local governments. (Ex)
Baseline current policy ratio of federalgrants-in-aid to federal expenditures(NIA) = GFGC* / GFNC*.
Current policy ratio of federal grants-in-aid to federal expenditures (NIA) forthe GNP path actually used = GF(G/N)C* -((GF(T/N)C - GF(T/N)C*)*(GF(G/N)C*/ (1-GF(T/N)C*))).
Federal grants-in-aids to state and localgovernments = (GFUC + GN-U) * GF(G/N)C +GFU-UC *(GF(G/N)C/(GF(T/N)C + GF(P/N)C + GF(G/N)C)).
52

GF(G/N)
TFTUC
TFTU
TFT(U-UC)
SURFU
SURFU/GNP
GST
BT
OLI/(OLI+W&S)=
OLI
TFSUC
TFS(P/U)
Solution value for the ratio of federalgrants-in-aid to federal expenditures(N1A) = GFG / GFN.
Current policy total federal tax receipts(unified). (Ex)
Solution for total federal tax receipts(unified).
If M equals 0, then TFTU = TFTUCIf M does not equal 0, then TFTU= endogenous variable which reconciles finaldemand with GNP.
Difference between solution value forfederal tax revenues and current policytax revenues = TFTU - TFTUC.
Federal surplus (+) or deficit (-) =TFTU - GFU.
Ratio of federal surplus (+) or deficit (-)to nominal GNP = SURFU / GNP.
State and local government transfers topersons. (Ex)
Business transfers. (Ex)
Ratio of other labor income to the sumof other labor income plus wages andsalaries. (Ex)
Other labor income = ( W&S * OLI/(OLI+W&S) )/ (l-OLI/OLI+W&S).
Current policy total contributions forsocial insurance (unified). (Ex)
Ratio of personal contributions for socialinsurance (NIA) to total contributions forsocial insurance (unified). (Ex)
53

TFSPC
TFPUC
TFPU
TFEU
TFPN
Current policy personal contributions forsocial insurance (NIA) = TFSUC * TFS(P/U).
Current policy personal tax receipts (unified).(Ex)
Solution for personal tax receipts (unified).
If M equals 0, then TFPU = TFPUCIf M does not equal 0, then TFPU = TFPUC+ (TFTU-TFTUC) * TFPUC/(TFPUC+TFCC)
Federal estate and gift taxes (unified). (Ex)
Federal personal tax receipts (NIA) =TFPU + TFEU.
TSP/GSPN+T = Ratio of state and local personal tax receiptsto state and local non-grant induced purchasesplus transfers to persons. (Ex)
TSP = State and local personal taxes = TSP/GSPN+T* (GSPN + GST ) - .40 * GFG.
YDP = Personal disposable income = W&S + NWI + GFT +GST + BT + OLI - TFSPC - TFPN - TSP.
EA
CMPE
SAVRATE
C/E
Autonomous consumer expenditures =(1.04)**(YEAR-1973)* (PGNP/1.0592)*200.0.
Consumers' marginal propensity to spend.(This changes for different nonfederaldemand assumptions.) (Ex)
Consumer expenditures (including interestand transfers to foreigners) = EA + CMPE*YDP-.20*(NWI-NWIC).
Saving rate (percent) = (1-E/YDP)*100.
Ratio of personal consumption to totalpersonal expenditures. (Ex)
Personal consumption = E * C/E.
54

%CH(I-GNP) =
TFCC
TFC
1C
Annual growth rate of real investment in excessof the growth rate of real GNP (percent peryear). (This changes for different nonfederaldemand assumptions.) (Ex)
Current policy federal corporate profitstaxes. (Ex)
Solution for corporate profits taxes
If M equals 0, then TFC = TFCCIf M does not equal 0, then TFC = TFCC+ (TFTU - TFTUC)* (TFCC/TFPUC + TFCC)).
Current policy total nominal investment= IC(-l)* (GNP72/GNP72(-1) + %CH(I-GNP)/100)*(PGNP/PGNP(-1)).
(IC(0) is an exogenous value for totalnominal investment in the year precedingthe first period of the solution.)
%CHGSPN
GSPN
Total nominal investment
t-11C
i=0b(i) * (TFCC(t-i)-TFC(t-i))
0 1 2 3 4.10 .15 .10 .10 .05
Annual growth rate in real non-grant-inducedstate and local government purchases. (Thischanges for different nonfederal demandassumptions.) (Ex)
Non-grant-induced state and local govern-ment purchases = GSPN(-1)*(1+%CHGSPN/100)*(1+((PGNP/PGNP(-!))-!)*!.50). (GSPN(O) is anexogenous value for nominal state and localgovernment purchases in the year prior to thefirst period of the solution minus .40 timesgrants-in-aid during the same period.)
55

GSP = State and local government purchases =GSPN + .40*GFG.
NX9% = Nominal net exports at 4 percent real growthand 5 percent inflation. (This changes fordifferent nonfederal demand assumptions.) (Ex)
GNP9% = GNP9% (-!)*(!.09) (GNP9% (0) = GNP(O) = nominal GNPin the year prior to the first period of thesolution. )
NX = Nominal net exports = NX9%-((GNP/GNP9%)-1)*.07*GNP9%.
Depending on the solution procedure chosen, either GFN,total expenditures NIA, or TFTU (total tax receipts, unified)is determined by the GNP identity, namely, that GNP = C + I+ GFP + GSP + NX.
56

APPENDIX BGLOSSARY


APPENDIX B. GLOSSARY
%CH(I-GNP)
%CHGSPN
BT
C
C/E
CMPE
E
EA
I
1C
GF(G/N)
GF(G/N)C
GF(G/N)C*
GF(P/N)
Annual growth rate in investment minus annualgrowth rate in real GNP.
Annual growth rate in real non-grant-inducedstate and local government purchases.
Business transfers.
Personal consumption expenditures.
Consumption / total personal expenditures.
Consumer marginal propensity to spend.
Total personal expenditures.
Autonomous personal expenditures.
Total investment (current $).
Current tax policy investment (current $).
Federal grants-in-aid to state and localgovernments / federal expenditures (NIA).
Current policy (federal grants-in-aid tostate and local governments / federal expendi-tures (NIA)).
Baseline current policy (federal grants-in-aidto state and local governments / federal expen-ditures (NIA)).
Federal purchases / federal expenditures (NIA).
59

GF(P/N)C
GF(P/N)C*
GF(T/N)
GF(T/N)C
GF(T/N)C*
GFG
GFGC*
GFNC*
GFP
GFPC*
GFT
GFTC*
GFU
GFU-UC
Current policy (federal purchases / federalexpenditures (NIA)).
Baseline current policy (federal purchases /federal expenditures (NIA)).
Federal transfers to persons / federal expendi-tures (NIA).
Current policy (federal transfers to persons /federal expenditures (NIA)).
Baseline current policy (federal transfers topersons / federal expenditures (NIA))
Federal grants-in-aid to state and localgovernments.
Baseline current policy federal grants-in-aid to state and local governments.
Baseline current policy federal expenditures(NIA).
Federal purchases (NIA).
Baseline current policy federal purchases(NIA).
Federal transfers to persons.
Baseline current policy federal transfersto persons.
Federal expenditures (unified).
Federal expenditures (unified) minus currentpolicy federal expenditures (unified).
60
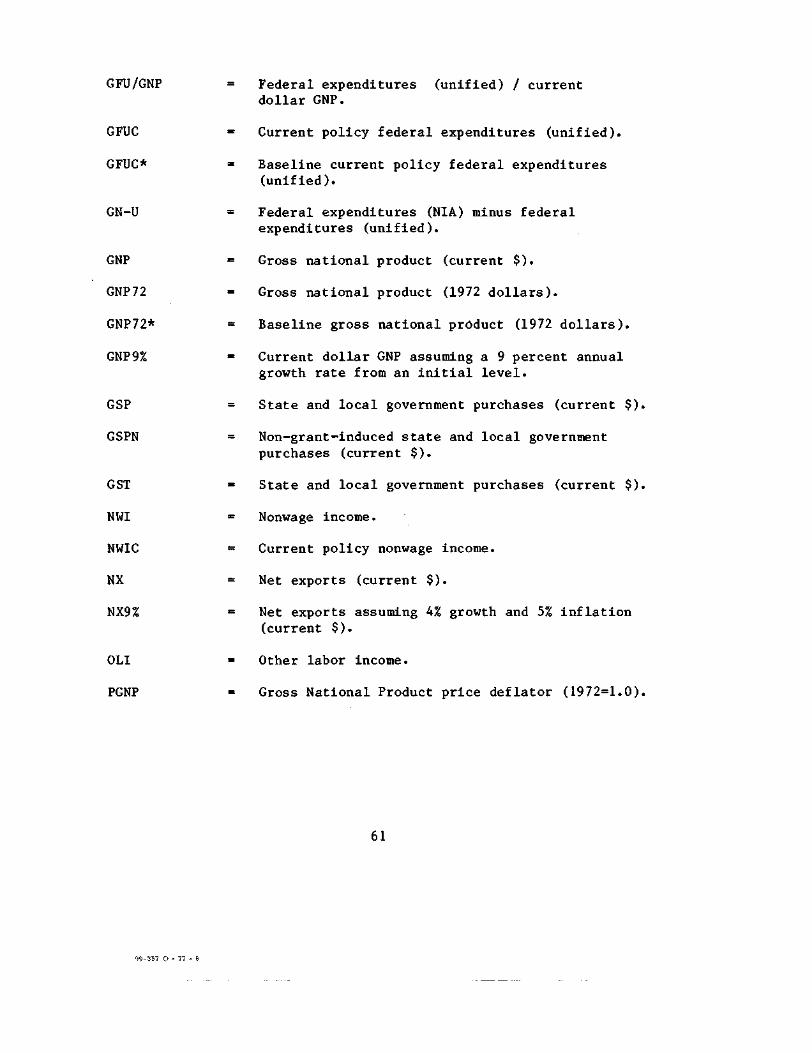
GFU/GNP
GFUC
GFUC*
GN-U
GNP
GNP72
GNP72*
GNP 9%
GSP
GSPN
GST
NWI
NWIC
NX
NX9%
OLI
PGNP
Federal expenditures (unified) / currentdollar GNP.
Current policy federal expenditures (unified).
Baseline current policy federal expenditures(unified).
Federal expenditures (NIA) minus federalexpenditures (unified).
Gross national product (current $).
Gross national product (1972 dollars).
Baseline gross national product (1972 dollars).
Current dollar GNP assuming a 9 percent annualgrowth rate from an initial level.
State and local government purchases (current $).
Non-grant-induced state and local governmentpurchases (current $).
State and local government purchases (current $).
Nonwage income.
Current policy nonwage income.
Net exports (current $).
Net exports assuming 4% growth and 5% inflation(current $).
Other labor income.
Gross National Product price deflator (1972=1.0).
61
99-357 O - 77 - 6

OLI/(OLI+W&S) =
PGNP
SAVRATE
SURFU
SURFU/GNP
TFC
TFCC
TFEU
TFPN
TFPU
TFPUC
TFS(P/U)
TFSPC
TFSUC
Other labor income / (other labor income+ wages & salaries).
GNP price deflator.
Personal savings rate.
Federal surplus(+) or deficit(-) (unified)
Federal surplus(+) or deficit(-) (unified)/ current dollar GNP.
Federal corporate income tax receipts.
Current policy federal corporate incometax receipts.
Federal estate and gift tax receipts(unified).
Federal personal tax and nontax receipts(NIA).
Federal individual income tax receipts(unified)
Current policy federal individual incometax receipts (unified).
Personal social insurance contributions(NIA) / total social insurance contribu-tions (unified).
Personal contributions for social insurance(NIA).
Total contributions for social insurance(unified).
62

TFT(U-UC)
TFTU
TFTUC
TSP
TSP/GSPN+T
W&S
YDP
YEAR
Total federal revenues (unified) minus currentpolicy total federal revenues (unified).
Total federal revenues (unified).
Current policy total federal revenues (unified).
State and local personal tax receipts.
State and local personal tax receipts / (non-grant-induced state and local purchases) +state and local transfer payments.
Wages and salaries.
Disposable personal income.
Fiscal year currently being solved.
63


APPENDIX CDETAILED SOLUTION RESULTS
NOTES: This appendix contains facsimilies of24 computer print-outs giving the details of theequation solutions for the 24 scenarios discussedgenerally in Chapter IV.
All years in the tables are fiscal years.


BASEL- I IME GIMF> PATH&-.
STRONG NON— FEDERAL. DEMAND
YEAR GNP721978 1392.21979 1468.81980 1548.21981 1622.91982 1696.5
YEAR GFU/GNP1978 0.22171979 O.21351980 O.20681981 O. 19991982 O. 1936
YEAR GST
1978 30.41979 32.81980 35. 21981 37.61982 4O.O
YEAR YDP1978 1373.71979 153O. 31980 1699.51981 1873. O1982 2062. a
YEAR GFN1978 457.71979 488.4198O 522.61981 560. 31982 602. a
YEAR GFPC*1978 162.31979 171.81980 183.51981 195. 31982 207.4
YEAR TFTUC1978 407.01979 464. O1980 526.01981 594. O1982 668.0
GNP72*1392.21468.81548.21622.91696.5
GFU451.0480. 0514.0548. 0586. 0
BT
8.28.99.510.21O.8
EA335.6365.5398.7436.3479.3
GFGC»73.775.478.483.389.2
GFP162.3171.8183.5195.32O7.4
TFTU435. 1466.7493.3536.6587.0
EXPENDITURES ATPGNP GNP W&S NWIC1.4611 2034.2 1091.9 332.81.5299 2247.2 1205.5 378.51.6049 2484.8 1333.O 417.71.6886 274O.5 1471. O 460.51.7836 3026.0 1624.1 5O7.9
GN-U GFN GF(T/N)C* GF(T/N)C6.7 457.7 0.3840 0. 384O8.4 488.4 0.3894 0.38948.6 522.6 O. 3941 0.394112.3 560.3 0.3999 0.399916.2
OLI/(OLI+W&S)0.06680.0683O.O6980.07130.0728
CMPEO.704O0.704O0. 70400. 704O0.7040
GF(G/N)C*0.16100.15430.15000. 14860. 1481
GF<P/N)C»0.3545O. 3517O.35110. 3485O. 3444
TFT(U-UC)28.12.7
-32.6-57.3-80.9
602.2
OLI
78.188.31OO.O112.9127.5
SAVRATE5.15965.7O456. 12706. 31O76.3865
GF(G/N)C0.16100. 15430.15000. 1486O. 1481
GF<P/N)CO. 35450.3517O.35110. 34850.3444
SURFU-15.8-13.2-20.6-11.31.0
0.4066
TFSUC
124.0139.0152.017O.O188. 0
E13O2.81443. O1595.41754.81930.5
GF(G/N)0.1610O.15430.15000. 1486O. 1481
GF(P/N)0.35450.35170.35110. 3485O.3444
SURFU/GNP-0.0077-0.0059-0. 0083-O.00410.0003
0.4066
TFSCP/U)
0. 57OO0.57000.57000.57OO0.5700
C/E0. 97400.974O0.974O0.974O0. 9740
GFG73.775.478.483.389.2
GFNC*457.7488.4522.6560.3602.2
CURRENT F»CJl_ICrV l_EVEl_SNWI332.4377.7417.0461.2511.0
GFTC* GF(T/N) GFT175.8 O.384O 175.8190.2 0.3894 190.2206. 0 0.3941 2O6.O224. 1 0. 3999 224. 1244.9
TFSPC
70.679.286.696.9107.1
C1268.91405.51553.91709.21880. 3
ZCHGSPN3.750O3.75003.75003. 75003.750O
GFN457.7488.4522.6560.3602.2
0.4066
TFPUC
188.0219.0255.0295. 034.1.0
XCH(I-GNP)2.OOOO2.OOOO2.00002.OOOO2.0000
GSPN258.5287.1319.8357.8402. 5
GN-U6.78.48.612.316.2
244.9
TFPU
209.5221.0229.925O.4277.2
TFCC58. 067. 077.085. 092. 0
GSP288.0317.3351.2391.1438.2
GFUC*451.0480. 0514. 0548.0586.0
TFEU
6.06.07.O7.08.O
TFC64.667.669.472. 174.7
NX9X13.015.017.019. 021. 0
GFU451.048O.O514.0548.0586. O
TFPN
215.5227.0236.9257.4285.2
1C304.8343.1386.6434.6489.0
NX10.610.39.48.56.8
GFUC451.0480.0514.0548.0586.0
TSP/GSPN+T
O.29900.3030O. 3O7O0.311O0.3150
I3O4.2342.1386.6436.2493.0
NX/GNPO.OO520.00460.00380.0031O.OO22
GFU-UC0.00.00.0O.OO.O
TSP
56.966.777.689.6103.7

00
TABLE C —SBASEL-1 ME GNP PATH
&-.MODERATE IvIOtM—FEDERAL- DEMAND
YEAR GNP721978 1392.21979 1468.81980 1548.21981 1622.91982 1696.5
YEAR GFU/GNP1978 0.22171979 0.21351980 0.20681981 0. 19991982 0.1936
YEAR GST
1978 30.41979 32.81980 35.21981 37.61982 40.0
YEAR YDP1978 1400.71979 1567.11980 1748.31981 1935.71982 2141.9
YEAR GFN1978 457.71979 488.4198O 522.61981 56O.31982 602.2
YEAR GFPC*1978 162. 31979 171.81980 183.51981 195.31982 207.4
YEAR TFTUC1978 407.01979 464.01980 526.01981 594.01982 668. 0
GNP72*1393.31468.81548.21622.91696.5
GFU451.0480.0514. 0548. 0586.0
8T
8.28.99.510.310.8
EA335.6365.5398.7436.3479.3
GFGC*73.775.478.483.389.2
GFP162.3171.8183.5195.3207.4
TFTU401.1422.3436-. 7466. 3499.8
EXPENDITURES ATPGNP GIMP W&S NWIC1.4611 2034.3 1091.9 332.81.5299 2347.2 1205.5 378.51.6049 2484.8 1333.0 417.71.6886 2740.5 1471.0 460.51.7836 3O26.0 1624.1 507.9
GN-U GFN GF(T/N)C* GF(T/N)C6.7 457.7 0.384O O. 38408.4 488.4 0.3894 O. 38948.6 532.6 O. 3941 0.394112.3 560.3 0.3999 O. 399916.2
OLI/(OLH-W&S)0.06680.0683O.O698O.O7130.0728
CMPE0.69700.697O0.69700.69700. 6970
GF(G/N)C*0.16100.15430.1 5OO0. 1486O.1481
GF(P/N)C*O.3545O. 35170.35110. 34850.3444
TFT(U-UC)-5.8-41.6-89.2-127.6-168.1
602.2
OLI
78.188.3100.0112.9127.5
SAVRATE6.33836.98467.51877.81588.0116
GF(G/N)C0. 16100. 1543O. 15OO0. 14860. 1481
GF(P/N)C0.35450.35170.35110.34850. 3444
SURFU-49.8-57.6-77.2-81.6-86. 1
0. 4066
TFSUC
124.0139.0152. 0170.0188.0
E1312.01457.71616.81784.41970. 3
GF(G/N>0. 16100. 15430. 15000. 14860.1481
GFCP/N)O.3545O.35170.35110. 34850. 3444
SURFU/GNP-O.O245-O.O256-0.0310-O.O297-0.0284
0.406.6
TFS(PXU)
0. 57000. 57000.57OO0. 57OO0. 5700
C/E0.97400.97400.974O0.974OO.974O
GFG73.775.478.483.389.2
GFNC*457.7488.4522.6560.3602.2
CURRENT POL- ICYNWI332.8379.2420.2466.2517.6
GFTC* GF(T/N) GFT175.8 0.3840 175.8190.2 0.3894 19O.2306. O O.3941 206.0224.1 0.3999 224.1344.9
TFSPC
7O.679.386.696.91O7. 1
C1377.81419.81574.81738.01919.1
ZCHGSPN3.00003.00003. OOOO3. OOOO3. OOOO
GFN457.7488.4522.6560.3602.2
0.4066
TFPUC
188. 0219.0255.0295.0341.0
XCHU-GNP)1 . OOOOl.OOOO1 . OOOO1 . OOOO1 . OOOO
GSPN256.6283.0313.9347.5388.2
GN-U6.78.48.612.316.2
244.9
TFPU
183.5187.0186.4195.9208.5
TFCC58.067.077. 085.092.0
GSP286.1313.2344.3380.9423.9
GFUC*451.0480.0514.0548.0586.0
I_EVEI_S
TFEU
6.06.07.07.08.O
TFC56.657.256.356.456.2
NX9%8.09.010.011.013.0
GFU451.0480.0514. 0548.0586.0
TFPN
189.5193.0193.4303.9316.5
1C3O2.O336.8375.9418.6466.6
NX5.64.32.4O.5-2.1
GFUC451.0480.0514.0548.0586. 0
TSP/GSPN+T
0.29900.3030O. 3O7O0.311O0.3150
I302.1338.0379.6425.7477.6
NX/GIMP0.0027O.O0190. 0009O.OOO1-O.OO07
GFU-UC0.00.00.0O.O0.0
TSP
56.365. 575.586.499.2

BASELINE F>ATMa*
WEAK NON— FEDERAL- DEMANDEXPENDITURES AT CURRENT F>OL_ ICV
YEAR GNP721978 1392.21979 1468.81980 1548.21981 1622.9 .1982 1696.5
YEAR GFU/GNP1978 0.22171979 0.21351980 0.20681981 0. 19991982 0. 1936
YEAR GST
1978 30.41979 32.81980 35.21981 37.61982 4O.O
YEAR YDP1978 1428.31979 1604.51980 1797.51981 1998.61982 2221.4
YEAR GFN1978 457.71979 488.41980 522.61981 560.31982 6O2.2
YEAR GFPC*1978 163.31979 171.81980 183.51981 195.31982 207.4
YEAR TFTUC1978 407.01979 464.01980 526.01981 594.01982 668.0
GNP72*1392.2146.8.81548.21622.91696. 5
GFU451. 0480. 0514. 0548. 0586.0
BT
8.28.99.510.210.8
EA335.6365.5398.7436.3479.3
GFGC*73.775.478.483.389.2
GFP162.3171.8183.5195.3207.4
TFTU366.4377.1379.6395.8412.9
PGNP1.46111 . 52991 . 60491 . 68861 . 7836
GN-U6.78.48.612.316.2
OLI/(OLI+W&.S)O. 06680. 0683O. O698O.O7130. 0728
CMPE0.69OO0.69000.69OO0.69000. 6900
GF(G/N)C*O. 16100. 15430.15000.14860. 1481
GF<P/N)C*O. 35450.3517O.35110.3485O. 3444
TFT(U-UC)-40.5-86.8-146.3-198. 1-255.0
GNP2O 34. 22247.22484.8274O. 53026. O
GFN457.7488.4522.6560. 36O2.2
OLI
78.188.3100.0112.9127.5
SAVRATE7. 5O778.24648.87949.27349. 5682
GF(G/N)CO.16100.15430. 1500O. 1486O. 1481
GF<P/N)CO.35450.35170.35110. 34850.3444
SURFU-84.5-102.8-134.3-152.1-173.0
W&S1091.912O5.51333.01471.01624.1
GF<T/N)C*O. 384O0. 38940.39410. 3999O.4O66
TFSUC
124.0139.0152.0170.0188. 0
E1321.11472. 11637.91813.22008.8
GF(G/N)0. 16100.15430. 15000. 14860. 1481
GF(P/N)0. 35450.35170.35110. 34850.3444
SURFU/GNP-0.0415-O.O457-0.054O-0.0555-0.0571
NWIC332.8378.5417.746O. 5507.9
GF(T/N)C0. 38400. 38940. 39410. 39990.4066
TFS(P/U>
0.5700O.570OO. 570OO. 57OO0. 5700
C/E0.9740O.97400.97400.97400.9740
GFG73.775.478.483.389.2
GFNC*457.7488.4522.656O. 3602.2
NWI333.3380.7423.5471.2534.2
GFTC*175.8190.3306.0224.1244.9
TFSPC
70.679.286.696.9107. 1
C1286.71433.91595.31766. 11956.6
%CHGSPN2.35002,35002.35002. 25002.3500
GFN457.7488.4532.6560. 36O2.2
GFCT/N)0. 38400. 38940. 39410.39990.4066
TFPUC
188. 0319. 0255.0295.0341. 0
%CH(I-GNP)O. OOOOO.OOOOO.OOOO0.00000.0000
GSPN254.8278.9306.2337.5374.3
GN-U6.78.48.612.316.2
GFT175.8190.2206.0324.1344.9
TFPU
156.9152.5142.5141.1140.1
TFCC58. O67. 077.085.093.0
GBP284.2309. 1337.5370.9409.9
GFUC*451.048O.O514.0548.0586. 0
TFEU
6.O6.O7.O7.08.0
TFC48.446.643.040.637.8
NX9%3.03.03.03.03.0
GFU451. 0480. 0514. 0548.0586. 0
TFPN
162.9158.5149.5148.1148. 1
1C399.233O.5365.4403.1445.0
NX0.6-1.6-4.5-7.4
-11.1
GFUC451.0480.0514.0548.0586.0
TSP/GSPN+T
0.299OO. 3O3O0. 3O700.31100.3150
I300.1334.0372.8415.6463.0
NX/GNPO.OOO3-O.OOO7-0.0018-O.OO27-0. 0036
GFU-UCO.OO.O0.00.0O.O
'
TSP
55.764.373.483.394.8

vrcsoRdus&-.
fp/vrn
YEAR GNP721978 1388.81979 1446.61980 1504.51981 1564.61982 1627.2
YEAR GFU/GNP1978 0.22221979 0.21831980 O.21571981 0.21O91982 0.2061
YEAR GST
1978 30.41979 32. 8198O 35.21981 37.61982 4O.O
--40 YEAR YDP1978 1367.51979 1485.51980 1604.71981 1733.21982 1872.8
YEAR GFN1978 457.71979 491.41980 527.61981 564.31982 603.2
YEAR GFPC*1978 162.31979 171.81980 183.51981 195.31982 207.4
YEAR TFTUC1978 405. 11979 453.9198O 505. 11981 561.71982 620.6
GNP72*1392.21468.81548.21622.91696.5
GFU451.0483.0519. 0552.0587.0
BT
8.28.99.510.210.8
EA335.6365.2397.3432.2470.3
GFGC*' 73.7.75.478.483.389.2
GFP162.0171.4182.3192.72O2.9
TFTU439.5497.4549.3605.7664.0
STRONGE XF"END I TLJRES
PGNP GIMP W&S1.4611 2029.2 1089.81.5288 2211.6 1188.81.5992 2406.0 1293.21.6726 2617.1 1406.91.7502 2848.0 1531.2
GN-U GFN GF(T/N)C*6.7 457.7 0.38408.4 491.4 0.38948.6 527.6 O.394112. 3 564. 3 O. 399916.2
OLI/(OLH-W&S)0. 0668O.O6830.0698O.07130. 0728
CMPE0.7040O.7O4O0.7O4O0.70400.704O
GF(G/N)C*0. 16100.15430.1 50OO. 14860.1481
GF(P/N)C»O. 3545O.35170.35110. 3485O. 3444
TFT(U-UC)34.443.544.244. 043.4
6O3.2
OLI
78.087.197.0108.0120.2
SAVRATE5. 04864.99204. 80034.61354.4328
GF(G/N)C0. 16080. 15310. 1476O.14570.1447
GF(P/N)C0. 35410. 3488O.34560.34160. 3365
SURFU-11.414.430.353.777.0
0.4066
TFSUC
124.0137.2148.7164. 1178.8
E1298.51411.31527.61653.21789.8
GF(G/N)O. 16O80.15310. 14760. 14570. 1447
GF(P/N)0.35410. 34880. 34560.34160. 3365
SURFU/GNP-0.00560.0065O.O1260.0205O.O270
NON — FEDERAL DEMAND3 AT CURRENT F»OLICYNWIC NWI332.3 331.8374.8 373.3408. 1 405. 1443.3 439.1481.8 477.0
GF<T/N)C GFTC* GF(T/N) GFTO.3849 175.8 0.3849 176.10.3944 19O.2 O. 3944 193.8O.4O35 206. O 0.4035 212.90.4119 224.1 0.4119 232.40.4202
TFS(P/U)
0.57000.57000. 57000. 570O0.5700
C/E0.9740O.9740O.974O0. 97400.9740
GFG73.675.277.982.287.2
GFNC*457.7488.4522.6560. 3602.2
244.9
TFSPC
70.678.284.793.5101.9
C1264.71374.61487.91610.31743.2
%CHGSPN3.75OO3. 75003. 750O3. 75003. 7500
GFN457.7491.4527.6564.3603.2
0.4202
TFPUC
186.8214.6244.9277.5314.6
ZCH(I-GNP)2.00002.0OOO2.OOOO2.00002.0OOO
GSPN258.5286.8318. 1352.8391.5
GN-U6.78.48.612.316.2
253. 5
TFPU
213. 1248.2279.2311.9349.0
TFCC57.363.270.977.582.6
GSP287.9316.9349.3385.7426.5
GFUC*451.0480. 0514.0548.0586.0
LEVELS
TFEU
6.06.07.07.08.0
TFC65.373.180.887.191.6
NX9X13.015.017. 019.021.0
GFU451.0483.0519. 0552.0587.0
TFPN
219.1254.2286.2318.9357.0
1C304.1337.8374.6415.3460.6
NX11.012.814.917.119.3
GFUC451.0483.0519. 0552.0587.0
TSP/GSPN+T
0.29900.30300. 3O700.31100.315O
I303.3335.6371.3411.0455.9
NX/GNP0.0054O.OO580.00620.0065O.O067
GFU-UC0.00.0O.O0.0O.O
TSP
56.966.777.388.5101.0

LESS VIGOROUS CNR RATH
MODEE XREND I TURES
NON —FEDCURRENT F>OI_ICY LEVELS
YEAR GNP721978 1388.81979 1446.61980 1504.51981 1564.61982 1627.2
YEAR GFU/GNP1978 0.22221979 O.21831980 0.21571981 0.21O91982 O.2061
YEAR GST
1978 30.41979 32.81980 35. a1981 37.61985 40.0
YEAR YDP1978 1394.51979 1551.81980 1655.31981 1793.81982 1948.8
YEAR GFN1978 457. 71979 491.41980 527. &1981 564. 31982 6O3.a
YEAR GFPC»1978 162. 31979 171.81980 183.51981 195.31985 207.4
YEAR TFTUC1978 405. 11979 453. S198O 505. 11981 561.71982 650.6
GNP72*1392.21468.81548.51655.91696.5
GFU451.0483. 0519.0552.0587.0
BT
8.58.99.510.510.8
EA335.6365.5397.3435.2470.3
GFGC*73.775.478.483.389.2
GFP162.0171.4182.3192.72O5.9
TFTU405.6453.9494-. 6538.3581.3
PGNP1 . 461 11.55881.59951 . 67561 . 7505
GN-U6.78.48.612.316.2
OLI/(OLI+WBcS)O.O6680.06830. 06980.07130. 0728
CMPE0. 69700. 69700. 6970
' 0.697O0. 6970
GF(G/N)C*0. 161O0.15430.1500O. 14860.1481
GF<P/N)C*0. 35450.35170.35110. 3485O.3444
TFT(U-UC)0.50.0
-10.4-23.3-39.2
GNP2029.2221 1 . 62406. 02617.12848.0
GFN457.7491.4527.6564.3603.2
OLI
78.087.197.0108.0120.2
SAVRATE6. 23076. 29886.25286.20966. 1786
GF(G/N)C0. 16080.15310. 1476O. 1457O. 1447
GF(P/N)C0.35410.34880.3456O.34160.3365
SURFU-45.3-29. O-24.3-13.6-5.6
W&S1089.81188.81293.21406.91531.2
GF(T/N)C*0. 384O0. 38940.39410. 3999O. 4O66
TFSUC
124. 0137.5148.7164.1178.8
E1307.61426.01549.01682.41828.4
GFCG/N)0. 16080.15310. 14760.1457O.1447
GFCP/N)0.35410. 34880. 34560.34160. 3365
SURFU/GNP-0.0223-O.0131-0.01O1-O.O052-O.OO19
NWIC332.3374.8408.1443.3481.8
GF(T/N)C0. 38490. 39440.4O35O.41190. 4202
TFSCP/U)
0. 57000. 57000. 57000. 57000.570O
C/E0.97400.97400.974O0. 97400.974O
GFG73.675.277.982.287.2
GFNC*457.7488.4522.6560. 3602.2
NWI335.2374.7408.2443.8483.2
GFTC*175.8190. 2206.0224.1244.9
TFSPC
7O.678.284.793.5101.9
C1273.61388.91508.71638.71780.9
ZCHGSPN3. OOOO3. OOOO3. OOOO3. OOOO3. OOOO
GFN457.7491.4527.6564.36O3.2
GFCT/N)0.38490. 39440.4035O.4119O.4205
TFPUC
186.8214.6244.9277.5314.6
XCH(I-GNP)1 . OOOO1 . OOOO1 . OOOOl.OOOO1 . OOOO
GSPN256.6582.7311.3342.7377.6
GN-U6.78.48.612.316.2
GFT176.1193.8215.9535.4553.5
TFPU
187.5214.6236.7259.2283.5
TFCC57.363.270.977.585.6
GSP586.1312.8342.5375.6412.5
GFUC*451.0480.0514.0548.0586. 0
TFEU
6.O6.07.07.O8.O
TFC57.463.568.575.374.4
NX9X8.09.010.011.015.0
GFU451. 0483.0519. 0552.0587.0
TFPN
193.5550.6243.7566.2291.5
1C301.3331.5364.1399.9439.3
NX6.06.87.99.110.3
GFUC451. 0483.0519.0552. 0587.0
TSP/GSPN+T
0.59900.3030O.3070O.31100.3150
I301.2331.5364.3400.7441.1
NX /GNP0.00290.0030O.O033O.OO3S0.0036
GFU-UC0.00.00.00.00.0
TSP
56.365.575.285.496.6
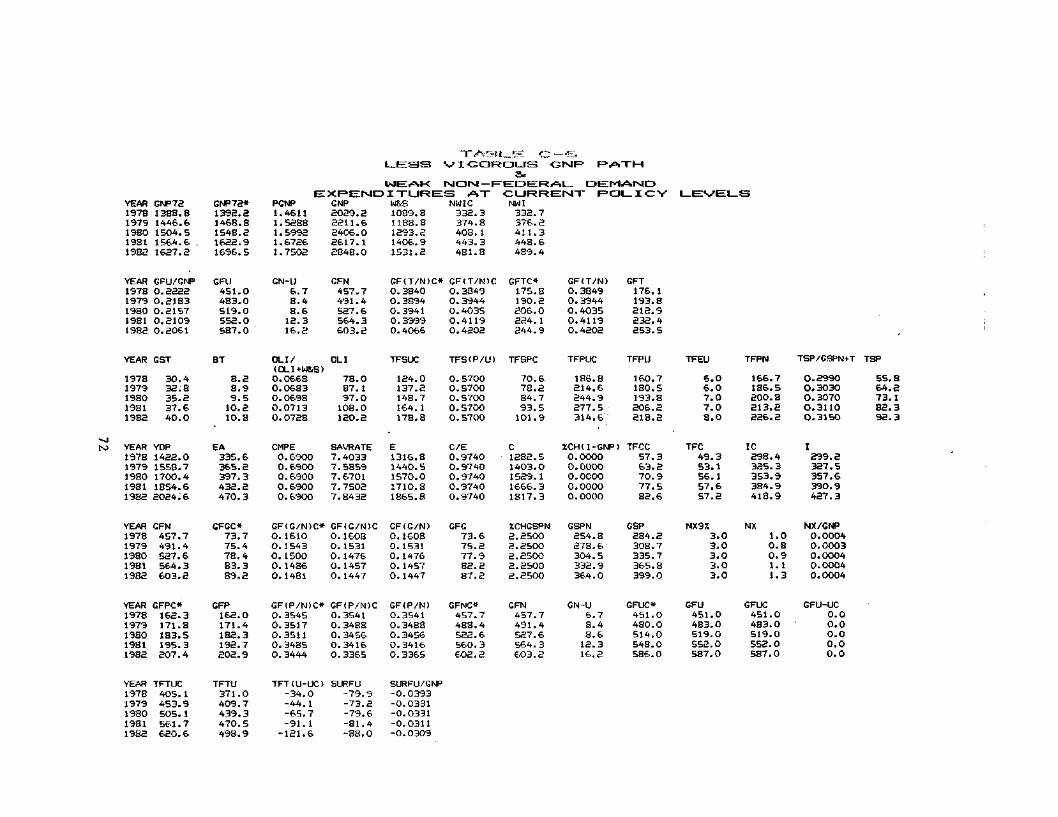
LESS VIGOROUS <3MF> PATH
WEAK NON— FEDERAL DEMAND
YEAR GNP731978 1388.81979 1446.61980 1504.51981 1564.6 .1982 1637.3
YEAR GFU/GNP1978 0.23331979 O.31831980 0.21571981 O.31O91983 0.2061
YEAR GST
1978 3O.41979 33.81980 35.21981 37.61983 40.0
YEAR YDP1978 1432.01979 1558.71980 1700.41981 1854.61983 3024.6
YEAR GFN1978 457.71979 491.41980 527.61981 564.31982 603.3
YEAR GFPC*1978 163. 31979 171.81980 183.51981 195.31983 307.4
YEAR TFTUC1978 4O5. 11979 453.91980 505. 11981 561.71983 620.6
GNP73*1393.31468.81548.31633.91696. 5
GFU451. 0483. 0519.0553.0587.0
BT
8.38.99.510.310.8
EA335.6365.3397.3433.2470.3
GFGC*73.775.478.483.389.2
GFP162.0171.4182.3192.7303.9
TFTU371.0409.7439.3470.5498.9
EXPENDITURES ATPGNP GNP W&S NWIC1.4611 3029.3 1089.8 332.31.5288 3311.6 1188.8 374.81.5992 2406.0 1393.2 4O8. 11.6726 3617.1 1406.9 443.31.7502 2848.0 1531.2 481.8
GN-U GFN GF(T/N)C* GF(T/N)C6.7 457.7 O.3840 O. 38498.4 491.4 0.3894 0.39448.6 527.6 0.3941 0.403512.3 564.3 0.3999 0.411916.2
OLI/(OLI+W&.S)O.06680.06830.06980.0713O. 0738
CMPE0.69000. 69000.69000.69000. 6900
GF(G/N)C*0. 16100. 15430.1500O. 14860.1481
GF(P/N)C*0.35450.35170.35110. 34850. 3444
TFT(U-UC)-34.0-44. 1-65.7-91. 1-131.6
603.3
OLI
78. 087. 197.0108.0130.2
SAVRATE7.40337. 58597.67017.75O37.8433
GF(G/N)C0. 1608O. 15310. 14760.14570. 1447
GF(P/N)C0.35410. 34880.3456O.34160. 3365
SURFU-79.9-73.2-79.6-81.4-88.0
0. 4066
TFSUC
134.0137.3148.7164.1178.8
E1316.81440.51570.0171O.81865.8
GFCG/N)0. 16080. 15310.14760. 14570. 1447
GF(P/N)0.35410. 3488O. 34560.34160.3365
SURFU/GNP-O.O393-O.0331-0.0331-O.O311-0.0309
0.42O2
TFS<P/U)
0.570O0.57000. 57OO0. 57000.5700
C/E0.97400.974O0.97400.97400.9740
GFG73.675.277.983.387.3
GFNC*457.7488.4533.6560. 3602.2
CURRENWI332.7376.3411.3448.6489.4
GFTC*175.8190.3206.0324. 1344.9
TFSPC
70.678.284.793.5101.9
C1282.51403. O1529.11666. 31817.3
XCHGSPN2.25003.35002.35002.25002.2500
GFN457.7491.4537.6564.3603.2
E:NT ROI
GF(T/N)0. 38490. 39440.40350.41190.4202
TFPUC
186.8314.6244.9277.5314.6
%CH(I-GNP)O. OOOO0.00000.0000O.OOOOO. OOOO
GSPN254.8278.6304.5332.9364.0
GN-U6.78.48.612.316.2
L-ICY
GFT176.1193.8213.9232.4353.5
TFPU
160.7180.5193.8206.2318.2
TFCC57.363.270.977.582.6
GSP284.2308.7335.7365.8399. 0
GFUC*451.0480.0514.0548.0586. 0
LEVELS
TFEU
6.06.07.07.08.0
TFC49.353.156.157.657.2
NX9Z3.03.03.03.03.0
GFU451.0483.0519. O552.0587.0
TFPN
166.7186.5300.8313.2236.3
1C398.4335.3353.9384.9418.9
NX1.00.80.91. 11.3
GFUC451.0483.0519.0553.0587.0
TSP/GSPN+T
O.2990O. 3O300. 3070O.3110O.3150
I299.2327.5357.6390.9427.3
NX/GNPO.OOO40.0003O.OO040.00040.0004
GFU-UCO.O0.0O.O0.00.0
•
TSP
55.864.273.182.392.3

i_.er. c—"7*BASEL. I NE; <3NF>
a*STRONG NON—FEDERAL- DEMAND
YEAR GNP721978 1392.21979 1468.8198O 1548.21981 1622.91982 1696.5
YEAR GFU/GNP1978 0.21671979 0.20461980 0. 19471981 0. 1853
1982 0. 1771
YEAR GST
1978 30.41979 32.8
198O 35.21981 37.6
1982 40.0
YEAR YDP1978 138O.O1979 1542.31980 1716.81981 1895.31982 2089.3
YEAR GFN1978 447.71979 468.41980 492.61981 520. 31982 552.3
YEAR GFPC»1978 162. 31979 171.8198O 183.51981 195.31982 207.4
YEAR TFTUC1978 4O7.01979 464.01980 526. 01981 594. O1982 668.0
BII_l_IOrsl U.OUJER FEDERAL- E XF^END I TLJRES BY F" I SCAI—GNP72* PGNP GNP W&S NWIC NWI1392.2 1.4611 2034.2 1091.9 332.8 332.61468.8 1.5299 2247.2 1205.5 378.5 378.41548.2 1.6049 2484.8 1333.0 417.7 418.81622.9 1.6886 2740.5 1471.0 460.5 464.31696.5 1.7836 3026.0 1624.1 507.9 515.5
GFU GN-U GFN GF<T/N>C* GF(T/N)C GFTC* GF(T/N) GFT441.0 6.7 447.7 O. 3840 0. 384O 175.8 0.3831 171.546O.O 8.4 468.4 0.3894 0.3894 190.2 0.3874 181.5484.0 8.6 492.6 0.3941 0.3941 206.0 O. 3913 192.75O8.0 12.3 520.3 0.3999 0.3999 224.1 0.3964 206.2536.0
BT
8.28.99.5
10.2
10.8
EA335.6365.5398.7436.3479.3
GFGC*' 73.7
75.4
78.4
83.3
89.2
GFP158.3163.9171.7179.7188.2
TFTU420.5438.9453.3485.6525.4
16.2
OLI/
<OLI+W&S>O.O6680. O683O. 06980.07130.0728
CMPEO. 7O400.70400.7O4O0.7040O. 7040
GF(G/N)C*O. 161O
0.15430.15000. 1486
0. 1481
GF(P/N)C*O. 3545O. 3517
0.3511O. 34850. 3444
TFT(U-UC)13.5
-25.0-72.6
-108.3-142.5
552.2
OLI
78.188.3
100.0112.9127.5
SAVRATE5.27505.9OO16. 38526.61736.7295
GF(G/N)CO. 161O
O. 1543
0.1500O. 1486
0.1481
GF(P/N)CO.3545O.35170.35110. 3485O. 3444
SURFU-2O. 4-21.0-30.6-22.3-10.5
0.4066
TFSUC
124.0139.O152.017O.O188.0
E1307.21451.316O7.21769.81948.7
GF(G/N>0. 16060.1536O. 14890. 1473
0. 1466
GF(P/N)O.3537O. 35OO0. 34860.34540. 3409
SURFU/GNP-O.O100-0.0093-0.0123-O.0081-O.O034
0.4066
TFS(P/U)
0. 57000. 57000. 5700O. 57OO0.5700
C/E0.97400.97400.97400.974O0.9740
GFG71.971.9
73.3
76.6
80.9
GFNC*457.7488.4522.6560. 3602.2
244.9
TFSPC
70.679.2
86.696.9
107.1
C1273.31413.61565.41723.81898.0
ZCHGSPN3. 75003.75OO3.75003.75003.7500
GFN447.7468.4492.6520.3552.2
0.4025
TFPUC
188. 0219.0255. 0295.0341.0
%CH<I-GNP>2.00002.0OOO2.0OOO2.00002.00OO
GSPNuSS.5287.1319.8357.8402.5
GN-U6.78.48.6
12.316.2
222.2
TFPU
198.3199.8199.1210.8228.7
TFCC58.0
67.0
77.085.0
92.0
GSP287.3315.9349.2388.5434.9
GFUC*451.0480. 0514.0548.0586.0
TFEU
6.06.07.07.O8.0
TFC61.2
61.160.160.7
61.7
NX9X13.015. 017.019.0
21.0
GFU441 . 0460. O484.0508.0536.0
YEAR
TFPN
204.3205.8206.1217.8236.7
1C304.8343. 1386.6434.6489.0
NX10.6
10.39.48.56.8
GFUC451.048O.O514.0548.0586. 0
TSP/GSPN+T
O.29900. 30300. 30700.31100.3150
I304.5343.2388.9439.8497.8
NX/GNP0.00520. 00460.00380.00310.0022
GFU-UC-10. 0-20. 0-30.0-40.0-50.0
TSP
57.668.1
79.692.3
107.0

H
ct<111
0(D
QHZlL<E>LU1DQ
v t U" ooom-U lllQ rndruoiru
1 : 1 Ji li 7 « rn co ru \6 ryliJ w IL i. 3 m m -i- <• in
0 ruooruoi in"1 r- ru co oo ru u)IB P Ql ru Qlv* z rn 'f in U5 u>
U »•I T-1 »H —I Tt
ctcaoiognjm ( Ji ty^ ($\
i/iui t<- ru ru•H <H ru u> ru
• r- oo 01 o ru. U « -. ru ru
z »< •» rn -t m*s m r *-< iy ru^ co co 01 01 o»-• m m rn m <•uddddd
coru o ^01o ui o u) < <I- r- 01 o ru -rL. ~-.ru ruruo
2 t- to f- m -Hu vS -t -t in r-v»« o 01 oo i-Druru —-H-oddddd
<5 [*- r~ co co couj 01 en 01 01 01
O0! UI rt UI
r-ujr- 29]CL l/l tjj r* 03 O05 *•*
J-
I Q Q O O Q(n ^ n r^ »H incj 5^ o O *"* **x nj m ro m mu5 O O O O O
m UD ui *-< GO2 oo^rumr-n pi- p»> v£ m
ooo oop u)u> r- i*- oo
m u) in *H oo3 ruinui us 01CL r- u> in in ui
oo ooo3 oooi in in -Ho_ co *-« in en -$•u. ~ ru nj ru m
UJfUiflOl -ip. o 01 u} ifl r-05 r- r- co 01 oLL «-i
1 Hlglen in ui ui ui ini- odd do
ooo o o3 -t 01 ru d coen ru m in r*- coU. ~-.---
*-< rn o 01 incoco oru r-
" r-co o^ru
sjE CO m co m co
-ooooo
ruoiuirucoCO 00 01 O O
I-m
oru in r- oI— m m m m -41
utr cooiO'jnj^ Is* f** DO tn oo
o SS S com n rn -^ -4"
O 00 (P U) UJ
ry ui ui oo icj m m rn -^ •<•
n o *ii -4" mO Ul ul -t * •*
o oo o oo oor-r-ui rucj IP us h- oo <TILLH
looooo •1 O O O O O'
rt rtrtrf«
ru co m u3 co
S§!ffi$
IllllLU 01 01 01 01 CD
0 O OO O O
<t 01 uO -t inu) in co 01 co
LU rt rt
^ o rn in u) mcc ui r~ ii o m> < ~ r- ~mS ui r^ r^ co co
ooo o o
iddddd
uj tn r^ rn rn
^ m m ?n -f -41
UJ
~»rucQ nj njr** 01 in co 01
K co OIQ " rulij 01 01 01 01 01
XO O O OO
1
X
ooo oo
01X
-tcomru iflui -i ru co o
a oo •-< <f r- ruB5 ru m m m •»•
u) o 01 in ruz ic m ru N coo. in co r-i -<• caen ru ru rn m m
zQL O O O O OCO O O O O O(J O O O O OI O O O O O« m m m m m
& tt* m iff (T*^ -4 m u> o
o r- r- r- p- coU- .
"^ i& its tn rn LQv o n oo r^ u>O "£ Ui -4" ^ -^
o d d d d d
2 o m o us *^*v *"< •'f O 00 00
o d d odd
uz o fn o L£I 'x *H -^ O CO 03(J vu I/I UI <f
oooooo
r- -* •* m ruo rn in co rn 01LLu
r- <«• u) m ru
z <f u> 01 nj inLL -t < -t in in
cc co 01 o •.* ru[}| (Ti iT> ffl CTt tTt
o oooo
£??*??
o oo ooO >-i O •»• CO U)p in oo i •f mLL •* ui in inu
oo ooo
3 -4" u) co o rnLL •* < < in in
oo oooO *•« O 't CO i£3 UI 03 — ' 00LL •'t -^ ui in in
r- <f a) rn ru
3 U5 CO CO ru ifl
z """
r- •* ifi m rur- oo ru o ruz <t u) 01 ru in
U- -t -t -t in in
r- 't iXJ m ru
i f iSmSS0_ tH Ul -^ -t <•*- rn n rn rn rnfed d odd
oz in r- •« in -Tx. ^- -i rt CO -To- ui in in <r <r•^ m rn m m rnfed d odd
*oz in r- -i in -fX *f »H -( CO *3"
o_ in in in >*•• m rn m rn mu o o ooo
m 01 r- r- njoo m ~ 01 co
CL Ul U? r~ r~ COLL r- 1 *• t »H v t — i0
m oo in m •*o ru -« rn ui r-CL U) Is- CO 01 O
CC CO 01 O ••« HJ
LU 01 01 01 01 01
o r- ru -< co mx uj 01 in m ru3 ru ru m m mu. o o o o o3 d d d d den i < i i i
ill U) " 01 01D <r in r- ru r-u. m u3 co 01 01
3 in vfl •* 01 01i . • . . .3 O 01 01 CO 01— ru U5 ru r- njH I i -« - ruU_ I I I
^- m ui o o3 ui -t u5 in cou. m m rn >j <•
o oo o o
a: co 01 o -> << r- r- oo oo i
74

c; — -~>BASELItvIE
YEAR GNP721978 1392.21979 1468.81980 1548. 31981 1622.9 .1982 1696.5
YEAR GFU/GNP1978 0.21671979 0.20461980 0. 19471981 0.18531982 0.1771
YEAR GST
1978 3O.41979 32. 81980 35.21981 37.61982 40.0
YEAR YDP1978 1434.81979 1616.7198O 1815.21981 2021.31982 2248.9
YEAR GFN1978 447. 71979 468. 41980 492.61981 520. 31982 552.2
YEAR GFPC*1978 162. 31979 171.81980 183. 51981 195.31982 207.4
YEAR TFTUC1978 407. 01979 464. 01980 526. 01981 594.01982 668. 0
BILLION LOWER FEDERAL EXFEMD I TLJRES BY FISCALGNP72* PGNP GNP W&S NWIC NWI1392.2 1.4611 2034.2 1O91.9 332.8 333.51468.8 1.5299 2247.2 12O5.5 378.5 381.51548.2 1.6049 2484.8 1333.0 417.7 425.31622.9 1.6886 2740.5 1471.0 460.5 474.31696.5 1.7836 3O26.O 1624.1 507.9 528.7
GFU GN-U GFN GF(T/N)C* GF(T/N)C GFTC* GF(T/N) GFT441.0 6.7 447.7 0. 384O 0.384O 175.8 O. 3831 171.5460.0 8.4 468.4 0.3894 0,3894 190.2 0.3874 181.5484.0 8.6 492.6 0.3941 0.3941 206.0 0.3913 192.75O8.0 12.3 52O. 3 0.3999 O. 3999 224.1 O.3964 206.2536.0
BT
8.28.99.51O.210.8
EA335.6365.5398.7436.3479.3
GFGC*73.775.478.483.389.2
GFP158.3163.9171.7179.7188.2
TFTU351.7349.0339.2344.235O.8
16.2
OLI/<oLi+w&s>0.0668O.O6830. 0698O.07130.0728
CMPEO.690O0.69000.69OO0.6900O.69OO
GF(G/N)C*0.16100.15430.1 5OO0. I4860. 1481
GF(P/N)C*O.35450.35170.3511O.34850. 3444
TFT(U-UC)-55.2-114.9-186.7-249.7-317.1 -
552.2
OLI
78. 188.31OO.O112.9127.5
SAVRATE7.61668.42799.11489. 54849.8705
GF(G/N)C0. 16100. 1543O. 150O0. 14860.1481
GF(P/N)C0. 35450.3517O. 3511O. 3485O. 3444
SURFU-89.2-110.9-144.7-163.7
x -185.1
0.4066
TFSUC
124.0139.0152.017O.O188.0
E1325.51480.41649.71828.22026.9
GF(G/N>O. 16O6O. 15360. 14890.14730. 1466
GF(P/N)0. 3537O. 35000. 34860. 3454O. 3409
SURFU/GNP-0.0438-0.0493-0.0582-O.0597-0.0611
0.4066
TFS(P/U)
O. 570O0. 57000.57000. 570O0.570O
C/E0.97400.97400.97400. 97400.9740
GFG71.971.973.376.680.9
GFNC*457.7488.4522.6560.36O2.2
244.9
TFSPC
70.679.286.696.9107.1
C1291. 01441.91606.81780.71974.2
ZCHGSPN2. 25002.25OO2.25002.25002.2500
GFN447.7468.4492.6520.3552.2
O. 4025
TFPUC
188.0219. 0255.0295. 0341. 0
XCH(I-GNP)O.OOOOO.OOOO0.0000O.OOOO0.0000
GSPN254.8278. 9306.2337.5374.3
GN-U6.78.48.612.316.2
222.2
TFPU
145.7130.9111.5101.191.2
TFCC58.067. 077.085.092.0
GSP283.5307.7335.5368.24O6.7
GFUC*451.0480. 0514.0548. 0586.0
TFEU
6.06.07.07.08.O
TFC44.940. 033.629. 124.6
NX9X3.03.03.O3.O3.0
GFU441.0460.0484. 0508. 0536.0
YEAR
TFPN
151.7136.9118.51O8.199.2
1C299.233O.5365.4403.1445.0
NXO.6-1.6-4.5-7.4
-11.1
GFUC451. 0480.0514.0548.0586. 0
TSP/GSPN+T
0.299O0. 30300.30700.311OO.315O
I300.5335.1375.1419.1467.8
NX/GNPO.O003-O.OOO7-O.OO18-0. 0027-0.0036
GFU-UC-10. 0-20.0-30.0-40.0-5O.O
TSP
56.565.675.486.098.1

St.-.E: O — 3L OVIGOROUS
YEAR19781979198019811982
YEAR19781979198019811982
YEAR
19781979198019811982
0=! YEAR19781979198019811985
YEAR19781979198019811982
YEAR19781979198019811982
YEAR19781979198019811982
Hi 50GNP721388.81446.61B04.51564.61627.2
GFU/GNP0.2173O.E0930.20320.1956O. 1885
GST
3O.432.835.237.640.0
YDP1373.91497.41621.71755.01899. 1
GFN447.7471.4497.6524.3553.2
GFPC»162.3171.8183.5195.3207.4
TFTUC405.1453.95O5. 1561.7620.6
eil_l_IOM LOWER FEDERAL- EXPEND I TLJRES BY F ]GNP72* PGNP GNP W&S NWIC NWI1392.2 1.4611 2029.2 1089.8 332.3 332.01468.8 1.5288 2211.6 1188.8 374.8 374.01548.2 1.5992 2406. O 1293.2 4O8. 1 4O6.81622.9 1.6726 2617.1 14O6.9 443.3 442.11696.5 1.7502 2848.0 1531.2 481.8 481.3
GFU GN-U GFN GF(T/N)C* GF(T/N)C GFTC* GF(T/N) GFT441. O 6.7 447.7 0.3840 O. 3849 175.8 O.3839 171.8463. O 8.4 471.4 0.3894 O. 3944 190.2 O.3925 185.0489.0 8.6 497.6 0.3941 0.4035 2O6.0 0.4007 199.4512.0 12.3 524.3 0.3999 0.4119 224.1 0.4084 214.1537.0
BT
8.28.99.510.210.8
EA335.6365.2397.3432.2470.3
GFGC»• 73.775.478.483.389.2
GFP158.1163.6170.8177.5184.3
TFTU425. 0469.9509.6554.9602.6
16.2
OLI/(OLI+W&S)O.O668O.06830.0698O.07130.0728
CMPE0.7O400.7O4O0. 70400. 70400.7O40
GF(G/N)C*0.16100.15430. 15000. 14860. 1481
GF(P/N)C*0. 3545O.35170.3511O. 34850. 3444
TFT ( U-UC )19.916.04.5-6.7-17.9
553.2
OLI
78. 087.197.0108.0120.2
SAVRATE5.16495. 19755.08324.95864.8276
GF(G/N)C0. 1SOSO.15310. 1476O.14570. 1447
GF(P/N)CO.3541O.3488O. 34560.34160.3365
SURFU-15.96.92O. 642.965.6
0.4066
TFSUC
124.0137.2148.7164. 1178.8
E13O2.91419.61539.31668.01807.5
GF(G/N)0. 16O40. 15230. 14660. 14440. 1432
GF(P/N)0.35320. 34710. 34320. 33860.3331
SURFU/GNP-O.OO780.00310.0085O.O164O.0230
0.4202
TFS(P/U>
0. 57000. 57000. 57000. 5700O.5700
C/E0.97400. 97400.97400.97400.9740
GFG71.871.872.975.779.2
GFNC*457.7488.4522.6560.3602.2
244.9
TFSPC
7O.678.284.793.5101.9
C1269.01382.71499.31624.61760.5
XCHGSPN3.75003.75003.75003.75003.75OO
GFN447.7471.4497.6524.3553.2
0.4161
TFPUC
186.8214.6244.9277.5314.6
%CH(I-GNP)2.00OO2.00002.00002.00OO2.00OO
GSPNL'58. 5286.8318. 1352.8391.5
GN-U6.78.48.612.316.2
230.2
TFPU
2O2.0226.9248.4272.2300.4
TFCC57.363. E70.977.582.6
GSP287.2315.6347.3383.1423.2
GFUC*451.0480. 0514. 0548.0586. 0
CSCAI—
TFEU
6.06.07.O7.08.0
TFC61.966.871.976.078.8
NX9Z13.015.017.019.021.0
GFU441.0463.0489.0512.0537.0
YEAR
TFPN
208.0232.9255.4279.23O8.4
1C304.1337.8374.6415.3460.6
NX11.012.814.917.119.3
GFUC451. 0483.0519.0552. 0587.0
1-982
TSP/GSPN+T
O.2990O. 30300. 30700.3110O.315O
I303.6336.7373.4414.4460.5
NX/GNPO.O0540.00580.00620.0065O.O067
GFU-UC-10.0-20. 0-30. 0-40.0-50.0
TSP
57.668.179.391.1104.2

*3IL_t=~: C — * SQS VIGOROUS GNF* RATH
BtLL-IOtM LOWMODERATE
EIR FEDERALMOM —FEDERALE XF>END I TLJRES
DEMANDi BY FISCAL YEAR
YEAR GNP721978 1388.81979 1446 '.61980 15O4.51981 1564.61982 1627.2
YEAR GFU/GNP1978 0.21731979 0.2093198O 0.20321981 0. 19561982 0. 1885
YEAR GST
1978 30.41979 32.81980 35. a1981 37.61982 40. O
YEAR YDP1978 1400.91979 1533.81980 1669.51981 1815.81982 1975.5
YEAR GFN1978 447.71979 471. A1980 497. &1981 524.31982 553. a
YEAR GFPC*1978 162.31979 171. a1980 183.51981 195.31982 207.4
YEAR TFTUC1978 405. 11979 453.91980 505. 11981 561.71982 620.6
GNP72*1392.21468.81548.21622.91696.5
GFU441. 0463.0489.0512.0537.0
BT
8.28.99.510.210.8
EA335.6365.2397.3432.2470.3
GFGC*73.775.478.483.389.2
GFP158.1163.6170.8177.5184.3
TFTU391.0426.2454-. 7487.2519.7
PGNP1.46111 . 52881 . 59921 . 67261 . 7502
GN-U6.78.48.612.316.2
OLI/(OLI+W&S)0.06680.0683O. 06980.0713O. O728
CMPE0. 69700.697O0. 6970
' 0.69700. 6970
GF(G/N)C*0.16100.15430.15000. I4860.1481
GF(P/N)C*0.35450.35170.35110. 34850. 3444
TFT(U-UC)-14.0-27.6-50.3-74.4-100.8
GIMP2029. 22211.62406. 02617.12848. 0
GFN447.7471.4497.6524.3553.2
OLI
78.087. 197.0108.012O.2
SAVRATE6. 34366.49656. 52236. 53526. 5473
GF(G/N)C0. 16080.15310. 14760. 14570. 1447
GF(P/N)C0.3541O. 34880. 34560.3416O. 3365
SURFU-49.9-36.7-34.2-24.7-17.2
W&S1089.81188.81293.21406.91531.2
GF(T/N)C*0. 38400. 38940.39410. 39990.4066
TFSUC
124.0137.2148.7164.1178.8
E1312.11434.21560.61697. 11846. 1
GF(G/N)0. 16040.15230. 14660. 14440. 1432
GFCP/N)O.35320. 34710. 34320. 33860.3331
SURFU/GNP-0.0246-0.0166-O.O142-0.0094-0.0060
NWIC332.3374.8408. 1443.3481.8
GF(T/N)CO. 38490. 39440.40350.41190.4202
TFS<P/U>
0. 570O0. 57OO0. 570O0. 57000. 5700
C/E0.97400.97400.97400.97400.9740
GFG71.871.872.975.779.2
GFNC*457.74S8.4522.6560. 3602.2
NWI332.4375.5409.9446.8487.5
GFTC*175.8190.2206.0224. 1244.9
TFSPC
7O.678.284.793.5101.9
C1277.91396.91520.01653.01798. 1
%CHGSPN3.00003. OOOO3.00003. OOOO3. OOOO
GFN447.7471.4497.6524.3553.2
GF(T/N)0.38390. 39250.40070.40840.4161
TFPUC
186.8214.6244.9277.5314.6
ZCH(I-GNP)1 . OOOO1 . OOOO1 . OOOO1 . OOOO1 . OOOO
GSPN256.6282.7311.33 2.73' ?.&
GN-U6.78.48.612.316.2
GFT171.8185.0199.4214.1230.2
TFPU
176. 0193.2205.8219.3234.7
TFCC57.363.270.977.582.6
GBP285.4311.4340.5373.0409. 3
GFUC*451. 0480. 0514.0548.0586. 0
TFEU
6.06.07.07.08.0
TFC53.956.959.561.261.6
NX9%8.09.010.011.012.0
GFU441. 0463. 0489. O512.0537.0
TFPN
182.0199.2212.8226.3242.7
1C301.3331.5364.1399.9439.3
NX6.06.87.99.110.3
GFUC451.0483.0519. 0552.0587.0
TSP/GSPN+T
0.29900. 30300. 30700.311O0.3150
I301.6332.6366.5404.1445.8
NX/GNP0.00290.00300.00330.00350.0036
GFU-UC-10.0-2O. O-3O.O-40. 0-50.0
TSP
57.166.877.188.O99.8

00
LESS VIGOROUS GNP PATH
WEAK NON — FEDER AL_ DEMANDt—OUIER FEDERAL- EXPENDITURES BY IF I SCAt— YEAR 1. -3SS
YEAR GNP721978 1388.81979 1446.61980 15O4.51981 1564.61982 1627.2
YEAR GFU/GNP1978 0.21731979 0.20931980 0.20321981 0.19561982 0.1885
YEAR GST
1978 3O. 41979 32.81980 35.21981 37.61982 40.0
YEAR YDP1978 1428.51979 157O.81980 1717.81981 1876.81982 2051.5
YEAR GFN1978 447.71979 471.4198O 497.61981 524.31982 553.2
YEAR GFPC*1978 162. 31979 171.81980 183.51981 195.31982 207.4
YEAR TFTUC1978 405. 11979 453.9198O 505. 11981 561.71982 620.6
GNP72»1392.21468.81548.21622.91696.5
GFU441. 0463.0489.0512.0537.0
BT
8.28.99.510.210.8
EA335.6365.2397.3432. 2470.3
GFGC*73.775.478.483.389.2
GFP158.1163.6170.8177.5184.3
TFTL)356.3381.9399.2419.3437.0
PGNP1.46111.52881 . 59921 . 67261 . 7502
GN-U6.78.48.612.316.2
OLI/(OLl+W&S)0.06680.06830.06980.07130.0728
CMPE0.690O0.690O0.69000.690O0.690O
GF<G/N)C*0. 16100.15430. 15000. 14860. 1481
GF(P/N)C*0. 35450.35170.35110. 3485O. 3444
TFT(U-UC)-48.7-71.9-105.8-142.3-183.5
GNP2029.22211.65406.02617.12848.0
GFN447.7471.4497.6524.3553.2
OLI
78.087.197. 0108.012O.2
SAVRATE7.513O7. 77627.92718.05818.1887
GF(G/N)C0. 16O80.1531O. 147&0. 14570.1447
GF(P/N)C0.35410.34880.34560.34160. 3365
SURFU-84.6-81.0-89.7-92.6-99.9
W8-S1089.81188.81293.21406.91531.2
GF(T/N)C*O.3840O. 38940.39410. 3999O. 4066
TFSUC
124.0137.2148.7164.1 .178.8
E1321.21448.71581.61725. 51883. 5
GF(G/N)0. 16040.15230. 14660. 1444O. 1432
GF(P/N)0. 35320.34710. 34320. 33860.3331
SURFU/GNP-O.O417-0.0366-0.0373-O. 0354-0.0351
NWIC332.3374.84O8. 1443.3481.8
GF(T/N)C0. 3849O. 3944O. 40350.4119O.4202
TFS(P/U)
O.5700O.57000. 57000. 57000. 5700
C/E0.974O0.9740O. 974O0. 97400.9740
GFG71.871.872.975.779.2
GFNC*457.7488.4522.6560. 3602.2
NWI332.9377.0413.1451.6493.8
GFTC*175.8190.22O6.0224.1244.9
TFSPC
7O.678.284.793.5101.9
C1286.81411.01540.51680.71834.5
%CHGSPN2.25002.25002.25002.25002.2500
GFN447.7471.4497.6524.3553.2
GF(T/N)0.38390.39250.4007O. 40840.4161
TFPUC
186.8214.6244.9277.5314.6
%CH(I-GNP)0.0000O.OOOOO.OOOO0.00000.0000
GSPN254.8278. 6304.5332.9364.0
GN-U6.78.48.612.316.2
GFT171.8185. 0199.4214.1230.2
TFPU
149.4158.9162.8166.2169.1
TFCC57.363.270.977.582.6
GSP283.5307.3333.7363.2395.7
GFUC*451.048O.O514.0548.0586.0
TFEU
6.06.07.07.08.O
TFC45.846.847.146.444.4
NX9Z3.03.03.03.03.0
GFU441.0463. 0489. 0512. 0537. 0
TFPN
155.4164.9169.8173. a177.1
1C298.4325.3353.9384.9418.9
NX1.00.80.91.11.3
GFUC451.0483.0519.0552.0587.0
TSP/GSPN+T
O.299OO.3O3O0.3070O.3110O.3150
I299.6328.6359.8394.4431.9
NX/GNPO.OOO4O.OOO30.0004O.OO040. 0004
GFU-UC-10.0-20.0-30.0-40.0-50.0
'
TSP
56.565.675.184. 995.5
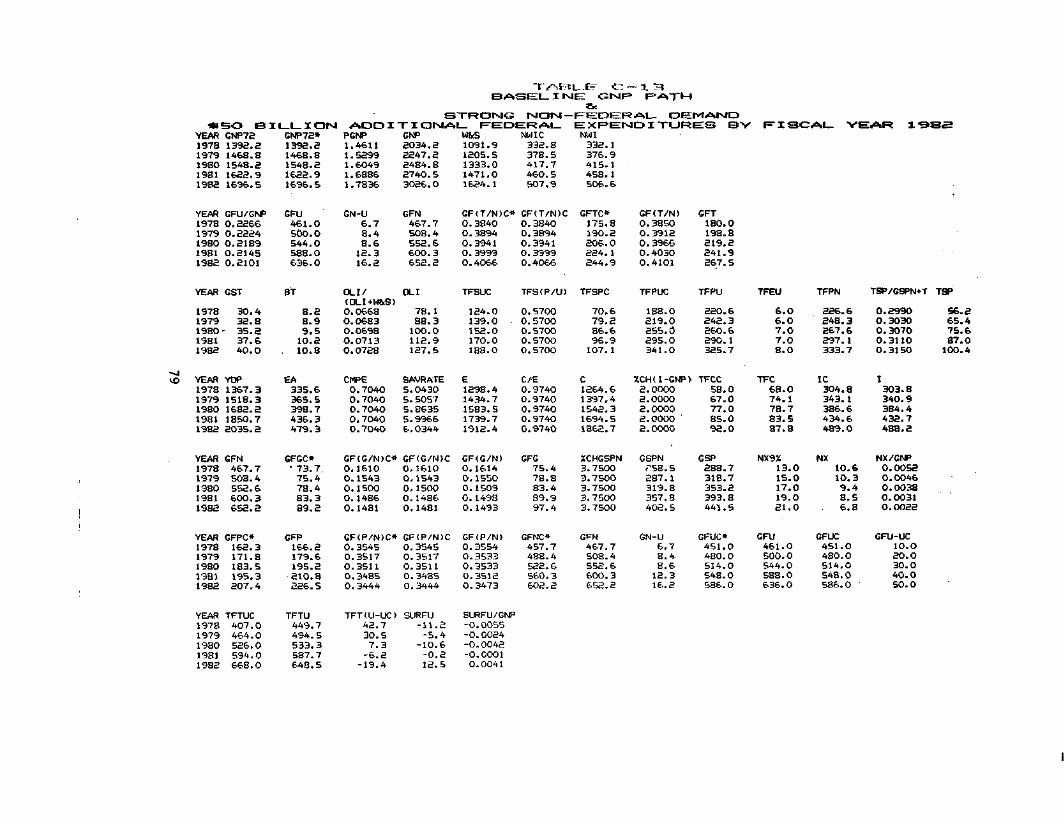
BASEL-irvIE GNF"1 31
IMCirJ— FEDERAL- DEMAND
\£>
*5O BIL-L-ION ADDITIONAL- FEDERAL-YEAR GNP72 GNP72* PGNP GNP W&S NWIC1978 1392.2 1392.2 1.4611 2O34.2 1091.9 332.81979 1468.8 1468.8 1.5299 2247.2 1205.5 378.5198O 1548. 2 1548.2 1.6O49 2484.8 1333.0 417.71981 1622.9 1622.9 1.6886 274O. 5 1471.0 46O. 51982 1696.5 1696.5 1.7836 3O26.0 1624.1 507.9
YEAR GFU/GNP GFU GN-U GFN GF<T/N>C* GF(T/N)C1978 0.2266 461. O 6.7 467.7 O. 3840 0. 384O1979 0.2224 5OO.O 8.4 508.4 O. 3894 0.3894198O O.2189 544.0 8.6 552.6 O. 3941 0.39411981 O.214S 588. 0 12.3 6OO. 3 0.3999 0.39991982 0.2101
YEAR GST
1978 30.41979 32.8198O- 35.21981 37.61982 4O.O
YEAR YDP1978 1367.31979 1518.3198O 1682.21981 1850.71982 2035.2
YEAR GFN1978 467.71979 508.41980 552.61981 600.31982 652.2
YEAR GFPC*1978 162.31979 171.81980 183.51981 195.31982 207.4
YEAR TFTUC1978 407.01979 464. O1980 526.01981 594.01982 668.0
636.0
BT
8.28.99.510.2
. 10.8
EA335.6365.5398.7436.3479.3
GFGC*• 73.7.75.478.483.389.2
GFP166.2179.6195.2210.8226.5
TFTU449. 7494.5533.3587.7648. 5
16.2
OLI/(OLI+W&S)0. O6680. 0683O. O6980.07130.0728
CMPE0.7O400. 7040O. 704O0. 70400. 7O4O
GF(G/N)C*0.1610O. 15430.15000. 14860.1481
GF(P/N)C*O.35450.3517O. 3511O. 34850. 3444
TFT(U-UC)42.730.57.3-6.2-19.4
652.2
OLI
78.188.310O.O112.9127.5
SAVRATE5. 04305. 50575. 86355.99666. 0344
GF(G/N)C0.16100. 15430.15000. 14860. 1481
GF(P/N)C0. 35450.3517O.35110. 34850. 3444
SURFU-11.2-5.4-10.6-0.212.5
0.4066
TFSUC
124.0139.0152.O170.0188.0
E1298.41434.71583.51739.71912.4
GFCG/N)0. 16140.1 55O0. 15090. 1498O. 1493
GF(P/N)0. 35540.35330.35330.35120. 3473
SURFU/GNP-0.0055-0.0024-0.0042-O.OO01O.0041
0. 4O66
TFS(P/U)
0. 57000. 57000.57000. 57OO0. 57OO
C/E0. 974O0.974O0.97400. 97400.9740
GFG75.478.883.489.997.4
GFNC*457.7488.4522. 6560. 3602.2
EXPENDITURES BY FISCAL- YEAR 1 "9SSNWI332.1376.9415.1458.1506. 6
GFTC* GF(T/N) GFT175.8 0.3850 18O.O190.2 O.3912 198.8206.0 0.3966 219.2224.1 O.403O 241.9244.9
TFSPC
70.679.286.696,91O7.1
C1264.61397.41542.31694.51862.7
%CHGSPN3.75003.75003. 75003. 75003.7500
GFN467. 7508.4552.66O0.3652.2
O.4101
TFPUC
188.0219.0255. (3295.0341. 0
XCH(I-GNP)2.00002.00002.00002.00OO2.0000
GSPNr~?58. 5
287.1319.8357.8402.5
GN-U6.78.48.612.316.2
267.5
TFPU
220.6242.3260.629O. 1325.7
TFCC58.067. 077.085.092.0
GSP288.7318.7353.2393.8441.5
GFUC*451.0480.0514.0548. 0586. 0
TFEU
6.06.07.07.08.O
TFC68.074.178.783.587.8
NX9X13.015.017.019.021.0
GFU461.0500.0544.0588.0636.0
TFPN
226.6248.3267.6297.1333.7
1C304.8343.1386.6434.6489.0
NX10.61O. 39.48.56.8
GFUC451.048O.O514.0548.0586.0 '
TSP/GSPN+T
0.29900.303O0. 30700.3110O.315O
I303.8340.9384.4432.7488.2
NX /GNP0.00520. 00460.0038O.O031O. 0022
GFU-UC10. 02O. O3O.O4O.O50.0
TSP
56.265.475.687.0ICO. 4

— a >v
MODERAT MOIM — FEEDER At— DEMAMD•seso B]
YEAR GNP721978 1392.21979 1468.81980 1548.21981 1622.91982 1696.5
YEAR GFU/GNP1978 0.22661979 0.22241980 0.21891981 O.21451982 O.21O1
YEAR GST
1978 30.41979 32.81980 35.21981 37.61982 40.0
000 YEAR YDP
1978 1394.31979 1555.01980 1730.81981 1913.21982 2114.7
YEAR GFN1978 467.71979 508.41980 552.61981 600. 31982 652.2
YEAR GFPC*1978 162. 31979 171.81980 183.51981 195.31982 207.4
YEAR TFTUC1978 407.01979 464.01980 526.01981 594.01982 668.0
i i_i_ i orGNP72*1392.21468.81548.21622.91696.5
GFU461. 0500.0544. 0588. 0636.0
BT
8.28.99.5
1O.210.8
EA335.6365.5398.7436. 3479.3
GFGC*73.775.478.483.389.2
GFP166.2179.6195.2210.8226.5
TFTU415.7450.2476.9517.6561.7
«4 ADD I T I CSTslAL- FEEDER AL_PGNP GNP W&S NWIC1.4611 2O34.2 1O91.9 332.81.5299 2247.2 1205.5 378.51.6049 2484.8 1333.0 417.71.6886 2740.5 1471.0 460.51.7836 3026.0 1624.1 507.9
GN-U GFN GF(T/N)C* GF<T/N)C6.7 467.7 0.3840 0. 384O8.4 508.4 0.3894 0.38948.6 552.6 0.3941 O. 3941
12.3 6OO.3 0.3999 0.399916.2
OLI/<OLI+W&S>0. 06680. 06830. 0698O.07130. 0728
CMPEO.697O0. 69700. 69700.6970O.6970
GF(G/N)C*O. 161OO. 15430.15000. 14860.1481
GF<P/N)C*0. 3545O.3517O.3511O. 34850. 3444
TFT(U-UC)8.7
-13.7-49.0-76.3
-1O6.2
652.2
OLI
78. 188.3
10O.O112.9127.5
SAVRATE6. 22526. 79337.26747.51897.6818
GF(G/N)C0. 16100. 1543O. 15000. 1486O. 1481
GF(P/N)CO. 35450.35170.35110. 34850.3444
SURFU-45.2-49.7-67.0-70.3-74.2
0.4066
TFSUC
124.0139.0152.0170.0188.0
E1307.51449.41605. O1769. 31952.2
GFCG/N)O. 16140. 15500.15090. 14980. 1493
GF(P/N)0.3554O.35330.35330.35120.3473
SURFU/GNP-O.0222-O.0221-0.0269-O.O256-O.O24S
0.4066
TFS(P/U)
O. 57OO0.57000.57OO0. 57000. 57OO
C/E0.974O0.9740O.9740O.97400.9740
GFG75.478.883.489.997.4
GFNC*457.7488.4522.656O. 3602.2
EXF'-ErNWI
332.6378.4418.4463.0513. 1
GFTC*175.8190.2206.0224. 1244.9
TFSPC
7O.679.286.696.9
1.07. 1
C1273.51411.71563.31723.31901.5
XCHGSPN3.00003.00003. OOOO3. OOOO3. OOOO
GFN467.7508.4552.660O.3652.2
<4DI TLJRI
GF(T/N)0. 38500.39120. 39660.40300.41O1
TFPUC
188.0219.0255.0295.0341.0
XCH(I-GNP)1 . OOOO1 . OOOO1 . OOOO1 . OOOO1 . OOOO
GSPN256.6283.0312.9347.5388.2
GN-U6.78.48.6
12.316.2
ECS B>
GFT180.0198.8219.2241.9267.5
TFPU
194.7208.4217.3235.7257.3
TFCC58.067.077.085.092.0
GSP286.8314.6346. 3383.5427.2
GFUC»451.048O.O514.0548. O586. O
f F^ISC
TFEU
6.O6.07.07.08.0
TFC60.063.765.667.969.4
NX9%8.09.0
1O.O11. 012.0
GFU461. 0500. 0544. 0588.0636.0
:AI_ YE
TFPN
200.7214.4224.3242.7265.3
1C302.0336.8375.9418.6466.6
NX5.64.32.40.5
-2. 1
GFUC451. 0480.0514. 0548.0586.0
EAR 1-9
TBP/GSPN+T
O.299O0.30300.3070O.311O0.3150
I301.8336.8377.3422.1472.8
NX/GNP0. 0027O.O0190.0009O.OO01
-O.OO07
GFU-UC10.020.030. 040. 05O.O
TSP
55.664.173.583.895.9

; — n.BASEL I ME
00
WEAK txlOINI — FEEDER AL_ DEMAMD•*so BILLION ADDiTiarJAL F^EDERAL EXF^EIXIDITLJRES BY AR
YEAR GNP721978 1392.21979 1468.81980 1548.21981 1622.91982 1696.5
YEAR GFU/GNP1978 0.22661979 0.22241980 0.21891981 0.21451982 0.3101
YEAR GST
1978 30.41979 32.8198O 35.21981 37.61982 4O.O
YEAR YDP1978 1421.81979 1592.21980 1779.91981 1975.91982 2193.'9
YEAR GFN1978 467.71979 508.41980 552.61981 600.31982 652.2
YEAR GFPC*1978 162. 31979 171.81980 183.51981 195.31982 207.4
YEAR TFTUC1978 4O7.01979 464.01980 526.01981 594.01982 668.0
GNP72*1392.21468.81548.21622.91696. 5
GFU461.0500.0544. 0588.0636.0
BT
8.28.99.510.210.8
EA335.6365.5398.7436.3479.3
GFGC»73.775.478.483.389.2
GFP166.2179.6195.2210.8226.5
TFTU381. 1405.2420.0447.3475. 1
PGNP1.46111 . 52991 . 60491 . 68861 . 7836
GN-U6.78.48.612.316.2
OLI/(OLH-W&S)0. 06680.0683O.O698O.O713O. 0728
CMPEO.69000.69OO0.69000.69000.6900
GF(G/N)C*0. 1610O. 15430. 150O0. I4860.1481
GF(P/N)C*0.35450.35170.35110. 3485O. 3444
TFT(U-UC)-25.8-58.7-105.9-146.6-192.8
GNP2034.22247.22484.82740.53O26.0
GFN467.7508.4552.6600.3652.2
OLI
78.188.310O.O112.9127.5
SAVRATE7. 39788.O6228.63938.99219.2583
GF(G/N)C0.161OO.15430. 15000. 14860.1481
GF(P/N)CO.3545O.3517O.35110.34850. 3444
SURFU-79.8-94.7-123.9-140.6-16O.8
was1091.91205.51333. O1471.01624. 1
GF(T/N)C*0. 38400.3894O.39410. 39990.4066
TFSUC
124.0139.0152.0170. 0188.0
E1316.61463.91626. 11798.21990.7
GF(G/N)0. 16140. 15500. 15O90. 14980. 1493
GF<P/N)0. 3554O.35330.35330.3512O. 3473
SURFU/GNP-O.O392-O.O421-0.0499-0.0513-0.0531
NWIC332.8378.5417.7460. 55O7.9
GF(T/N)CO. 38400.38940.39410. 39990.4O66
TFS(P/U)
0. 57OO0.57000.57000.57000. 5700
C/E0.97400.974O0.97400.97400.9740
GFG75.478.883.489.997.4
GFNC*457.7488.4522.6560. 3602.2
NWI333. 1379.9421.6468.0519.7
GFTC»175.8190.2206.0224. 1244.9
TFSPC
70.679.286.696.9107. 1
C1282.41425.81583.81751.51939. O
XCHGSPN2.25OO2.25OO2.25002.25002.2500
GFN467.7503. 4552.6600.3652.2
GF(T/N)0.3850O.39120. 39660.40300.4101
TFPUC
188.0219. 0255. 0295.0341.0
ZCH(I-GNP)O. OOOOO.OOOOO.OOOO0.00000. 0000
GBPN254.8278.9306.2337.5374.3
GN-U6.78.48.612.316.2
GFT180.0198.8219.2241.9267. 5
TFPU
168.2174.0173.5181. 1189.1
TFCC58.067. 077.085.092.0
GSP285.0310.4339. 5373.5413.2
GFLJC*451.0480.0514.0548.0586. O
TFEU
6.06.07.07.O8.0
TFC51.953.252.452.151. 0
NX9Z3.03.O3.03.03.0
GFU461. 05OO.O544. 0588.0636.0
TFPN
174.2180.0180.5188.1197. 1
1C299.233O.5365.4403.1445.0
NX0.6-1.6-4.5-7.4
-11.1
GFUC451. 0480.0514. 0548.0586. 0
TSP/GSPN+T
0.29900. 303O0. 30700.31100.3150
I299.8332.8370.6412.0458.2
NX/GNP0.0003-O.OO07-0.0018-0.0027-O.O036
. GFU-UC10.020.030.04O.O50.0
TSP
55. O65.971.4SO. 791.5

I1-
H-j]_2tj
01
QQJ
0
H
^
[010uJ
(HH
£
UJ
J
(1)H
1L
DffiZ<OJEHJiiio:DDhJH
<Qo:zbJlilDO.
lllllIZJ
zo:yj
(JQ
Oil
HJUK
0H
hH
Z0
uO in m i-i h-<-• ru rn a) ru
I-H rn h- o m r^3 m m -J- <f-£
m oo r-t m coo ru -t co rn T-I•-rn r- o <r co3 (TI rn *4~ <f -if~z-'
co co ru cn ru
S CO m uj *-*co cn o m
•3 o -H ru <r in3
ru U) o <t oen *H uj Is- oo
p. ru »H o ** -fz o ru -i- uj cou ru ru ru ru ru
-•CO ru UJ ru^ co cn ru o
CL uj ru cn r- inz -t in in UJ r-
* nj co ru cn inH £ ru cd co ru ujJiS^Sff lSJH
0}
0
U--'-"-' -
oa u) in uj rur- CO UJ <• •«• N
Ul""""""11 or co cn o " ruv < r- r- co oo co
•* u) •* r- co
t oo o ru in r-'i ru ru ru ru
z oo ru o cn w\ in ui u? mh— co cn o »~| ru»^ m m -^ ^ •a'u do odd
co ru o--i eno in d us •* -tt r- cn o ru -t
-i -i ru ru ruo
oz cn • in cn ru
T-I o- -^ m\- CO cn o -« nj- mm * <f -ru_ .....o o o o o o#o
u)~Z. O -4" *v *}• cn -^I- W CO cn cn O— • m m m m -^u d d d dd
r- •* UJ m rur- « r- -a- rn
z uj in o inu. -it in in uj uJ
N -t uj m ruD uj oo oaruujI tH rH
Z
oo ooo»-i m cn ru r~
D UJO -I cnmu_ **• in in in uj
CLz -< <f -i ru uJo r- h- co uj mx ru ru ru ru ruD ru ru rururuo d d oddcc CO cn o -i ru< r- r- co co co
IH•»•
I
I
iD0-U_
a
i-
85M-
-S(P
/U>
1
H
II1-
1— 1
d
.!-CD
&>I
ru-t men CO
inmt- wen
Q Q O O O
cn O O <•* **••ru m m rn mddddd
01 in cn u) inouius oo inm r- *H in oruru m m •»•
oooo oUJ UJ r- f~ co
m 1/1 cn uj in
ru UJ o in cnru ru rn ro m
oo UJTTI in uJ
ixiSlJf *
ujnj r- in cno oo -T m -Hr-r-co cn o
88888r-r- r- r- r-in in in in ino o o o o
oru r- ~<co•tt-ca-tmrum <r uj t-
o^o orucor- N ca or- oo cn o ru
3 co m co m co+ ujco cn .H ru*-t uJ uJ uJ r- f-doo o o o~ooo oo
rucn in nj COco co cn o o
<rcoru u) o
m m m m -3"
cocno ->rur- r- co co co
cn Ul -^ UJ ruru -t cn r- -Ho m UJ o inm rn m *a"
IH
^ oo uJ m uJ•f r^ •* in oo m h- T-* uj
u m m m «a°
co m N ru m
o UJ r- CO en oH
m ru en in uJo r- m o r- ruo in uJ N h- cou.H
§00000
^ o o o o oo a] ru ru rxi ru
ru m -i- in r-
o oo o o-* -t -t <r <-f*. r>- 1 | r^-
tij fl*i fT* ffi (Ti rp
u o o o oo
-• TH o m o<r m uj w rucn o -i m f-ru <r in uJ r-
Uli- ru ru ru OJ r-ce m co ^H in ru> cn r- in ru oen -T * < -t •*
ooo o oo o o o o
uj P" r— r*- r— r—E O O O O OO
UJ ru m ru min in r- ru om UJ cn m r-
< 01 m rn <fUl
ruuj uj -t -t*-* n r^- »-* 1,0
CL uJ f- 03 ^H <fQ m < m r- co
tc co tn o -* ru•c h- r^ oo co COijj g*i t$\ <yi <T< <T<
a, in in tZo 01 o oo oX O O O O O
ooo enrt ru
o ooo om in r~ en TH ^H »-i ru
cnXz
r^ m m m r1-co co ** oo ena. co i in co ruto ru m m m -a~
in co *-i co mz oo uj co ru a. in co in cr.co r ru m m rn
a. o o o o oen o o o o o0 in in in in in1 r- r- r~ r~ t-u • • • • •t< m m rn rn m
m a> co r- min co i
o r- r~ iu_!ta inco en
z >-i r- to r- enx •-< m co ai inu us in -t -t <r
oo oo o o
uz oo uJ r- r-^ o m r- in 4-o UJ in <t -t -t
u o o oo o
z o m o vc -HT o ca mi in -i- -T
x -H -t o ca mo u) in r
oooo o o
l •* * mruo m m co menu r- r-1- co en
r- -* id m rur- «H f~ -4" m
z <& in o inLL <t in in u> IDua; CO en o •-• ru< f- t" CO CO COUJ en ft* 0 ffi ffi
3 o oi -i ru m sr mu.u
ooo oocj m cn ru r^D in oo -i in cou. * •* in in ino
o o o o o.H m en ru r-
rnco * cnmli_ <j- in in in u}
) -H O -t CO UJi in co -< •<• co. -4- -t in in m
-t uj m ruj co co ru uj
zo
H inu. -4"
ruru" in i
i mo r- -t eno_ in in -3- <f m
— m m m m mLL • • • • •o o o o o o
a. in -t ^•'•J' mv m rn m m m(jo d d do
*oz m r~ ~ in •*v <r vn -i oa <ra. in in in ^ <••** m m m m muddddd
o ru en (T> ID10 en m r~ *-*
o_ ip r* en o ruu_ IH ** *« ru ruu
m co in m <tj ru -H m ui r~a. ui t^ co en ou. rf .H . rt ruucc. CO cn o ^ru< r- N co oo coin tr\ m fT^ tr\ (Tt
O m en i£ i£i ox m en ixi ^ -HD o o - ru mu. o o o o o3 d d d d d
co o o in mn uj nj d -t cou. i ru -a- ifi cocc
D o -i cn oo r-D en -i m -i — -t r- co en o
^ o o m mID «$• in ct- in ru cu. -4" in i
ut> inin ru
~i cn -i r- UJ) in m in rf d
cc ca cn o <-« ru< t - -
82

LESS"I'/-,
VIGOROUS
NON—FEDERAL. DEMAND•stiSO BIl_l_ION ADDITIONAL. FEDERAL. EXPENDITURES BY YEAR 1-9SS
YEAR GNP721978 1388.81979 1446.6198O 1504.51981 1564.61982 1627.2
YEAR GFU/GNP1978 O.22711979 0.22741980 0.22811981 0.22621982 0.2236
YEAR GST
1978 30.41979 32.81980 35.21981 37.61982 4O.O
00U) YEAR YDP
1978 1388.11979 15O9.8198O 1635.11981 1771.81982 1922.2
YEAR GFN1978 467.71979 511.41980 557.61381 604.31982 653.2
YEAR GFPC*1978 162.31979 171.81980 183. 51981 19S.319S2 207.4
YEAR TFTUC1978 405.11973 453.91980 505.11981 561.71982 620.6
GNP72*1392.21468.81548.21622.91696.5
GFU461.0503.0549.0592.0637. 0
BT
8.28.99.51O.210.8
EA335.6365.2397.3432.2470.3
GFGC*73.775.478.483.389.2
GFP166.0173.2193.3207.3221.6
TFTU420.2481.7534.. 4589.3642.3
PGNP1.46111 . 52881 . 59921 . 67261 . 75O2
GN-U6.78.48.612.316.2
DLI/(OLI+W&S)0. 06680.06830. 0638O.O7130. 0728
CMPE0.69700.69700. 6970
' 0.69700.6970
GF(G/N)C*0.1610O. 15430.15000. 14860.1481
GF(P/N)C*0. 3545O. 35170.3511O. 3485O. 3444
TFT(U-UC)15. 127.829.327.622.3
GNP2029.22211.62406. 02617. 12848. O
GFN467.7511.4557.6604.3653. 2
OLI
78.087. 197.01O8.012O.2
SAVRATE6.11676.09795.97765.87595. 7996
GF(G/N)CO. 16080. 15310. 14760.14570. 1447
GF(P/N)C0.35410.3488O. 34560.34160. 3365
SURFU-40.7-21.2-14.5-2.65.9
WSS1089.81188.833.21406.91531.2
GF(T/N)C*O. 38400. 38940.39410. 33990. 4O66
TFSUC
124. 0137.2148.7164. 1178.8
E1303.21417.81537.31667.71810.7
GF(G/N)0.16110. 15370. 14860. 1467O.1459
GFtP/N)0.35490.35O4O. 34780.3441O.3333
SURFU /GNP-0.0200-0.0096-0.006O-O.O010O.OO2O
NWIC332.3374.84O8. 1443.3481.8
GF(T/N)C0.38430.33440.40350.41130.4202
TFS(P/U)
O.57000. 57000. 57000. 57000. 57OO
C/EO.374OO.374O0.97400.97400.374O
GFG75.378.682.888.795.3
GFNC«457.7488.4522.6560. 3602.2
NWI332.0374.0406.444O.8478.8
GFTC*175.819O.2206.0224.1244.9
TFSPC
70.678.284.793.5101.9
C1263. 3138O.91497.31624. 31763.7
XCHGSPN3. OOOO3.00003.00003. OOOO3. OOOO
GFN467.7511.4557.66O4. 3653.2
GF(T/N)0. 38580. 39620.4060O.41490.4238
TFPUC
186.8214.6244.9277.5314.6
ZCH(I-GNP)1 . OOOO1 . OOOO1 . OOOO1 . OOOO1 . OOOO
GSPN256.6282.7311.3342.7377.6
GN-U6.78.48.612.316.2
GFTISO. 42O2.6226.4250.7276.8
TFPU
138.4236. 0267.6299.1332.3
TFCC57.363.27O.977.582.6
GSP286.8314.2344.4378.2415.7
GFUC*451. 048O.O514. O548.0586. O
TFEU
6.06.07.07.08.O
TFC6O.869.577.483.587.2
NX9%8.09.010.011.012.0
GFU461.0503. 0549. O592.0637. 0
TFPN
2O4.4242. 0274.6306.1340.3
1C3O1.3331.5364. 1399.9439.3
NX6.06.87.99.110.3
GFUC451.0483.0519.0552.0587. 0
TSP/GSPN+T
0.299O0.3O30O. 3070O. 31 1O0.3150
I3O0.9330.3362.1397.3436.5
NX/GNP0.00290. O03O0.0033O.OO350.0036
GFU-UC10.020. 03O.O40.050.0
TSP
55.664.173.282.893.4

F="ATM
WEAK NON — FEDERAL.BII_L_ION ADDITIONAL- FEDERAL- EXPENDITURES BY FISCAL- YEAR
YEAR GNP721978 1388.81973 1446.61980 15O4.51981 1B64.6 •1982 1627. a
YEAR GFU/GNP1978 0.22711979 0.33741980 0.22811981 O.22621988 0.2236
YEAR GST
1978 30.41979 32.31980 35.21981 37.61982 40.0
OO.p. YEAR YDP
1978 1415.61979 1546.61980 1683.01981 1832.31982 1997.8
YEAR GFN1978 467.71979 511.41980 557.61981 604. 31982 653. 5
YEAR GFPC*1978 162. 31979 171.8198O 183.51981 195.31982 2O7.4
YEAR TFTUC1978 4O5. 11979 453.91980 505. 11981 561.71983 620.6
GNP72»1392. a1468.81548. a1622.91696. 5
GFU461.0503. 0549. 0592.0637.0
BT
8.S8.99.510.210.8
EA335.6365. a397.3432. a47O.3
GFGC»73.775.478.483.389. a
GFP166.0179. a193.9207.9aai.6
TFTU385.7437.6479.4521.8560.8
PGNP1.46111 . 53881 . 59921 . 67261 . 7502
GN-U6.78.48.612.316.2
OLI/(OLI+W&S)0.06680.06830.06980.07130.0728
CMPE0.69OOO. 69OO0.69000.69000.6900
GF(G/N)C*O. 1610O. 15430.15000. 14860. 1481
GF(P/N)C*0. 35450.35170.35110.34850.3444
TFT(U-UC)-19.3-16.2-as. 6-39.8-59.7
GNP2O29.a2211.63406.02617. 12848. O
GFN467.7511.4557.6604.3653.2
OLI
78. 087. 197.0108.0iao.2
SAVRATE7.29267. 39267.4O777.43497.4884
GF<G/N)C0. 16080. 15310. 14760. 14570.1447
GF(P/N)C0.35410. 34880.34560.34160. 3365
SURFU-75.2-65. 3-69. 5V7O. 1-76. 1
W&S1089.81188.81293. a1406.91531.2
GF(T/N)C*O. 38400. 3894O. 39410.39990.4O66
TFSUC
124.0137.2148.7164.1178.8
E1312.31432.31558.31696.11848. a
GF(G/N)0. 16110.15370. 14860. 14670. 1459
GF<P/N>0. 35490. 35O40.3478O.34410.3393
SURFU/GNP-O.O370-o.oa95-O.0289-0.0267-0.0267
NWIC332.3374.8408. 1443.3481.8
GF(T/N)C0. 38490. 39440.40350.4119o.4aoa
TFS(PXU)
0. 57000. 57000. 570O0. 57000.57OO
C/EO.974O0.974O0.97400.97400.9740
GFG75.378.682.888.795.3
GFNC*457.7488.4522.656O. 36O2. 2
NWI332.5375.5409.5445.5485. 1
GFTC*175.8190. aao6.o224. 1244.9
TFSPC
70.678. a84.793.5101.9
C1378.21395.01517.81653.0180O. 1
ZCHGSPN3.25003.25002, 2500a. 2 5003.35OO
GFN467.7511.4557.6604.3653.2
GF(T/N)0. 3858O. 39620.40600.41490.4238
TFPUC
186.8214.6244.9377.5314.6
ZCH(I-GNP)O.OOOOO.OOOOO.OOOOO.OOOOO.OOOO
GSPN254.8278.6304.5332.9364.0
GN-U6.78.48.612.316. 3
GFT180.4202.6226.425O.7276.8
TFPU
171.9202.0224.9246.3267.2
TFCC57.363.270.977.582.6
GSP384.9310.1337.7368.4403.2
GFUC»451.0480.0514.0548. O586. O
TFEU
6.O6.O7.07.0B.O
TFC53.759.565.168.870.1
NX9%3.03.03.O3.03.0
GFU461.0503. 0549.0592.0637.0
TFPN
177.92O8.0231.9353.3275.2
1C398.4325.3353.9384.9418.9
NX1.00.80.91.11.3
GFUC451. 0483. 0519. 0552.0587.0
TSP/GSPN+T
0.29900. 3O3O0.30700.3110O. 315O
I298.9326.3355.4387.5422.6
NX/GNPO.OO040.0003O.OO040.0004O.OOO4
GFU-UC10.020.03O.O40. 05O.O
TSP
55.1ea.971.179.789.1

BASELINEc; --
C3PJF"n -;•:>PATH
•S61OO S3YEAR GNP721978 1392.21979 1468.81980 1548.21981 1622.91982 1696.5
YEAR GFU/GNP1978 0.23151979 O.2313198O O.23101981 0.22911982 0.2267
YEAR GST
1978 3O.41979 32.8198O 35.21981 37.61982 4O.O
00Oi YEAR YDP
1978 1361.01979 15O6..4198O 1664.81981 1823.41982 20O8.2
YEAR GFN1978 477.71979 52S.41980 582.61981 64O.31982 702.2
YEAR GFPC*1978 162.31979 171.81980 183.51981 195.31982 207.4
YEAR TFTUC1978 407.01979 464.01980 526.01981 594.01982 668. O
CLLIO^GNP72*1392.21468.81548.21622.91696. 5
GFU471.052O.O574. 0628.0686. 0
BT
8.28.99.5
10.2. 10.8
EA335.6365.5398.7436.3479.3
GFGC*• 73.7
75.478.483.389.2
GFP17O. 1187.52O7.0226.3245.7
TFTU464.2522.3573.3638.7710. 1
4 ADD I "T I OrJ AL_ FEEDER ALPGNP GNP W&S NWIC1.4611 2034.2 1091.9 332.81.5299 2247.2 1205.5 378.51.6O49 2484.8 1333. O 417.71.6886 2740.5 1471.0 460.5 •1.7836 3O26.0 1624.1 507.9
GN-U GFN GF(T/N)C* GF<T/N)C6.7 477.7 O.3840 0.38408.4 528.4 0.3894 0.38948.6 582.6 0.3941 0.3941
12.3 640.3 0.3999 O. 399916.2
OLI/(OLI+W&S)O.O6680. 0683O.O6980.0713O. 0728
CMPE0.704O0.7O400.704O0.704O0.704O
GF(G/N)C*0.16100.15430. 150O0. 14860. 1481
GF(P/N)C*0.35450.35170.3511O. 34850. 3444
TFT(U-UC)57.258.347.344.742. 1
702.2
OLI
78. 188.3
10O.O112.9127.5
SAVRATE4.92555. 30385. 59465.67495.6728
GF<G/N)C0.161O0. 15430. 15000. 14860.1481
GF(P/N)CO. 35450.3517O.35110. 3485O. 3444
SURFU-6.72.3
-0.610.724.1
0.4O66
TFSUC
124. 0139.0152.0170.0188.0
E1294.01426.51571.71724.71894.2
GF(G/N)O. 16170.15570.15180. 15070. 1504
GF(P/N)O. 35620.35480.3553O.35350.3499
SURFU/GNP-O.OO33
O.OO10-O.O002
O.OO39O.0079
0.4066
TFS(P/U)
O. 570O0.570O0. 57000. 570O :0.5700 .I
C/E0.97400.97400. 974OO.974OO.974O
GFG77.282.288.496.5
105.6
GFNC*457.7488.4522.6560. 3602.2
EXF*ErJDI-T-LJRES BY FISCAL YEAR 1 "3NWI
331.9376. 1413.3455.05O2. 1
GFTC« GF(T/N) GFT175.8 0.3858 184.319O.2 O.3928 207.5206.0 0.3989 232.4224.1 0.4O56 259.7244.9
TFSPC
70.679.286.696.9
107.1
C1260.31389.41530.81679.81845. O
XCHGSPN3.75003.75OO3.75OO3.75003.75OO
GFN477.7528.4582.6640.3702.2
O.4131
TFPUC
188. 0219.0255.0295.0341.0
XCH(I-GNP)2.00002.00OO2.OOOO2.OOOO2.0000
GSPNrss. s287. 1319.8357.8402.5
GN-U6.78.48.6
12.316.2
290.1
TFPU
231.7263.6291.3329.7374.2
TFCC58.067. 077.085.092.0
GSP289.4320. 1355.2396.4444.8
GFUC»451.0480.0514. O548.0586.0
TFEU
6.06.07.07.O8.0
TFC71.580.687.995.0
100.9
NX9X13.015.017.019.021.0
GFU471.052O.O574.0628.0686.0
TFPN
237.7269.6298.3336.7382.2
1C304.8343. 1386.6434.6489.0
NX1O.610.39.48.56.8
GFUC451.0480. 0514.0548.0586.0
TSP/GSPN+T
0.2990O.303O0. 30700.311O0.3150
I303.5339.7382.1429.2483.5
NX/GNP0. 00520.00460.00380.00310.0022
GFU-UC20. 040.060.080.0
100.0
TSP
55.464.073.684.397.1

BASEL. I ME <3NF» PATH
MODIADD I T I ONAL
EIRATE MOM— FEDERAL DEMANDFEDERAL EXPENDITURES BY FISCAL. YEAR 1 "3SS
00
YEAR GNP721978 1392.31979 1468.81980 1548. a1981 1633.91983 1696.5
YEAR GFU/GNP1978 0.23151979 0.23131980 O.23101981 0.22911982 O.2267
YEAR GST
1978 30.41979 32.81980 35.21981 37.61982 40.0
YEAR YDP1978 1387.91979 1543.91980 1713.31981 1890.71983 2O87.4
YEAR GFN1978 477.71979 538.41980 582.61981 640.31983 702.2
YEAR GFPC*1978 162.31979 171.81980 183.51981 195.31982 207.4
YEAR TFTUC1978 407.01979 464.0198O 536. O1981 594. O1983 668.0
GNP72*1392.21468.81548.21622.91696.5
GFU471.0520. 0574.0638.0686. 0
BT
8.28.99.510.210.8
EA335.6365.5398.7436.3479.3
GFGC*73.775.478.483.389.2
GFP170.1187.5207.0336.3245.7
TFTU430.4478.1517- 1568.9623.5
PGNP1.46111 . 52991 . 60491 . 68861 . 7836
GN-U6.78.48.613.316.2
OLI/<QLI+W8cS>O.O6680.06830. 0698O.O7130.0728
CMPEO.697O0.69700.697O
' 0.69700.6970
GF<G/N)C*0. 161O0.1543O. 150OO. 14860. 1481
GF(P/N)C*0.35450.35170.35110. 34850. 3444
TFT(U-UC)23.414. 1-8.8-25.0-44.4
GNP2034.22247.22484.82740. 53026. O
GFN.477.7528.4583.664O. 37O2.3
OLI
78.188.31OO.O112.9127.5
SAVRATE6.11106.599O7.O1097.21497.3434
GF(G/N)CO. 1610O.I 5430.15000. 14860. 1481
GF(P/N)C0.3545O.35170.35110. 3485O. 3444
SURFU-4O.5-41.8-56.8-59.0-63.4
W&S1091.91205.51333.0.1471.01624. 1
GF(T/N)C*0. 38400. 38940.39410. 39990.4O66
TFSUC
124.0139.0152.O170.0188.0
E1303.11441. 11593.31754.31934.1
GF(G/N)0. 16170. 15570.15180. 1507O. 15O4
GFIP/N)0. 3563O. 3548O.35530.35350. 3499
SURFU/GNP-O.O199-0.0186-0.0228-0.0215-O.O206
NWIC333.8378.5417.7460.5507.9
GF(T/N)C0. 38400. 38940.3941O. 39990.4066
TFSCP/U)
0.57000.57000.57OO0.5700O.5700
C/EO.97400. 97400.97400.97400.9740
GFG77.282.288.496.51O5.6
GFNC»457.7488.4533.6560. 3602.2
NWI332.4377.6416.5459.9508.7
GFTC*175.8190.22O6.0324.1244.9
TFSPC
7O.679.286.696.9107. 1
C1269.21403.61551.71708.71883.8
%CHGSPN3. OOOO3.00003.00003. OOOO3. OOOO
GFN477.7538.4582.6640. 37O5.3
GF(T/N)0. 38580. 39280. 398S0.40560.4131
TFPUC
188.0319.0255.0295.0341.0
XCH(I-GNP)1 . OOOO1 . OOOO1 . OOOO1 . OOOO1 . OOOO
GSPN256.6283.0312.9347.5388. S
GN-U6.78.48.613.316.2
GFT184.3207.5333.4259.7290. 1
TFPU
205.8339.8348.2375.53O6.O
TFCC58.067. 077.085.093. 0
GSP387.5315.9348.3386.343O.5
GFUC*451.0480.0514. 0548.0586.0
TFEU
6.06.07.O7.08.0
TFC63.570.374.979.482.5
NX9%8.09.010.011.012. 0
GFU471. 0530.0574. 0638. 0686.0
TFPN
211.8235.8355.2383.5314. 0
1C303.0336. 8375.9418.6466. 6
NX5.64.32.40.5-2.1
GFUC451.0480.0514.0548.0586.0
TSP/GSPN+T
0.29900. 3O3O0.3070O.31100.3150
I301.4335.6375.1418.6468.0
NX/GNP0.00270.00190.0009O.OOO1-0.0007
GFU-UC20. 040.06O.O8O.O1OO.O
62.771.581.192.6

BASEL INE <3NF> PATH£*
WEAK NON—FEDERAL DEMAND•*• i oo B :YEAR GNP731978 1393.31979 1468.81980 1548. S1981 1633.9 .198a 1696.5
YEAR GFU/GNP1978 0.33151979 o.33i31980 0.33101981 0.3291i98a o.2a67
YEAR GST
1978 3O.41979 3a.81980 35. a1981 37.61983 40.0
00-J YEAR YDP
1978 1415.41979 1580.01980 176a.S1981 1953. a1983 ai66.3
YEAR GFN1978 477. 71979 538. 41980 583.61981 640. 31983 703.3
YEAR GFPC*1978 162. 31979 171.81980 183. 51981 195.31983 307.4
YEAR TFTUC1978 407. O1979 464. O1980 526.01981 594. O1983 668.0
t LL I orGNP72*I39a.a1468.81548. ai6aa.91696.5
GFU471. 052O.O574.0658.0686.0
BT
s. a8.99.510. a10.8
EA335.6365.5398.7436. 3479.3
GFGC»73.775.478.483.389. 3
GFP17O. 1187.5307.0aa&.3345.7
TFTU395.8433.346O.4498.8537. 3
J ADDITIONAL FEDERALPGNP GNP W&S NWIC1.4611 2O34.a 1O91.9 333.81.5399 a247.a 1305.5 378.51.6049 3484.8 1333.0 417.71.6886 3740.5 1471.0 460.51.7836 3026.0 1634.1 5O7.9
GN-U GFN GF(T/N)C* GF(T/N)C6.7 477.7 0.3840 0.38408.4 538.4 0.3894 0.38948.6 583.6 0.3941 0.394112.3 64O.3 0.3999 0.399916.2
OLI/(OLH-W8.S)0. 06680. 06830. 0698O.07130. 0738
CMPE0.69000. 69000. 69000.69OO0. 6900
GF(G/N)C*0. 161O0.15430.15000. 14860.1481
GF<P/N)C*0. 35450.35170.35110.34850. 3444
TFT(U-UC)-11.1-30.6-65.5-95.1-130.7
703.2
OLI
78.188.3
100.0112.9127.5
SAVRATE7.28697.875O8. 39448.70428.9406
GF(G/N)C0.161O0.15430.15000. 14860.1481
GF(P/N)C0.35450.35170.35110.3485O.3444
SURFU-75.1-86.6-113.5-139.1-148.7
0.4066
TFSUC
134.0139.0152.0170.0188.0
E1313.21455.61614.31783.31973.6
GF(G/N)O.1617O. 15570.15180. 15070. 1504
GF(P/N)O. 35630. 35480.35530.35350. 3499
SURFU/GNP-O.0369-0.0385-0.0457-O.O471-0.0491
0.4066
TFS<P/U)
O. 570O0. 57000. 57OO0. 5700O. 5700
C/E0.97400.974OO.974O0.97400. 9740
GFG77.383.288.496.51O5.6
GFNC*457.7488.4533.6560. 36O2.3
EXPENDITURES BY FISCAL YEAR 1 -SNWI333.9379.3419.8464.8515.3
GFTC* GF(T/N) GFT175.8 0.3858 184.319O.3 0.3938 307.5206.0 0.3989 333.4334.1 0.4056 259.7344.9
TFSPC
7O.679. a86.696.9
1O7. 1
C1278. 11417.8157a.31736.81921.3
XCHGSPN2.25OO2.2SOO2.2500a. 25003.2500
GFN477.7538.4583.6640. 3703.3
0.4131
TFPUC
188.0319.0ass.o395.0341.0
%CH(I-GNP)O.OOOO0.0000O.OOOOO.OOOO0.0000
GSPN354.8378.9306.3337.5374.3
GN-U6.78.48.612.316.2
390.1
TFPU
179.4195.5204.6331.1338. 0
TFCC58. 067.077.085.092.0
GBP385.7311.8341.5376.3416.5
GFUC*451.0480.0514.0548.0586. 0
TFEU
6.O6.07.07.08.0
TFC55.359.861.763.764. a
NX9X3.O3.03.03.03.0
GFU471.0530.0574.0638.0686.0
TFPN
185.4301.5211.6aas.i246.0
1Cagg.a330.5365.44O3. 1445.0
NX0.6
-1.6-4.5-7.4
-11.1
GFUC451.048O.O514.0548.0586. 0
TRP/GSPN+T
O.a99O0.3O3O0. 30700.31100.315O
I399.4331.6368.34OS.4453.4
NX/GNPO.O003-O. OO07-0.0018-0. 0037-0.0036
GFU-UCao.o40. 060. 080. 0100. 0
TSP
54.361.569.478.088. a
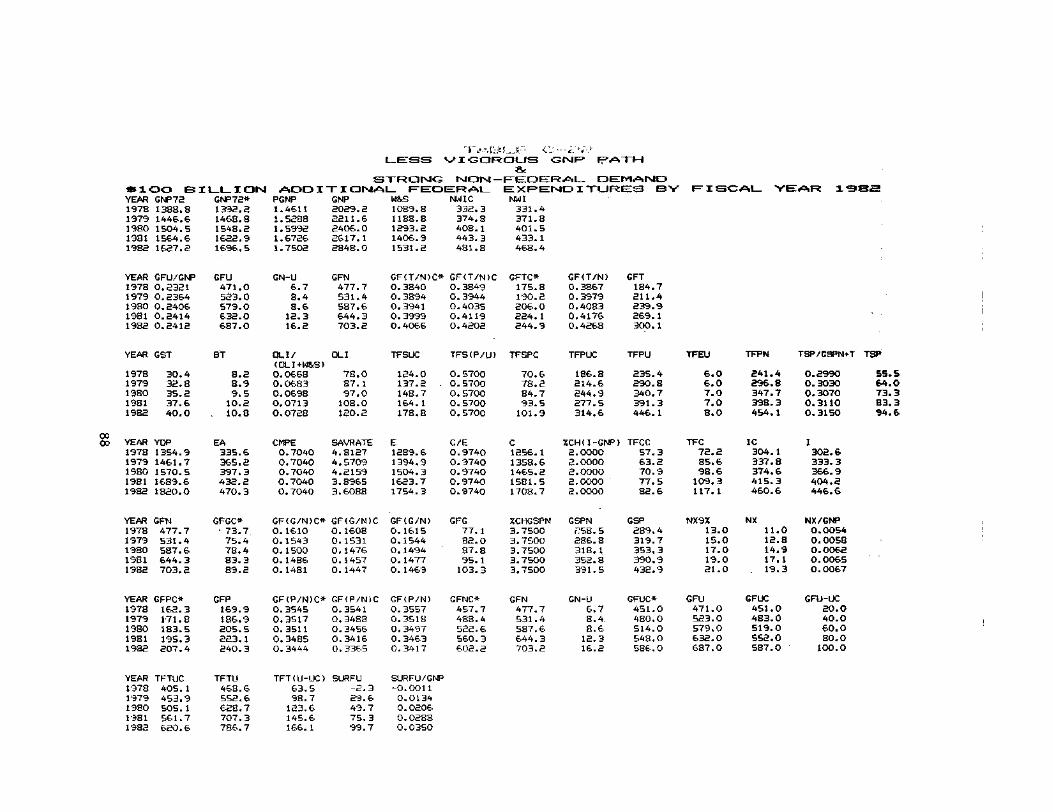
V I <3OROLJS&!
STRONG NON — FEEDER AL
GNP PATH
DEMANDBILLION ADDITIONAL FEDERAL EXPENDITURES BY YEAR
YEAR197S1379198019811983
YEAR1978197919SO19811982
YEAR
19781979198019811982
0000 YEAR
19781979198019811982
YEAR19781979198019811982
YEAR19781979198019811982
YEAR19781979198O19811982
GNP721388.81446.61504.51564.61627.2
GFU/GNP0.23210.23640.24060.24140.2412
GST
3O.432.835.237.640.0
YDP1354.91461.71570.51689.61820.0
GFN477.7531.4587.6644.37O3.2
GFPC»162. 3171.8183.5195.3207.4
TFTUC405. 1453.95O5. 1561.7620.6
GNP72*1392.21468.81548.21622.91696. 5
GFU471. 0523.0579. 0632. 0687.0
Bt
8.28.99.510.2
. 10.8
EA335.6365.2397.3432.2470.3
GFGC»• 73.775.478.483.389.2
GFP169.9186.9205. 5223.124O.3
TFTU468.6552.6628.77O7.3786.7
PGNP1.46111 . 52881 . 59921 . 67261 . 7502
GN-U6.78.48.612.316.2
OLI/(OLH-W&S)O. O6680.0683O. O698O.O7130.0728
CMPEO.70400.7O400.7O400.704O0.7040
GF(G/N)C*O.16100.1543O. 15OO0.1486O. 1481
GF(P/N)C*O.35450.35170.35110. 3485O. 3444
TFT(U-UC)63.598.7123.6145.6166. 1
GNP2029. 22211.62406. O2617.12848.0
GFN477.7531.4587.6644.3703.2
OLI
78.087.197.0108.0120.2
SAVRATE4.81274.57094.21593.89653.6O88
GF(G/N)C0. 16080.15310. 14760. 1457O.1447
GF<P/N)C0.35410.34880.3456O.34160.3365
SURFU-2.329.649.775.399.7
W8S1089.81188.81293.214O6.91531.2
GF(T/N)C*0.3840O. 38940.39410.3999O.4O66
TFSUC
124.0137.2 .148.7164. 1178.8
E1289.61394.915O4.31623.71754. 3
GF(G/N>0. 1615O. 1544O. 14940. 14770. 1469
GF<P/N)0.3557O.35180.34970.34630.3417
SURFU /GNP-O.O0110.0134O.O206O.O288O.O35O
NWIC332.3374.8408. 1443.3481.8
GF(T/N)C0.38490.3944O.40350.4119O.4202
TFS(P/U)
O. 5700O. 57OO0.57000. 570OO. 57OO
C/E0.97400.9740O.97400.974OO.974O
GFG77. 182. O87.895. 1103.3
GFNC*457.7488.4522.6560.3602.2
NWI331.4371.84O1.5433. 1468.4
GFTC*175.819O.22O6.O224. 1244.9
TFSPC
7O.678.284.793.5101.9
C1256. 11358.61465.21581.51708.7
%CHGSPN3.75003.75003. 75OO3.750O3.7500
GFN477.7531.4587.6644.37O3.2
GFCT/N)0. 38670. 39790.40830.417&O. 4268
TFPUC
186.8214.6244.9277.5314.6
ZCH(I-GNP)2. OOOO2.00002. OOOO2. OOOO2. OOOO
GSPNF758. 5286.8318.1352.8391.5
GN-U6.78.4.8.612.316.2
GFT184.7211.4239.9269.1300. 1
TFPU
235.4290.8340.7391.3446.1
TFCC57.363.270.977.582.6
GSP289.4319.7353.3390.9432.9
GFUC*451. 0480.0514.0548.0586. O
TFEU
6.O6.07.07.08.0
TFC72.285.698.6109.3117. 1
NX9%13. 015.017.019.021. 0
GFU471. 0523.0579.0632.0687. 0
TFPN
241.4236.8347.7398.3454.1
1C3O4.1337.8374.6415.346O.6
NX11.012.814.917.119.3
GFUC451.0483.0519. 0552.0587. 0
TSP/GSPN+T
O.299OO.3O3O0. 30700.3110O. 315O
I302.6333.3366.94O4.2446.6
NX/GNPO.OO540.0058O.0062O. 0065O. OO67
GFU-UC20.040. 060.080.0100.0
TSP
55.564.073.383.394.6

~r.- - M. .rF>ATM
MODERATE NON —FEDERALBILLION ADDITIONAL FEDERAL EXPENDITURES BY FISCAL YEAR
YEAR GNP731978 1388.81979 1446.61980 1504.51981 1564.61983 1627.3
YEAR GFU/GNP1978 0.33311979 0.33641980 0.34061981 0.34141983 0.3412
YEAR GST
1978 30.41979 33.81980 35.21981 37.61983 40. O
00VO YEAR YDP
1978 1381.71979 1497.81980 1617.81981 1749.71982 1895.6
YEAR GFN1978 477.71979 531.41980 587.61981 644.31983 703.3
YEAR GFPC*1978 163.31979 171.81930 183.51981 195.31982 2O7.4
YEAR TFTUC1978 405. 11979 453.9198O 505. 11981 561.71983 630.6
GNP73*1393.31468.81548.31632.91696. 5
GFU471.0533.0579.0632.0687. 0
BT
8.28.99.51O.210.8
EA335.6365.2397.3433.2470.3
GFGC*73.775.478.483.389.2
GFP169.9186.9205.5323.1340.3
TFTU434.8509.4574.3640. 3704.5
PGNP1.46111.52881 . 59921 . 67361 . 7502
GN-U6.78.48.613.316.3
OLI/(OLI+W&S)O. 06680.06830. O698O.O7130.0738
CMPEO.697OO. 69700.6970
' O.6970O. 6970
GF(G/N)C*0. 16100.15430. 15OOO. 14860. 1481
GF<P/N)C*0.35450.35170.35110.34850. 3444
TFT ( U-UC )39.755.569.373. 683.9
GNP3029.22211.634O6.03617. 12848.0
GFN477.7531.4587.6644. 3703.2
OLI
78.087.197. O1O8.0130.3
SAVRATE6.OO165.89385. 69655. 53385.41OO
GF(G/N)CO. 16O80.15310. 14760. 14570. 1447
GF<P/N>C0.35410.3488O. 34560.3416O. 3365
BURFU-36. 1-13.5-4.68.317.5
W&S1089.31188.81393.21406.91531.3
GF(T/N)C*0. 38400. 38940. 39410. 3999O.4066
TFSUC
134.0137.2148.7164.1178.8
E1398.81409. 51525.71652.91793. 1
GF(G/N)0. 16150. 15440. 14940. 1477O. 1469
GF<P/N>0.3557O.35180. 34970. 34630.3417
SURFU/GNP-0.0177-O.O061-O.O0190. 00330.0061
NWIC333.3374.8408. 1443.3481.8
GF<T/N)C0. 33490. 39440.40350.41190.4303
TFS(P/U)
0. 57OO0. 57000.57000. 57000. 5700
C/E0.974O0.974O0.97400. 97400.9740
GFG77.182.087.895.1103.3
GFNC*457.7488.4533.6560. 3603.2
NWI331.8373.3404.6437.7474.5
GFTC*175.8190.3206.0334. 1344.9
TFSPC
70.678.384.793.5101.9
C1365.01372.91486.01609.91746.4
XCHGSPN3.0OOO3.00OO3.00OO3.00003.0OOO
GFN477.7531.4587.6644.3703.3
GF(T/N>0. 38670. 39790.4083O.4176O. 4368
TFPUC
186.8214.6344.9277.5314.6
%CH(I-GNP)1 . OOOO1 . OOOO1 . OOOO1 . OOOO1 . OOOO
GSPN256.6282.7311.3342.7377.6
GN-U6.78.48.612.316.2
GFT184.7211.4239.9369.130O.1
TFPU
2O9.5357.5298.6339. 0381.1
TFCC57.363.27O.977.583.6
GSP387.5315.5346.4380.8418.9
GFUC*451.0480. 0514.0548.0586. 0
TFEU
6.06.07.07.08.0
TFC64.375.886.494.610O.O
NX9X8.O9.O10.011.013.0
GFU471.0523.0579.0632.0687.0
TFPN
215.5363.53O5.6346.0389.1
1C301.3331.5364. 1399.9439.3
NX6.06.87.99.11O.3
GFUC451.0483.0519.0553.0587.0
TSP/GSPN+T
0.29900.3O300. 307O0.31100.3150
I3OO.6339.3360.0393.9431.8
NX/GNP0.00290.0030O.OO330. 00350.0036
GFU-UC30.040.060.080. 0100.0
TSP
54.962.771.380.290.3

HI0)
-tin ««cnV « oi N uiurnDgO NOO
O O O O O
I
Q.
W*
to;i-n .
1
rH
IDtoIDJ
rt
o:jjutoH
IL
ffi
DZtl)•tillED:liJDQr-
HJQ
Q. ill m r- l- >t r-lll Q. nj •» N ru d
IL1 J m co r-* m co
nry t - im t^o^ca
Qi 111 oo oo ru en ru\ li en co m us ,-1M en oo co en o m
3 J3"""
Z ru us o -i oU Oi — US N COu D. ru *-< o ~» <r" z o ru «t us coL. u ru ru ru ru ru
H
Q -i oo ru us ruQ « - i co 01 ru o
a. us ru en r- ui<z -3- in in us r-
ZD* ruooru 01 inM r- ru 00 co ru us
JCJ -i -< -l -, rt
H
ID oo us in 10 ru
Ozrl lSSS0°"", Of o? ff* o *-* njJft Ul (T1 (T1 (T* CTi CTi
( <fr O^*H-<< *H iji rjl O
h- co -r* m i# oU. <-• ru ru ru m
H r- 71 m i£ co"x L0 h- CO N L£IH co en o IH nj•-• m rn «<• -3~ C3 O O O O O
co ru o T-I <FO U1 O UJ -3" H r*- m o nj -tLL ru nj ru
oz crt -t ui tn njH co o~i o ^ nj
u o o o oo
*u
K co oo en 01 o*-• m m m m -^o o o o o o
r- -* us m rur- •* t- -i- m
Z r- m co <• ou_ -t ui in us r~u
r- * us m ru3 ui co oo ru u)z """*
ooooori m m ru r-
3 r-ru r-mcnU- ^t in in u) u>o
Z -« < us -t ru<j ru ui o -i -«x m m «!• -^ -}•3 ru ru rururu
tr co 01 o -i ru^ r^ r*" co co coUJ en en 01 en en
g oooooJ^ (p rn r- • inXi nj IM n rnfe ooooo
rum o -t ruz en en m m ^>
a. &ru U) cnruu. « ru ru nj m
ooooo3 iDiD r- r- co
m in o -*• ru
o- en ru ui oo -<u. -i ru ru ru mt-
co ijs 01 in vo3 us -T <r r- <fo. en -H •«• r^ THU. rt ru ru ru m
u) ru N ui ena. oco < m «U3 r~ r» co 01 o
! 88888en in in ui ui inh- O O O O O
. oru r- -< co3 * r- co <t- ootn ru m -t u) f-H
o o oruco r- r- oo oM r- co en o ru
d
3 co m co m co+ ui oo en -i ru
x. t-t ui us us r- r-« J O O O OO
o-dd odd
ru en in ru coCO CO Oi O O
m
•t tn ru us oo ru in r- oH m m m m <j~
en0
or oo oi o "• ruUJ Oi Oi en en Oi
in ruru o 01oouim * r-01 ru in en ->nj m m m <
•4" m en en 01oo ui m -t eno> ru ui oo -i
o ru mm m -t
0100-010us in •<• en m
o in us f- r- oo
m ru en ui uso i- m o r- ruo ui iii r~ r*- co
o.CJ O O O O OI O O O O O
t— i O O O O O~* o o o o o0 OO O O O
01 o in f- enm r~ ID r^ njr*- co o m coru m in ID r*
o o o o o<f -4" <t -T -T
UJ en Oi Cn en 01
o O O O O O
en o r- -t in
N -t US — Oo ru < oo m
UJ « — — — —
H oo ru oo 01 en<c o us o1 — rnrz ootji m — ru< " 1 ". ~.
§ 0000o o o o
u) ru m ru min in N ru om us 01 m r-
^ m m m -4" 'j'UJ
— in us — Oi'en -t in o o
o_ o m ui — r—O -4" Ul vD 00 en
cc oo en o -i ru^ N h- 00 00 COLU en 01 01 01 en
y.OOOOO
o co 01 «-< m
XZ
O O O O O
m m m m mO!>^z
us -t r- en -Tin — en o ui
tn ru m rn m •»
co us ui en oz -t co -t nj •«•o_ in N o m ustn ru ru m m mo
to o o o o oo in in in in inI ru ru ru ru fij« ru ru ru ru ru
- o oo « mr- ru > in m
tp r- CO oocn oU- -1
Z Ul •» * N enx - •* en r- usO ID Ul -t -t -t
o o o o o o
oz co *-* ID t^- r*\ o m r^ in *to us in * -t <r
u o o o o o
*oz o m o iy *-<V — -T O 00 00c> us in ui <$• <t
od d d do
r- * * m ruo m in co m 01o N r- r- oo oou.o
r- -t u> m rur~ — r~ <t m
z i- m co <r ou_ <t in ui ii r-uo; oo 01 o — ru<t r^ r- CO co COuj en en en en en
i ru <r us co ou.u
oooooo — m 01 ru t-3 ui oo — in cou. -4* -?• in in in
ooooo— m en ru r-
3 r-rur- moou_ ^ ui in i uiu
o o o o oO — O -"3" 00 UJ3 in oo -i -a- coLL < -* in in in
i- <r us m ruD U) 00 00 Ol <£>
z *"* "o
r- -T us rn rur^ — r- <r rn
z r- m w -T ou_ ^ in ui us r—
r* us m ruo t- oo ru o ruz in oo ru us ou. -4- -t in ui IDo
z r- oo r- mi-x in —i en us i-f0_ LT Ul <f ^ -I^* m m m m mo o o o o o
oz « oo us us inx <f co in -, uso_ in -^ -^ -3* m•«-• m m m m rnU) O O O O O
*oz m r- — in <rv -t — *~ oo -To_ in in in < -*•^ m m m m m0 O OO OO
01 01 in *-< men m in m o
CL us oo o ru <u. " — ru ru ruo
m oo in m •»cj ru — m in r-CL US I- 00 en Ou_ « „ rt ru
or co 01 o "i ru<£ I— r— oo oo ooiii en en en en en
x <r ui -t nj ru3 m ru ru ru ruu, o o o o o
in -a- ui co ru3 o t- en oo -ru, f— in ui in usce i i i i *
.-,„--
^- Ul -4" * f-
13 o ui cn m njl- o iy 1s- fuu_ ^- <r tn ui oi
H ui rn in dH O LHO 1001IL <t <f Ul l/l uj
n? co cn o *•* fu<h- r-coco wU (p tn <T> CP CH
90
U. S. GOVERNMENT PRINTING OFFICE : 1977 O - 99-357