Embed Size (px)
Citation preview

Closing the Gender Gap in Education: What is the State of Gaps in Labor Force Participation for Women, Wives and Mothers?!"
Ina Ganguli
SITE, Stockholm School of Economics Sveavägen 65
SE-113 83 Stockholm, Sweden and Harvard University
Ricardo Hausmann Harvard University
79 JFK Street Cambridge, MA 02138
Martina Viarengo
The Graduate Institute, Geneva Avenue de la Paix 11A, 1202 Geneva
and Harvard University
ABSTRACT: The education gap between men and women has closed, or has even reversed in many countries. Have countries also made progress in closing other gaps facing women? Using micro-level Census data for close to 40 countries, we examine several dimensions of gender disparity: we compare men and women’s labor force participation (the labor force participation gap), married and single women’s labor force participation (the marriage gap), and mothers’ and non-mother’s labor force participation (the motherhood gap). We show that there is significant heterogeneity among countries in terms of the size and the speed at which the gaps are changing. Keywords: development, gender gap, education JEL subject codes: O12, J16, I2
!!!!!!!!!!!!!!!!!!!!!!!!!!!!!!!!!!!!!!!!!!!!!!!!!!!!!!!!!!!!!1 Corresponding author is Martina Viarengo ([email protected]). We gratefully acknowledge support received from the Women and Public Policy Program and the Women’s Leadership Board at the Harvard Kennedy School, and the Center for International Development at Harvard University. We would like to thank Iris Bohnet, Claudia Goldin, Marcela Escobari, Victor Lavy and Lant Pritchett for helpful discussions.
This is an Accepted Work that has been peer-reviewed and approved for publication in the International Labour Review, but has yet to undergo copy-editing and proof correction. See http://www.blackwell-synergy.com/loi/ilr for details. Please cite this article as a “Postprint”; 10.1111/j.1564-913X.2013.00007.x
2
!
I. Introduction
Eliminating differences in education between men and women has been a priority of
development organizations and the international community for many years. The Millennium
Development Goal (MDG) to “eliminate gender disparity in primary and secondary education,
preferably by 2005, and in all levels of education no later than 2015” is pursued by institutions
like the United Nations and the World Bank. Equality of educational opportunities between men
and women has also been acknowledged in the Universal Declaration of Human Rights of 1948
and the 1979 United Nations Convention on the Elimination of All Forms of Discrimination
against Women.2 A key rationale for the MDG goal to close the education gap was to work
towards achieving other development goals, such as fostering economic growth, reducing world
poverty, eradicating disease epidemics and improving well-being indicators. According to the
World Bank, “there is no investment more effective for achieving development goals than
educating girls.” (World Bank, 2012). In many countries, the differences in education between
men and women has disappeared, or even reversed. This reversal of the gender education gap
has occurred in almost all developed countries and many developing countries as well, even
among cohorts born over 60 years ago in several countries.
After reversing the gender education gap, have these countries also made progress in
closing other gaps facing women? What have we observed regarding gender equality and
women’s empowerment in terms of economic participation - married women versus single
!!!!!!!!!!!!!!!!!!!!!!!!!!!!!!!!!!!!!!!!!!!!!!!!!!!!!!!!!!!!!2 Art. 26: "Everyone has the right to education. […] and higher education shall be equally accessible to all on the basis of merit.... Education shall be directed to the full development of the human personality and to the strengthening of respect for human rights.... "

3
!
women and mothers and non-mothers’ labor force participation?3 How have developed countries
fared relative to developing countries?
In this paper, we use micro-level census data from 40 countries to show how these gaps
have changed over time. First, we document the reversal of the gender education gap and rank
countries by the year in which the gender education gap reversed. We then turn to an analysis of
the state of other gaps facing women comparing the participation gap - the marriage gap and the
motherhood gap. We show that gaps still exist in these spheres in many countries, although there
is significant heterogeneity in terms of the size of the gaps and the speed at which they are
changing. Finally, we investigate the relationship between the gaps. While our cross-country
research design does not allow us to identify the causal relationships between the gaps or the
impact of economic development on the gaps4, it does provide a useful descriptive analysis of the
relationships between them. Despite the significant focus on reducing the gender education gap
among the international community and the remarkable reversal of the gap in so many countries,
to our knowledge, this is the first study to use micro-level data for so many countries to study the
state of these gaps and how they have changed over time.
II. Motivation
It has been suggested that educating girls and achieving the MDG goal on gender equity
will lead to a range of improved outcomes for developing countries (Schultz, 2002). Evidence !!!!!!!!!!!!!!!!!!!!!!!!!!!!!!!!!!!!!!!!!!!!!!!!!!!!!!!!!!!!!3 We acknowledge the importance of other dimensions of women’s empowerment such as political participation, earnings and property rights protection. Eliminating gender disparity in these areas is clearly necessary on the grounds of human rights and, according to a large body of existing literature, to promote development (Bandiera and Natraj, 2011). In this paper we focus on labor force participation that has often been regarded by international organizations as a first step to improve women’s living standards, and as a mechanism to increase income and economic growth. 4 See Bandiera and Natraj (2011) for a summary of the existing studies on gender inequality and development and their limitations. The authors suggest that most of the existing literature does not adequately address issues related to reverse causality and omitted variables.

4
!
has shown that educating women can lead to improved economic and social outcomes.
Specifically, recent empirical work, which has primarily focused on developing countries, shows
that there are both positive economic consequences and social externalities arising from
improving women’s education. For example, increases in women’s education have been
associated with reductions in fertility (e.g. Osili and Long, 2008), decreases in infant mortality
and increases in life expectancy (see Dancer et al., 2008; Behrman and Deolalikar, 1988).
Overall, it appears that educating women has beneficial effects on children’s health (see
Glewwe, 2000), schooling, and adult productivity (Lam and Duryea, 1999; Strauss and Thomas
1995). It holds a larger beneficial effect than the same level of father’s education (see Schultz
2002). In addition, studies have shown that the benefits from expanding female education are far
greater than the benefits from other public interventions, such as improving family planning
service provision or increasing the number of physicians in the population (Kingdon, 2002).
Empirical evidence also shows that gender equality in education leads to higher economic
growth (e.g. Abu-Ghaida and Klasen, 2004) and a low investment in women’s education leads to
slower economic growth and reduced income levels (Dollar and Gatti, 1999; Klasen 1999).
Why would we expect changes in other measures of gender disparity as a result of
increases in women’s education? We next discuss the theoretical reasoning behind the potential
effect of narrowing the education gap on women’s labor force participation for married and
unmarried women and for those with and without children.
a. Education and Labor Force Participation
The theory of human capital investment relates differences in earnings to differences in
schooling, training, and other assets (Mincer, 1974; Becker, 1991). Specifically, it relates

5
!
expected lifetime labor force participation to one’s incentive to acquire education and training.
According to this theory, education increases the productivity, and thus, the earnings of
individuals. Existing studies have established a strong, causal relationship between education and
income at the individual level.5
As Becker (1992) suggests, human capital theory explains why women have traditionally
had fewer incentives to invest in education and training given their shorter expected labor force
participation. Many factors have been put forward to explain why this has changed over time
and why the gender gap in education has closed and even reversed in many countries. In the
case of the United States, the technological change that led to the use of mechanical rather than
human energy (Galor and Weil 2000), the rapid expansion of the service sector (Becker, 1992);
as well as changes in household work through the use of piped water, electricity, and appliances
(Killingsworth and Heckman, 1986; Greenwood et al., 2005; Goldin 2006); greater ability to
control pregnancies through access to birth-control technology, and lower effort costs of college
preparation and attendance for girls than for boys, (Goldin and Katz, 2006). Also, the increase in
divorce rates and decline in family size have been suggested as correlates and possible
determinants of the reversal of the gender gap in education.
Increases in education have allowed women to increase their expected lifetime labor-
force participation, shifting their time horizon. Consequently, their expected benefits from an
increased investment in education have led them to plan “careers” instead of having “jobs” and
being the “secondary worker” within the household (Goldin 2006). In this regard, research
shows that returns to women’s education in many countries are either equal or higher than those
!!!!!!!!!!!!!!!!!!!!!!!!!!!!!!!!!!!!!!!!!!!!!!!!!!!!!!!!!!!!!5 At the macro-level, cross-country evidence linking education to growth has not reached definitive conclusions (Pritchett 2001, 2006). Among the factors that may explain the discrepancy between macro and micro analyses are measurement error in macro regressions and issues related to the quality of education.

6
!
for men. Consequently, the opportunity cost of staying home increases as women’s level of
education increases. It is important to acknowledge the fact that other factors beyond economic
forces may have an impact on women’s labor force participation. Cultural, social and political
factors affect women’s market work. Specifically, social barriers (Goldin 1990), cultural factors
(e.g., !lkkaracan 2012; Beblo and Ortlieb 2012), specific views on the role of women in society
(e.g., Folbre 1994) and within the household (Badgett and Folbre 1999) or formal restrictions
(e.g., Boserup 1970) may limit women’s labor supply, even in the case of high expected labor
market outcomes and returns to education.
b. Marriage and Labor Force Participation
Married women’s labor force participation has been the subject of much debate in the
literature. Mincer’s (1962) model was the first that tried to explain the apparent puzzle of the
increase in married women’s labor force participation in spite of steady increases in men’s real
earnings in the United States. According to this pioneering work, household income and wages
have two effects on female work status. The income effect suggests that wages are negatively
related to labor supply: as wages increase and income goes up individuals may decide to spend
less time working in the labor market and devoting more time to leisure which is a normal good.
On the other hand, the substitution effect suggests that as wages increase also the opportunity
cost of not working increases. Therefore, in this case individuals will increase their labor supply.
Mincer found the positive substitution effect of general wage increases on women’s employment
to be greater than the negative income effect through the husband’s wage, with the difference
being large enough for increases in women’s wages to explain much of the increase in married
women’s labor force participation.

7
!
Goldin (1990) shows how changes in income and wage elasticities can affect the
evolution of women’s labor force participation, while Blau and Kahn (2007) examine trends in
married women’s own- and cross-wage elasticities. They find that in the United States from
1980-2000, married women’s own-wage elasticity fell by about one-half and their
responsiveness to husbands’ wages declined by about 40 percent. Heim (2007) also examines
U.S.’ married women’s labor supply elasticities over 1979-2002, finding that married women’s
wage and income elasticities for both participation and hours decreased dramatically in absolute
value over the period.
Juhn and Murphy (1997) focus on women’s employment and earnings and examine it at
different points of the husbands’ wage distribution from 1959 to 1989 and find an increasingly
weaker relationship between women’s labor force participation and their husbands’ earnings.
They also confirm a positive relationship between women’s wages and labor force participation,
casting doubts on the increase in married women’s labor force participation to compensate the
low earnings growth of their husbands. In addition to economic factors, Fernandez (2007) shows
how changes in culture and social norms as part of a rational intergenerational learning process
may have affected the increase in married women’s participation in the workforce.
c. Motherhood and Labor force Participation
In the neoclassical model of the family, women tended to specialize in domestic
production, including child rearing and traditional household activities, whereas men were the
primary earners and specialized in formal production through labor market activities (Mincer,
1962; Becker 1991). Moreover, even for women in the labor force, rearing children in the early
years was associated with a decrease in working experience and wages. Subsequent models
8
!
found the neoclassical model to be inadequate in explaining the rise in married women’s
employment (e.g., Bowen and Finegan, 1969; Smith and Ward, 1985) and focused on other
factors to explain the evolution of mothers’ labor force participation.
First, the expansion of education appears to be related to a decline in fertility rates
(Caldwell, 1980; Galor and Weil, 1996 and 1999) and to a delay in the start of fertility (see
Strauss and Thomas (1995) for a review of the existing literature). According to Caldwell
(1982), education influences fertility by increasing the cost of children and the importance of
investing in children’s human capital, leading women’s optimal fertility choices toward higher
quality (Becker and Lewis, 1973; Willis 1973). Becker et al. (1990) show how higher levels of
human capital lead to an increase in the returns on human capital, as well as to fewer children.
Galor and Weil (1996) relate increases in women’s wages to the decline in fertility, which, in
their theoretical framework, is a consequence of the increase in the cost of children more than the
increase in household income. Several studies in the recent literature have tried to establish a
causal relationship between education and fertility in order to address issues of reverse causality
and possible omitted variables (e.g. Breierova and Duflo, 2004; McCrary and Royer, 2008;
Duflo, Kremer and Dupas, 2010).
Second, advances in household production technology have reduced the time necessary
for domestic production. In addition, advances in medical technology have reduced the time
associated with childbirth and rearing, and effective birth control allows women to control the
size and timing of their families and to respond rationally to market signals (Barker and Feiner,
2004). Third, the shift of economic activity toward the service sector and the consequent
introduction of scheduled part-time employment, which is more “female friendly”, as well as the
increase in returns to education, has led to an expansion of married women and mothers’ labor

9
!
force participation (Goldin, 2006; Goldin et al., 2006), increasing educated women’s opportunity
cost of staying out of the labor force (Attanasio et al., 2009).
d. Expected Relationship between Education and Gaps
Based on this literature, we would expect that an increase in women’s levels of education
would be associated with greater labor force participation among women overall,6 and with
higher labor force participation among wives and mothers, as well as lower fertility rates and
smaller wage gaps between men and women. That is, we would expect that empowering women
with more education would increase their economic participation and give them a greater access
to economic resources, leading to an improvement in many other spheres. Following previous
empirical analyses, mainly country-specific studies or that focused on a limited number of
countries, we expect to observe the existence of a U-shaped curve for women’s participation and
development as documented by Goldin (1994) and Mammen and Paxson (2000). When women
have low levels of education, they are employed in low-skilled, often manual activities for which
a social stigma exists, but when they are educated, they find employment in more socially
acceptable labor market activities.
A large cross-country analysis of the reversal of the gender education gap and the gaps in
women’s labor force participation in these other areas is lacking. We provide evidence on the
!!!!!!!!!!!!!!!!!!!!!!!!!!!!!!!!!!!!!!!!!!!!!!!!!!!!!!!!!!!!!6 We acknowledge the fact that there may be social norms that prevent women from working outside the household. In this case, an investment in education could not increase women’s participation in the labor market. Moreover, there is a possible multidimensionality of gender inequalities. Sundaram and Vanneman (2008) found that in Indian districts where there is a higher share of women,girls’ literacy is further behind boys’ literacy and explain this fact by suggesting that in this context where more mothers work outside the household, more girls have to work to help the family. Moreover, it would be important to examine women’s participation by sector with a focus on the employment-status categories. Due to data limitations it has not been possible here (in this regard, an interesting analysis has been carried out for India by Huisman and Smits, 2009).

10
!
dynamics of these gaps in the remainder of the paper. We also relate the state of the gaps to
factors such as levels of GDP, urbanization, and labor market rigidity.
IV. Data
Our analysis is based on a country-year-level dataset constructed using micro-level data
for each country. The primary source used to construct the dataset is the International Integrated
Public Use Microdata Series (IPUMS-International) (Minnesota Population Center, 2009), which
includes the largest publicly available individual-level census data and consists of decennial
records of persons and households. We draw upon data for select countries from Africa, Asia,
Europe, and Latin America as available, drawing upon the most recent wave of the Census for
each country.7 In most cases, the difference between the two waves of the census is 10 years.
The focus of our analysis is one cohort of women and men – individuals aged 35-44. The
motivation for choosing this age group is to include individuals who have finished their studies
and have made their marriage, fertility and labor market decisions. Appendix Table A1 lists the
years and countries for our analytical samples based on the Census data.
Using the Census data for each country, we measure several gaps. First, we define the
“education gap” as the difference in average years of education between men and women. The
“labor force participation gap” is the share of men who are in the labor force (employed or
unemployed and job-seeking8) minus the share of women who are in the labor force.9 The
!!!!!!!!!!!!!!!!!!!!!!!!!!!!!!!!!!!!!!!!!!!!!!!!!!!!!!!!!!!!!7 We acknowledge the fact that our sample is biased towards developing countries. It has not been possible to add more developed countries by relying on other data sources because aggregate statistics consistent with the variables and demographic groups we are using are not available. 8 We use the employment status variable (EMPSTAT) available in the IPUMS dataset. The variable has been harmonized to make work status comparable across countries and over time. Some differences in terms of classification and reference group remain. A detailed description for each country and wave is available at: https://international.ipums.org/international-action/variables/EMPSTAT#comparability_tab
11
!
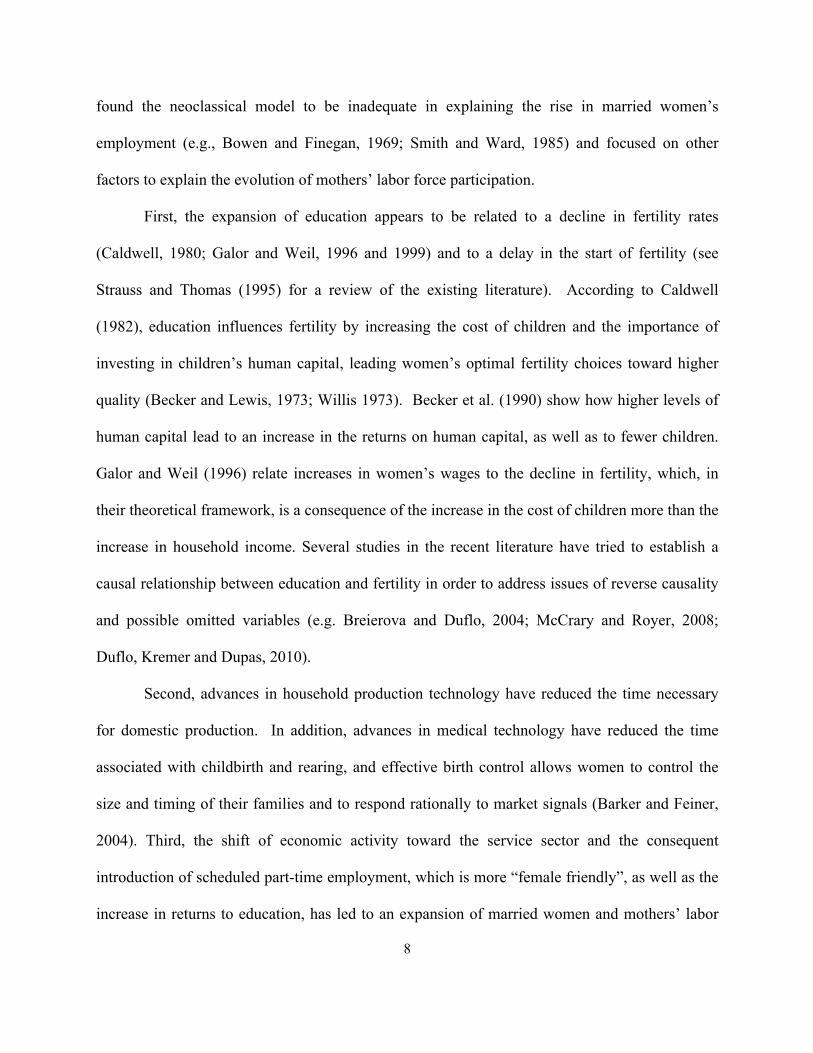
“marriage gap” is the difference in rates of employment among women who are married (or
living in cohabitation) and single women. The “motherhood gap” is the difference in rates of
employment among women without children and women with three or more children.10
We supplement the measures constructed from the IPUMS Census data with country-
level variables from the World Development Indicators (WDI), including measures of GDP per
capita and urbanization rates. We also include measures of labor market rigidity extracted from
the World Bank’s (2011) Doing Business dataset.
V. The Education Gap
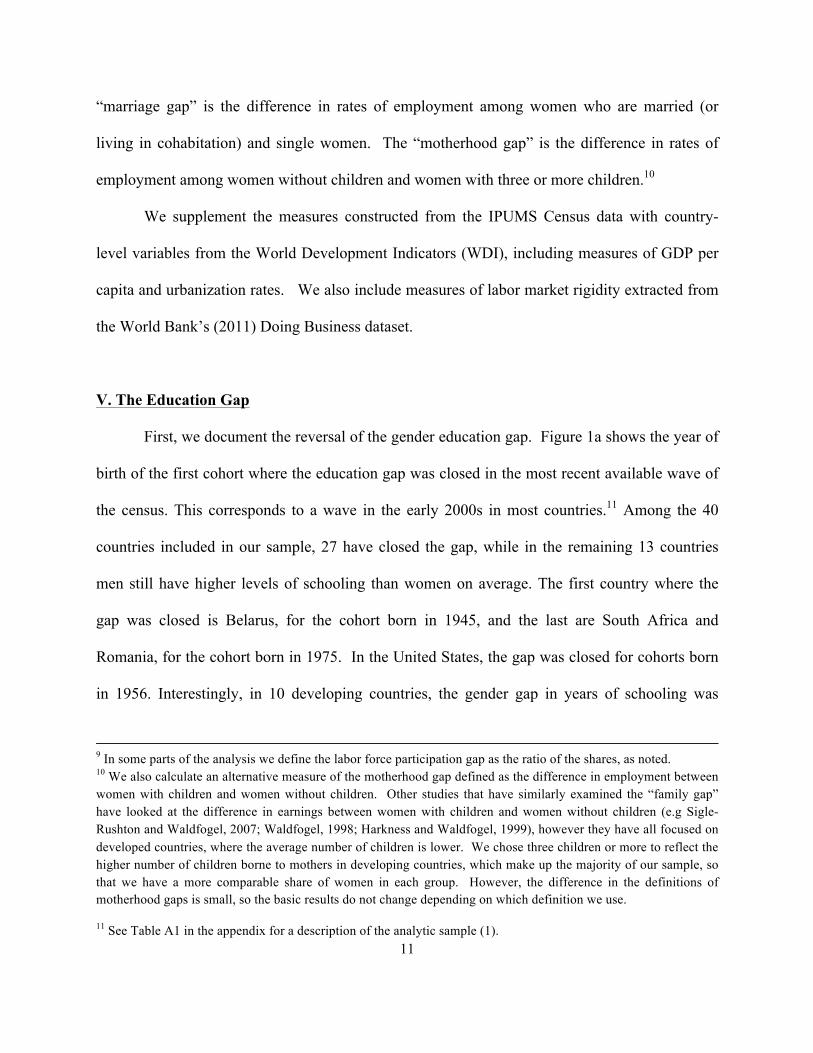
First, we document the reversal of the gender education gap. Figure 1a shows the year of
birth of the first cohort where the education gap was closed in the most recent available wave of
the census. This corresponds to a wave in the early 2000s in most countries.11 Among the 40
countries included in our sample, 27 have closed the gap, while in the remaining 13 countries
men still have higher levels of schooling than women on average. The first country where the
gap was closed is Belarus, for the cohort born in 1945, and the last are South Africa and
Romania, for the cohort born in 1975. In the United States, the gap was closed for cohorts born
in 1956. Interestingly, in 10 developing countries, the gender gap in years of schooling was
!!!!!!!!!!!!!!!!!!!!!!!!!!!!!!!!!!!!!!!!!!!!!!!!!!!!!!!!!!!!!!!!!!!!!!!!!!!!!!!!!!!!!!!!!!!!!!!!!!!!!!!!!!!!!!!!!!!!!!!!!!!!!!!!!!!!!!!!!!!!!!!!!!!!!!!!!!!!!!!!!!!!!!!!!!!!!!!!!!!!!!!!!!!!!!!!!!!!9 In some parts of the analysis we define the labor force participation gap as the ratio of the shares, as noted. 10 We also calculate an alternative measure of the motherhood gap defined as the difference in employment between women with children and women without children. Other studies that have similarly examined the “family gap” have looked at the difference in earnings between women with children and women without children (e.g Sigle-Rushton and Waldfogel, 2007; Waldfogel, 1998; Harkness and Waldfogel, 1999), however they have all focused on developed countries, where the average number of children is lower. We chose three children or more to reflect the higher number of children borne to mothers in developing countries, which make up the majority of our sample, so that we have a more comparable share of women in each group. However, the difference in the definitions of motherhood gaps is small, so the basic results do not change depending on which definition we use.
11 See Table A1 in the appendix for a description of the analytic sample (1).
12
!
closed earlier than in the United States.12 The timing of the closure of the gender gap in
education implies that in countries where the gap was closed in the 1950s, two generations
already have experienced gender equality in years of schooling, while in the countries where the
education gap was closed in the 1970s, only one generation is experiencing this phenomenon.
Except for Austria, countries where the gender gap has not closed are developing
countries. On the other hand, we observe that in most developed countries and also in some
developing countries, the gap not only has closed, but has significantly reversed (see Hausmann,
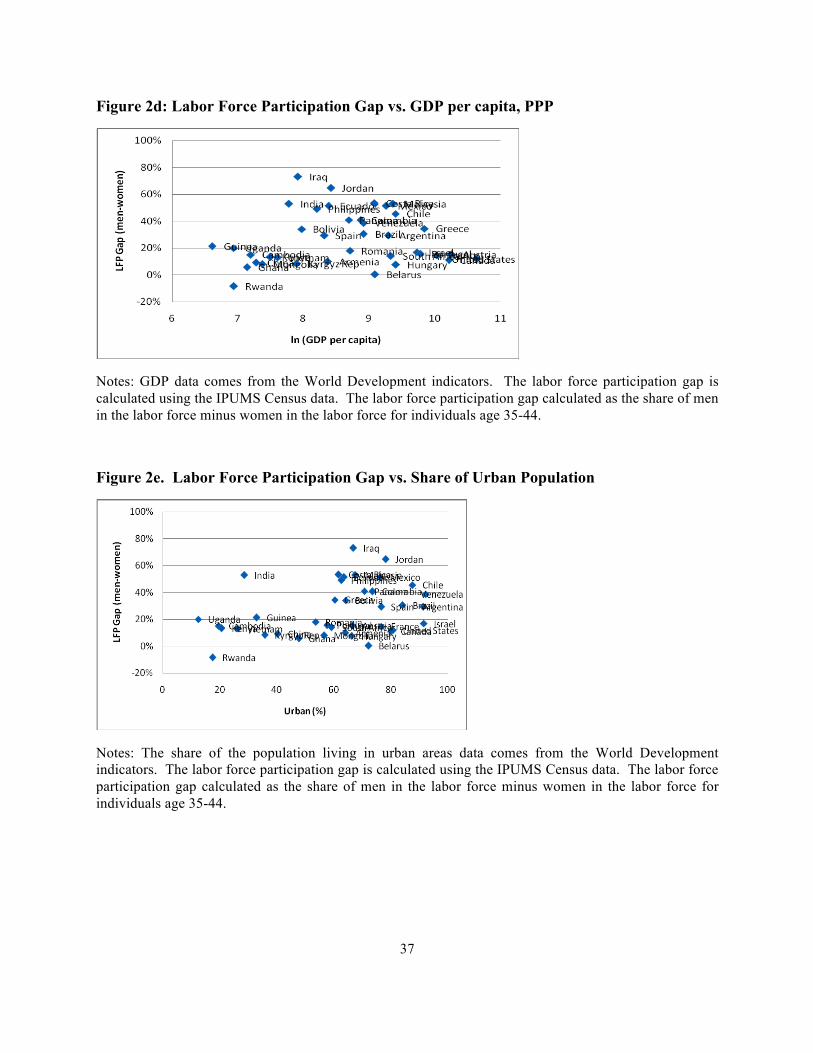
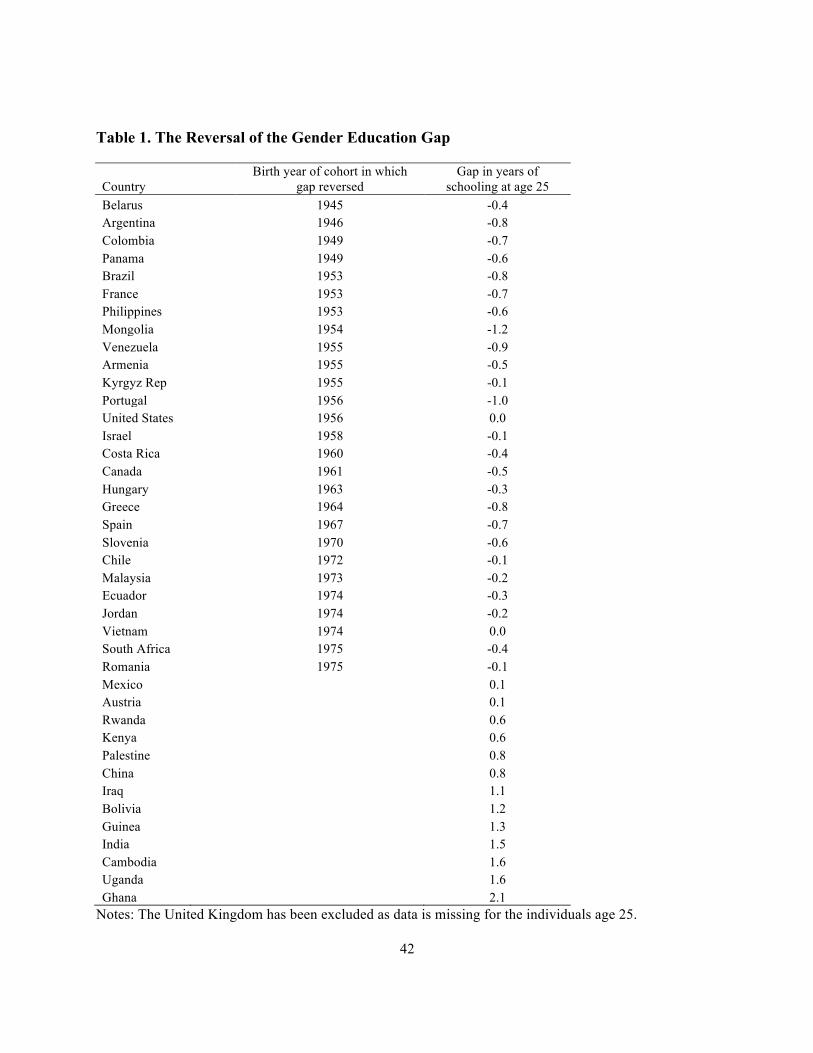
Ganguli and Viarengo, 2009). Table 1 shows that the gap in years of schooling at age 25 is still
very large in Bolivia, Iraq, China, Palestine, Kenya, and Rwanda, with gaps ranging between 0.6
and 1.2 years of schooling; gaps are much smaller in Austria and Mexico, both with 0.1 years.
The gap has closed in Vietnam, and it has reversed significantly in Mongolia, Venezuela,
Argentina, Brazil, and Greece, where 25 year-old women have between 0.8 and 1.2 years of
schooling more than men. Among Latin American countries, the gap has closed and reversed in
most (8 out of 10). Only Mexico and Bolivia exhibit the existence of a gap, still significant in
the case of Bolivia.
******Insert Table 1 and Figure 1a here*******
Figure 1b shows women’s average level of education and relates this to the current level
of the gender gap. We observe that in most developed countries, the gap is either equal to zero
(gender equality) or has reversed. Interestingly, among those countries where the gender gap has
reversed, many are ones where women do not have the highest average levels of education (e.g.,
Argentina and Brazil vs. Canada and the United States). In countries like Rwanda and Guinea, !!!!!!!!!!!!!!!!!!!!!!!!!!!!!!!!!!!!!!!!!!!!!!!!!!!!!!!!!!!!!12 We acknowledge that the US had a more complicated history of gender gaps. Between 1900 and 1930 women and men had roughly the same level of education as men (Goldin et al., 2006), then the gap widened and subsequently closed for the cohorts born in the 1950s. For the other countries in our sample we don’t observe further reversals back in time.

13
!
where women have the lowest average levels of education, the gender gap is between 1.2 and 2.3
years of schooling. In countries where the gender gap is the 2 or more (i.e., Uganda, Kenya,
Bolivia and India), women’s average level of education is 4-6 years. We note that in some
countries, like Bolivia and Mexico, while the gender gap has reversed in urban areas, it still
exists among the indigenous population and in rural areas (Duryea et al., 2007).
****Insert Figure 1b here****
Next we examine the dynamics of the gender education gap. Figure 1c shows the gender
gap in years of schooling for the age group 35-44 in the older wave of the census against the
change in the gender education gap for the same age group, where the change is calculated
between the most recent wave of the Census and the previous one. We can observe that in the
majority of countries, the gap is falling. One exception is India, where the gap is high and does
not appear to be falling.13 If we look at the change over time, we can observe the reduction in
the gender gap over the course of a decade has ranged from close to 0 to -0.8 years.14 Only
Mongolia experienced a decrease in the gap greater than a year, which we excluded from the
graph.
*****Insert Figure 1c here****
VI. The Labor Force Participation Gap
Next, we examine labor force participation, where the gap is defined as the difference
between the share of men and share of women in the labor force. While interpreting our results,
!!!!!!!!!!!!!!!!!!!!!!!!!!!!!!!!!!!!!!!!!!!!!!!!!!!!!!!!!!!!!13 We acknowledge the fact that the most recent Indian census wave, 2011, could present different patterns as more recently, at an aggregate level, both gaps have narrowed.
14 Over the period considered, which is the difference between the two census waves. See Table A, which shows the sample for each country.

14
!
we acknowledge the fact that our measure based on the harmonized employment status variable
in IPUMS may not accurately take into account household work, self-employment and informal
occupations, which women are more likely to engage in, particularly in developing countries. In
this regard, the resulting bias may be more significant for developing countries and there may be
heterogeneity across countries that we cannot quantify. However, this should only affect the
static analysis of labor force participation gap (for a given wave), but not the dynamic analysis
(changes across waves), since the definitions of the employment status variable do not change
across waves.
Figure 2a shows the gap in labor force participation in the most recent wave of the
Census. Rwanda is the only country where women’s labor force participation is higher than
men’s. It is important to note that this cohort has been affected by the 1994 genocide, which has
likely affected gender roles in the household and women’s labor force participation. Other
African states have women’s labor force participation rates as high as those available in our
sample of developed countries (Ghana, Kenya, and South Africa). Belarus exhibits equal labor
force participation between men and women. Also, other former or current communist countries
(Cambodia, Romania, Mongolia, Hungary, China, and Vietnam) exhibit high female labor force
participation rates and participation gaps below 20 percent. Latin American countries have
higher participation gaps ranging between 29 percent in Argentina and 53 percent in Costa Rica.
On the other hand, Arab countries - Jordan, Iraq and Palestine - exhibit very large gaps above 60
percent. Among developed countries, Southern European countries (Greece, Spain and Portugal)
have lower levels of women’s labor force participation relative to men with respect to their
Western counterparts.
****Insert Figure 2a here****

15
!
Now we examine the change in the labor force participation gap with respect to the
previous wave of the Census. In Figure 2b, we plot the initial gap (horizontal axis) against the
change in the gap (vertical axis). We observe heterogeneity in the change in the gap among
countries that had high initial participation gaps. Brazil and Spain, which had large gaps in the
1990s, also had a reduction in the gap greater than 20 percentage points, which is the greatest
among the countries in the sample. Among other countries with participation gaps above 30
percent in the initial period, Argentina, Venezuela, Israel, and Greece experienced a reduction in
the gap between 10 and 20 percentage points, whereas Panama, Malaysia, India, Costa Rica,
Chile, Ecuador, and Colombia had a more limited reduction in the gap, below 10 percentage
points. On the other hand, Mexico experienced a widening of the participation gap. Rwanda,
which already exhibited no participation gap in the early 1990s, had a further reduction in the
gap. In Vietnam, Romania, South Africa, and the United States, the gap is rising, while it falls
by less than 10 percentage points in the remaining countries.
****Insert Figure 2b here*****
Figure 2c shows that GDP and women’s labor force participation follow a U-shaped
curve, with women’s labor force participation high (above 70 percent) in countries like Rwanda,
Guinea, Ghana, and Cambodia, with levels of annual GDP per capita below $1,500. Women’s
labor force participation rates are also high in countries like Austria, France, the United States,
and Canada with GDP per capita above $22,000. We also observe that most middle-income
countries exhibit women’s labor force participation rates below 60 percent. The level of GDP per
capita at which women’s labor force participation is at a minimum is approximately $2,800.15
!!!!!!!!!!!!!!!!!!!!!!!!!!!!!!!!!!!!!!!!!!!!!!!!!!!!!!!!!!!!!15 This observation is supported by regression analysis using the specification in Appendix Table A2.

16
!
Iraq’s GDP per capita is close to $2,747 in this period and women’s labor force participation is
the lowest among the countries in our sample at close to 14 percent.
****Insert Figure 2c here****
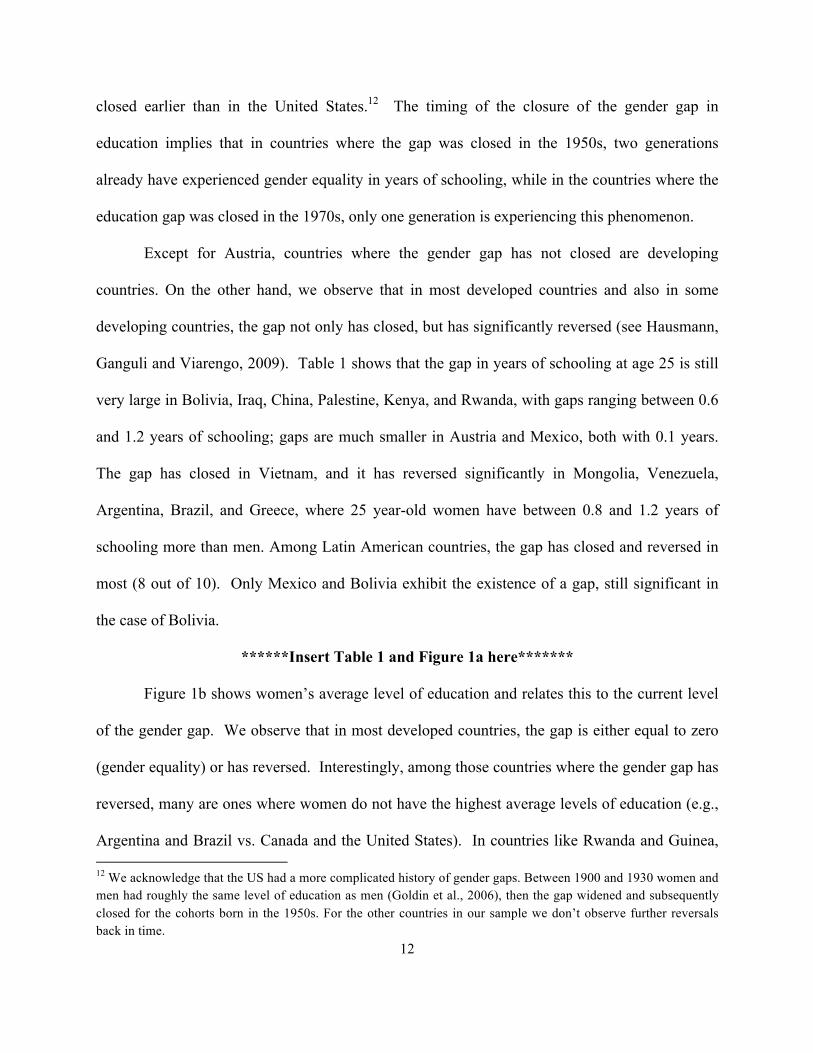
Similarly, if we plot GDP per capita against the labor force participation gap (Figure 2d),
we observe that the gap is lower at lower and higher levels of GDP per capita. Table A2 provides
evidence that the relationship between female labor force participation and GDP per capita is
weaker after controlling for urbanization. Empirical studies in the existing literature (e.g. Sinha
1967; Goldin 1990, 1994) are consistent with these results and find that during the early stages of
economic development women’s labor force participation declines as a result of the structural
change. That is, the shift from an agriculture-based economy to the expansion of the modern
sector leads to a decline in female participation in market-oriented activities.16 Nevertheless, we
observe that in low-income countries with high female labor force participation rates (Ghana,
Guinea, Rwanda, and Uganda) the gender gap in education still exists (Figure 1a). On the other
hand, in developed countries with equally high women’s labor force participation rates (Canada,
France, and the United States) the gender gap in education has reversed and a greater share of
women are employed in high skill urban occupations.
****Insert Figures 2e and 2d here****
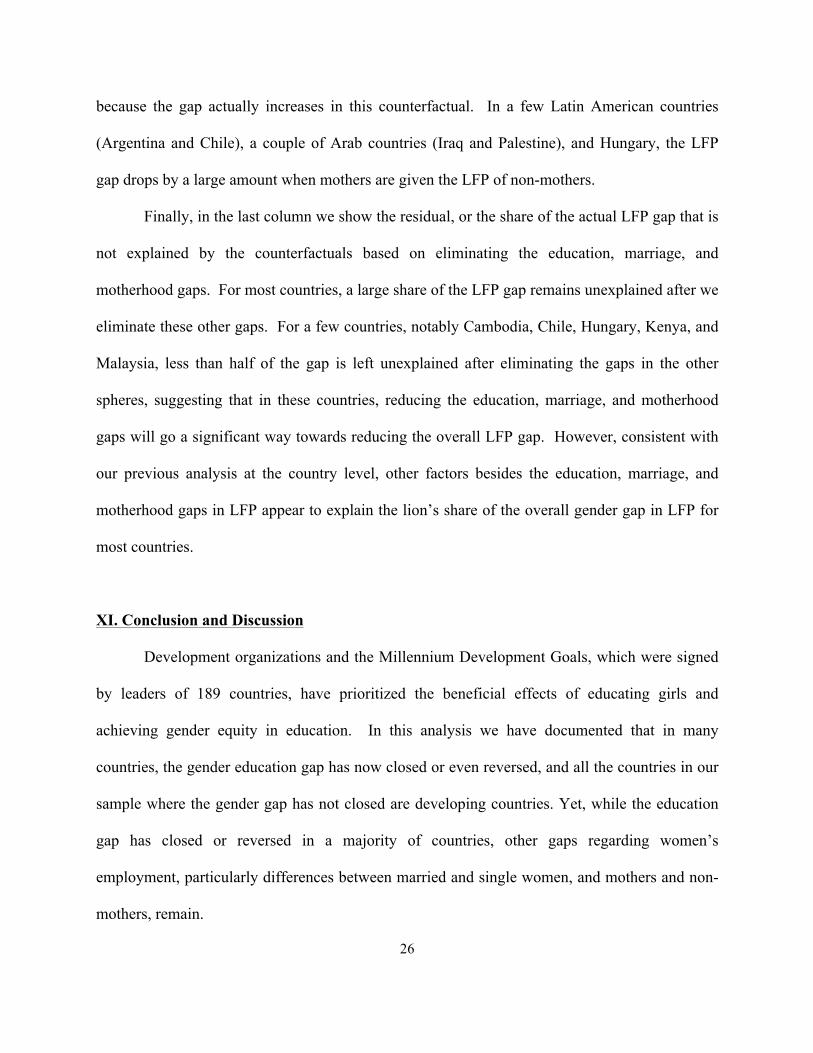
We formalize this analysis with regressions showing the relationship between GDP and
the labor force participation gap. We also examine the relationship between the labor force
participation gap and the share of the population living in urban areas, as well as a measure of
the rigidity of the labor market. Table 2, Column 1, shows that the log of GDP per capita and the
log of GDP per capita squared are significantly related to the gap in labor force participation, !!!!!!!!!!!!!!!!!!!!!!!!!!!!!!!!!!!!!!!!!!!!!!!!!!!!!!!!!!!!!16 In this case labor force participation does not include home-based work that produces non-marketed services.

17
!
confirming the relationship suggested by the previous graph.17 Column 2 shows the regression
results predicting the change in the LFP gap from the previous Census. As the earlier graphical
analysis showed, the level of the gap in the previous Census is negatively related to the change in
the gap, so countries with higher initial levels of the gap have decreasing gaps, indicating
convergence. It also appears that the change in the LFP gap and the log of GDP per capita are
positively related, also suggesting that there is a U-shaped relationship. Surprisingly, the
regressions also show that in countries with more rigid labor markets, the gap is decreasing
more, suggesting that labor market policies may have an impact on the speed at which this gap is
changing, but not with the sign that is expected.18
Finally, we see that the gap is decreasing more rapidly in countries with a greater share of
the population living in urban areas. This appears to be related to the fact that after an initial
decline in female labor force participation, as economies further develop and become urbanized,
women’s education and the opportunity cost of staying out of the labor force increase. Fertility
rates decline as well as the social barriers associated with market work, and women’s labor
market participation increases (Goldin 1990, 1995; Mammen and Paxson 2000). It is important
to acknowledge that even if this fact is widely acknowledged in the literature, existing empirical
cross-sectional studies are mainly descriptive and cannot identify the causal effect of
development and urbanization on women’s labor market participation. In addition, countries
may follow different development patterns and resulting trajectories in women’s labor force
participation.
!!!!!!!!!!!!!!!!!!!!!!!!!!!!!!!!!!!!!!!!!!!!!!!!!!!!!!!!!!!!!17 Including urban-squared in the regression does not change the results. 18 The mean of the Rigidity Employment Index is 37.9 and the standard deviation is 16.9. An increase in the Rigidity Employment Index of one standard deviation would lead to a reduction in the gap by 0.027 percent, so the effect is relatively small.

18
!
****Insert Table 2****
VII. The Marriage Gap
Next, we examine the gap in employment rates between married women and single
women, or the marriage gap.19 When we plot the marriage gap against the female employment
rate in Figure 3a, we see that in countries where women’s employment is low (below 20
percent), the ratio of married to single women’s employment rate is low. This means that where
fewer women work, fewer married women work relative to single women. The Arab countries,
Palestine, Iraq and Jordan, where the marriage gap is highest, fall into this category. As the
female employment rate rises, the difference in employment between married and single women
decreases.
There are several countries where female employment is high (above 60 percent), and
married women work more than single women (Mongolia, Ghana, China, Slovenia, the UK,
Hungary, Rwanda, Belarus, Canada, and Romania). We can see that these countries include both
developed and developing countries, communist and former communist countries. Table 2,
Column 3 shows regression results for the marriage gap. The analysis confirms the relationship
between overall female labor force participation and the marriage gap. The results also show
that other variables that might play a role in the marriage gap – GDP, share urban, and the
rigidity of the labor market – do not significantly explain the level of the marriage gap across
countries.
*****Insert Figure 3a here*****
!!!!!!!!!!!!!!!!!!!!!!!!!!!!!!!!!!!!!!!!!!!!!!!!!!!!!!!!!!!!!19 This is based on the IPUMS marital status variable, MARST, for which we use “married/in union”. Therefore our definition of “marriage” also includes cohabitation.

19
!
In Figure 3b we present the dynamics of the marriage gap by plotting the initial marriage
gap on the horizontal axis and the decade change in the gap on the vertical axis. We see that
countries that started with small gaps had small changes in the marriage gap. But the picture is
less clear for countries that started with large initial marriage gaps. Some countries with large
initial gaps like Argentina, Brazil, and Spain had large reductions in the gap. Other countries
with large initial gaps, like Chile, Ecuador, Venezuela, India, Colombia, and Panama had small
reductions in the gap. Meanwhile, countries like Costa Rica, Malaysia, and Mexico had
increases in the marriage gap.
*****Insert Figure 3b here*****
VIII. The Motherhood Gap
Now we turn to the gap in employment among women with 3 or more children and
women without children, the motherhood gap. Several studies have similarly examined the
motherhood gap or “family gap” by looking at the difference in earnings between women with
children and women without children (e.g Sigle-Rushton and Waldfogel, 2007; Anderson,
Binder and Krause, 2002; Waldfogel, 1998; Harkness and Waldfogel, 1999). These studies have
been motivated by the fact that in many countries, women tend to bear a greater responsibility
for caring for children and are the main provider of unpaid household work (Elson 1999).
Empirical evidence has been mainly limited to developed countries, where findings indicate that
there is persistent family gap, but the size varies across countries (Harkness and Waldfogel,
1999). Women with children are also less likely to work outside of the home, and those who
work, work fewer hours.

20
!
We rank countries by the motherhood gap in Figure 4a, and see that for most countries in
our sample, women with children tend to work less than women without children (negative
values for the motherhood gap).20 The gap is largest in Chile, followed by Costa Rica and
Argentina. On the other hand, there are several countries with a positive motherhood gap,
meaning that women with children work more than women without children. In Rwanda the
difference is almost 10 percent. Interestingly, the countries with the lowest female employment
rates, Iraq and Palestine, have positive motherhood gaps. In Table 2, Column 4, we show the
regression results for the motherhood gap, which shows that there is no significant relationship
between the motherhood gap and GDP, urbanization, the rigidity of the labor market, and the
overall labor force participation of women.
In Figure 4b we show the change in the motherhood gap across Census waves vs. the
initial gap. We see that countries with larger initial motherhood gaps had large changes in the
gap, like in Austria, Brazil and Greece. Meanwhile, countries with positive motherhood gaps in
the previous census, like China, Vietnam and South Africa, had very small changes.
*****Insert Figure 4a and 4b here*****
IX. The Relationship between the Gaps
!!!!!!!!!!!!!!!!!!!!!!!!!!!!!!!!!!!!!!!!!!!!!!!!!!!!!!!!!!!!!20 Appendix Figure A1 shows the motherhood gap with an alternative definition - the difference in employment rates between women with any children and women without children. As noted earlier, we chose women with 3 or more children because most of the countries in our sample are developing countries where the average number of children is higher. We also note that the costs of having children are also likely to increase as the number of children in the household increases, which make the difference between women with 3 or more children a useful group to examine. Figure A1 shows that there are a few countries that move in the ranking depending on which definition is used, but We find that the original and alternate definition of the motherhood gap is very similar for most countries and on average the difference between the measures is zero. However, the general results are similar regardless of the definition used.

21
!
In this section, we examine the relationships between the gaps we have discussed thus far
- the gender gaps in education and labor force participation, and the marriage and motherhood
gaps. In Figure 5a we plot the gender gap in education on the horizontal axis and the gender gap
in labor force participation on the vertical axis. While we do not see a clear relationship between
these gaps, it is evident that while the gender education gap has reversed in many countries, a
labor force participation gap is still present. For example, countries like Argentina, Brazil,
Colombia, the Philippines, Panama, and Venezuela, have all reversed the gender education gap,
but have labor force participation gaps between 40 and 70 percent. Meanwhile, countries like
China, Vietnam, and Kenya have large gender education gaps, but low labor force participation
gaps. Rwanda, where women work more than men, has not reversed the gender education gap.
A country-level regression in Table 3, Column 1 shows that after controlling for other factors,
the education gap in the cohort is not significantly related to the LFP gap.
As discussed earlier, these patterns may be explained by greater labor force participation
among low-skilled women in these countries. Existing studies in the literature suggest that
women’s labor supply follows a U-shaped pattern during economic development (Sinha 1967;
Schultz; 1988; Goldin; 1990, 1994; Mammen and Paxson; 2000). At very low levels of income,
women tend to have low-skilled jobs, long working hours, and they are typically the secondary
earners in the household and often their work plays the role of insurance. There is some disutility
and social stigma attached to labor force participation that helps us understand why as GDP per
capita goes up, women’s labor force participation goes down. On the other hand, at high levels
of income per capita, women are educated, and are more likely to have ‘careers’. Women are
less likely to be the second earner in the household, and they tend to have more decision power
within the household. In this case, women form their identity first, invest in their education and

22
!
then make decisions related to marriage and fertility. Descriptive evidence consistent with our
results is provided in the World Development Report 2012, which documents that women’s labor
force participation follows a U-shaped curve along economic development.
*****Insert Table 3 and Figure 5a here*****
In figure 5b we can observe the relationship between the change in the education and
labor force participation gaps. We can observe that no country has had both gaps increase. In
India, the gender gap in education has not changed while the gender gap in labor force
participation has decreased by around 4 percent.21 On the other hand, in countries like Romania,
Vietnam, Mexico, South Africa, and the United States, the gap in labor-force participation is
increasing, while the gap in education is either decreasing or remains unchanged. In the majority
of countries, both gaps have decreased between the Census waves. The most significant
reduction in the labor force participation gap has occurred in Brazil and Spain, while the greatest
decrease in the education gender gap has occurred in Kenya, Romania and Malaysia. There is
heterogeneity in the remaining countries. Regression analysis (Table 3, Column 2) shows that we
do not see a significant relationship between the change in the LFP gap and the change in the
education gap.
****Insert Figure 5b here****
Turning to the motherhood gap and the marriage gap, we see in Table 3, Columns 4 and
6, that the labor force participation gap is significantly associated with both gaps. However, the
reduction in the gender education gap has not, in general, been associated with declines in the
marriage and motherhood gaps. These gaps have responded instead to other factors that have
!!!!!!!!!!!!!!!!!!!!!!!!!!!!!!!!!!!!!!!!!!!!!!!!!!!!!!!!!!!!!21 As previously mentioned, the latest wave of the Indian Census (2011) could show a different pattern, as at the aggregate level, both the labor force and education gaps appear to have narrowed.

23
!
affected the overall gap in men and women’s LFP. Apart from Iraq and Palestine, there appears
to be a positive relationship between these gaps; the smaller the difference in employment among
married and single women, the smaller the difference between employment among women with
children and women without. We imagine that many of the factors making marriage more
compatible with work also tend to make motherhood more compatible with work. A greater
understanding of the interactions between household and market production and within
household decision-making process and bargaining power can shed more light on married and
mothers’ labor supply decisions (Beneria and Sen 1986, 1982; Folbre 1986). Column 7 in Table
3 confirms the positive relationship between these gaps after controlling for other factors.
****Insert Figure 5c here****
X. How Much of the Labor Force Participation Gap Can Be Accounted For?
Finally, we ask how much of the gender gap in labor force participation can be explained
by size of the education, marriage, and motherhood gaps. In the spirit of a Oaxaca-Blinder
decomposition (Oaxaca, 1973; Blinder, 1973) we present a descriptive analysis where we ask
what the labor force participation of women would be if the different groups we are studying all
had the same level of education. Following the approach of Blinder (1973) and Oaxaca (1973),
which has typically been used to study mean outcome differences between groups (e.g. wage
gaps by gender or race), the approach decomposes a differential between two groups into a part
that is “explained” by group differences in observable characteristics, such as education or work
experience, and a residual part that cannot be accounted for by observable differences. In this
approach, a counterfactual wage equation is created where e.g. women are given the
characteristics of men. This “unexplained” part is often used as a measure for discrimination,

24
!
but it also includes the effect of differences between the groups in unobserved characteristics.
Most applications of this decomposition approach can be found in the labor market and
discrimination literature (for meta-studies see, e. g., Stanley and Jarrell 1998 or Weichselbaumer
and Winter-Ebmer 2005) and more recent studies have developed alternative approaches for
creating counterfactuals (e.g. Fortin, Lemieux and Firpo 2010; Machado and Mata, 2004).
In our case, we seek to calculate how much of the labor force participation gap between
men and women is explained by the other gaps we have analyzed thus far (education, marriage,
and motherhood) and how much of the labor force participation gap is left unexplained. To do
this, we create counterfactual labor force participation gaps by running regressions of women’s
labor force participation as a function of years of education, age, and dummies for married
women and for having 3 or more children. To do this, we run the following regression for
women (age 35-44) only for each country separately using the full individual-level Census
sample:
FemaleLFPi =! +"1educationi +"2agei +"3marriedi +"4childreni +#i
Then, similar to the Oaxaca-Blinder approach, we create counterfactual levels of
women’s labor force participation by predicting their labor force participation using the
estimated regression coefficients above if (1) they had men’s average level of education all other
variables equal; (2) if they if they did not have a “marriage gap” all other variables equal
(omitting the coefficient on marriage); (3) if they did not have a “motherhood gap” all other
variables equal (omitting coefficients for having children). We then use these counterfactual
levels of women’s labor force participation to create counterfactual labor force participation gaps
(the difference between men’s actual labor force participation and the counterfactual levels for
women).

25
!
Next, we subtract the counterfactuals based on (1)-(3) from the actual labor force
participation gap, and we are left with the portion of the labor force participation gap that is
unexplained by the other gaps, and how much of the actual gap in labor force participation
between men and women is reduced given each hypothetical case.
Table 4 shows the results of the analysis. Column 1 shows the actual level of the labor
force participation gap for each country. In Column 2, we show how much women’s labor force
participation would change if women had men’s average level of education (for countries where
the gender gap has not reversed only). Giving women men’s level of education leads to
reductions of the LFP gap of several percentage points in some African and Arab countries
including Guinea, Iraq, Kenya, Palestine, and Uganda. For other countries, the reduction is
modest. Note that India is a unique case, where the LFP gap increases, which arises due to a
negative relationship between education and labor force participation.22
****Insert Table 4 here****
Column 3 shows the change in the LFP gap if we eliminate the marriage gap. For many
countries, the reduction is large, particularly in Bolivia, Cambodia, Chile, Kenya, Kyrgyz
Republic, Malaysia, Panama, Spain, and Venezuela. In China, Ghana, Mongolia, and Slovenia,
we note that LFP gap increases in the hypothetical scenario, so marriage in these countries is
associated with greater labor force participation among women.
Next, we turn to the motherhood gap. We show in Column 4 what happens to the LFP
gap when we give each mother with three or more children the LFP of an equivalent woman
without children. We see that for many countries with a motherhood gap, the cells are blank
!!!!!!!!!!!!!!!!!!!!!!!!!!!!!!!!!!!!!!!!!!!!!!!!!!!!!!!!!!!!!22 As previously described this negative relationship may no longer hold when results are compared to the most recent wave.
26
!
because the gap actually increases in this counterfactual. In a few Latin American countries
(Argentina and Chile), a couple of Arab countries (Iraq and Palestine), and Hungary, the LFP
gap drops by a large amount when mothers are given the LFP of non-mothers.
Finally, in the last column we show the residual, or the share of the actual LFP gap that is
not explained by the counterfactuals based on eliminating the education, marriage, and
motherhood gaps. For most countries, a large share of the LFP gap remains unexplained after we
eliminate these other gaps. For a few countries, notably Cambodia, Chile, Hungary, Kenya, and
Malaysia, less than half of the gap is left unexplained after eliminating the gaps in the other
spheres, suggesting that in these countries, reducing the education, marriage, and motherhood
gaps will go a significant way towards reducing the overall LFP gap. However, consistent with
our previous analysis at the country level, other factors besides the education, marriage, and
motherhood gaps in LFP appear to explain the lion’s share of the overall gender gap in LFP for
most countries.
XI. Conclusion and Discussion
Development organizations and the Millennium Development Goals, which were signed
by leaders of 189 countries, have prioritized the beneficial effects of educating girls and
achieving gender equity in education. In this analysis we have documented that in many
countries, the gender education gap has now closed or even reversed, and all the countries in our
sample where the gender gap has not closed are developing countries. Yet, while the education
gap has closed or reversed in a majority of countries, other gaps regarding women’s
employment, particularly differences between married and single women, and mothers and non-
mothers, remain.

27
!
We document significant heterogeneity in terms of the size of gaps, the speed with which
they are closing, and how they are inter-related. While many studies have been carried out at the
national level usually for one country or for primarily developed countries, we have provided
cross-country comparisons of these gaps and for a large number of developing countries. Our
main conclusion is that there is no systematic pattern in how these gaps have changed over time
and further study is needed to understand what explains the divergent paths countries have taken.
It appears that the closing of the gender education gap does represent a “check in the mail” for
future reductions in the gender gap in labor force participation, but does not appear to be
significantly related to the gaps in employment between married and single women, and women
with and without children.
We find that in 22 of the 35 countries in our sample, the gap in labor force participation
between men and women is over 15% in the latest Census wave. Our counterfactual analysis
shows that closing the gender gap in education leads to a reduction of the gender gap in labor
force participation so that the gap is less than 15% for 10 out these 22 countries. Eliminating the
marriage gap leads only 4 of the 22 countries to have a labor force participation gap of less than
15%, and eliminating the motherhood gap leads 7 countries to have a gap less than 15%. Even
by ‘closing’ all the gaps we examined in the counterfactual analysis, for almost all countries, a
large share of the labor force participation gap remains unexplained - over 60% on average
across the countries in our sample. This suggests that for most countries, other factors beyond
those we examined here (education, marriage and motherhood) are playing a significant role in
explaining the size of the labor force participation gap.
The differences we observe among these countries in the size of the marriage and
motherhood gaps are likely related to how compatible work is with marriage and children. We

28
!
show that for several countries, reductions in these gaps would reduce the overall gap in labor
force participation significantly, but this would not be the case for many others.
Much of development policy aimed at achieving the Millennium Development Goals on
gender equity has focused on reducing gender gaps in schooling through policies that change
education costs or benefits (see e.g. Glick, 2008). We argue that focusing on education alone is
not enough and attention should be broadened to also include other policies, including those that
make work more compatible with marriage and motherhood. In fact, making these changes
might encourage further educational investments by women. Regarding the motherhood gap,
cultural attitudes, policies like availability of daycare or in-home help, urban transport, and other
factors may play a role in whether women with children work, and more analysis into the impact
of these factors on gender gaps is needed. However, it is clear that even after eliminating labor
force participation gaps associated with marriage and motherhood, female labor force
participation remains low in many countries for other reasons that require further study.

29
!
REFERENCES
Abu-Ghaida D. and S. Klasen (2004) “The Costs of Missing the Millennium Development Goal on Gender Equity,” World Development, (32)7:1075-107. Anderson, D. J., Binder, M., & Krause, K. (2002). “The motherhood wage penalty: Which mothers pay it and why?” American Economic Review, 354-358. Attanasio O., H. Low and V. Sanchez-Marcos (2009), “Explaining Changes in Female Labour Supply in a Life-cycle Model”, American Economic Review, 98(4):1517-52. Bandiera O. and A. Natraj (2011), “Does Gender Inequality Hinder Growth? The Evidence and its Policy Implications”, Background Paper in the World Development Report 2012, Washington DC: World Bank Publication. Barker D.K. and S.F. Feiner (2004), “Liberating Economics: Feminist Perspectives on Families, Work, and Globalization”, Ann Arbor: University of Michigan Press. Beblo Miriam and Renate Ortlieb (2012) “Absent from Work? The Impact of Household and Work Conditions in Germany”, Feminist Economics, 18(1).
Becker G.., (1991) “A Treatise on the Family”, expanded ed., Cambridge MA: Harvard University Press. Becker G., (1992) “The Economic Way of Looking at Life”, Nobel Lecture, December 9, 1992. Becker G. and H. G. Lewis (1973), “On the Interaction Between the Quantity and Quality of Children”, Journal of Political Economy, Part 2: New Economic Approaches to Fertility, 81 (2): S279--S288. Becker, G., K. M. Murphy and R. Tamura "Human Capital, Fertility, and Economic Growth." Journal of Political Economy, October 1990, 98(5, part 2):S12-S37. Behrman, J. and A. Deolalikar (1988) “Health and Nutrition.” In Handbook of Development Economics, Vol. 1, ed. Chenery, H. and T. Srinivasan. Amstardam, North Holland: 631-704! Beneria, Lourdes and Gita Sen. (1982). “Class and Gender Inequalities and Women's Role in Economic Development: Theoretical and Practical Implications.” Feminist Studies, 8, no. 1: 157!176. Beneria, Lourdes and Gita Sen. (1986). “Accumulation, Reproduction, and Women’s Role in Economic Development: Boserup Revisited.” In: Leacock, Eleanor and Helen I. Safa (Editors) Women's Work. South Hadley, MA: Bergin and Garvey Publishers: 141-157.

30
!
Blau F. D., and L. M. Kahn. 2007. “Changes in the labor supply behavior of married women: 1980!2000.” Journal of Labor Economics, 25(3): 393-438. Blinder, Alan S. 1973. Wage Discrimination: Reduced Form and Structural Estimates. Journal of Human Resources, 8 (4): 436–455. Boserup, Ester (1970), Woman’s Role in Economic Development, St. Martin’s Press, New York. Breierova, L. and E. Duflo (2004), “The impact of education on fertility and child mortality: Do fathers really matter less than mothers?”. NBER Working Paper No.10513. Caldwell, J. (1982). Theory of Fertility Decline. London: Academic Press. Dancer, D., Rammohan, A. and Smith, M. D. (2008), “Infant mortality and child nutrition in Bangladesh,” Health Economics, 17: 1015–035. Duflo E., P. Dupas, and M. Kremer (2010), "Education and Fertility: Experimental Evidence from Kenya?", MIT mimeo.
Duryea S., S. Galiani, H. Ñopo and C. Piras (2007). "The Educational Gender Gap in Latin America and the Caribbean," RES Working Papers 4510, Inter-American Development Bank, Research Department.
Elson, Diane. (1999). ‘‘Labor Markets as Gendered Institutions: Equality, Efficiency and Empowerment Issues.’’ World Development 27(3): 611–27.
Fernandez R. (2007), “Culture as Learning: The Evolution of Female Labor-Force Participation over a Century”, NBER Working Paper No. 13373.
Folbre, Nancy (1986) “Cleaning House: New Perspectives on Households and Economic Development,” Journal of Development Economics, 22, 5-40.
Folbre, Nancy (1994) “Children as Public Goods,” American Economic Review, 84:2, 86-90.
Folbre, Nancy and Lee Badgett (1999) “Assigning Care: Gender Norms and Economic Outcomes,” International Labour Review 138:3, 311-326.
Galor O. and D.N. Weil, (1996), “The Gender Gap, Fertility, and Growth”, American Economic Review, 86(3):374-387.
Glick P., (2008). “What Policies will Reduce Gender Schooling Gaps in Developing Countries: Evidence and Interpretation,” World Development, (36):1623-646. Glewwe P. (2000). “Why does mother’s schooling raise child health in developing countries? Evidence from Morocco,” Journal of Human Resources XXXIV: 124–59.

31
!
Goldin C. (1990). “Understanding the gender gap: An economic history of American women”, New York: Oxford University Press. Goldin C. (1994), “The U-Shaped Female Labor Force Function in Economic Development and Economic History”, NBER Working Paper No 4707. Goldin C. (2006), “The Quiet Revolution That Transformed Women’s Employment, Education, and Family”, American Economic Review, 96(2):1-21. Goldin, C., L. Katz, I. Kuziemko (2006) “The Homecoming of American College Women: The Reversal of the Gender Gap in College.” Journal of Economic Perspectives 20(Fall):133-56. Greenwood J. A. Seshadri and M. Yorukoglu (2005). “Engines of Liberation.” Review of Economic Studies, 72(1):109–33. Harkness, Susan, and Jane Waldfogel (1999). The Family Gap in Pay: Evidence from Seven Industrialised Countries. Centre for Analysis of Social Exclusion (CASE), LSE. Hausmann R., I. Ganguli and M. Viarengo (2009), “The Dynamics of the Gender Gap: how do Countries rank in terms of making Marriage and Motherhood compatible with Work?” in the Global Gender Gap Report 2009, Geneva: World Economic Forum Report Publication. Heim, B. T. 2007. “The incredible shrinking elasticities: Married female labor supply, 1978!2002.” Journal of Human Resources, 42(4):881!918. Huisman J. and J. Smits (2009), “Effects of Household- and District-Level Factors on Primary School Enrollment in 30 Developing Countries”, World Development, 37(1):179-93. !lkkaracan, Ipek (2012) “Why so Few Women in the Labor Market in Turkey?”, Feminist Economics, 18(1). Juhn, C. and K.M. Murphy. “Wage inequality and family labor supply.” Journal of Labor Economics, 15(1): 72!97. Killingsworth, M. and J. Heckman (1986), “Female labor supply: a survey”, in Ashenfelter and Layard, (eds) Handbook of Labor Economics, Vol I, Amsterdam: North Holland. Kingdon G.G. (2002), “Women, Education and Development”, in Reason and Revelation: Studies in the Babi and Baha'i Religions, 13, Los Angeles: Kalimat Press. Lam, D. and S. Duryea. (1999). “Effects of schooling on fertility, labour supply and investments in children, with evidence from Brazil,”,Journal of Human Resources, 34(1): 160–92.

32
!
Mammen, K. and C. Paxson. (2000). “Women’s work and economic development”. Journal of Economic Perspectives, 14(4): 41–64. McCrary, J. and H. Royer (2008). "The Effect of Female Education on Fertility and Infant Health: Evidence From School Entry Policies Using Exact Date of Birth", unpublished manuscript, Michigan University. Mammen, K. and Paxson, C. (2000). Women’s work and economic development, Journal of Economic Perspectives, 14(4): 141–164.
Mincer J., (1974) “Schooling, Experience, and Earnings”, New York: Columbia University Press for the National Bureau of Economic Research. Minnesota Population Center. Integrated Public Use Microdata Series, International: Version 5.0 [Machine-readable database]. Minneapolis: University of Minnesota, 2011. Oaxaca, R. (1973) “Male-Female Wage Differentials in Urban Labor Markets.” International Economic Review, 14: 693–709. Osili U. and B. Long (2008), “Does female schooling reduce fertility? Evidence from Nigeria,” Journal of Development Economics, 87(1):57-75. Pritchett L. (2001), “Where Has All the Education Gone?” World Bank Economic Review, (15):3367-91. Pritchett L. (2006), “Does Learning to Add Up Add Up?” Handbook of Education Economics , F. Welch and E. H (eds.), Chapter 11. Schultz, T. (1988). Education investments and returns, Handbook of development economics, 1: 543–630. Schultz T.P. (1994), “Human capital, family planning and their effects on population growth”. American Economic Review, 84(2): 255–60. Schultz T.P. (2002), “Why Governments Should Invest More to Educate Girls,” World Development, 30(2): 207-25. Sigle-Rushton, Wendy, and Jane Waldfogel (2007). "Motherhood and women's earnings in Anglo-American, Continental European, and Nordic countries." Feminist Economics 13.2: 55-91. Sinha, Jania N. (1967), “Dynamics of female participation in economic activity in a developing economy”, in: United Nations, Department of Economic and Social Affairs, Proceedings of the

33
!
World Population Conference, Belgrade, 30 August – 10 September 1965, Vol. IV, UN Publications, New York. Strauss J. and D. Thomas, (1995) "Human Resources: Empirical modelling of household and family decisions," in J. Behrman and T.N. Srinivasan (eds.), Handbook of Development Economics, Vol III. Sundaram A. and R. Vanneman (2008), “Gender Differentials in Literacy in India: The Intriguing Relationship with Women’s Labor Force Participation”, World Development, 36(1):128-43. Waldfogel, Jane (1998). “Understanding the “family gap” in pay for women with children.” The Journal of Economic Perspectives 12.1: 137-156. Willis R.J., (1973) “A New Approach to the Economic Theory of Fertility,” Journal of Political Economy, 81 (2): S14–S64. World Bank (2012). “Girls’ Education”, http://www.worldbank.org/education/girls.
World Bank (2011),, “Doing Business Measuring Business Regulations: Historical Data Sets and Trends Data”, http://www.doingbusiness.org.

34
!
Figure 1a: Year of Birth of First Cohort where Education Gap was closed
Notes: The gender education gap is calculated using the IPUMS Census data. It is calculated as the average years of education of men minus women for individuals born in a given year. The year of birth of the first cohort where the education gap was closed in the most recent available wave of the census is indicated for each country. For countries where no year is indicated, the gender gap in education has not reversed. Figure 1b: Women’s Average Years of Schooling with respect to the Gender Education Gap, most recent census wave
!"#$%&%'(
!)*+",'(
-./,0,'(-"'1,/(
2'%'3'(
24,/$(
24,%'(
2./.56,'(2.*+'7,8'( 98)'3."(
:"'%8$(
;"$$8$(
;),%$'(
<)%#'"=(
>%3,'(
>*"'$/(
?$%='(
@'/'=*,'(
@$A,8.(
@.%#./,'(B'%'5'(
B4,/,CC,%$*(
B."+)#'/(
7.5'%,'(
7D'%3'(
E.)+4!F",8'(
EC',%(
G#'%3'(
G%,+$3(E+'+$*(
G%,+$3E+'+$*(
H$%$1)$/'(
I(
J(
K(
L(
M(
NI(
NJ(
NK(
OIPQ( I( IPQ( N( NPQ( J( JPQ( R(
!"#
$%&'()*
$+,-$(.$
,+'("
/(012""
34%-(
5$%6$+(5,7(4%(8691,:"%(
Notes: The gender education gap is calculated using the IPUMS Census data. It is defined as the average years of education of men minus women for individuals age 35-44.

35
!
Figure 1c: Change in the Gender Education Gap with respect to the Initial Gap
!"#$%&%'(
!)*+",'(
-./,0,'(
-"'1,/(
2'%'3'(
24,/$(
24,%'(2./.56,'(
2.*+'7,8'(
98)'3."(
:"'%8$( ;"$$8$(
<)%#'"=(
>%3,'(
>*"'$/(
?'/'=*,'(
?$@,8.(
A'%'5'(
A4,/,BB,%$*(
A."+)#'/(
7.5'%,'(
C.)+4!D",8'(
CB',%(
E#'%3'(
E%,+$3F,%#3.5(
E%,+$3C+'+$*(
G$%$1)$/'(
HI(
HJKL(
HJKM(
HJKN(
HJKO(
J(
JKO(
HJKP( J( JKP( I( IKP( O( OKP( Q(
!"#$
%&'($')"
&'*&
$+&,'*#-
'($'.+/
0#12
$'
*&$+&,'*#-'($'.+/0#12$3'4,&5(2/6'!&$6/6'
/.R(,%,&'/S(",*,%#(
/.R(,%,&'/S(D'//,%#( 4,#4(,%,&'/S(D'//,%#(
4,#4(,%,&'/S(",*,%#(
Notes: The education gap is calculated using the IPUMS Census data. It is defined as the difference in years of schooling between men and women, aged 35-44; two outliers, Guinea and Mongolia have been excluded.
Figure 2a: Labor Force Participation Gap
Notes: The labor force participation gap is calculated using the IPUMS Census data. It is defined as the share of men in the labor force (employed or unemployed and job seeking) minus women in the labor force for individuals age 35-44.

36
!
Figure 2b: Change in the Gender Labor Force Participation Gap with respect to the Initial Gap
Notes: The labor force participation gap is calculated using the IPUMS Census data. It is defined as the share of men in the labor force minus women in the labor force for individuals age 35-44.
Figure 2c: Women’s Labor Force Participation vs. GDP per capita, PPP
Note: GDP data comes from the World Development indicators. Women’s labor force participation is calculated using the IPUMS Census data. It is defined as the measure of the total number of women working or seeking work age 35-44 as a share of all women 35-44.
37
!
Figure 2d: Labor Force Participation Gap vs. GDP per capita, PPP
Notes: GDP data comes from the World Development indicators. The labor force participation gap is calculated using the IPUMS Census data. The labor force participation gap calculated as the share of men in the labor force minus women in the labor force for individuals age 35-44.
Figure 2e. Labor Force Participation Gap vs. Share of Urban Population
Notes: The share of the population living in urban areas data comes from the World Development indicators. The labor force participation gap is calculated using the IPUMS Census data. The labor force participation gap calculated as the share of men in the labor force minus women in the labor force for individuals age 35-44.

38
!
Figure 3a: Ratio of Married to Single Women Employment Rate
Note: Measures constructed from the IPUMS Census data. The marriage gap is the difference in employment between single and married women aged 35-44.
Figure 3b: Change in the Marriage Gap vs. Initial Gap
Note: Measures constructed from the IPUMS Census data. The marriage gap is the difference in employment between single and married women aged 35-44. The change in the marriage gap is the percentage change in marriage gap between the last two censuses, for women aged 35–44.

39
!
Figure 4a: Motherhood Gap, Most Recent Wave
!"#$% !"#&'% !"#&% !"#('% !"#(% !"#"'% "% "#"'% "#(% "#('%
)*+,-+%./,0+%12+,+%
3+4/56,/%78/9,+:%;<+,-+%=/4+>?5%@28,+%A5>+/4%A>+B%
CD?92EF>8G+%1?8,/+%
.0><0H)/I?J48G%@+:JD-8+%C4DK/,8+%=D48K8+%
E>:/,8+%)D:+,8+%
32848II8,/5%=>+H84%
7/,/H?/4+%3+,+:+%1>//G/%LG?+-D>%@D4D:J8+%M?,<+>0%N/O8GD%E?59>8+%
E></,6,+%@D59+)8G+%
@284/%
!"#$%&$""'()*+(
Notes: Measure constructed from the IPUMS Census data. The motherhood gap is the share of women with three children working minus the share of women with no children working for women aged 35-44.
Figure 4b: Change in the Motherhood gap vs. the Initial Gap
Notes: Measure constructed from the IPUMS Census data. The motherhood gap is the share of women with three children working minus the share of women with no children working for women aged 35-44.

40
!
Figure 5a: Gender Gap in Education vs. Gender Gap in Labor Force Participation
!"#$%&%'(
!)*+",'(
-./,0,'(-"'1,/(
2'%'3'(
24,/$(
24,%'(
2./.56,'(
2.*+'(7,8'( 98)'3."(
:"'%8$(
;"$$8$(
;),%$'(
<)%#'"=(
>%3,'(
>*"'$/(?$%='(
@'/'=*,'(@$A,8.(
@.%#./,'(
B'%'5'(
B4,/,CC,%$*(
B."+)#'/(7.5'%,'(
7D'%3'(
E.)+4(!F",8'(
EC',%(G#'%3'(
G%,+$3(E+'+$*(
H$%$1)$/'(
H,$+%'5(
IJK(
LJK(
MJK(
NJK(
OJK(
PJK(
QJK(
RJK(
SJJK(
SSJK(
SIJK(
TJUN( J( JUN( S( SUN( I( IUN( L(
!"#$$%&'
$()*+
,-.+
,-/$
%,-0,1$%&'$2-$3045&6*-$$
Notes: Measure constructed from the IPUMS Census data. The gender education gap is the difference between men’s and women’s years of schooling for men and women aged 35-44. The labor force participation gap is calculated as the share of men in the labor force divided by the share of women in the labor force for individuals age 35-44.
Figure 5b: Change in Gender Gap in Education vs. Change in Gender Gap in Labor Force Participation
!"#$%&%'(!)*+",'(
-./,0,'(
-"'1,/(
2'%'3'(
24,/$(
24,%'(
2./.56,'(
2.*+'(7,8'(
98)'3."(:"'%8$(
;"$$8$(
<)%#'"=(
>%3,'(
>*"'$/(
?$%='(
@'/'=*,'(
@$A,8.(
B'%'5'(
B."+)#'/(
7.5'%,'(C.)+4(!D",8'(
CE',%(
F#'%3'(
F%,+$3(C+'+$*(
G$%$1)$/'(
G,$+%'5(
HIJKL(
HIJK(
HIJML(
HIJM(
HIJIL(
I(
IJIL(
IJM(
HMJK( HM( HIJN( HIJO( HIJP( HIJK( I( IJK(
!"#$
%&'($')*+',#-
'
!"#$%&'($'./01#23$',#-'
Notes: Measure constructed from the IPUMS Census data. The gender education gap is the difference between men’s and women’s years of schooling for men and women aged 35-44. The labor force participation gap calculated as the share of men in the labor force minus women in the labor force for individuals age 35-44. This graph is presented for those countries for which we have information on both the gender and the labor force participation gaps.

41
!
Figure 5c: Motherhood Gap vs. Marriage Gap
Notes: Measure constructed from the IPUMS Census data. The motherhood gap is the share of women with three children working minus the share of women with no children working for women aged 35-44. The marriage gap is the difference in employment between single and married women aged 35-44.
42
!
Table 1. The Reversal of the Gender Education Gap
Country Birth year of cohort in which
gap reversed Gap in years of
schooling at age 25 Belarus 1945 -0.4 Argentina 1946 -0.8 Colombia 1949 -0.7 Panama 1949 -0.6 Brazil 1953 -0.8 France 1953 -0.7 Philippines 1953 -0.6 Mongolia 1954 -1.2 Venezuela 1955 -0.9 Armenia 1955 -0.5 Kyrgyz Rep 1955 -0.1 Portugal 1956 -1.0 United States 1956 0.0 Israel 1958 -0.1 Costa Rica 1960 -0.4 Canada 1961 -0.5 Hungary 1963 -0.3 Greece 1964 -0.8 Spain 1967 -0.7 Slovenia 1970 -0.6 Chile 1972 -0.1 Malaysia 1973 -0.2 Ecuador 1974 -0.3 Jordan 1974 -0.2 Vietnam 1974 0.0 South Africa 1975 -0.4 Romania 1975 -0.1 Mexico 0.1 Austria 0.1 Rwanda 0.6 Kenya 0.6 Palestine 0.8 China 0.8 Iraq 1.1 Bolivia 1.2 Guinea 1.3 India 1.5 Cambodia 1.6 Uganda 1.6 Ghana 2.1
Notes: The United Kingdom has been excluded as data is missing for the individuals age 25.

43
!
Table 2. Gender Gap Regressions
(1) (2) (3) (4)
LFP Gap Change in LFP Gap
Marriage Gap
Motherhood Gap
Log GDP 1.146** 0.801*** -0.700 -0.228 (0.537) (0.261) (0.710) (0.554) Log GDP-Squared -0.0685** -0.0442*** 0.0434 0.00805 (0.0305) (0.0149) (0.0412) (0.0323) Rigidity of Employment Index -0.000105 -0.00158** -0.00153 0.000740 (0.00185) (0.000705) (0.00243) (0.00191) Share Urban 0.287 -0.232** -0.422 -0.0521 (0.217) (0.0922) (0.260) (0.216) LFP Gap, Previous Census -0.223** (0.0794) Women’s LFP 0.919*** 0.212 (0.0974) (0.165) Constant -4.613** -3.365*** 3.907 1.113 (2.260) (1.088) (2.948) (2.329) Standard errors in parentheses *** p<0.01, ** p<0.05, * p<0.1
Notes: Regressions are based on the gender gap measures described in the data section. GDP per capita and level of urbanization come from the World Development Indicators. The Rigidity of Employment Index (0=less rigid, 100=more rigid) comes from the World Bank’s “Doing Business” dataset. This index measures the regulation of employment, specifically the hiring and firing of workers and the rigidity of working hours. It is the average of three indexes: a difficulty of hiring index, a rigidity of hours index, and a difficulty of firing index. The results do not change when including Share of Urban-Squared.

44
!
Table 3. Regressions Showing the Relationship Between Gaps
(1) (2) (3) (4) (5) (6) (7)
LFP Gap Change in LFP Gap
Marriage Gap
Marriage Gap
Motherhood Gap
Motherhood Gap
Motherhood Gap
Log GDP 1.535*** 0.386 -0.215 -0.0154 -0.198 -0.00976 -0.0421 (0.532) (0.399) (0.268) (0.371) (0.540) (0.501) (0.495) Log GDP-Squared -0.0894*** -0.0202 0.0125 0.00239 0.00617 -0.00310 -0.00175 (0.0303) (0.0222) (0.0156) (0.0214) (0.0314) (0.0288) (0.0285) Rigidity of Employment Index -0.000632 -0.000482 0.000852 0.000935 0.00100 0.000307 -0.000126 (0.00174) (0.000814) (0.000929) (0.00128) (0.00187) (0.00172) (0.00172) Share Urban 0.287 -0.336*** 0.00282 0.0205 -0.0309 0.0408 0.00642 (0.246) (0.108) (0.103) (0.168) (0.208) (0.227) (0.220) Education Gap 0.0739 0.0459 0.0539 0.0322 (0.0566) (0.0441) (0.0595) (0.0593) Change in Education Gap -0.0173 (0.0622) LFP Gap -0.985*** -0.989*** -0.283 -0.500** (0.0823) (0.159) (0.166) (0.215) Marriage Gap 0.444** (0.189) Constant -6.422*** -1.668 1.955* 0.954 1.187 0.247 -0.0191 (2.238) (1.707) (1.112) (1.576) (2.242) (2.124) (2.149) Observations 27 22 28 19 28 19 19 R-squared 0.425 0.505 0.907 0.865 0.518 0.751 0.753
Notes: Standard errors in parentheses, *** p<0.01, ** p<0.05, * p<0.1. Regressions are based on the gender gap measures described in the data section. GDP per capita and level of urbanization come from the World Development Indicators. The Rigidity of Employment Index (0=less rigid, 100=more rigid) comes from the World Bank’s “Doing Business” dataset. The results do not change when including Share of Urban-Squared.

45
!
Table 4. Labor Force Participation Gap Counterfactual Analysis
Census Wave (1) Actual LFP
Gap
(2) Gap w/o
Education Gap
(3) Gap w/o
Marriage Gap
(4) Gap w/o
Motherhood Gap
(5) Residual (% of
Actual Gap) Argentina 2001 29.17 - 19.61 25.95 56% Armenia 2001 9.88 - 6.94 - 70% Belarus 1999 0.28 - - - Bolivia 2001 34.12 33.61 20.51 - 59% Brazil 2000 29.96 - 19.04 - 64% Cambodia 1998 14.23 14.93 5.54 - 44% Canada 2001 10.85 - 9.62 - 89% Chile 2002 45.48 45.04 26.36 38.33 41% China 1990 9.27 8.81 - - 95% Colombia 2005 30.81 - 25.15 - 82% Costa Rica 2000
53.38 - 31.34 52.37 57%
Ecuador 2001 51.25 50.26 34.79 - 66% Ghana 2000 5.74 5.58 - - 97% Greece 2001 34.5 33.8 23.55 34.28 66% Guinea 1996 21.37 18.7 16.43 - 64% Hungary 2001 7.55 7.09 7.17 3.99 42% India 1999 52.89 - 34.57 - 65% Iraq 1997 73.21 62.91 65.62 67.55 68% Israel 1995 16.94 16.8 12.96 - 76% Jordan 2004 64.87 62.54 41.22 - 60% Kenya 1999 13.38 11.07 7.31 - 37% Kyrgyz Rep 1999
8.39 - 3.34 - 40%
Malaysia 2000 52.91 51.45 19.8 - 35% Mongolia 2000 7.89 - - - Palestine 1997 84.15 79.11 70.86 74.53 67% Panama 2000 40.96 - 24.04 39.85 56% Portugal 2001 15.63 - 12.13 - 78% Romania 2002 18.02 16.22 17.04 16.17 74% Rwanda 2002 - - - - Slovenia 2002 3.44 3.26 - - 95% Spain 2001 29.38 - 16.73 - 57% Uganda 2002 20.02 17.25 13.75 - 55% US 2005 15.74 - 9.48 - 60% Venezuela 2001
38.66 - 21.98 37.75 55%
Vietnam 1999 13.58 13.82 7.47 - 57% Notes: (1) is the labor force participation gap calculated as the share of men in the labor force minus women in the labor force for individuals age 35-44. For (2)-(4), a counterfactual gap is calculated based on a regression of women’s labor force participation as a function of years of education, age, dummy for married and dummies for children (0-6+). Then, we predict women’s labor force participation if they had men’s level of education all other variables equal in (2); if they if they did not have “marriage gap” all

46
!
other variables equal (omitted coefficient on marriage) in (3); if they did not have a “Motherhood gap” all other variables equal (omitted coefficients for children 3+) in (4). (5) is the share of the actual gap left after subtracting (2)-(4) from the actual gap. If a cell is blank, the relevant gap has reversed or is 0, or increases the LFP gap, which is noted in the text. In some cases a cell is blank because variables are missing, i.e. the number of children ever born: not available for Canada, India, Jordan, Mongolia, Portugal, Spain, Uganda, United States; Labor force participation: not available for Mexico.

47
!
APPENDIX
Table A1. Analytic Samples
Country Sample 1 Sample 2
Waves of the Census Waves of the Census Argentina 2001 1991, 2001 Armenia 2001 Austria 2001 1991, 2001 Belarus 1999 Bolivia 2001 1992, 2001 Brazil 2000 1991, 2000 Cambodia 1998 Canada 2001 1991, 2001 Chile 2002 1992, 2002 China 1990 1982, 1990 Colombia 2005 1993, 2005 Costa Rica 2000 1984, 2000 Ecuador 2001 1990, 2001 France 1999 1990, 1999 Ghana 2000 Greece 2001 1991, 2001 Guinea 1996 Hungary 2001 1990, 2001 India 1999 1987, 1999 Iraq 1997 Israel 1995 1972, 1995 Jordan 2004 Kenya 1999 1989, 1999 Kyrgyz Rep 1999 Malaysia 2000 1991, 2000 Mexico 2005 1995, 2005 Mongolia 2000 Palestine 1997 Panama 2000 1990, 2000 Philippines 2000 Portugal 2001 1991, 2001 Romania 2002 1992, 2002 Rwanda 2002 1991, 2002 Slovenia 2002 South Africa 2007 2001, 2007 Spain 2001 1991, 2001 Uganda 2002 1991, 2002 United Kingdom 2001 1991, 2001 United States 2005 2000, 2005 Venezuela 2001 1990, 2001 Vietnam 1999 1989, 1999

48
!
Table A2. Women’s LFP Regressions
(1) (2) (3) (4)
Women’s LFP
Women’s LFP
Women’s LFP
Women’s LFP
Log GDP -1.506*** -1.070** -1.096** -1.127*
(0.444) (0.500) (0.526) (0.559)
Log GDP-Squared
0.0868*** 0.0647** 0.0661** 0.0680**
(0.0258) (0.0282) (0.0296) (0.0316)
Share Urban -0.368* -0.241 -0.247
(0.213) (0.712) (0.723)
Share Urban-Squared -0.112 -0.106
(0.600) (0.610)
Rigidity of Employment Index 0.000353
(0.00187)
Constant 7.086*** 5.216** 5.301** 5.416**
(1.884) (2.130) (2.208) (2.324)
Observations 38 38 38 38
R-squared 0.251 0.311 0.312 0.313
Notes: Standard errors in parentheses, *** p<0.01, ** p<0.05, * p<0.1. Regressions are based on the gender gap measures described in the data section. GDP per capita and level of urbanization come from the World Development Indicators. The Rigidity of Employment Index (0=less rigid, 100=more rigid) comes from the World Bank’s Doing Business dataset.
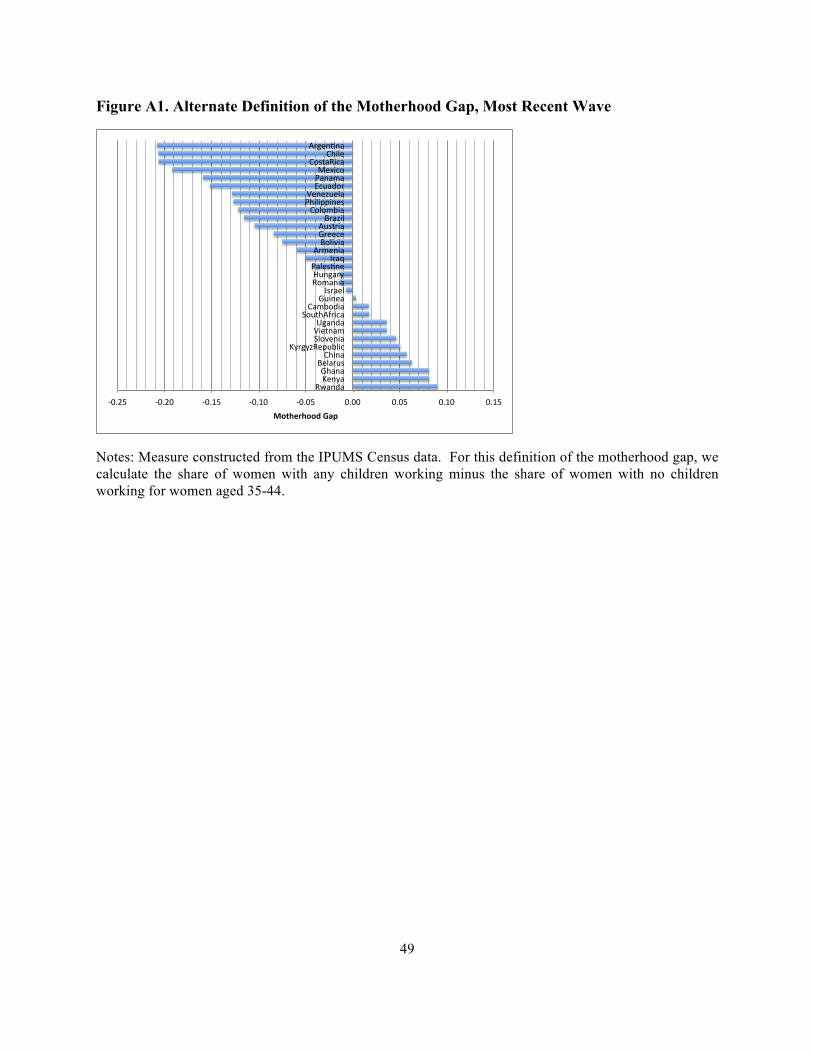
49
!
Figure A1. Alternate Definition of the Motherhood Gap, Most Recent Wave
!"#$%& !"#$"& !"#'%& !"#'"& !"#"%& "#""& "#"%& "#'"& "#'%&
()*+,*&-.+/*&01*+*&2.3*456&718+*&
-/49/:(.;5<38=&>3?@.+8*&A8.B+*C&D9*+,*&
>?5B1EF48=*&7*C<?,8*&
058+.*&G64*.3&
(?C*+8*&H5+9*4/&I*3.6J+.&
G4*K&E4C.+8*&2?38@8*&04..=.&E56B48*&24*:83&
7?3?C<8*&I1838;;8+.6&A.+.:5.3*&L=5*,?4&I*+*C*&M.N8=?&
7?6B*(8=*&7183.&
E49.+J+*&
!"#$%&$""'()*+(
Notes: Measure constructed from the IPUMS Census data. For this definition of the motherhood gap, we calculate the share of women with any children working minus the share of women with no children working for women aged 35-44.