Embed Size (px)
Citation preview
Received March 14, 2020, accepted March 31, 2020, date of publication April 8, 2020, date of current version April 20, 2020.
Digital Object Identifier 10.1109/ACCESS.2020.2986437
Cloud-Based Implementation of an AutomaticCoverage Estimation Methodology forSelf-Organising NetworkDANIEL FERNANDES 1, DIOGO CLEMENTE 1, GABRIELA SOARES 2,PEDRO SEBASTIÃO 1,(Member, IEEE), FRANCISCO CERCAS 1,(Senior Member, IEEE),RUI DINIS 3,(Senior Member, IEEE), AND LÚCIO S. FERREIRA 2,4,5, (Senior Member, IEEE)1Instituto Universitário de Lisboa (ISCTE-IUL)/IT—Instituto de Telecomunicações, Av. das Forças Armadas, 1649-026 Lisbon, Portugal2Multivision—Consultoria, Rua Soeiro Pereira Gomes, Lote N◦1, 3◦C, 1600-196 Lisbon, Portugal3FCT—Universidade Nova de Lisboa, Monte da Caparica, 2829-516 Caparica, Portugal4ISTEC, A. das Linhas de Torres 179, 1750-142 Lisboa, Portugal5INESC—ID/COPELABS Lusófona University, Campo Grande, 376, 1749-024 Lisbon, Portugal
Corresponding author: Daniel Fernandes ([email protected])
This work was supported in part by the OptiNET-5G project and co-funded by the Centro2020, Portugal2020, and European Union underProject 023304, in part by the Instituto de Telecomunicações, FCT/MCTES through national funds and co-funded by the EU funds underProject UIDB/EEA/50008/2020.
ABSTRACT One of the main concerns of telecommunications operators is related to network coverage.A weak coverage can lead to a performance decrease, not only in the user experience, when using theoperators’ services, such as multimedia streaming, but also in the overall Quality of Service. This paperpresents a novel cloud-based framework of a semi-empirical propagation model that estimates the coveragein a precise way. The novelty of this model is that it is automatically calibrated by using drive testmeasurements, terrain morphology, buildings in the area, configurations of the network itself and keyperformance indicators, automatically extracted from the operator’s network. Requirements and use casesare presented as motivations for this methodology. The results achieve an accuracy of about 5 dB, allowingoperators to obtain accurate neighbour lists, optimise network planning and automate certain actions on thenetwork by enabling the Self-Organising Network concept. The cloud implementation enables a fast and easyintegration with other network management and monitoring tools, such as the Metric platform, optimisingoperators’ resource usage recurring to elastic resources on-demand when needed. This implementation wasintegrated into the Metric platform, which is currently available to be used by several operators.
INDEX TERMS Cloud implementation, coverage estimation, drive tests, measurements, propagation model.
I. INTRODUCTIONNowadays, there is an increasing demand of mobile users,which also increases the use of telecommunication services,making network coverage estimation a concern for operators.According with [1], in 2018 75% of world population wascovered by 4G technology and with a predicted increase to90% in 2025. In 2025 it is also expected that about 65% ofworld population will be covered by 5G technology. A cor-rect estimation allows operators, not only the guarantee ofa better network coverage delivery to its users, but also toperform an efficient optimisation of their resources. This
The associate editor coordinating the review of this manuscript and
approving it for publication was Danping He .
estimation can be done by using several tools, from variousvendors [2], [3], that are commercially available. These toolshave important features that are very useful to telecommu-nication operators. However, most of these tools, like [4],require local installation on the operator’s machine, and thenetwork planning configuration tasks can be difficult andtime-consuming.
To simplify the planning process of a network, this paperpresents a novel cloud-based framework of a semi-empiricalpropagation that using Drive Test (DT) measurements, ter-rain morphology, buildings information and configurationsof the network itself to estimate the coverage in a preciseway. This optimised propagation model uses a cloud-basedimplementation, which allows its integration into a tool for
66456 This work is licensed under a Creative Commons Attribution 4.0 License. For more information, see https://creativecommons.org/licenses/by/4.0/ VOLUME 8, 2020
D. Fernandes et al.: Cloud-Based Implementation of an Automatic Coverage Estimation Methodology for SON
monitoring and management of telecommunications net-works, called Metric.
Several studies [5], [6] combine propagation models withDT measurements in order to define a realistic propagationmodel, each time the telecommunications operator wants.We observe that these studies use propagation models thatare only applicable to specific macro or micro cells sce-narios. In the literature we can also find adaptive systemscapable of performing automatic selection of the propagationmodel according to the scenario (micro and macro cells) [7].We observe that these different propagation models can onlybe used under specific conditions, also specifying antennadistance or height. The proposed propagation model intendsto overcome these situations and to be generally applicable,regardless of the scenario or antenna properties, for example.In addition, the main novelty of this propagation model isthat it is automatically calibrated with drive tests as wellas network Key Performance Indicators (KPIs), providinga realistic estimation of path loss without the need for thiscalibration to be triggered by the user.
This work extends the ideas presented in [8]–[10], wherethe cell reach value and the handover distance were consid-ered in the calibration of the model. These authors, namelyin [9] and [10], include the terrain morphology but they omitthe possibility of a Line of Sight (LoS) between the MobileTerminal (MT) and the Base Station (BS). Despite the cloudimplementation, using Amazon Web Services (AWS), hasalready been used in [10], this proposed work presents fur-ther enhancements that generalise and increase its precision,mostly related with fine-tuning of our propagation model.Several aspects, such as the reuse of previous DT measure-ments and the application of LoS between the Mobile Ter-minal (MT) and the Base Station (BS) were also considered.One of the novelties of this work is the inclusion of an eval-uation metric that allows to estimate the performance of theproposed propagation model. A very important feature of ourpropagationmodel is that it fully automates network coverageestimation, while maintaining a simple user intervention, andall aspects of it are carefully detailed. This model can beused by telecommunication operators not only for coverageestimation based in new DT measurements, but also for celland KPI configurations.
Proposed semi-empirical propagation model, named Auto-matically Calibrated SPM (ACSPM) presents several innova-tions. This model integrates various types of KPIs, networkconfigurations, different propagation models, terrain mor-phology data (as accurate as possible) and the LoS betweenthe Mobile Terminal (MT) and Base Station (BS). The grid isdynamically created. In this paper, the implementation withcloud services, the integration in the Metric platform and thevarious application for this work, like the network coverageestimation, the crossed sectors identification, the 2G, 3G and4G planning and the traffic prediction, are presented.
The cloud implementation of the ACSPM enables theMetric platform to have several users to access resourcessimultaneously, such as the coverage of an antenna. It is also
possible to execute multiple tasks at the same time, allowingthe user to perform other actions while, e.g. the platformis computing a cell coverage. After the model is integratedinto the Metric platform it is possible for telecommunicationsoperators, not only to visualise the realistic area that a givencell covers, but also to optimise the entire network, namely inthe establishment of neighbouring cells list.
The main contribution of this paper is the creation of anovel generalised and new semi-empirical propagationmodelthat can be applied simultaneously in micro and macro cellscenarios. This propagation model introduces the innovationof being automatically calibrated with DTs as well as net-work KPIs, providing a realistic estimation of path loss eachtime data related to the antenna (tilt, azimuth, KPIs, DTs)is added or changed. The automation of the calibration pro-cess follows the Self-Organising Network (SON) paradigm,makes it possible to reduce the human effort, which resultsin a financial impact on the management of these networks.The overall accuracy achieved by using this ACSPM model,through the use of newmeasurements and the constant updateand storage of results in the cloud, allows telecommunica-tions operators to efficiently plan and optimise their 2G, 3Gand 4G and 5G networks and to identify possible problemswithin their network configurations. The implementation ofthis methodology is based on cloud-services, efficiently pro-viding elastic, on-demand and pay-per-use computation andstorage resources. The resulting work pattern proves to beeffective in the integration of various inputs and in the provi-sion of realistic estimations of received signal levels aroundantennas, essential for network planning and optimisation.
The paper has the following structure: In Section II motiva-tion for the use of cloud-based software as a service solutions,is presented, highlighting the tool Metric where this method-ology is implemented and integrated. Key aspects related tothe estimation of coverage in cellular networks are presentedin Section III. In Section IV a unified coverage estimationmethodology and use cases are presented, being the coverageestimation detailed in Section V. In Section VI, the imple-mentation using AWS and its integration in Metric plat-form is presented. To test and evaluate the proposed model,Section VII presents a reference scenario and performanceevaluation results are shown in Section VIII. Section IXhighlights several applications where the proposed ACSPMis currently used and the conclusion of this paper is presentedin Section X.
II. PLANNING AND OPTIMISATION TOOLS, PARADIGMSAND CLOUD-SERVICESThis section presents an overview of the tools, paradigms andservices related or useful for the management of telecommu-nication networks.
There is currently a growing demand for services accessedthrough mobile devices, which represents a problem fortelecommunications operators due to the excessive usageof network resources. This demand, which is in constantgrowing, makes mobile networks more complex and dense,
VOLUME 8, 2020 66457

D. Fernandes et al.: Cloud-Based Implementation of an Automatic Coverage Estimation Methodology for SON
resulting also in a more complex planning and optimisationrequirements.
As each operator seeks to provide the best service forits customers, there is a major concern for proper planningand optimisation of mobile networks. Several vendors likeNokia [2] and Huawei [3], associated with the equipmentthey sell, provide planning and optimisation software. Eachvendor has associated an Operations Support System (OSS),which congregates configuration parameters as well as KPIs.Still, these software products are proprietary, vendor-specific.Telecommunications operators must recur to these expensivetools from various vendors, not being able to have a unifiedvision of their network. Vendor-agnostic tools, like Atoll [4],installed on a local machine, enable the planning and optimi-sation of their network, independently of the vendor, as longas these follow the standards of each technology - Global Sys-tem for Mobile Communications (GSM), Universal MobileTelecommunication System (UMTS), or Long Term Evolu-tion (LTE). These can be also associated to theOSS, although,this process requires additional configurations.
Besides the vendors’ heterogeneity, telecommunicationsoperators have heterogeneous networks as well. Within thesame network, technologies such as 2G, 3G and 4G coexistand interact, each one with different specificities. The net-works’ densification, the increasing number of users, andthe quality assurance demand for telecommunication opera-tors force networks to continuously generate a huge amountof information per cell and per user. One way to monitorthe network’s performance is through the several availableKPIs which results from a mathematical manipulation ofseveral counters (component information). To increase thenetwork’s quality, it is possible to optimise the various cell’sconfiguration parameters to reach the optimal configura-tion and the consequent optimal performance, required byoperators.
Once there is a considerable amount of information percell and per user through time, the generated data can beanalysed through a big data approach. The concept of bigdata considers the volume and the variety of data, the valuegenerated through analysis, the velocity at which the data isgenerated and processed. An example of big data applicationis to acquire dynamic data from different sources, in differentformats [11]. Big data methods have been used in recentstudies to implement Self-Organising Network [12]–[14].SON aims to reduce operational costs, investment costs andoffers a better Quality of Service (QoS) to users [15]. Thedescription of some use cases related to SON is present in [16]and some of these implementations are presented below:• Self-Planning - When a node is added to the network,the site location and hardware settings are selected;
• Self-Deployment - This implementation receives thedata from Self-Planning and performs the installationand validation of the node;
• Self-Optimisation - Using data obtained from networkusers, such asMT, the network settings are automaticallyadjusted;
• Self-Healing - A set of preventive actions keeps thenetwork operational and prevents disruptive networkproblems from arising.
These four use cases can associate the use of SONnetworksas networks with the ‘‘plug & play’’ feature. This featurecan be useful for telecommunication operators, since it cansimplify the implementation andmaintenance of the network.Whenever an incident is detected, the network can minimiseits effect until a permanent resolution decision is made.
With the advance of SON networks, the volume of datauseful for the correct operation of the network has increased,and this data may no longer require human intervention inits handling. Ideally, the information should be collected andautomatically made available to the SON algorithms [17].In this paper, in order for this automation to be easily imple-mented, all the adjacent computing processes were migratedto a cloud-based implementation. This migration presentsthe advantages of a cloud-based implementation being veryscalable and ready for big data manipulation. This implemen-tation provide users with storage and processing services.
Cloud services are a solution based on a flexible, scalableand abstract infrastructure for the user. One of the mainadvantages of using cloud-based services is that the usercan explore all the available resources and is only chargedon the applications used in a per-second price basis, whichcorresponds to the effective running time of processing nodes.Another advantage of these services is that they are alwaysavailable and accessible through any device connected toInternet. There are many public cloud providers such as Ama-zonWeb Services (AWS) [18], Google Cloud [19], MicrosoftAzure [20].
However, in order to be able to migrate the managementof the telecommunications network to the cloud, it is neces-sary to make some changes to the core of the network. Thefunctions performed by the Radio Access Network (RAN),namely the management of base stations, are now performedin a centralised component with a cloud-based architecture,called C-RAN or RAN-as-a-Service (RANaaS). This changeallows for Network Functions Virtualisation (NFV) and scal-ability that was previously non-existent [21]. With C-RAN,the management of telecommunications networks can nowmove to a cloud environment and thus the concept of SONcan be applied.
A Software-as-a-Service (SaaS) is a web-based applicationthat does not require any local installation on any computer orserver. This avoids machine limitations and constraints, andother operating system related restrictions. A SON solutionfor telecommunications networks, Metric [22], was devel-oped by Multivision [23]. It is a web-based SaaS applicationthat can be accessed by any browser on any device, enablingthe monitoring and maintenance of a network, allowing SONimplementation and quick access to information on the cur-rent status of the network. Being one of the main objectivesthe aggregation of data in a single platform, Metric platformis based on a set of modules. These modules allow the uploadof data, regardless of the hardware vendors or network data
66458 VOLUME 8, 2020

D. Fernandes et al.: Cloud-Based Implementation of an Automatic Coverage Estimation Methodology for SON
source. A subsequent manipulation of the data allows themto be visualised on a map, in the form of a table or even inthe form of a report. This analysis allows critical situationsto be immediately identified in the network, namely crossedfeeders, cell in overshooting, missing neighbours and consis-tency checks. Finally, this platform allows the scheduling ofnetwork validation tasks that, depending on the input data,can trigger correction/improvement actions in the network.
III. ESTIMATION OF COVERAGE IN CELLULAR NETWORKSThe estimation of coverage is of key importance in cellularnetworks planning. These wireless networks must rely inrealistic predictions of coverage of their antennas to effi-ciently provide service within specific geographical areas,taking into account service requirements and offered trafficload predictions. Several methodologies and procedures areavailable to estimate coverage in cellular networks and arepresented and detailed in this section.
A. WIRELESS COVERAGEWireless coverage allowsMTs to access services and featuresprovided by BSs cells. The aggregation and control of theseBS is the responsibility of the RAN. The coverage area of acell depends on several parameters. Among these parametersare those that defines the transmitted signal such as the posi-tion of the antenna, its radiation diagram, the azimuth, the tilt,and the transmission power. The signal received by the MTis the result of the transmitted signal by BS and the path lossattenuation. The location vector p, identifying a position withits latitude, longitude and height, the received signal levelfrom antenna a operating at frequency f is given by [24]:
Prx[dBm](f , a,p) = Ptx[dBm](a)+ Gtx(ϕp − ϕa, θp − θa)[dB]−L(f , a,p)[dB], (1)
where,• Ptx [dBm]: Transmitted power;• Gtx [dB]: Transmitted antenna gain, considering theantenna’s vertical and horizontal diagrams, for the ver-tical θ and horizontal ϕ direction between antenna loca-tion vector a (antenna latitude, longitude and height,ha), and position p, using the deviation of the antennaazimuth ϕa and tilt θa;
• L [dB]: Path loss attenuation between a and p (x, y, z)positions.
In order to simply the process, it is considered that the gainof the receiving antenna is 0 dB.
For an antenna located at vector location a its coveragearea Ca is given by the set of points of the service area A thatsatisfy the condition:
Ca = {p ∈ A : Prx [dBm](f , a,p) ≥ Prxmin [dBm]}, (2)
where Prxmin is the system’s sensitivity, i.e., the minimumreceived signal level required to establish a connection witha terminal.
In order for telecommunication operators to provide theirservices to customers, a preliminary study is carried out on
the locations where the antennas should be placed to obtain alarge coverage area. These antennas can be divided accordingto their function, having macro-cells that are responsible forthe coverage, the micro-cells responsible for the capacity andthe femto-cells that provide the capacity to specific zones.
A weak cellular planning can lead to gaps in coverage andthe proper provision of services to users is impossible. It istherefore essential to correctly estimate coverage in order toallow a correct configuration of parameters such as identifica-tion of neighbouring cells and identification of overshootingor crossed sectors problems.
B. PROPAGATION MODELSA propagation model attempts to represent how anelectromagnetic signal propagates, and has two types ofapplication [25]:
1) Plan, design, test and validate a wireless system;2) Optimisation of wireless systems. Operators use these
models, which represent reality accurately as possible,to simulate the impact in the network when certainparameters are modified.
According to [26], [27], propagation models can be classi-fied according to the type of information used. They can beclassified as:• Empirical: Empirical models are created through fieldmeasurements, while not considering the terrain infor-mation. They represent a particular propagation environ-ment. This has the advantage that these models are sim-ple and efficient to use. However, it has the disadvantagethat it cannot be used in another environment withoutbeing updated.
• Semi-Empirical: While empirical models are specificto a particular propagation environment, semi-empiricalmodels use terrain information such as the elevation andheight of buildings, which makes these models muchmore specific to a particular region.
• Deterministic: Deterministic models combine the lawsof electromagnetic wave propagation with terrain infor-mation. These models present more realistic results buthave strong computational requirements.
In general, telecommunication operators use Empiri-cal models for the design and comparison of systemsand the Semi-Empirical and Deterministic models fornetwork planning and deployment. Some of the mostwell-known propagationmodels are empirical models such asOkumura-Hata [28], Mishra [29] and Mishra [29] applied tomacro and micro-cells, respectively. There are other modelsthat extend these like Standard PropagationModel (SPM) [4].
In order to make propagation models more realistic,it is possible to calibrate them using real data. These cal-ibrations can be performed through Artificial Neural Net-works (ANNs) and they are strongly discussed in [30]–[32].Despite the use of ANNs, the limitations of the propaga-tion models still exist. For example, on an Okumura-Hataimplementation (using ANNs or not), can only be appliedat distances greater than 1 km, for a given frequency and
VOLUME 8, 2020 66459

D. Fernandes et al.: Cloud-Based Implementation of an Automatic Coverage Estimation Methodology for SON
TABLE 1. Conditions under which the models are applicable.
for a given propagation environment. For heterogeneous net-works, where several technologies working simultaneously atdifferent frequencies, the calibrated models cannot be used.In order to reduce the limitation presented above, a calibratedpropagation model was presented in [33], whose main dis-advantage is that it requires the type of environment and itsspecifications in the calibration process.
In order to generate a propagation model that can be usedin heterogeneous networks regardless of the type of propaga-tion environment, this research uses the Walfish-Ikegami andSPM propagation models, used in micro cell and macro cellscenarios, respectively.
One propagation model typically used in micro cell sce-narios is the Walfish-Ikegami model [29]. Table 1 presentsthe conditions under which it is applicable.
For this research, in the distance where the model isapplied, considering LoS, its path loss is given by:
LWalfish[dB] = 42.6+ 26log(dBS[km] )+ 20log(f[MHz]), (3)
where dBS is the distance between BS and the MT and f isthe frequency.
A macro cell model is the SPM [4]. The SPM is anextension of the Okumura-Hata propagation model and itsextension COST 231-Hata. The validity intervals, Table 1,must be observed.
The SPM [4] is an extension of the Okumura-Hata prop-agation model and its extension COST 231-Hata, being amacro cell model. The validity intervals, Table 1, must beobserved. The path loss calculation of the SPMmodel is givenby:
LSPM[dB] = K1 + K2log(dBS[m] )+ K3log(hBS[m] )
+K4Ldif + K5log(dBS[m] )log(hBS[m] )
+K6(hMT[m] )+K7log(hMT[m] )+Kclutter f (clutter),
(4)
where,• K1 [dB]: Constant offset;• K2: Coefficient for log(dBS );• dBS [m]: Distance between BS and the MT;• K3: Coefficient for log(hBS );• hBS [m]: Height of BS;• K4: Coefficient for diffraction calculation;• Ldif [dB]: Loss due to diffraction over an obstructedpath;
• K5: Coefficient for log(dBS )log(hBS );• K6: Coefficient for hMT ;• hMT [m]: Height of MT;
TABLE 2. Typical values for the SPM coefficient parameters.
• K7: Coefficient for log(hMt );• Kclutter : Coefficient for Kclutter ;• f (clutter): Average of weighted losses due to clutter;
The coefficients parameters explained above are limitedto the presented in Table 2. Although the frequency of theantenna and the attenuation coefficient is not present in 8, thisis considered in the K1 factor.Although this model is based from the Okumura-Hata
model, the SPM allows values of elevation, diffraction loss,among other parameters in the calculation of path loss, mak-ing the model more accurate and realistic.
C. COVERAGE MONITORINGIn order to enable telecommunications operators to collectdata with network quality information, some field measure-ments, called Drive Tests (DT), are made. As a rule, theseDTs are collected using a vehicle with radio equipment thattravels along a predefined route, collecting data from a certainarea and each geolocatedmeasuring point. The analysis of theDTs allows operators to understand network failures, such asareas with weak coverage, making it possible for operatorsto perform corrective measures (like the placement of a newbase station). The reception signal suffers some effects likeshadowing, slow and fast fading [25]. When working withdiscrete areas, each one of the sub-areas considered, the sig-nal suffers from fast fading. The use of DTs measurementsallows the neutralisation of this effect.
Despite the precise information revealed by the DTs, theirexecution can be expensive and requires allocation of humanresources. The information collected only refers to areas withroads, which limits the true perception of the entire network.
In order to make use of DTs data more efficiently, a stan-dardisation was proposed. This would reduce the costs asso-ciated with their execution, allowing them to be made bya MT. This standardisation is called Minimisation of DriveTests (MDT) and in addition to the objectives mentionedabove for DTs, these are triggered whenever there is theimplementation of a new base station, the construction ofnew roads or buildings and if there are complaints fromcustomers [34]. MDT is available in the vast majority ofdevices, and it is operators’ decision to activate this func-tionality. For the user, the only drawback is the additionalpower consumption. However, and if the measurements aregeolocated, it is possible to create a realistic view of the signalat various points in a cell. By using this data in the proposed
66460 VOLUME 8, 2020

D. Fernandes et al.: Cloud-Based Implementation of an Automatic Coverage Estimation Methodology for SON
model, signal estimation over an entire cell area will becomemore precise and accurate.
D. AVAILABLE NETWORK PERFORMANCE INDICATORSRELATED TO COVERAGEIn the OSS are available, for the operators, performanceindicators, KPIs. These indicators, such as Cell Reach canhelp in estimating coverage. When an MT connects to a BS,the BS estimates the propagation delay of the communicationand sends this value to MT allowing for adjustment in thetransmission time ensuring that all communications fromdifferent MTs in different places and at different times arriveat BS at the same time. This setting in the transmissionsallows the minimisation of interference in the uplink signalsof MTs.
Depending on the technology used, the propagation delaypresents different denominations. For 2G is referred to thetiming advance indicator and for 3G and 4G the propagationdelay indicator. These indicators are discrete values definedby each of the vendors. After the information is collected, it isstored and made available in the OSS in the form of counters,which registers the number of occurrences within a giventime period [35], allowing an understanding overview of thegeographical distribution of MTs within rings of specificranges.
The propagation delay can be used to estimate the distancebetween the BS andMT. Considering that an electromagneticsignal propagates at the speed of light, c, and the propagationdelays, tprop, the distance is given by:
dprop[m] = c× tprop[s] (5)
When network planning is performed, telecommunicationsoperators combine some configuration parameters in orderto obtain a certain cell size or a planned cell size. This sizecan be considered as the maximum range of the cell wherecommunications can occur.
IV. NOVEL CELLS COVERAGE ESTIMATION WORKPATTERNSeveral methodologies currently used by operators related tocell coverage estimation were presented in the former section.The present work aims to propose a unified methodology tointegrate them all and reach a realistic estimation of cov-erage for any antenna, based on a varied set of informa-tion: terrain information, antenna configurations, propagationmodels, DT measurements, and KPIs. To present it, firsta motivation is presented, highlighting the identified needsas requirements for a new methodology. Then, a small usecase that exemplifies the way the proposed methodologycan be used. Finally, the overall architectural framework ispresented, its components being detailed in later sections.
A. MOTIVATION AND REQUIREMENTSIn this section, a motivation and requirements for a unifiedcoverage estimation methodology are presented, based oncurrent practices of operators.
Within the planning and optimisation activities of atelecommunication operator, a key task is the estimation ofthe coverage area of the cells of its network. For exam-ple, given a cell of, e.g., expected 7 km range, the receivepower level within the surrounding geographical area ofthe antenna must be estimated in order to evaluate how itfits with the neighbouring cells. For it, considering the cur-rently used models, the operator will need to apply two dis-tinct propagation models, as the range of micro-cell models(Walfish-Ikegami) only applies up to 5 km, while a macrocell model (SPM) only applies from 1 km on. In this sense,a unified model capable of predicting coverage would be veryuseful for operators.
To achieve a more realistic estimation of the signal level,the operator recurs to DTs. Still, the criteria to determinethe specific areas for the measurement campaign is manytimes random, whichmay question from the start the usabilityof such campaigns. These measurements, once collected,are manually processed by the engineers following arbitraryprocedures. They aim at manually fitting certain parametersof the propagation models in order to adapt the model’sprediction to the real measurements. This curve fitting istime consuming and erroneous, as statistical indicators ofDT measurements (average, standard deviation of measure-ments) are used, still not taking into account the specificgeographic location of them. In fact, propagation conditionsof a geographical area where DTs are done may not berepresentative for another area. Some operators tend to regu-larly do extensive and expensive DT campaigns to evaluatethe quality of the network. Still, they do not have tools toprocess this large amounts of data nor integrate them in theirplanning and optimisation tools. In this sense, a coverageprediction model automatically calibrated with available DTmeasurements would be of key value. A model that wouldtake into consideration the geographical position of each DT,using these geolocatedmeasurements to weight a propagationmodel to build a complete map of estimated coverage (toestimate coverage in a given position, DTs that would benearby, in similar propagation conditions, would have moreweight than farther DTs). This model would be able to easilyintegrate MDT measurements, enabling to build a realisticpicture of the received signal level around any antenna. Thiswould require an efficient infrastructure for the storage andprocessing of DT measurements, and computation of prop-agation grids for each antenna. We think that the use ofcloud-services enables an elastic and efficient storage andprocessing of resources on-demand.
The operator also has available several KPIs. In partic-ular, as formerly discussed, the availability of propagationdelay measurements for every connection of each cell is ofprecious value, enabling to characterise the spatial statisticaldistribution of users using the cell. In particular, it enables todetermine the cell reach. Combined with signal level config-urations that trigger handover procedures, these are importantindicator that should be integrated in a realistic coverageestimation model of a given cell.
VOLUME 8, 2020 66461
D. Fernandes et al.: Cloud-Based Implementation of an Automatic Coverage Estimation Methodology for SON
On the other side, one of the challenges for an operator isthe variety of infrastructure providers (Nokia, Huawei, Eric-sson) and technologies (2G, 3G, 4G, 5G) that compose theirnetwork. Each having its specific OSS, with specific KPIs.Manufacturers tend in fact to have different ways of comput-ing KPIs, resulting in incompatible indicators, if we want tohave a common view. In this sense, a unified view of KPIsand configuration parameters is essential. It shall be availablein a single platform. Ideally, cloud-based, enabling to beavailable anywhere, and recurring to elastic and on-demandcomputation and storage resources.
B. USE CASESThree use cases are presented below to illustrate the advan-tages of the proposed methodology, illustrated in Fig. 1.
Consider an operator of a large cellular network with thou-sands of cells of various technologies and vendors. He hasavailable detailed terrain elevation and building data, as wellas a large variety of DT measurement campaigns of its cells.He has also available, from each manufacturer’s OSS, infor-mation of antennas’ configuration as well as numerous KPIs,as represented in Fig. 1 as inputs. The proposed methodologyis capable of integrating transparently all this data and useit to calibrate automatically a propagation model capable ofbuilding with great precision, for each cell, geo-referencedattenuation orPrx grids, as illustrated in Fig. 1. Each time newDT measurements are uploaded, or when configuration orKPI changes occur, the computation of new grids is automat-ically triggered thanks to a work pattern based on on-demandelastic cloud processing and storage resources. In this way,the operator has always available updated information of itsnetwork, without the need of human intervention.
A simple use case is when an operator receives a reportspecifying that a given geographic area has coverage prob-lems. The available grids of antennas from the area of interestcan be easily combined in a heatmap to identify with preci-sion the zones with poor signal.
Another use case is related to a typical situation wherethe increase of traffic in a site requires the swap froma single omni-directional antenna to a tri-sectorized site.For it, each antenna must be configured (Ptx , azimuth andtilt). Several DT measurements are available for the orig-inal omni-directional antenna, as well as terrain data. Theproposed methodology is capable of creating a realistic Prxgrid for each antenna, and build heatmaps of coverage forvarious antenna configurations. This large amount of data canbe easily processed thanks to cloud on-demand processingresources. Based on these, the operator can manually choose,or use an automatic methodology to select the best configu-ration (taking, e.g., into account neighbouring cells).
Finally, consider an operator that has activated MDT,where mobile terminals report to the OSS geo-located exten-sive measurements of Prx levels from neighbouring antennas.Although representing a very large amount of data, the pro-posed cloud-based methodology can automatically calibratea unified propagation model (for distances from tenths of
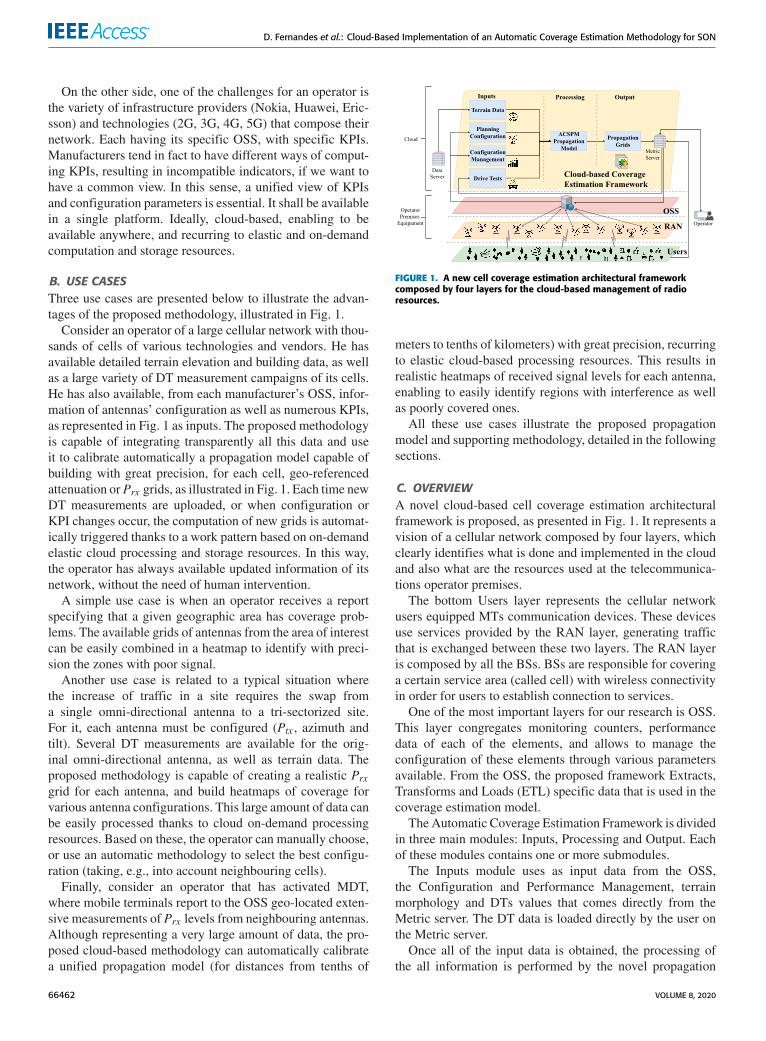
FIGURE 1. A new cell coverage estimation architectural frameworkcomposed by four layers for the cloud-based management of radioresources.
meters to tenths of kilometers) with great precision, recurringto elastic cloud-based processing resources. This results inrealistic heatmaps of received signal levels for each antenna,enabling to easily identify regions with interference as wellas poorly covered ones.
All these use cases illustrate the proposed propagationmodel and supporting methodology, detailed in the followingsections.
C. OVERVIEWA novel cloud-based cell coverage estimation architecturalframework is proposed, as presented in Fig. 1. It represents avision of a cellular network composed by four layers, whichclearly identifies what is done and implemented in the cloudand also what are the resources used at the telecommunica-tions operator premises.
The bottom Users layer represents the cellular networkusers equipped MTs communication devices. These devicesuse services provided by the RAN layer, generating trafficthat is exchanged between these two layers. The RAN layeris composed by all the BSs. BSs are responsible for coveringa certain service area (called cell) with wireless connectivityin order for users to establish connection to services.
One of the most important layers for our research is OSS.This layer congregates monitoring counters, performancedata of each of the elements, and allows to manage theconfiguration of these elements through various parametersavailable. From the OSS, the proposed framework Extracts,Transforms and Loads (ETL) specific data that is used in thecoverage estimation model.
The Automatic Coverage Estimation Framework is dividedin three main modules: Inputs, Processing and Output. Eachof these modules contains one or more submodules.
The Inputs module uses as input data from the OSS,the Configuration and Performance Management, terrainmorphology and DTs values that comes directly from theMetric server. The DT data is loaded directly by the user onthe Metric server.
Once all of the input data is obtained, the processing ofthe all information is performed by the novel propagation
66462 VOLUME 8, 2020

D. Fernandes et al.: Cloud-Based Implementation of an Automatic Coverage Estimation Methodology for SON
processing module, which is the most relevant element in theproposed framework, namely the generation of the Propaga-tionModel. In theOutput module, for a given cell the receivedsignal power grid is stored on the Metric server and becomesavailable to the user.
In the following section, the various components of the pro-cessing module represented in the architectural frameworkare detailed.
V. MODULES OF THE AUTOMATIC COVERAGEESTIMATION FRAMEWORKIn this section, a semi-empirical propagationmodel that accu-rately represents reality is detailed. It details and largelyextends initial ideas drafted over [8]–[10].
A. INPUTS MODULEThis subsection describes in detail each of the Input submod-ules of the architectural framework depicted in Fig. 1.
The Drive Tests submodule is an important input in thepresented architecture. DTs in this context are used to cal-ibrate the propagation model to a particular geographicalarea allowing the propagation model to accurately representreality. DTs data comes directly from the Metric server andis made available to an antenna at a given time for certainantenna characteristics over a given time period. The DT fora given position provides the receiving power, being repre-sented as PrxDT [dBm].There are configurable network parameters, which are
received through the OSS and serve to calibrate the model.These parameters are aggregated in the Configuration Man-agement module. Some of these parameters are related tothe antenna such as its model, the height (hBS ), the mechan-ical and electrical tilt (θmecBS and θeleBS ), the azimuth (ϕBS ),the position and the transmitting power (Ptx). Other param-eters are related to the technology, frequency, the MT sensi-tivity (Prxmin) and the geohash length, Geohash. The geohashis a encoder that transforms coordinates in a unique hash,where each length of geohash is associated with a certain cellsize [36]. Due to the projection systems considered, the geo-hash has different cell size values depending on the locationon the globe. After choosing the length of the geohash anddepending on the antenna location, pixel size is definedwhichis used in the grid construction. For example, if an antenna islocated near the Equator line, the cell size is smaller in termsof height when compared to an antenna located in northernEurope.
This information is essential for describing the charac-teristics of the BS. The handling of this data needs specialattention since it is manually entered by the user. This maycause problems if it is not entered correctly.
The Planning Management submodule corresponds tocounters collected by the OSS which monitors the operationof various aspects. An example of this data type is the cellreach which allows obtaining the Prxho value.The Terrain Data submodule is divided into two steps.
Initially, information on the terrain morphology of a given
TABLE 3. Parameters used in the propagation model.
work area is requested through the Application ProgrammingInterface (API) provided byOpenTopography [37]–[39]. ThisAPI returns elevation information for the considered area inraster format 30m by 30m pixels. This information is thenintegrated into the architecture displayed according to thesize of the pixel, defined by the user in the grid genera-tion. For each of the pixels created, the elevation value issearched in the API result. The next step is to add informa-tion about buildings and large structures that are requestedthrough the Overpass API [40]. This API returns informationfrom OpenStreetMap [41], where data is available under theOpen Database License (ODbL), and for a given workspace,it returns the height information of the existing buildings.For each of the pixels of the generated grid, the average ofthe heights of the buildings in that pixel is calculated. Thesetwo steps allow to obtain data similar to Light Detectionand Ranging (LiDAR) data and thus realistically portrays thepropagation environment.
Table 3 shows some of the parameters used in the propa-gation model.
B. PROCESSING MODULEThe core module of our framework is the novel Propaga-tion Model implemented in the cloud where, for a givencell, based on available inputs, it automatically estimates thecell’s path loss within an area of interest. It results fromthe combination of various aspects. In Fig. 2 it is possibleto verify the basic idea of the proposed propagation model,ACSPM. The ACSPM is calibrated with theWalfish-Ikegamimodel, power level at the handover distance. This calibrationallows adjusting SPM to a distance of less than 1 km andadjust to the reality of the antenna, using not only the han-dover information, but also the DT information. In Fig. 2,dmax corresponds to the maximum distance returned by the
VOLUME 8, 2020 66463

D. Fernandes et al.: Cloud-Based Implementation of an Automatic Coverage Estimation Methodology for SON
FIGURE 2. Illustration of the combination of various aspects for theconstruction of the ACSPM.
free space attenuation expression for a given power consid-ered. The remaining variables are defined in Table 3.
The needed inputs to obtain the propagation loss gridare listed in Table 3. Many of these are obtained along thesteps detailed in Section V-A. Taking as input the parame-ters discussed in Section V-A and presented in the Table 3,the calibration of the propagation model and computation ofpropagation loss grids follows the methodology illustratedin Fig. 3, which is detailed furthermore.
1) DIMENSIONING THE GRIDThe proposed methodology aims to estimate propagation lossaround a given cell. For that estimation, a rectangular area ofinterest around the cell area must be identified. Within thisarea, a grid of pixels is defined. For each pixel the path lossfrom the antenna shall be estimated.
The maximum communication range, dmax , is computedfor the antenna. Using the free space propagation model,it corresponds to the distance where, for the antenna’s PtxandGtx , the received power reaches theMT sensitivity,Prxmin .This range will define the initial size of the grid, centred inthe antenna position. The grid dimensions are then reducedfollowing a binary search iterative procedure for each of theborders of the grid. In each step, once there is no terrainelevation information, the SPM model, with no diffraction isused to evaluate Prx along the border, determining if, in thenext step of the binary search, one should search nearer orfarther from the current border. If for a given position the
received power is equal to aminimumpowerPrxmin it becomesone of the grid limits. This procedure is applied to each borderof the grid.
Once the dimension of the grid of the cell is defined,it is filled with geolocated pixels. The size of the pixels isspecified by the Geohash. Each of the geolocated pixel inthe grid will be used to store various information useful tothe model and specific for its position. This information isobtained throughout the process illustrated in Fig. 3 and isdetailed in the next sections. For each pixel, the followinginformation shall be obtained:• Terrain height information, hMT , of the pixel and thedistance to the BS, dBS ;
• Existence of LoS, expressed as diffraction losses, Ldif ;• Gain introduced by the antenna in that pixel, G(p);• Power information received from DTs, PrxDT ;• Specific SPM calibration parameters, K1 and K2;• Estimated path loss value for that pixel.
2) INCLUSION OF TERRAIN MORPHOLOGY INFORMATIONThe terrain morphology and the building heights are added toeach pixel. In order to validate if line of sight exists betweenthe pixel and the BS, the Bresenham’s line algorithm [42] isinitially used to find all pixels, in a straight line, between thepixel and the pixel where the BS is located, depicted in Fig. 3.
3) COMPUTATION OF DIFFRACTION LOSS FOR EACH PIXELThe Knife-Edge Diffraction model [43], [44] is used for eachpixel of the line between the antenna and the pixel, to esti-mate the diffraction losses in that path. For each pixel in thepath, a parameter ν is calculated according to the followingequation:
ν = h
√2λ
(1d1+
1d2
)(6)
where h is the obstruction height, i.e., height from the obstacletop to the Tx-Rx axis (straight line between transmitter andreceiver antennas), λ is the wavelength and d1 and d2 is thedistance between each side of the path and the obstacle. Aftercalculating the parameter ν for each pixel of the line, the pixelwith the highest value of ν is the pixel with the highestdiffraction loss. So if the value of ν < −0.78, Ldif = 0 dB
FIGURE 3. Steps for the computation of a propagation grid.
66464 VOLUME 8, 2020
D. Fernandes et al.: Cloud-Based Implementation of an Automatic Coverage Estimation Methodology for SON
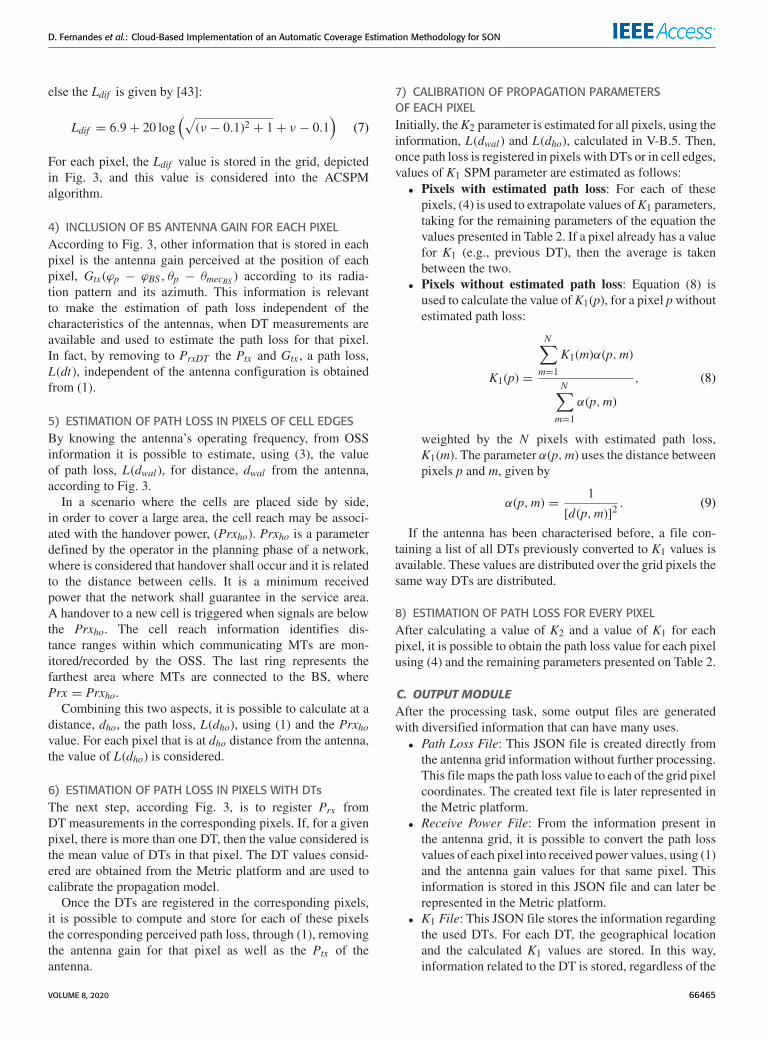
else the Ldif is given by [43]:
Ldif = 6.9+ 20 log(√
(ν − 0.1)2 + 1+ ν − 0.1)
(7)
For each pixel, the Ldif value is stored in the grid, depictedin Fig. 3, and this value is considered into the ACSPMalgorithm.
4) INCLUSION OF BS ANTENNA GAIN FOR EACH PIXELAccording to Fig. 3, other information that is stored in eachpixel is the antenna gain perceived at the position of eachpixel, Gtx(ϕp − ϕBS , θp − θmecBS ) according to its radia-tion pattern and its azimuth. This information is relevantto make the estimation of path loss independent of thecharacteristics of the antennas, when DT measurements areavailable and used to estimate the path loss for that pixel.In fact, by removing to PrxDT the Ptx and Gtx , a path loss,L(dt), independent of the antenna configuration is obtainedfrom (1).
5) ESTIMATION OF PATH LOSS IN PIXELS OF CELL EDGESBy knowing the antenna’s operating frequency, from OSSinformation it is possible to estimate, using (3), the valueof path loss, L(dwal), for distance, dwal from the antenna,according to Fig. 3.
In a scenario where the cells are placed side by side,in order to cover a large area, the cell reach may be associ-ated with the handover power, (Prxho). Prxho is a parameterdefined by the operator in the planning phase of a network,where is considered that handover shall occur and it is relatedto the distance between cells. It is a minimum receivedpower that the network shall guarantee in the service area.A handover to a new cell is triggered when signals are belowthe Prxho. The cell reach information identifies dis-tance ranges within which communicating MTs are mon-itored/recorded by the OSS. The last ring represents thefarthest area where MTs are connected to the BS, wherePrx = Prxho.Combining this two aspects, it is possible to calculate at a
distance, dho, the path loss, L(dho), using (1) and the Prxhovalue. For each pixel that is at dho distance from the antenna,the value of L(dho) is considered.
6) ESTIMATION OF PATH LOSS IN PIXELS WITH DTsThe next step, according Fig. 3, is to register Prx fromDT measurements in the corresponding pixels. If, for a givenpixel, there is more than one DT, then the value considered isthe mean value of DTs in that pixel. The DT values consid-ered are obtained from the Metric platform and are used tocalibrate the propagation model.
Once the DTs are registered in the corresponding pixels,it is possible to compute and store for each of these pixelsthe corresponding perceived path loss, through (1), removingthe antenna gain for that pixel as well as the Ptx of theantenna.
7) CALIBRATION OF PROPAGATION PARAMETERSOF EACH PIXELInitially, theK2 parameter is estimated for all pixels, using theinformation, L(dwal) and L(dho), calculated in V-B.5. Then,once path loss is registered in pixels with DTs or in cell edges,values of K1 SPM parameter are estimated as follows:• Pixels with estimated path loss: For each of thesepixels, (4) is used to extrapolate values ofK1 parameters,taking for the remaining parameters of the equation thevalues presented in Table 2. If a pixel already has a valuefor K1 (e.g., previous DT), then the average is takenbetween the two.
• Pixels without estimated path loss: Equation (8) isused to calculate the value ofK1(p), for a pixel pwithoutestimated path loss:
K1(p) =
N∑m=1
K1(m)α(p,m)
N∑m=1
α(p,m)
, (8)
weighted by the N pixels with estimated path loss,K1(m). The parameter α(p,m) uses the distance betweenpixels p and m, given by
α(p,m) =1
[d(p,m)]2. (9)
If the antenna has been characterised before, a file con-taining a list of all DTs previously converted to K1 values isavailable. These values are distributed over the grid pixels thesame way DTs are distributed.
8) ESTIMATION OF PATH LOSS FOR EVERY PIXELAfter calculating a value of K2 and a value of K1 for eachpixel, it is possible to obtain the path loss value for each pixelusing (4) and the remaining parameters presented on Table 2.
C. OUTPUT MODULEAfter the processing task, some output files are generatedwith diversified information that can have many uses.• Path Loss File: This JSON file is created directly fromthe antenna grid information without further processing.This filemaps the path loss value to each of the grid pixelcoordinates. The created text file is later represented inthe Metric platform.
• Receive Power File: From the information present inthe antenna grid, it is possible to convert the path lossvalues of each pixel into received power values, using (1)and the antenna gain values for that same pixel. Thisinformation is stored in this JSON file and can later berepresented in the Metric platform.
• K1 File: This JSON file stores the information regardingthe used DTs. For each DT, the geographical locationand the calculated K1 values are stored. In this way,information related to the DT is stored, regardless of the
VOLUME 8, 2020 66465

D. Fernandes et al.: Cloud-Based Implementation of an Automatic Coverage Estimation Methodology for SON
characteristics of the scenario under study. This infor-mation can later be reused for the same antenna.
D. EVALUATION METRICSTo evaluate the ACSPM, a common metric used in estimationmodels was applied. This metric allows not only to quantifythe accuracy of the model but also to validate the improve-ment in signal estimation.
One way to visualise the performance of the model is tomake a direct comparison between the SPM estimated valuesand the proposed model values. This analysis can be donevisually by representing the coverage estimation by eachmodel and comparing it or, for a more precise comparison,for a location where there are DT values.
In order to evaluate the proposed model estimation againstthe SPMmodel, a performancemetric can be used to calculatethe error between real values, yi, and estimated ones, yi.The Mean Absolute Error (MAE) metric was applied in bothmodels, using (10) [45].
MAE =1N
N∑i=1
|yi − yi|, (10)
where N refers to the number of considered values.To calculate the accuracy of the model, for a certain point
where DTs exist, DT value is ignored at the time of modelcalibration and its value is then compared with the valueestimated by the model, by using the absolute error. Thisprocess is called ‘‘blind calibration’’.
VI. IMPLEMENTATION AND INTEGRATION OF ACOVERAGE ESTIMATION WORK PATTERNAfter an exhaustive presentation of all the elements andmechanisms of the proposed propagation model, this sectiondiscusses the microservices provided by AWS used in theimplementation of the architectural framework. The imple-mentation and integration in the Metric platform is also pre-sented and detailed.
A. METRIC SaaS PLATFORMAs previously mentioned, the Metric platform allows bring-ing together in a single platform all the management oftelecommunications networks. The Metric platform collectsKPIs from the OSS of various manufacturers and technolo-gies, presenting a unified view of network performance.
Several features of the Metric platform were implementedin the cloud using AWS microservices. An example of thesefeatures is the processing of performance indicators and DTs.Another example of using AWS microservices is when thedata from multiple operators is received and integrated intothe platform to make it available in the ETL process.
Using the AWS microservices allows the Metric platformto automatically respond to user actions, such as processingcell information. The Metric platform shows the character-istics of each of the cells, like the antenna model, azimuthand other information. Whenever the user uploads a file with
FIGURE 4. Drive Test to a given cell, obtained through the Metric platform.
new cell information, a microservice on AWS is triggeredand allows to validate the cells with changed information andmake it available through the platform.
Multivision company is currently migrating the servicesavailable on the Metric platform to an implementation usingAWS. The new features developed will provide the platformwith new services using AWS microservices. Using AWScloud microservices allows Multivision to expand scalabilityand speed of the product developed to any device, in particu-lar in the processing of data through the ETL process.
In Fig. 4 a search result to a given cell, obtained throughthe Metric platform is presented. The search result includesthe DTs in a given time period.
B. AMAZON WEB SERVICESThe AWS provides services for performing computing tasks,such as Amazon Elastic Compute Cloud (Amazon EC2) andAWS Lambda. For database and storage purposes, microser-vices like Amazon Relational Database Service (AmazonRDS), Amazon DynamoDB, or Amazon Simple Storage Ser-vice (Amazon S3) can be used.
Amazon EC2 is a product that was developed with theaim of simplifying web-scale cloud computing. However, itsactions cannot be triggered in response to an event, whichmakes this product unattractive to the solution to be imple-mented, since it is intended that the presentedmodels run eachtime there is new cell information in a particular repository.This feature is supported by AWS Lambda which is a servicethat executes code in response to multiple events and supportsmultiple programming languages. It runs only when needed,which allows being automatically scalable. It can be usedwhenever the computing time is less than 15 minutes and thevirtual memory required is less than 500 MBytes. In terms ofmemory, Lambda only provides 3 GBytes.
For database and storage purposes, AWS provides theAmazon RDS, which is a relational database that supportsdifferent commercial and open-source products, and doesnot require users to install, configure, and manage them.
66466 VOLUME 8, 2020

D. Fernandes et al.: Cloud-Based Implementation of an Automatic Coverage Estimation Methodology for SON
FIGURE 5. Mobile network monitoring and optimisation architecture, with work pattern using AWS services that implements the ACSPM.
In case of non-relational databases, Amazon also offers auser-friendly service, called Amazon DynamoDB. A storageservice provided by AWS is Amazon S3, which allows usersto store files regardless of their size (each file can have amaximum of 5 TBytes), and is highly scalable. The internalmanagement of Amazon DynamoDB and Amazon S3 is doneby AWS without the need for user intervention.
To implement the architectural framework presentedin Fig. 1, the microservices AWS Lambda and AmazonS3 were used. Amazon S3 has an internal function thattriggers whenever a new cell configuration file is received,starting the whole process.
The system architecture developed and implemented inAWS is depicted in Fig. 5.
C. IMPLEMENTATION OF THE SYSTEM ARCHITECTUREA new model for estimating coverage, that combines varioustypes of information present in the architecture, is shownin Fig. 1. A proof of concept of this architecture and its imple-mentation using AWS is presented in Fig. 5. This figure alsoidentifies the functions that are performed in the cloud and theresources used at the telecommunications operator premises.This subsection explains the details of each of the componentsof the proposed system architecture.
1) OVERVIEWUsing AWS, a proof of concept for a coverage estimationmodel was implemented. This implementation of the modelwas performed in Java [46] programming language.
The function of each element of the architecture isexplained below.
The implementation of this proof of concept allows addinga new dimension in the scope of SON technology to theMetric platform, specifically for planning purposes. The useof this technology allows the decrease of overall operationalcosts, due to the reduction of human resources allocated tonetwork planning tasks.
2) AMAZON S3This implementation uses 6 independent Amazon S3 storagelocation. Each location stores distinct information, whichmay be used in the various stages of the process, or finalinformation to be made available to the user. This locationis also called a bucket.• Antennas Diagram’s Repository - For each antennamodel, frequency and tilt, an ‘‘.msi’’ file containing thevertical and horizontal gain of that antenna are stored.This information is provided by the suppliers of thevarious antennas.
• Cell Information - For each cell of the network thereis a JSON file that contains various information neces-sary for the process. Examples of this information arethe technology, the location and model of the antenna,the electric and mechanical tilt, the Ptx[dBm] amongothers. The presence of a file in this Amazon S3 buckettriggers the process.
• Grid Service Area - Stores a JSON file with a precom-puted grid for a cell. This grid contains for each pixelground elevation and building information, antennagain, antenna distance and the diffraction loss value.
• DTs - Cell DTs, whenever processed by Metric, are sentin form of a JSON file to this Amazon S3 bucket, and
VOLUME 8, 2020 66467

D. Fernandes et al.: Cloud-Based Implementation of an Automatic Coverage Estimation Methodology for SON
they can be used whenever necessary, allowing calibra-tion of the propagation model.
• K1 Information - For each of the studied cells, a JSONfile that compiles all the DTs performed for that cell isstored. Also the information of their coordinates and thevalue of the corresponding K1 factor are stored. This filehave the same usage as the DT file.
• Propagation Grids - In this Amazon S3 bucket,the propagation grids of each of the studied cell arestored in a JSONfile. This bucket directly serves as inputto Metric platform, making it possible to represent thepropagation of a cell.
3) AWS LAMBDA FUNCTIONSFor processing purposes, AWS Lambda features the execu-tion of code. This independent code executions are calledAWS Lambda functions. For this implementation, 2 AWSLambda functions are used and makes use of the data storedin the different Amazon S3 buckets as inputs. After the pro-cessing, the resulting information is stored in another bucketfor later use.• Antenna Grid Construction - From the informationfile present in Cell Information bucket, a AWS Lambdafunction creates a grid with the maximum propaga-tion distance of the cell. Each pixel of the grid hasuser-defined dimensions, and for each one, the antennagain considering the Antennas Diagram’s Repositorybucket files, antenna azimuth and tilts are calculated andstored. Elevation information requested from an externalserver is added to the grid, as explained in the moduleterrain data detailed in V-A. Once the elevation for eachpixel is obtained, it is possible to calculate the existenceor nonexistence of a LoS and the corresponding diffrac-tion loss between a given pixel and the antenna. Thisinformation is also stored in the pixel. When all thesecomputations are completed, the grid is stored in a JSONfile in Grid Service Area bucket for later use.
• Propagation Grid Construction - For each JSON filesin Cell Information bucket the corresponding JSON fileis searched in Grid Service Area bucket. When the fileis found, all the information is loaded as well as theexisting DTs for that cell. If that cell has already beenanalysed before, processed information from oldDT val-ues can be found inK1 Information bucket. This functionuses all these information to fine tune the propagationmodel in order to generate a JSONfile with the path loss.This file is stored in Propagation Grids bucket.
D. INTEGRATION WITH METRICIn order to proceed with the integration in the Metric plat-form, AWS services were used, as explained above.
When a user wants to obtain the propagation of a certaincell through the Metric platform, the user must input ‘‘Prop-agation’’ in the search box (represented in red in Fig. 6).This action will show the propagation grid for the given cell.If the propagation grid does not exist, the process shown
FIGURE 6. Cell coverage estimation module integrated in the Metricplatform.
in Fig. 5 will be triggered, and after process completion,the propagation grid will be shown to the user. An exampleof this situation is shown in Fig. 6, where the propagation ofa cell is presented to the user. This representation is the resultof an initial implementation.
This integration in the Metric platform provides it withnew features and allows users to explore, visualise and detectproblems in their networks. These features can be categorisedinto three sets:• Planning - With the propagation analysis, it is possibleto perform the planning of Broadcast Control Chan-nel (BCCH), Scrambling Codes (SC) and Physical CellID (PCI).
• Evaluation and Optimisation - Each time a new cellis implemented, it is possible to validate the coverageof this cell and the interference with the existing cells.To implement a new cell, it is necessary to initiallygenerate the propagation grid of that cell, place thisantenna in a map with the other antennas, and validatethe impacts on the network already implemented. It isalso possible through the analysis of coverage to opti-mise the network.
• Malfunction Detection - It is possible to detect somefailures in the functioning of the network related to plan-ning. These failures can be the identification of crosssectors and overshooting.
VII. REFERENCE SCENARIOIn order to test the presented architecture, a test scenariowas chosen. In this scenario, a macro cell with a 4G antennaimplemented in a northern European country is chosen. Thisantenna has a transmission power, Ptx , of 46 dBm and anazimuth value of 150◦. The chosen antenna is from Kathrein
66468 VOLUME 8, 2020

D. Fernandes et al.: Cloud-Based Implementation of an Automatic Coverage Estimation Methodology for SON
FIGURE 7. Horizontal and vertical radiation pattern of the referenceantenna.
brand and the model is 80010665v01 configured with themechanical and electrical tilt of 0◦. The horizontal and ver-tical radiation patterns are depicted in Fig. 7. The E-UTRAAbsolute Radio Frequency Channel Number (EARFCN) ofthe antenna is 6200, that corresponds to a downlink frequencyof 796 MHz.
For this scenario, a Geohash parameter of 8 was chosendue to the fact that the reference scenario is located in anorthern European region, where latitude presents highervalues. This parameter allows the pixels of the generatedgrid to have the dimensions of 38.2 m ×19.1 m (width ×height, approximately 2 : 1 pixel ratio) instead of using1 : 1 pixel ratio (square pixels), which represents a moreaccurate approximation for geographic representation.
In Fig. 8 it is possible to visualise the scenario under studyrepresented in the Metric platform. It is also representedin Fig. 8 the distance of the cell reach, which in this caseis about 12 km, and the DTs associated with this antenna.The distance from the cell reach is associated with a certainreceiving power that, in this case, was −85 dBm and up tothis distance is where more than 95% of the cell activity isperformed, that is, after this distance, the activity that involvesthe cell is practically residual.
For the scenario under study, the DTs performed over a6 month period were considered, which contains a total of248 measurement points. During these 6 months, the antennaconfigurations were not changed.
The grid generated, also represented in Fig. 8, covers anarea of approximately 625 km2 and the terrain elevation isdepicted in Fig. 9. The antenna and its azimuth is representedas well.
VIII. PERFORMANCE RESULTSThis section presents the results obtained with the propaga-tion model proposed in Fig. 3 and implemented as detailedin Fig. 5.
FIGURE 8. Propagation of a cell represented in the Metric platform.
FIGURE 9. Terrain elevation of the reference scenario, with indication ofthe antenna’s azimuth.
A. CELL COVERAGEFollowing the model depicted in Fig. 3 and once the gridhas been calculated, the attenuations due to obstacles andthe gain for each of the pixels are calculated. Later, the DTsare distributed among the various pixels of the grid. The248 DTs were distributed over 247 pixels, where one pixelcontains 2 DTs.
Through the analysis of Fig. 8, it is perceptible that as thedistance to the antenna increases, the value of the receivedpower decreases.
VOLUME 8, 2020 66469

D. Fernandes et al.: Cloud-Based Implementation of an Automatic Coverage Estimation Methodology for SON
FIGURE 10. Estimated received signal level using the proposedpropagation model.
With the tuning of the propagation model, either throughcell reach or through the DTs, the result is depicted in Fig. 10.
It is possible to verify that there are areas strongly influ-enced by DTs, which is the case of the lower zone wherethis influence can be seen. In this zone, the region between−102 dBm and −110 dBm (represented in yellow color),there is an area with a higher power signal received between−96 dBm and −102 dBm (represented in dark blue). Thisinfluence is due, not only by the values obtained with DTs,but also by themorphology of the terrain, which clearly showsthat, in this area, there is an terrain elevation.
Although the SPM model is used for distances biggerthan 1 km, in order to establish a comparison between theproposed model and a classical model, the SPM model wasapplied, with the parameters presented on Table 2. For thesame scenario, the result of the coverage estimation is pre-sented in Fig. 11.
For each pixel built with data fromDTs, the received powervalue is compared with the estimated power value for theproposed model for the SPM model as explained in V-D.
Since the proposed model is calibrated with DT values,the MAE between the estimated values and the DT valuesis zero for that pixel. However, there may be some smalloscillations for pixels with more than one DT, since the meanvalue for the received power is considered.
The comparison of the proposed ACSPM with the SPMcan also be calculated. To simplify the process, for eachpropagation model, the MAE between the estimated valuesand the DT values is calculated and shown in Table 4.
The results of ‘‘blind calibration’’, present in V-D, is alsodepicted in Table 4.
As already mentioned, the absolute error between the val-ues estimated through the proposed model and the DT values
FIGURE 11. Estimated received signal level using the SPM model.
TABLE 4. Absolute error between estimated values and DT values for the247 DT pixels.
is zero. When looking at a SPM model, the situation isdifferent. The absolute error between the value estimated bythe SPM and the DTs is quite variable and the MAE value isabout 14 dB. The maximum error can reach 30 dB.
For the accuracy of the proposed model, is visible that theMAE value, 5 dB is about 8 dB lower when compared withthe SPM model. The maximum value is also lower, almostone-third the value of SPM model.
B. IMPACT OF DT ON THE PROPOSED MODELSince the proposed model is calibrated using DTs values,it is important to validate the impact on the number of DTsused in the model calibration. Not only the amount of DTsis important but also their distribution around the antennaas the propagation conditions are variable even for the samedistance due to the different angles.
Fig. 12 depicts the MAE values, between the values esti-mated through the proposed model and the DT values, forthe set used for evaluation of the methodology. A secondorder polynomial regression is also shown to visualise MAEtrend when DTs measurements increase. As expected, MAEvalues decrease when more DTs are considered. The increaseof available DT measurements, namely with MDT, makethe proposed model more robust to outliers, automaticallyimproving the quality of the achieved coverage predictions.
66470 VOLUME 8, 2020

D. Fernandes et al.: Cloud-Based Implementation of an Automatic Coverage Estimation Methodology for SON
FIGURE 12. Polynomial regression for MAE values.
Once the various network measures are integrated intothis model, if mobile phones had the option of monitoringthe active network quality by reporting such data, networkknowledge would be more realistic as well as its estimation.
C. PLATFORM PERFORMANCEBy splitting the computational effort into two distinct Lambdafunctions, the waiting time for the end-user when making therequest is drastically reduced. Initially, the Lambda functionthat needs more computational power is calculated for furtherreuse. Then, after user request, that information is used togenerate the final propagation grid.
The computation of these tasks in a cloud environmentallows quick access to the files, fast processing of thepre-defined tasks through computational parallelization. Theresult of this process can be further accessed simultaneouslyby several users.
Considering a network with 3 304 cells, the implementa-tion in AWS of the proposed propagation model was tested.Table 5 refers to the computation times using AWS imple-mentation and ‘‘No AWS’’ implementation, of each of theLambda functions as well as the total elapsed time.
The results achieved by the AWS implementation are dueto the parallelization feature that AWS services provide intheir Lambda function execution. The case where paralleliza-tion is not considered, being the calculations sequential, wasconsidered to be ‘‘No AWS’’ implementation.
In the case of Lambda function, Antenna Grid Construc-tion, each cell needs on average 9minutes and 8 seconds to becomputed and in the case of Lambda function, PropagationGrid Construction, only 62 seconds are needed, being thetime that user, in the worst case scenario, can expect to obtainpropagation results from a cell.
TABLE 5. Computing time of the ACSPM, for 3 304 cells, on the AWS andnot on the AWS. The format of the values is hh:mm:ss.
In the scenario where the user wants to get the propagationinformation for 3 304 cells, the use of AWS implementationallows a 89.7% time reduction when compared with not usingAWS implementation.
IX. MECHANISMS OF METRIC IMPROVED BY THEPROPOSED METHODOLOGYThe proposed work pattern for estimation of signal levelaround any cell simplifies the process of planning and opti-misation of telecommunication networks, making the processsimpler, faster and more accurate. The grids generated havebeen integrated in several mechanisms that have been devel-oped, implemented and integrated in Metric platform:• Network (Cells Deployment) Coverage: One of theapplications where the information from the ACSPM isused is when it is intended to have a coverage overviewin a given region. For each of the antennas in the region,a propagation grid is generated, and then all this infor-mation is combined. An example of the coverage ofa given area is depicted in Fig. 13. This mechanismhas been implemented in Metric platform [47]. Throughthe analysis of this area, it is possible to identify, forexample, areas with weak coverage, as discussed inSection IV-B.
• Cells Neighbourhood List: The list of neighbouringcells is essential in the operation of the network, helpingin the handover of mobile users, as well as in the plan-ning of the 2G, 3G and 4G network resources. Throughthe superposition of grids, within the coverage area of acell are calculated the amount of pixels covered by eachneighbouring cell. This results in a list of neighbouringcells sorted by estimates of shared coverage, a mech-anism that has been implemented in Metric platform,as detailed in [47].
• Crossed Sectors identification: When an anomalyoccurs in the installation of the transmission cables sup-plying a certain cell, the signal emitted by that cell is notas planned. These situations can be easily identified bycomparing the estimated signal with the DT data takenfrom the study area. The generation of a path loss grid fora given cell is transparent to the antenna characteristics,so the proposed model is used to estimate the signal withthe planned characteristics. This mechanism has beenimplemented in Metric platform.
• Overshooting solution: One problem that also exists intelecommunication networks is the overshooting cells.This type of problems means that the cell in ques-tion has a signal outside its normal area of coverage.
VOLUME 8, 2020 66471

D. Fernandes et al.: Cloud-Based Implementation of an Automatic Coverage Estimation Methodology for SON
FIGURE 13. Signal received in a certain area.
FIGURE 14. Carrier to Interference ratio in a certain area.
This problem drastically reduces the quality of thenetwork. The analysis between the planned area ofpropagation and the DT quickly detects this prob-lem. This mechanism has been implemented in Metricplatform.
• Planning: With the generation of the received powergrids, it is possible not only to elaborate a coverage mapfor an area but also amapwith the interference of the var-ious antennas, represented in Fig. 14. This informationallows the planning of BCCHs and is detailed in [48].This mechanism has been implemented in Metric plat-form. On the other side, through the power grids per cell,the lists of neighbors are then created, which are thenused for SC and PCI planning (presented in [49]).
• Energy Efficient Management of Resources: Basedon traffic predictions per cell, the cellular coverage areacan be energy-efficiently optimised by a novel mech-anism, as detailed in [24], [50], [51]. This proposedmechanism starts with grids of Prx for each of thecells. This mechanism has been implemented in Metricplatform.
X. CONCLUSIONThis paper presents a cloud-based framework of a novelsemi-empirical propagation model that portrays, as accu-rately as possible, the propagation of an antenna. This modeluses samples and antenna configuration data to automaticallycalibrate the model, making it more accurate. The automationof the calibration process makes it possible to reduce thehuman effort, which results in a financial impact on themanagement of these networks. This implementation, allowsgreater flexibility in the use of this model. This flexibilityis related, not only to the ease of integration of the modelin the Metric platform, for management and monitoring oftelecommunications networks, but also to the features givenby cloud services, namely in terms of processing andmemoryusage, and the availability of elastic resources on-demand,when needed.
TheACSPMwas implemented and tested for a telecommu-nications network located in the northern European region,specifically, in a scenario where an antenna and its DTs wereconsidered. The results obtained present about 13 dB gainwhen compared with SPM, and a MAE of about 5 dB interms of model accuracy, which is about 8 dB lower than thatobtained by SPM.
This work also shows what happens to the accuracy of themodel when the number of DTs used for calibration changes.In fact, our model shows that, as the number of DTs usedfor model calibration increases, the MAE decreases, whichmakes our model more accurate, realistic and more robust tooutlier samples.
This paper also highlights the importance of a precisepropagation model for the correct implementation and opti-misation of a telecommunications network. This has beenintegrated and implemented with other algorithms previouslyavailable in the tool, and is now in use allowing to build aneighbours list for a given cell, to plan resources of a 2G, 3Gand 4G network and change configurations (overshooting orcrossed sectors), as well as for more refined energy efficientmechanisms of radio resources.
The implementation and model described in this papershows that the integration of MDT, to obtain more datadescribing the propagation environment, can be done ina fully automatic way, provided that operators makethe data available, as it increases the responsiveness ofthe proposed model to the propagation environment. Forfuture work, it would be interesting to explore a sce-nario with available MDT data for the calibration ofthe model, since it allows an even more realistic signalestimation.
REFERENCES[1] Ericsson Mobility Report 2019, Ericsson, Stockholm, Sweden, Nov. 2019.[2] Nokia. Accessed: Jul. 15, 2019. [Online]. Available: https://www.
nokia.com[3] Huawei. Accessed: Jul. 15, 2019. [Online]. Available: https://consumer.
huawei.com[4] Atoll 3.3.0 Technical Reference Guide for Radio Networks, Forsk, Jaipur,
Rajasthan, 2015.
66472 VOLUME 8, 2020
D. Fernandes et al.: Cloud-Based Implementation of an Automatic Coverage Estimation Methodology for SON
[5] Z. O. N.Martinez, C. Rodriguez, and O.M. Arias, ‘‘Propagation character-istics of managua city based on standard propagation model (SPM) at 850MHz for 3G-WCDMA systems,’’ in Proc. IEEE Central Amer. PanamaConv. (CONCAPAN), Nov. 2014, pp. 1–6.
[6] S. I. Popoola, A. A. Atayero, N. Faruk, C. T. Calafate, E. Adetiba, andV. O. Matthews, ‘‘Calibrating the standard path loss model for urbanenvironments using field measurements and geospatial data,’’ Lect. NotesEng. Comput. Sci., vol. 2229, no. July, pp. 513–518, 2017.
[7] L. M. Correia, Mobile Broadband Multimedia Networks. Amsterdam,The Netherlands: Elsevier, 2007.
[8] D. Fernandes, L. S. Ferreira, M. Nozari, P. Sebastiao, F. Cercas, andR. Dinis, ‘‘Combining drive tests and automatically tuned propagationmodels in the construction of path loss grids,’’ inProc. IEEE 29th Annu. Int.Symp. Pers., Indoor Mobile Radio Commun. (PIMRC), Sep. 2018, pp. 1–2.
[9] D. Fernandes et al., ‘‘Combining measurements and propagation modelsfor estimation of coverage in wireless networks,’’ in Proc. IEEE 90th Veh.Technol. Conf. (VTC-Fall), Honolulu, HI, USA, 2019, pp. 1–5.
[10] D. Fernandes, G. Soares, D. Clemente, R. Cortesão, P. Sebastião, F. Cercas,R. Dinis, and L. S. Ferreira, ‘‘Integration of a cloud-based realistic andautomatic coverage estimation methodology in metric SaaS,’’ in Proc.22nd Int. Symp. Wireless Pers. Multimedia Commun. (WPMC), Lisbon,Portugal, Nov. 2019, pp. 326–329.
[11] A. DeMauro,M.Greco, andM.Grimaldi, ‘‘What is big data? A consensualdefinition and a review of key research topics,’’ AIP Conf. Proc., vol. 1644,pp. 97–104, Feb. 2015.
[12] K. Zheng, Z. Yang, K. Zhang, P. Chatzimisios, K. Yang, and W. Xiang,‘‘Big data-driven optimization for mobile networks toward 5G,’’ IEEENetw., vol. 30, no. 1, pp. 44–51, Jan./Feb. 2016.
[13] A. Imran and A. Zoha, ‘‘Challenges in 5G: How to empower SONwith big data for enabling 5G,’’ IEEE Netw., vol. 28, no. 6, pp. 27–33,Nov. 2014.
[14] E. Bastug, M. Bennis, E. Zeydan, M. A. Kader, I. A. Karatepe, A. S. Er,and M. Debbah, ‘‘Big data meets telcos: A proactive caching perspective,’’J. Commun. Netw., vol. 17, no. 6, pp. 549–557, Dec. 2015.
[15] M. Frankel, N. Shacham, and J. E. Mathis, ‘‘Self-Organizing Networks,’’Future Gener. Comput. Syst., vol. 4, no. 2, pp. 95–115, 9 1988.
[16] NGMN Use Cases related to Self Organising Network, Overall Descrip-tion, Berlin, Germany, NGMN, p. 17, 2008.
[17] P. V. Klaine, M. A. Imran, O. Onireti, and R. D. Souza, ‘‘A surveyof machine learning techniques applied to self-organizing cellular net-works,’’ IEEE Commun. Surveys Tuts., vol. 19, no. 4, pp. 2392–2431,4th Quart., 2017.
[18] AWS. Accessed: Jul. 15, 2019. [Online]. Available: https://aws.amazon.com
[19] Google Cloud. Accessed: Jul. 15, 2019. [Online]. Available: https://cloud.google.com
[20] Microsoft Azure. Accessed: Jul. 15, 2019.[Online]. Available: https://azure.microsoft.com
[21] D. Sabella, P. Rost, Y. Sheng, E. Pateromichelakis, U. Salim,P. Guitton-Ouhamou, M. Di Girolamo, and G. Giuliani, ‘‘RAN as aservice: Challenges of designing a flexible RAN architecture in a cloud-based heterogeneous mobile network,’’ Future Netw. Mobile Summit,no. 2, pp. 1–8, Jun. 2013.
[22] Metric. Accessed: Jul. 16, 2019. [Online]. Available: https://metric.pt[23] Multivision. Accessed: Jul. 16, 2019. [Online]. Available: https://multi
vision.pt[24] D. Clemente, L. Ferreira, G. Soares, N. Valente, and P. Sebastiao, ‘‘Imple-
mentation of a cloud-based, traffic aware and energy efficient managementof base Stations’ activity,’’ in Proc. 21st Int. Symp. Wireless Pers. Multi-media Commun. (WPMC), Nov. 2018, pp. 600–605.
[25] A. F. Molish,Wireless Communication, 2nd ed. Hoboken, NJ, USA:Wiley,2010.
[26] M. F. Iskander and Z. Yun, ‘‘Propagation prediction models for wirelesscommunication systems,’’ IEEE Trans. Microw. Theory Techn., vol. 50,no. 3, pp. 662–673, Mar. 2002.
[27] F. Letourneux, S. Guivarch, andY. Lostanlen, ‘‘Propagationmodels for het-erogeneous networks,’’ Proc. 7th Eur. Conf. Antennas Propag. (EuCAP),Jan. 2013, pp. 3993–3997.
[28] M. Hata, ‘‘Empirical formula for propagation loss in land mobile radio ser-vices,’’ IEEE Trans. Veh. Technol., vol. 29, no. 3, pp. 317–325, Aug. 1980.
[29] A. R. Mishra, Advanced Cellular Network Planning and Optimisation,A. R. Mishra, Ed. Chichester, U.K.: Wiley, 2006.
[30] J. M. Mom, C. O. Mgbe, and G. A. Igwue, ‘‘Application of artificial neuralnetwork for path loss prediction in urban macrocellular environment,’’Amer. J. Eng. Res., vol. 3, no. 2, pp. 270–275, 2014.
[31] E. Ostlin, H. Zepernick, and H. Suzuki, ‘‘Macrocell path-loss predictionusing artificial neural networks,’’ IEEE Trans. Veh. Technol., vol. 59, no. 6,pp. 2735–2747, Jul. 2010.
[32] I. Popescu, I. Nafornita, G. Gavriloaia, P. Constantinou, and C. Gor-dan, ‘‘Field strength prediction in indoor environment with a neuralmodel,’’ in Proc. 5th Int. Conf. Telecommun. Modern Satell., 2001,pp. 640–643.
[33] M. Ayadi, A. Ben Zineb, and S. Tabbane, ‘‘A UHF path loss model usinglearning machine for heterogeneous networks,’’ IEEE Trans. AntennasPropag., vol. 65, no. 7, pp. 3675–3683, Jul. 2017.
[34] W. A. Hapsari, A. Umesh, M. Iwamura, M. Tomala, B. Gyula, andB. Sebire, ‘‘Minimization of drive tests solution in 3GPP,’’ IEEE Commun.Mag., vol. 50, no. 6, pp. 28–36, Jun. 2012.
[35] Telecom Hall. Accessed: Aug. 1, 2019. [Online]. Available:http://www.telecomhall.com/analyzing-coverage-with-propagation-delay-pd-and-timing-advance-ta-gsm-wcdma-lte.aspx
[36] R. Moussalli, M. Srivatsa, and S. Asaad, ‘‘Fast and flexible conversion ofgeohash codes to and fromLatitude/Longitude coordinates,’’ inProc. IEEE23rd Annu. Int. Symp. Field-Program. Custom Comput. Mach., May 2015,pp. 179–186.
[37] OpenTopography—High-Resolution Topography Data and Tools.Accessed: Aug. 1, 2019. [Online]. Available: https://opentopography.org
[38] J. Takaku, T. Tadono, andK. Tsutsui, ‘‘Generation of high resolution globalDSM from ALOS PRISM,’’ Int. Arch. Photogramm., Remote Sens. SpatialInf. Sci., vols. XL–4, pp. 243–248, Apr. 2014.
[39] T. Tadono, H. Ishida, F. Oda, S. Naito, K. Minakawa, and H. Iwamoto,‘‘Precise global DEM generation by ALOS PRISM,’’ Ann. Photogramm.,Remote Sens. Spatial Inf. Sci., vol. 4, no. 5, pp. 71–76, Apr. 2014.
[40] Overpass API. Accessed: Aug. 1, 2019. [Online]. Available: http://overpass-api.de
[41] OpenStreetMap. Accessed: Aug. 1, 2019. [Online]. Available:https://www.openstreetmap.org/
[42] M. Abrash, Michael Abrash’s Graphics Programming Black Book: TheComplete Works of Graphics Master, Michael Abrash, 10th ed. Stock-bridge, GA, USA: Coriolis Group Books, 1997.
[43] Propagation by Diffraction, document ITU-R P.526-14, 2018.[44] S. Saunders and A. Aragón, Antennas and Propagation for Wire-
less Communication Systems, 2nd ed., Hoboken, NJ, USA: Wiley,2007.
[45] C. Willmott and K. Matsuura, ‘‘Advantages of the mean absoluteerror (MAE) over the root mean square error (RMSE) in assess-ing average model performance,’’ Climate Res., vol. 30, pp. 79–82,Jun. 2005.
[46] Java Platform Standard Edition 7Documentation. Accessed: Aug. 1, 2019.[Online]. Available: https://docs.oracle.com/javase/7/docs/index.html
[47] P. Pina, A. Godinho, D. Fernandes, D. Clemente, G. Soares, P. Sebastião,and L. S. Ferreira, ‘‘Cloud-based implementation of an automatic pixel-based neighbour identification system for cellular networks,’’ inProc. 22ndInt. Symp. Wireless Pers. Multimedia Commun (WPMC), Lisbon, Portugal,Nov. 2019, pp. 305–310.
[48] A. Godinho, D. Fernandes, D. Clemente, G. Soares, P. Sebastião, P. Pina,and L. S. Ferreira, ‘‘Cloud-based cellular network planning system:Proof-of-concept implementation for GSM in AWS,’’ in Proc. 22nd Int.Symp. Wireless Pers. Multimedia Commun (WPMC), Lisbon, Portugal,Nov. 2019, pp. 311–315.
[49] R. Cortesão, D. Fernandes, D. Clemente, G. Soares, P. Sebastião, andL. S. Ferreira, ‘‘Cloud-based implementation of a SON automatic planningsystem: A proof-of-concept for UMTS,’’ in Proc. 22nd Int. Symp. Wire-less Pers. Multimedia Commun (WPMC), Lisbon, Portugal, Nov. 2019,pp. 316–321.
[50] D. Clemente, G. Soares, D. Fernandes, R. Cortesao, P. Sebastiao, andL. S. Ferreira, ‘‘Traffic forecast in mobile networks: Classification sys-tem using machine learning,’’ in Proc. IEEE 90th Veh. Technol. Conf.(VTC-Fall), Honolulu, HI, USA, 2019, pp. 1–5.
[51] D. Clemente, D. Fernandes, D. Clemente, R. Cortesão, G. Soares,P. Sebastião, and L. S. Ferreira, ‘‘Assessment of traffic prediction modelsfor mobile communication networks,’’ in Proc. 22nd Int. Symp. Wire-less Pers. Multimedia Commun. (WPMC), Lisbon, Portugal, Nov. 2019,pp. 322–325.
VOLUME 8, 2020 66473

D. Fernandes et al.: Cloud-Based Implementation of an Automatic Coverage Estimation Methodology for SON
DANIEL FERNANDES received the B.S. andM.S. degrees in telecommunications and computerengineering from ISCTE-IUL, Lisbon, Portugal,in 2012 and 2017, respectively, where he is cur-rently pursuing the Ph.D. degree in informationscience and technology. He is currently workingas a Researcher with Multivision—ConsultoriaInformática. He has four scientific publicationsas author in international conferences and sevenscientific publications as coauthor.
DIOGO CLEMENTE received the B.S. degreein electrical and computer engineering fromthe Branch of Renewable Systems and PowerSystems, Escola Superior de Tecnologia deSetúbal-ESTSetúbal/IPS, and the M.S. degreein telecommunications and computer engineeringfrom the University Institute of Lisbon (ISCTE-IUL), Lisbon, Portugal, where he is currently pur-suing the Ph.D. degree in information scienceand technology. He is currently working as a
Researcher with Multivision—Consultoria Informática. He has eight scien-tific publications in international conferences.
GABRIELA SOARES received the B.S. degreein computational mathematics from the Univer-sidade Federal de Minas Gerais (UFMG), BeloHorizonte, Brazil, the M.S. degree in mathemat-ical and computational modeling from the Cen-tro Federal de Educação Tecnológica de MinasGerais (CEFET-MG), Belo Horizonte, and thePh.D. degree in computer science from the Univer-sidade de São Paulo (USP), São Paulo, Brazil. Sheis currently working as a Data Scientist Researcher
with Multivision. She participated as a Researcher in three Research andDevelopment projects funded by FAPESP, CAPES, and CNPQ focusedon optimization, evolutionary computing, complex networks, and data sci-ence. She has 17 scientific publications in journal articles and internationalconferences.
PEDRO SEBASTIÃO (Member, IEEE) receivedthe Ph.D. degree in electrical and computer engi-neering from IST. He is currently a Professor withISCTE-IUL’s Information Science and Technol-ogy Department. He is also the Board Directorof AUDAX-ISCTE-Entrepreneurship and Innova-tion Center, ISCTE, and responsible for the LABSLISBOA incubator and researcher, Institute ofTelecommunications. He developed his profes-sional activity at the National Defense Industries,
initially with the Office of Studies and later as the BoardDirector of the Qual-ity Department, Production of New Products and Technologies. He was alsoresponsible for systems of communications technology at theNokia-Siemensbusiness area. He has organized or co-organized more than 50 nationaland international scientific conferences. He planned and developed severalpostgraduate courses in technologies and management, entrepreneurship andinnovation, and transfer of technology and innovation. He has supportedseveral projects involving technology transfer and creation of start-ups andspin offs of value to society and market. He has oriented several master’sdissertations and doctoral theses. He has been an expert and evaluator ofmore than 100 national and international civil and defense Research andDevelopment projects. It has several scientific, engineering, and pedagogicalawards. He is the author or coauthor of more than 200 scientific articles.He has been responsible for several national and international Research andDevelopment projects. His main research interests are in monitoring, controland communications of drones, unmanned vehicles, planning tools, stochas-tic process (modeling and efficient simulations), the Internet of Things, andefficient communication systems.
FRANCISCO CERCAS (Senior Member, IEEE)received the Ph.D. degree from the Instituto Supe-rior Técnico, Lisbon University, Portugal, in 1996,and the ISCTE-University Institute of Lisbon.He was Researcher with INESC, from 1984 to1985, and CAPS, from 1986 to 1993. He wasalso a Visiting Researcher with the University ofPlymouth, U.K., from 1987 to 1992. Since 1994,he has been a Researcher with the Instituto deTelecomunicações. He is currently a Full Professor
with more than 36 years of professional experience, including Researchand Development at the industry and 35 years of university teaching withthe Instituto Superior Técnico. He also supervised many Ph.D. and M.Sc.students. He has participated in more than a dozen european projects in thetelecommunications area, namely as the portuguese delegate in EuropeanCooperation in Science and Technology (4 COST) actions. He has authoredand/or coauthored of a new class of codes, Tomlinson, Cercas, Hughes(TCH), one patent, and about 200 publications including book chapters, jour-nal articles and conference papers. His research interests include satellite andmobile communications, coding theory, spread spectrum communicationsand related topics.
RUI DINIS (Senior Member, IEEE) received thePh.D. degree from the Instituto Superior Técnico(IST), Technical University of Lisbon, Portugal,in 2001, and the Habilitation degree in telecom-munications from the Faculdade de Ciências eTecnologia (FCT), Universidade Nova de Lisboa(UNL), in 2010. From 2001 to 2008, he was aProfessor with IST. He was a Researcher withthe Centro de Análise e Processamento de Sinal(CAPS), IST, from 1992 to 2005, and a Researcher
with the Instituto de Sistemas e Robótica (ISR), from 2005 to 2008. In 2003,he was an Invited Professor with Carleton University, Ottawa, ON, Canada.Since 2009, he has been a Researcher with the Instituto de Telecomunicações(IT). He is currently an Associate Professor with FCT-UNL. He has beenactively involved in several national and international research projectsin the broadband wireless communications area. His research interestsinclude transmission, estimation, and detection techniques. He is a VTSDistinguished Lecturer. He is or was an Editor of the IEEE TRANSACTIONS
ON WIRELESS COMMUNICATIONS, the IEEE TRANSACTIONS ON COMMUNICATIONS,the IEEE TRANSACTIONS ON VEHICULAR TECHNOLOGY, the IEEE Open Journalon Communications, and the Elsevier Physical Communication. He was alsoa Guest Editor of the Elsevier Physical Communication (Special Issue onBroadband Single-Carrier Transmission Techniques).
LÚCIO S. FERREIRA (Senior Member, IEEE)received the Licenciado and Ph.D. degrees inelectrical and computer engineering from theIST/Technical University of Lisbon, Portugal.He worked as a Researcher with DeutscheTelekom Innovation Laboratories, in 1998, Insti-tuto de Telecomunicações, from 1999 to 2012, andINOV-INESC, from 2012 to 2015. He has workedas an Assistant Professor with the Universidadeda Beira Interior, Universidade Lusiada de Lisboa,
and ISTEC, in the areas of computer science and telecommunications. He hasbeen with INESC-ID, since 2016. He is currently a Project Manager withMultivision—Consultoria Informatica. He participated, as a ProjectManagerand a Researcher, in 17 Research and Development projects funded by theEuropean Commission. At the National Level, he has worked as a Consultantfor mobile providers and ANACOM national regulator. He has more than50 scientific publications in books, journal articles, and international confer-ences. He is an editor and coauthor of 63 technical reports for the EuropeanCommission. He reviewed 29 journal articles and conference papers, andparticipated in eight organisational commitees and 15 technical committeesof international conferences. He has supervised 12 M.Sc. and three Ph.D.students. He is a Board Member of the IEEE ComSoc Portugal chapter.
66474 VOLUME 8, 2020