Embed Size (px)
Citation preview
CLOUD BASED RECOMMENDATION SERVICES FOR HEALTHCARE
A Dissertation
Submitted to the Graduate Faculty
of the
North Dakota State University
of Agriculture and Applied Science
By
Assad Abbas
In Partial Fulfillment of the Requirements
for the Degree of
DOCTOR OF PHILOSOPHY
Major Department:
Electrical and Computer Engineering
February 2016
Fargo, North Dakota

North Dakota State University
Graduate School
Title
Cloud Based Recommendation Services for Healthcare
By
Assad Abbas
The Supervisory Committee certifies that this disquisition complies with North Dakota
State University’s regulations and meets the accepted standards for the degree of
DOCTOR OF PHILOSOPHY
SUPERVISORY COMMITTEE:
Samee U. Khan
Co-Chair
Limin Zhang
Co-Chair
Jacob S. Glower
Scott C. Smith
Ying Huang
Approved:
October 06, 2016 Scott C. Smith
Date Department Chair

iii
ABSTRACT
With the inception of portable computing devices, enormous growth in the healthcare data
over the Internet has been observed. Consequently, the Web based systems come across several
challenges, such as storage, availability, reliability, and scalability. By employing the cloud
computing to offer healthcare services helps in overcoming the aforementioned challenges.
Besides the healthcare organizations, cloud computing services are also equally beneficial for
general public in devising patient-centric or user-centric methodologies that involve users in
managing health related activities.
This dissertation proposes methodologies to: (a) make risk assessment about diseases and
to identify health experts through social media using cloud based services, (b) recommend
personalized health insurance plans, and (c) secure the personal health data in the cloud. The
proposed disease risk assessment approach compares the profiles of enquiring users with the
existing disease specific patient profiles and calculates the risk assessment score for that disease.
The health expert consultation service permits users to consult with the health specialists that use
Twitter by analyzing the tweets. The methodology employs Hyperlink-Induced Topic Search
(HITS) based approach to distinguish between the doctors and non-doctors on the basis of tweets.
For personalized health insurance plans identification, a recommendation framework to evaluate
different health insurance plans from the cost and coverage perspectives is proposed. Multi-
attribute Utility Theory (MAUT) is used to permit users evaluate health insurance plans using
several criteria, for example premium, copay, deductibles, maximum out-of-pocket limit, and
various other attributes. Moreover, a standardized representation of health insurance plans to
overcome the heterogeneity issues is also presented. Furthermore, the dissertation presents a
methodology to implement patient-centric access control over the patients’ health information

iv
shared in the cloud environment. This methodology ensures data confidentiality through the El-
Gamal encryption and proxy re-encryption approaches. Moreover, the scheme permits the owners
of health data to selectively grant access to users over the portions of health records based on the
access level specified in the Access Control List (ACL) for different groups of users. Experimental
results demonstrate the efficacy of the methodologies presented in the dissertation to offer
patient/user-centric services and to overcome the scalability issues.

v
ACKNOWLEDGEMENTS
I am grateful to ALLAH ALMIGHTY for His countless blessings in my entire life. I am
deeply thankful to my Ph.D. adviser Dr. Samee U. Khan, for the help, guidance, and support at
every step during the course of my Ph.D. I must admit that without his directions and continuous
efforts, this dissertation would not have been possible. My sincere gratitude goes to the doctoral
dissertation committee members Dr. Limin Zhang, Dr. Jacob S. Glower, Dr. Scott Smith, and Dr.
Ying Huang for the guidance and helpful recommendations.
I would like to thank all members of my family, particularly my father and mother (late)
for the unconditional support and love throughout my life. I am falling short of words in expressing
my gratitude towards both of them because they are the only and every reason for whatever I am
today and all that I achieved in my life. Special thanks to my wife and my daughter for their
patience and being the reason for me to keep myself motivated in achieving this milestone. I am
also thankful to my sister, brothers, and their families for the extended support and prayers.
Finally, I feel indebted to COMASTS Institute of Information Technology, Pakistan for
providing me the opportunity to pursue the Ph.D. and to all of my friends and colleagues in the
United States and Pakistan, who always helped me in the time of need.

vi
DEDICATION
I would like to dedicate this dissertation to my family, especially to my parents, my wife, and my
daughter for all the love, support, and motivation.

vii
TABLE OF CONTENTS
ABSTRACT ................................................................................................................................... iii
ACKNOWLEDGEMENTS ............................................................................................................ v
DEDICATION ............................................................................................................................... vi
LIST OF TABLES ......................................................................................................................... xi
LIST OF FIGURES ...................................................................................................................... xii
1. INTRODUCTION ...................................................................................................................... 1
1.1. Motivation ............................................................................................................................ 2
1.1.1. Disease Risk Assessment and Health Expert Recommendation ................................... 3
1.1.2. Personalized Health Insurance Recommendations using Cloud Computing ................ 6
1.1.3. Secure Sharing of Personal Health Records (PHRs) in the Cloud ................................ 7
1.2. Research Goals and Objectives ............................................................................................ 8
1.3. References ............................................................................................................................ 8
2. RELATED WORK ................................................................................................................... 11
2.1. Disease Risk Assessment and Expert User Recommendation ........................................... 11
2.2. Health Insurance Plans Recommendation .......................................................................... 14
2.3. Secure Sharing of Personal Health Records ....................................................................... 15
2.4. References .......................................................................................................................... 18
3. PERSONALIZED HEALTHCARE CLOUD SERVICES FOR DISEASE RISK
ASSESSMENT AND WELLNESS MANAGEMENT USING SOCIAL MEDIA .................. 22
3.1. Introduction ........................................................................................................................ 22
3.2. Research Contributions ...................................................................................................... 25
3.3. Motivation .......................................................................................................................... 26
3.4. Proposed System Architecture ........................................................................................... 28
3.4.1. Disease Risk Assessment Module ............................................................................... 29

viii
3.4.2. Expert User Recommendation Module ....................................................................... 34
3.5. Prototype Implementation .................................................................................................. 43
3.6. Results and Discussion ....................................................................................................... 45
3.6.1. Evaluation of Disease Risk Assessment Module ........................................................ 45
3.6.2. Evaluation of Expert User Recommendation Module ................................................. 50
3.6.3. Complexity Analysis ................................................................................................... 52
3.6.4. Scalability Analysis ..................................................................................................... 54
3.7. Conclusions and Future Work ............................................................................................ 58
3.8. References .......................................................................................................................... 59
4. A CLOUD BASED FRAMEWORK FOR IDENTIFICATION OF INFLUENTIAL
HEALTH EXPERTS FROM TWITTER ................................................................................. 65
4.1. Introduction ........................................................................................................................ 65
4.2. Proposed System Architecture ........................................................................................... 67
4.2.1. Identification of Candidate Experts ............................................................................. 67
4.2.2. Influential User Identification ..................................................................................... 70
4.3. Results and Discussion ....................................................................................................... 73
4.3.1. Evaluation of Expert User Recommendation Module ................................................. 73
4.3.2. Scalability Analysis ..................................................................................................... 76
4.4. Conclusions ........................................................................................................................ 80
4.5. References .......................................................................................................................... 81
5. A CLOUD BASED HEALTH INSURANCE PLAN RECOMMENDATION
SYSTEM: A USER CENTERED APPROACH ...................................................................... 83
5.1. Introduction ........................................................................................................................ 83
5.2. Preliminary Concepts ......................................................................................................... 87
5.2.1. Background and Motivation ........................................................................................ 87
5.2.2. Ontology for Health Insurance Plans .......................................................................... 89

ix
5.3. Proposed System Architecture for Health Insurance Recommendation System ............... 91
5.3.1. The Matching Module ................................................................................................. 93
5.3.2. Plan ranking using the MAUT .................................................................................... 97
5.4. Prototype Implementation ................................................................................................ 101
5.5. Results and Discussion ..................................................................................................... 102
5.6. Conclusions ...................................................................................................................... 107
5.7. References ........................................................................................................................ 107
6. SeSPHR: A METHODOLOGY FOR SECURE SHARING OF PERSONAL HEALTH
RECORDS IN THE CLOUD ................................................................................................. 111
6.1. Introduction ...................................................................................................................... 111
6.1.1. Motivation ................................................................................................................. 112
6.2. Preliminaries ..................................................................................................................... 115
6.2.1. El-Gamal Encryption ................................................................................................. 115
6.2.2. Proxy Re-encryption .................................................................................................. 116
6.3. The Proposed SeSPHR Methodology .............................................................................. 116
6.3.1. Entities ....................................................................................................................... 117
6.3.2. The PHR Partitioning ................................................................................................ 118
6.3.3. Working of the Proposed Methodology .................................................................... 119
6.4. Discussion ........................................................................................................................ 124
6.5. Formal Analysis and Verification .................................................................................... 126
6.5.1. High Level Petri Nets (HLPN) .................................................................................. 126
6.5.2. The Z3 Solver and SMT-Lib ..................................................................................... 127
6.5.3. Formal Verification ................................................................................................... 128
6.5.4. Verification of Properties .......................................................................................... 131
6.6. Performance Evaluation ................................................................................................... 132
6.6.1. Experimental Setup ................................................................................................... 132

x
6.6.2. Experimental Setup ................................................................................................... 133
6.7. Conclusions ...................................................................................................................... 138
6.8. References ........................................................................................................................ 139
7. CONCLUSIONS AND FUTURE WORK ............................................................................. 142

xi
LIST OF TABLES
Table Page
3.1: Symbols and definitions......................................................................................................... 31
3.2: User-keyword matrix ............................................................................................................. 41
3.3: Hub score ............................................................................................................................... 41
3.4: Authority score ...................................................................................................................... 41
3.5: WordNet keywords used to retrieve tweets .......................................................................... 52
5.1: Notations and their meanings ................................................................................................ 92
5.2: Importance of attributes in the test runs............................................................................... 103
5.3: Weight assignment using the ROC and the ratio method .................................................... 104
5.4: Plan ranking using the ROC ................................................................................................ 105
5.5: Plan ranking using the ratio method .................................................................................... 105
6.1: Datatypes for HLPN model ................................................................................................. 130
6.2: Mappings and places ............................................................................................................ 130
6.3: Definitions and symbols ...................................................................................................... 137
6.4: Comparison of SeSPHR with other approaches .................................................................. 138

xii
LIST OF FIGURES
Figure Page
3.1: Architecture of the proposed cloud based framework ........................................................... 29
3.2: Disease risk assessment module ............................................................................................ 30
3.3: Expert user recommendation module .................................................................................... 35
3.4: Example of related terminologies for the term Diabetes in WordNet ................................... 36
3.5: Cloud service mapping of the proposed framework .............................................................. 44
3.6: Comparison of the proposed CFDRA approach with the related approaches for case
(YES) ..................................................................................................................................... 50
3.7: Comparison of the proposed CFDRA approach with the related approaches for case
(NO) ....................................................................................................................................... 51
3.8: Comparison of the Precision of the proposed EUR approach with related approaches ........ 53
3.9: Comparison of the Recall of the proposed EUR approach with related approaches ............. 54
3.10: Comparison of the F-measure of the proposed EUR approach with related
approaches............................................................................................................................ 55
3.11: Relationship between the processing time, no. of processors, and data size for
CFDRA ................................................................................................................................ 56
3.12: Relationship between the processing time, no. of processors, and data size for EUR ........ 57
3.13: Transactions per second per processor for the CFDRA approach ....................................... 57
3.14: Transactions per second per processor for the EUR approach ............................................ 58
4.1: Architecture of the proposed cloud based framework for influential experts’
identification .......................................................................................................................... 68
4.2: Precision comparison of IUR with other approaches ............................................................ 76
4.3: Recall comparison of IUR with other approaches ................................................................. 77
4.4: F-measure comparison of IUR with other approaches .......................................................... 77
4.5: Execution time analysis for different no. of users and processors to identify candidate
experts ................................................................................................................................... 78

xiii
4.6: Execution time analysis for different no. of users and processors to identify
influential users ..................................................................................................................... 79
4.7: Execution time analysis for different no. of users and processors for weight
assignment ............................................................................................................................. 80
5.1: Generic Ontology for health insurance plans ........................................................................ 91
5.2: Cloud based health insurance recommendation system architecture ..................................... 95
5.3: An illustrative example for tree matching ............................................................................. 97
5.4: User requirement specification interface ............................................................................. 102
5.5: Plan ranking using the ROC method for weight assignment ............................................... 106
5.6: Plan ranking using the ratio method for weight assignment ................................................ 106
6.1: Architecture of the proposed SeSPHR methodology .......................................................... 119
6.2: The HLPN model of the proposed SeSPHR methodology .................................................. 132
6.3: Time consumption for key generation ................................................................................. 134
6.4: Time consumption for encryption........................................................................................ 134
6.5: Time consumption for decryption........................................................................................ 135
6.6: Turnaround time analysis ..................................................................................................... 135

1
1. INTRODUCTION
Cloud computing paradigm has significantly influenced the traditional healthcare practices
besides several other business and scientific domains. As a result, the healthcare domain has
progressed from the conventional paper based clinical prescriptions to the Personal Health Records
(PHR) and Electronic Health Records (EHR) [1.1]. The difference between the PHRs and EHRs
is that patients themselves manage the PHRs whereas the EHRs are controlled by the healthcare
organizations [1.2]. In other words, the PHRs comprise of the health history, personal observations
of the patients, information about the diagnosed diseases, and the treatments. Conversely, the
EHRs offer a wider view prospect about patients’ health and contain complete clinical information,
for example diagnosis, treatments, allergies, and laboratory reports [1.3]. Therefore, the patients’
electronic health information is usually exchanged across several entities of the healthcare domain.
The integration of electronic health information from several locations, for example
hospitals, clinics, laboratories, and health insurance companies evolves the phenomenon termed
as e-Health [1.1]. However, it is difficult to manage the data being originated from multiple sources
and being exchanged among several entities because the heterogeneous infrastructure across the
healthcare providers causes the compatibility issues. Therefore, for organizations with limited
technological and computing resources, the tasks of infrastructure management and development
may be difficult [1.4]. Therefore, utilizing the cloud computing services can help organizations
alleviate the complexities of infrastructure management and development costs. Besides the
healthcare organizations, cloud computing services are also equally useful for people in devising
patient-centric solutions that involve users in management of their own health related activities
and can help in the evolution of an effective healthcare system.

2
1.1. Motivation
With the increase in number of computing devices connecting to the Internet, significant
growth in the data over Internet has been observed. Consequently, the healthcare content over the
Internet has also significantly increased. In fact, large volumes of healthcare data are being
produced on daily basis from multiple sources, for example clinics and hospitals, health insurance
companies, clinical laboratories, and pharmacies [1.5]. In addition to the aforementioned data
sources, online healthcare communities and social media platforms, such as Twitter and Facebook
are also generating huge volumes of health related content. Therefore, it is difficult to manage the
data comprising of multiple formats and being rapidly instigated from diverse sources using the
conventional tools and techniques.
In reality, the data that is produced at numerous sources with different representational
formats is termed as the big data [1.6] and applying the same analogy to the healthcare data evolves
the term health big data. Therefore, the important defining properties of big data include (a)
volume, (b) velocity, and (c) variety. The volume represents the huge volumes of data whereas the
velocity denotes the speed at which data is being generated and moves around the systems. The
variety refers to the representation formats of data, for example the data is either structured or
unstructured [1.6]. Therefore, employing the big data enabled methodologies in the healthcare
domain is of paramount importance to deal with the challenges, such as storage, reliability,
efficient processing, and scalability [1.7]. Moreover, cloud computing based solutions seem fairly
appropriate for the healthcare services to deal with the aforementioned challenges.
In addition to the performance benefits of the cloud computing and big data enabled
methods, the financial concerns are also of vital significance in the healthcare domain. In a survey
conducted by McKinsey in year 2013, the healthcare spending of the United States has roughly

3
increased by over $600 billion than the expectations [1.8]. Therefore, utilizing the cloud based
services will help the healthcare sector by avoiding the infrastructure development and
management expenses that eventually would help in minimizing the healthcare costs for the
consumers. However, considering the architecture of the cloud computing model and the
sensitivity of health data stored at cloud it is essential to devise methodologies that enable strict
access control over the health data shared in the cloud. Moreover, it is also important to devise
patient-centric or user-centric methodologies that involve the users or patients in management of
health related activities, such as making assessment about the personal health through health based
tools, consulting with the health experts who use social media technologies to consult with the
health experts at no cost, and to search for the health insurance plans according to the customized
user requirements both in terms of cost and coverage.
To this end, this dissertation proposes: (a) the solutions for disease risk assessment service
and consultation service with the health experts including the doctors and non-doctor experts from
Twitter, (b) an approach to facilitate users in identification of most feasible insurance plans
according to the personalized requirements of users or consumers, and (c) a methodology to
securely share the personal health records in the cloud. Each of the aforementioned methodologies
is briefly described below.
1.1.1. Disease Risk Assessment and Health Expert Recommendation
Since last few years, there has been excessive use of Internet to perform health related
informational searches. According to the Pew Internet Project survey conducted in year 2013
approximately 72% of the Internet users accessed the Internet to search for the related information
in year 2012 [1.9]. Around 16% of the participants in the abovementioned survey were concerned
in contacting the people having the same health related concerns. Likewise 30% of the survey

4
participants read the online reviews about health related issues and contacted Web based treatment
services whereas another 26% of the participants were interested in knowing the experiences of
other users during a disease [1.9]. The reason for the increased use of Internet for health related
issues by general public is that the healthcare costs are increasing. Therefore, people have started
taking initiatives to keep themselves healthy by construing through the Web based health
information and contacting the health experts through the Internet to seek advice at no cost. The
development of online health information tools and methodologies can be substantially useful by
minimizing or avoiding the doctors’ visits, particularly for the uninsured individuals. Therefore,
this research facilitates users by providing a service that helps them in making risk assessment
about several diseases.
To perform the risk assessment about the probable diseases, a methodology called
Collaborative Filtering Disease Risk Assessment (CFDRA) is proposed. The CFDRA approach
compares the profile attributes of the enquiring users with the profiles of the existing patients of a
particular disease and makes assessment about the health conditions of the enquiring users. The
CFDRA approach has the ability to make risk assessment about multiple diseases simultaneously.
In the approach, the profiles of the patients of different diseases are stored separately and based on
a risk assessment query for a particular disease, only the profiles of the patients of that particular
disease are retrieved and compared. This allows the approach to work in distributed manner where
multiple queries can be entertained simultaneously and this is indeed a feasible way to enhance
the scalability of the system. The experimental results exhibited that the proposed CFDRA
methodology achieved significantly high accuracy and even performed better than several state-
of-the-art classifiers and methodologies employed for disease risk assessment. Further details of
the methodology are presented in [1.10] and Chapter 3.

5
The second module called Expert User Recommendation (EUR) module offers the users
or patients an opportunity to interact with the health experts from Twitter. Currently, Twitter has
emerged as a great source of data comprising of health related topics and discussions, healthcare
communities, and doctor profiles. Therefore, using Twitter as a tool to spread awareness about
health related issues can be a suitable alternative for seeking healthcare advice at no cost. To
perform the aforementioned task, the presented methodologies use the health related tweets to
recommend health experts to users requesting consultation with the experts. The framework
considers two types of users as the health experts: (a) doctors and (b) non-doctor experts—who
may be the current or past patients of a disease, family members of a patient, and health activists
who are sufficiently knowledgeable to guide other users or patients. Therefore, the methodology
separates the doctors from non-doctors on the basis of tweets based on the observation that the
tweets by doctors contain more specialized medical terminologies as compared to the non-doctors.
To perform the task of user segregation based on tweets Hyperlink Induced Topic Search (HITS)
[1.11] based approach is employed. The complete details of the methodology are presented in
[1.10] and Chapter 3.
The approach proposed in [1.10] is further extended to identify the influential health
experts from Twitter. By employing the variant of HITS based approach, candidate health experts
are identified. After the identification of candidate experts, the methodology determines the
influence of each expert by considering multiple criteria, such as: (a) total number of experts’
followers, (b) health related tweets by the expert, (c) analysis of sentiments polarity of followers
in replies to the tweets by an expert, and (d) the re-tweets of the experts’ tweets. The enquiring
users can evaluate the influence of a particular criterion by altering the priorities of the
aforementioned criteria. The higher the priority of a particular criterion indicated in the user query,

6
the more weight is assigned to that criterion. More details of the methodology are presented in
[1.12] and Chapter 4.
1.1.2. Personalized Health Insurance Recommendations using Cloud Computing
Patient Protection and Affordable Care Act (PPACA) familiarizes health insurance
marketplaces to facilitate in searching for the health insurance plans that best meet the users’ needs
[1.13]. At present, several Web based tools have been developed to help users in searching for the
health insurance plans. However, the existing tools lack in offering personalized recommendations
about health insurance plans by considering multiple perspectives. The reason that hinders the
effectiveness of existing tools in offering personalized recommendations about health insurance
plans is that these tools make comparisons on the basis of premium only and do not permit users
to evaluate insurance plans from multiple perspectives, such as: (a) premium, (b) copay, (c)
deductibles, (d) co-insurance, (e) maximum out-of-pocket limit, (f) maximum benefit offered by a
plan, and (g) coverage for different diseases. Moreover, large amount of information about health
insurance plans is hidden deep down the Webpages of insurance companies and consequently,
conventional tools might not be able to index the aforementioned information. Furthermore, it is
difficult to analyze the information and deduce meaningful results retrieved using the conventional
tools. Therefore, it is indeed important to develop methodologies that not only are capable of
deeply searching the broadly dispersed and concealed information but also permit users to evaluate
the plans according to user-defined criteria both in terms of cost and coverage.
To this end, this research proposes personalized health insurance plan recommendation
methodologies based on cloud computing infrastructure. This research utilizes Multi-attribute
Utility Theory (MAUT) based approaches where users can specify the importance of their
preferred evaluation criteria both in terms of cost and coverage. The weights to the preferred

7
criteria are assigned based on the relative importance of one criterion as compared to the other.
The higher the importance of the criteria, the more weight is assigned. To overcome the
heterogeneity issues that arise due to different data representation formats across the providers,
this research proposes a standardized representation of health insurance plans. Moreover, to
efficiently manage huge volumes of health insurance big data, cloud computing services have been
utilized. The complete details of the methodology are presented in [1.14] and Chapter 5.
1.1.3. Secure Sharing of Personal Health Records (PHRs) in the Cloud
Adoption of cloud computing services in the healthcare domain has resulted in cost
effective and convenient exchange of Personal Health Records (PHRs) among various entities of
the cloud based e-Health systems. However, storing the confidential health-data to third-party
cloud servers is susceptible to revelation or theft and calls for the development of methodologies
that ensure the privacy of the PHRs. Therefore, this dissertation proposes a methodology called
Secure Sharing of Personal Health Records in the Cloud (SeSPHR) for secure sharing of the PHRs
in the cloud. The SeSPHR approach enforces a patient-centric access control over the PHRs and
preserves the confidentiality of the PHRs. The patients store the encrypted PHRs on the un-trusted
cloud servers and selectively grant access to different types of users on different portions of the
PHRs. A semi-trusted proxy called Setup and Re-encryption Server (SRS) is introduced to set up
the public/private key pairs and to generate the re-encryption keys. Moreover, the methodology is
secure against insider threats and also enforces a forward and backward access control.
Furthermore, we formally analyze and verify the working of SeSPHR methodology through the
High Level Petri Nets (HLPN), Satisfiability Modulo Theory (SMT), and the Z3 solver. A
prototype of the SeSPHR is implemented and the performance is measure with regard to time
consumption. The results indicate that the SeSPHR methodology has potential to be employed for

8
securely sharing the PHRs in the cloud. The complete details of the methodology are presented in
Chapter 6.
1.2. Research Goals and Objectives
The objective of the research is to use cloud computing services to effectively manage the
health related big data and to devise user-centric methodologies. The key objectives of the
proposed research are to:
facilitate users in making risk assessment about probable diseases
offer mechanism to help interact users with the health experts from Twitter
help users in identification of health insurance plans according to the tailored
requirements
develop a secure mechanism for sharing of personal health records in the cloud
1.3. References
[1.1] A. Abbas, S. U. Khan, “E-health Cloud: Privacy Concerns and Mitigation Strategies,”
in Medical Data Privacy Handbook, A. G. -Divanis and G. Loukides, Eds., Springer-
Verlag, New York, USA, ISBN: 978-3-319-23633-9, Chapter 15.
[1.2] J. Li, “Electronic personal health records and the question of privacy,” Computers, 2013,
DOI: 10.1109/MC.2013.225
[1.3] R. Zhang, L. Liu, “Security models and requirements for healthcare application clouds,”
3rd IEEE International Conference on Cloud Computing, Miami, FL, USA, July 2010,
pp.268–275.
[1.4] A. Abbas and S. U. Khan, “A Review on the State-of-the-Art Privacy Preserving
Approaches in EHealth Clouds,” IEEE Journal of Biomedical and Health Informatics,
vol. 18, no. 4, pp. 1431-1441, 2014.

9
[1.5] K. Mille, “Big Data Analytics in Biomedical Research,” Biomedical Computation
Review, 2012, pp. 14-21.
[1.6] M. A. Barrett, O. Humblet, R. A. Hiatt, and N. E. Adler, “Big data and disease
prevention: From quantified self to quantified communities,” Big Data 1, no. 3, 2013, pp.
168-175.
[1.7] N. V. Chawla, and D. A. Davis, “Bringing big data to personalized healthcare: a patient-
centered framework,” Journal of general internal medicine28, no. 3, 2013, pp. 660-665.
[1.8] B. Kayyali, D. Knott, and S. V. Kuiken, “The big-data revolution in US health care:
Accelerating value and innovation,” Mc Kinsey & Company, 2013, pp. 1-13.
[1.9] S. Fox, M. Duggan, “Health online 2013,” http://www.pewinternet.org/files/old-
media/Files/Reports/PIP_HealthOnline.pdf, accessed on September 1, 2014.
[1.10] A. Abbas, M. Ali, M. U. S. Khan, and S. U. Khan, “Personalized Healthcare Cloud
Services for Disease Risk Assessment and Wellness Management using Social
Media” Pervasive and Mobile Computing 28, pp: 81-99, 2016.
[1.11] D. Easley and J. Kleinberg, Networks, Crowds, and Markets: Reasoning About a Highly
Connected World, Cambridge University, Press, 2010.
[1.12] A. Abbas, M. U. S. Khan, M. Ali, S. U. Khan, and L. T. Yang, “A Cloud Based
Framework for Identification of Influential Health Experts from Twitter,” in 15th
International Conference on Scalable Computing and Communications (ScalCom),
Beijing, China, Aug. 2015.
[1.13] S. Haeder, D.L. Weimer, “You can’t make me do it: state implementation of insurance
exchanges under the affordable care act,” Public Administration Review, 2013, pp. S34–
S47.

10
[1.14] A. Abbas, K. Bilal L. Zhang, and S. U. Khan, “A Cloud Based Health Insurance Plan
Recommendation System: A User Centered Approach,” Future Generation Computer
Systems, vol. 43-44, pp. 99-109, 2015.

11
2. RELATED WORK
The research presented in this dissertation utilizes cloud computing services to offer user-
centered services. The presented research focuses on: (i) disease risk assessment and health expert
recommendation, (ii) health insurance plan recommendation, and (iii) secure sharing of personal
health information in the cloud. The works related to each of the presented methodologies are
presented below.
2.1. Disease Risk Assessment and Expert User Recommendation
The proposed framework introduces: (a) disease risk assessment mechanism and (b) an
approach that finds the health experts available on Twitter. Therefore, in this section, various
proposals are discussed that are relevant to the proposed framework with respect to the two
aforementioned aspects.
Khalilia et al. [2.1] employed a Random Forest (RF) based approach for disease prediction.
The approach takes into account the diagnosis history of the individuals on a highly imbalanced
dataset and combines the RF method with the repeated random sub-sampling. The approach claims
to be achieving high prediction accuracy in comparison to several other machine learning
approaches. However, a limitation of the RF method is that it comes across the issue of overfitting
with noisy datasets that degrades the accuracy for different datasets. On the other hand, the
proposed method uses collaborative filtering to perform disease risk assessment by computing the
similarities between the profile of the enquiring user and the existing users having similar diseases.
Yu et al. [2.2] used Support Vector Machine (SVM) based approach to develop classification
models for persons with diagnosed or undiagnosed diabetes. The scheme is claimed to be the first
ever used to diagnose the common disease without the laboratory tests. However, the SVM based
approaches are uncertain about the selection of kernel function and also require large memory and

12
computational resources. Conversely, our approach reduces the size of dataset by retrieving
profiles based on one influential attribute that eventually results in minimizing the computation
time. The authors in [2.3] used fuzzy set theory to make risk assessment for coronary heart disease.
However, the fuzzy modeling approaches are limited in handling diversity of medical data. The
authors in [2.4] used Naïve Bayes approach to make risk assessment for Alzheimer disease using
genomic driven data. Nonetheless, the conditional independence assumption of the attributes in
Naïve Bayes approach affects the posterior probability estimate for risk assessment. The CFDRA
approach on the other hand uses the Cosine Similarity method to compute similarities between the
profiles of enquiring users and the existing users. The similarity scores are used to calculate the
risk assessment scores for the enquiring users. Moreover, the aforementioned discussed works only
make risk assessments for only single disease whereas the proposed CFDRA approach has the
capability to make risk assessment for multiple diseases simultaneously and in an efficient manner.
Apart from the disease risk assessment, another important dimension of the proposed work
is to find health experts from Twitter. A lot of research has been conducted on identifying the
experts in various online communities. However, the studies focusing on finding the expert users
from online health communities have been very negligible. Zhao et al. [2.5] proposed an approach
to find influential users in online health communities by estimating the emotional support through
text mining and sentiment analysis. The approach utilizes an influence model of social network
theories where dynamics of social influence are characterized using a diffusion model. The authors
introduced a metric called Influential Responding Replies (IRR) to determine influence of other
members. However, the approach is limited in offering interaction with only the patients of the
online health community. On the other hand, our proposed approach enables the users to interact
with both the doctor and non-doctor experts by using the hub and authority based approach.

13
Moreover, our proposed approach ranks the experts based on the use of health related keywords
by experts instead of replies by the users. The authors in [2.6] proposed an approach to find the
topical authorities in microblogs. The authors exhibited the efficacy of the probabilistic clustering
for selection of high authority users and also proved the effectiveness of Gaussian-based ranking
to rank the users. Ghosh et al. [2.7] used Twitter lists to mine the topical experts. The approach in
[2.7] utilizes the crowdsourced annotation of topical experts and suggests experts that might have
knowledge to answer the questions. Moreover, the approach in [2.7] manually curates the Twitter
lists to identify and rank the experts. Our approach on the other hand periodically extracts the
tweets from Twitter, preprocesses the tweets, identifies the candidate experts, and then segregates
the experts into doctors and non-doctors using the hub and authority based approach.
The approach presented in [2.8] identifies the local experts by calculating their topical
expertise based on expertise propagation in geo-tagged social connections on Twitter. The
approach considers those individuals as the local experts that are well recognized in a community
based on the views of others. However, our approach identifies the experts based on their tweets
and the use of disease related terminologies. Moreover, our proposed approach uses cloud
computing services to process large repositories of tweets data.
Weng et al. [2.9] proposed an extension of the PageRank algorithm called the TwitterRank
that finds the influential users on Twitter. TwitterRank uses link structures and topical similarities
to compute ranking for the influential users on a particular topic. The aforementioned approaches
come across the scalability issues whereas our approach is capable of finding the influential users
by executing parallel jobs from huge tweets corpus.

14
2.2. Health Insurance Plans Recommendation
Over the past few years, various approaches have been proposed for deploying the
electronic health data in the cloud platform due to the ever increasing volumes of the health data,
such as patient electronic medical records, lab reports, and insurance claims. Moreover, to
efficiently process and integrate geographically dispersed health data, several methodologies have
been proposed. An ontology based approach for a standardized representation of the health plans
across multiple health insurance providers is presented. Ontology based approaches in distributed
environment have been used in various proposals.
An ontology based approach to deal with the emergency management that unifies the
datasets distributed across various locations is presented in [2.10]. The approach is capable of
mapping the XML schemas to ontology. There are various tree matching algorithms, for example
the exact matching and approximate matching algorithm to determine the structural similarity
among the XML documents. The exact matching algorithms used in Ref. [2.11] and Ref. [2.12]
employ sequential tree matching approaches that first apply query decomposition process and then
query twig is transformed into paths from root to leaf. In addition, there are varieties of approaches
that have been used for approximate XML tree matching. However, contrary to exact tree matching
approaches these approaches are designed to rank and select elements with respect to their
probability of matching the queries. In Ref. [2.13], an approach that uses edge relaxation for
indexing XML documents is presented. The approach weighs the parent-child relationships
according to a maximal score of 1. The approach uses the exact tree matching algorithm to
determine the number of matching and non-matching requirements to calculate the structural
similarity among the trees. Moreover, the user requirements are categorized as “Essential”,
“Desirable”, and “Optional”. The “Essential” requirements are assigned higher weights whereas

15
the “Optional” requirements are assigned the lowest weight in the interval [0, 1]. The weights of
the “Desirable” requirements are in between the “Essential” and “Optional” requirements. Apart
from the tree matching aspect, another important dimension of work presented in this dissertation
is decision support while ranking the health insurance plans. The MAUT is an important analytical
tool for decision analysis that captures the decision makers’ preferences to make decisions based
on multiple independent objectives [2.14]. The decision makers’ MAUT functions are modeled
using the utility elicitation methods. The MAUT function can be determined by employing holistic
or decomposed approaches [2.15]. The holistic approaches, such as multiple regression analysis
and artificial neural networks require a decision maker to evaluate all the alternatives. On the other
hand, the decomposed approaches, such as Simple Multi-Attribute Rating Technique (SMART)
[2.16] and Analytic Hierarchy Process (AHP) require the decision maker to compare the relative
importance of various attributes. Huang [2.14] used the SMART to rank user preferences in terms
of their importance. The approach uses the ROC to assign weights to the attributes. Our approach
for eliciting the weights of various attributes uses the ROC and the ratio method. Moreover, there
are also several AHP based proposals for recommendation and decision making based on multiple
attributes, such as [2.17], [2.18],[2.19] and [2.20]. However, the SMART exhibits better
performance as compared to the AHP when the decisions to be made are complex enough. In
addition, the AHP method compares every two alternatives based on each single attribute that
makes it less suitable when there are large numbers of alternatives.
2.3. Secure Sharing of Personal Health Records
The existing works that relate to secure sharing of the PHRs are presented in this
subsection. The authors in [2.21] used public key encryption based approach to uphold the
anonymity and unlinkability of health information in semi-trusted cloud by separately submitting
16
the Personally Identifiable Information (PII). The patients encrypt the PHRs by the patients
through the public key of the Cloud Service Provider (CSP) and the CSP decrypts the record using
the private key, stores the health record and the location of the file (index), and subsequently
encrypts them through the symmetric key encryption. The administrative control of the patient on
the PHRs is maintained by pairing the location and the master key. However, a limitation of the
approach is that it allows the CSP to decrypt the PHRs that in turn may act maliciously. On the
other hand, the research proposed in this dissertation introduced a semi-trusted authority called the
SRS that re-encrypts the ciphertext generated by the PHR owner and issues keys to the users that
request access to the PHRs. Chen et al. [2.22] introduced a method to exercise the access control
dynamically on the PHRs in the multi-user cloud environment through the Lagrange Multiplier
using the SKE. Automatic user revocation is the key characteristics of the approach. To overcome
the complexities of the key management, a partial order relationship among the users is
maintained. However, the scheme requires the PHR owners to be online when the access is to be
granted or revoked.
The authors in [2.23] used a Digital Right Management (DRM) based approach to offer
patient-centric access control. The authors employed the Content Key Encryption (CKE) for
encryption and the users with the lawful license are permitted to access the health-data. An
approach securely share the PHRs in multi-owner setting, which is divided into diverse domains
using the Attribute Based Encryption (ABE) is presented by Li et al. [2.24]. The approach uses
proxy re-encryption technique to re-encrypt the PHRs after the revocation of certain user(s). In the
approach, the intricacies and cost of key management have been effectively minimized and the
phenomenon of on-demand user revocation has been improved. Despite its scalability, the
approach is unable to efficiently handle the situations that require granting the access rights based

17
on users’ identities. Contrary to the scheme presented in [2.22], our proposed approach does not
require the PHR owners to be online to grant the access over PHRs. Instead the semi-trusted
authority determines the access privileges for users and after successful authorization, calculates
the re-encryption keys for the users requesting the access. Xhafa et al. [2.25] also used Ciphertext
Policy ABE (CP-ABE) to ensure the user accountability. Besides protecting the privacy of the
users, the proposed approach is also capable of identifying the users that malfunction and distribute
the decryption keys to other users illegitimately.
An approach to concurrently ensure the fine-grained access and confidentiality of the
healthcare data subcontracted to the cloud servers is presented in [2.26]. The expensive tasks of
data files re-encryption, update of secret keys, and restricting the revoked users to learn the data
contents are addressed through the proxy re-encryption, Key Policy ABE (KP-ABE), and lazy re-
encryption. The cloud servers are delegated the tasks of re-encryption of data files and subsequent
storage to the cloud environment. However, in the proposed framework the data owner is also
assumed as a trusted authority that manages the keys for multiple owners and multiple users.
Therefore, the inefficiencies would occur at the PHR owners’ end to manage multiple keys for
different attributes for multiple owners. The approach presented in this dissertation avoids the
aforementioned overhead because the tasks of key generation and key distribution to different
types of users are performed by the semi-trusted authority. The authors in [2.27] and [2.28] also
used the proxy re-encryption based approaches to offer fine-grained access control. The approach
proposed in this dissertation permits the PHR encryption by the owners before storing at the cloud
and introduces a semi-trusted authority that re-encrypts the ciphertext without learning about the
contents of the PHRs. Only the authorized users having the decryption keys issued by the semi-
trusted authority are allowed to decrypt the PHRs.

18
2.4. References
[2.1] M. Khalilia, S. Chakraborty, and M. Popescu, “Predicting disease risks from highly
imbalanced data using random forest,” BMC medical informatics and decision
making 11, no. 1, pp. 2011, pp. 51
[2.2] W. Yu, T. Liu, R. Valdez, M. Gwinn, and M. J. Khoury, “Application of support vector
machine modeling for prediction of common diseases: the case of diabetes and pre-
diabetes,” BMC Medical Informatics and Decision Making, vol. 10, no. 1, 2010, pp. 16
[2.3] V. Khatibi, and G. A. Montazer, “A fuzzy-evidential hybrid inference engine for
coronary heart disease risk assessment,” Expert Systems with Applications 37, no. 12,
2010, pp. 8536-8542.
[2.4] W. Wei, S. Visweswaran, and G. F. Cooper, “The application of naive Bayes model
averaging to predict Alzheimer's disease from genome-wide data,” Journal of the
American Medical Informatics Association 18, no. 4, 2011, pp. 370-375.
[2.5] K. Zhao, J. Yen, G. Greer, B. Qiu, P. Mitra, and K. Portier, “Finding influential users of
online health communities: a new metric based on sentiment influence,” Journal of the
American Medical Informatics Association, 2014, pp. 1-7.
[2.6] A. Pal, and S. Counts, “Identifying topical authorities in microblogs,” In Proceedings of
the fourth ACM international conference on Web search and data mining, 2011, pp. 45-
54.
[2.7] S. Ghosh, N. Sharma, F. Benevenuto, N. Ganguly, and K. Gummadi, “Cognos:
crowdsourcing search for topic experts in microblogs,” In Proceedings of the 35th
international ACM SIGIR conference on Research and development in information
retrieval, 2012, pp. 575-590.

19
[2.8] Z. Cheng, J. Caverlee, H. Barthwal, and V. Bachani, “Who is the Barbecue King of
Texas? A Geo-Spatial Approach to Finding Local Experts on Twitter,” In Proceedings of
the 37th international ACM SIGIR conference on Research & development in
information retrieval, pp. 335-344. ACM, 2014.
[2.9] J. Weng, E. P. Lim, J. Jiang, and Q. He, “Twitterrank: finding topic-sensitive influential
twitterers,” In Proceedings of the third ACM international conference on Web search and
data mining, 2010, pp. 261-270.
[2.10] J. Li, Q. Li, C. Liu, S. U. Khan, and N. Ghani, “Community-Based Collaborative
Information System for Emergency Management,” Computers & Operations Research,
vol. 42, pp. 116-124, 2012.
[2.11] P. Zezula, G. Amato, F. Debole, F. Rabitti, Tree signatures for XML querying and
navigation, in Database and XML Technologies, 2003, pp. 149-163.
[2.12] P. Zezula, F. Mandreoli, R. Martoglia, “Tree signatures and unordered XML pattern
matching,” in 30th Conference on Current Trends in Theory and Practice of Computer
Science, Merin, Czech Republic, 2004, pp. 122–139.
[2.13] M.B. Aouicha, M. Tmar, M. Boughanem, M. Abid, “XML information retrieval based on
tree matching,” in IEEE International Conference on Engineering of Computer Based
Systems, ECBS, Belfast, Ireland, 2008, pp. 499–500.
[2.14] S.-L. Huang, “Designing utility-based recommender systems for e-commerce: Evaluation
of preference-elicitation methods,” Electronic Commerce Research and Applications 10,
no. 4 2011, pp. 398-407.
[2.15] J.-C. Pomerol, and S. B. -Romero, Multicriterion Decision in Management: Principles
and Practice, Kluwer Academic Publishers, Boston, 2000.

20
[2.16] W. Edwards, and H. F. Barron, “SMARTS and SMARTER: improved simple methods
for multi-attribute utility measurement,” Organizational Behavior and Human Decision
Processes, 60, 3, 1994, 306–325.
[2.17] C. Schmitt, D. Dengler, and M. Bauer, “The MAUT machine: an adaptive recommender
system,” In Proceedings of the ABIS Workshop, Hannover, Germany, 2002.
[2.18] M. F. Frimpon, “A Multi-Criteria Decision Analytic Model to Determine the Best
Candidate for Executive Leadership,” Journal of Politics and Law 6, no. 1, 2013, pp. 1-1.
[2.19] D.–R. Liu, and Y. –Y. Shih, “Integrating AHP and data mining for product
recommendation based on customer lifetime value,” Information & Management, 42, 3,
2005, pp. 387–400.
[2.20] Z. Hua, B. Gong, and X. Xu, “A DS–AHP approach for multi-attribute decision making
problem with incomplete information,” Expert systems with applications 34, no. 3, 2008,
pp. 2221-2227.
[2.21] J. Pecarina, S. Pu, and J.-C. Liu, “SAPPHIRE: Anonymity for enhanced control and
private collaboration in healthcare clouds,” in Proceedings of the 4th IEEE International
Conference on Cloud Computing Technology and Science (CloudCom), 2012, pp. 99–
106.
[2.22] T. S. Chen, C. H. Liu, T. L. Chen, C. S. Chen, J. G. Bau, and T.C. Lin, “Secure Dynamic
access control scheme of PHR in cloud computing,” Journal of Medical Systems, vol. 36,
no. 6, pp. 4005–4020, 2012.
[2.23] M. Jafari, R. S. Naini, and N. P. Sheppard, “A rights management approach to protection
of privacy in a cloud of electronic health records,” in 11th annual ACM workshop on
Digital rights management, October 2011, pp. 23-30.

21
[2.24] M. Li, S. Yu, Y. Zheng, K. Ren, andW. Lou, “Scalable and secure sharing of personal
health records in cloud computing using attribute-based encryption,” IEEE Transactions
on Parallel and Distributed Systems, 2013, vol. 24, no. 1, pp. 131–143.
[2.25] F. Xhafa, Fatos, J. Feng, Y. Zhang, X. Chen, and J. Li, “Privacy-aware attribute-based
PHR sharing with user accountability in cloud compu-ting,” The Journal of
Supercomputing, 2014, pp. 1-13.
[2.26] S. Yu, C. Wang, K. Ren, and W. Lou, “Achieving secure, scalable and fine-grained data
access control in cloud computing,” in Proceedings of the IEEE INFOCOM, March 2010,
pp. 1-9.
[2.27] C. Leng, H. Yu, J.Wang, and J. Huang, “Securing personal health records in the cloud by
enforcing sticky policies,” Telkomnika Indonesian Journal of Electrical Engineering,
vol. 11, no. 4, pp. 2200–2208, 2013.
[2.28] D.H Tran, N. H.-Long, Z. Wei, N. W. Keong, “Towards security in sharing data on
cloud-based social networks,” in 8th International Conference on Information,
Communications and Signal Processing (ICICS), 2011, pp. 1-5.

22
3. PERSONALIZED HEALTHCARE CLOUD SERVICES FOR DISEASE
RISK ASSESSMENT AND WELLNESS MANAGEMENT USING
SOCIAL MEDIA1
3.1. Introduction
The recent growth in the number of computing and mobile devices has resulted in
exponential increase in data volumes over the Internet. Apart from the gigantic data volumes, the
complex task of managing the concurrently originating data from multiple sources requires Big-
data enabled tools and techniques [3.1]. Big-data refers to the data with high volumes, high
dimensionality and veracity, and greater velocity [3.2]. The trends in rapid growth of data have
also been witnessed in healthcare domain besides the electronic commerce and various scientific
domains [3.3]. Traditionally, Big-data related to healthcare originates from the sources, such as
the payer-provider data repositories and the genomic-driven Big-data sources. The payer-provider
data comprises of the Electronic Health Records (EHRs), pharmacy prescriptions, insurance data,
and patients’ feedback, whereas the genomic-driven data consists of genotyping data, gene
extraction data, and sequencing data [3.4].
The need to exchange and integrate the electronic medical information dispersed across
various points-of-care, laboratories, health insurance providers, and medical research centers
obligate the efficient, robust, and cost effective storage and communication infrastructure. In this
1 This paper has been published in Pervasive and Mobile Computing (PMC) journal. The material
in this chapter was co-authored by Assad Abbas, Mazhar Ali, Muhammad Usman Shahid Khan,
and Samee U. Khan. Assad Abbas had primary responsibility for conducting experiments and
collecting results. Assad Abbas was the primary developer of the conclusions that are advanced
here. Assad Abbas also drafted and revised all versions of this chapter. Samee U. Khan served as
proofreader.

23
regard, cloud computing paradigm has exhibited tremendous potential and has also drawn the
attention of both the academic institutions and research organizations [3.5]. Above and beyond the
performance benefits of cloud computing and Big-data analytics in the healthcare domain, fiscal
concern is also among the factors of paramount importance that harnesses the need for Big-data
analytics. According to a 2013 survey by McKinsey, the healthcare expenditure of the United
States has increased approximately $600 billion more than the expected benchmark [3.6]. By
embracing the cloud computing services in the healthcare domain, the expenditures for
infrastructure development and subsequent management can be reduced that can further help in
cutting-down the healthcare costs. Moreover, there is also a need to formulate patient-centered
methodologies that involve patients to manage their health affairs and devise wellness plans.
To this end, this dissertation proposes a framework that facilitates the users or patients in
offering personalized healthcare services at no cost using the Internet and social media. The
framework primarily offers two services namely, (a) disease risk assessment and (b) health expert
recommendation from Twitter. To accomplish the task of disease risk assessment an approach
called the Collaborative Filtering-based Disease Risk Assessment (CFDRA) is presented. The
CFDRA approach works by comparing the profiles of enquiring users with the profiles of existing
patients. The typical profile attributes that are provided as input to the framework include age,
gender, ethnicity, weight, height, family disease history, and other commonly observed symptoms
for a disease. Based on the attributes specified in the users’ query, the enquiring users’ profiles are
compared with the existing user’ profiles and the enquiring users are returned a risk assessment
score for that disease. Contrary to the various existing approaches used to make disease assessment
for only a single disease, the framework presented in dissertation is capable of performing
simultaneous risk assessments about multiple diseases for several users.

24
The second module of the proposed framework recommends the health experts to end-
users. To identify the health experts for the enquiring users to seek advice at no cost, the tweets of
the users who regularly use Twitter [3.7] were used. The users specify the name of the disease in
their query and in turn are offered a ranked list of experts for that disease. The tweets from health
professionals are either related to health issues where the experts are mostly speaking about their
experiences with patients or the tweets may be to promote health awareness in the public besides
other social tweets.
Likewise, large numbers of tweets containing health related terms are by another category
of users that are not health professionals. Instead the users may be: (a) current or past patients of a
disease whom they talk about more frequently, (b) family members of the individuals suffering
from a particular disease, and (c) health activists and journalists who are not doctors. Such users
are usually knowledgeable enough to guide the other users or patients having no or little exposure
about that disease and therefore, the approach considers such types of users as the expert users in
this framework. However, they are not regarded as the doctor experts. Hereafter, the doctors and
physicians are termed as the doctor experts, whereas those mentioned above are characterized as
the non-doctor experts. However, it is important for the framework to separate doctors from non-
doctor experts. The tasks of user segregation and the subsequent ranking are performed by
employing the hubs and authority [3.8] based approach.
To perform the tasks of disease risk assessment about several diseases for multiple users
simultaneously and to process the large tweets repositories to identify and rank the experts, parallel
task execution mechanisms and enormous amount of storage are required. Therefore, cloud
computing based scalable solutions seem apt not only to support the task of parallelization but also
to meet enormous data storage and processing requirements for the proposed framework. The

25
tweet repositories are updated and maintained by executing periodic jobs in offline mode to collect
and preprocess the tweets to identify disease specific experts in an efficient manner.
3.2. Research Contributions
The main contributions of the proposed methodology are as follows:
A cloud based framework capable of integrating the Collaborative Filtering (CF), social media
platform, and social network analysis techniques to manage large volumes of health Big-data
is presented.
An approach for disease risk assessment using the CF is presented. The approach is capable of
simultaneously entertaining multiple users’ queries to make risk assessments for different types
of diseases.
An expert recommendation module is proposed to help users seek advice from the health
experts available on Twitter. The hub and authority based approach is employed to ensure that
the users are recommended the most relevant and popular experts (doctors or non-doctors) as
specified in the users’ queries.
The experiments for the disease risk assessment are conducted on the National Health and
Nutrition Examination Survey (NHANES 2009—2010) dataset whereas the validity of expert
user recommendation module is performed on a huge collection of health related tweets.
Experimental results testify the effectiveness of the approach in turning the Twitter into a Web
based collaborative health community.
The framework is implemented as a Software as Service (SaaS) to offer scalable processing,
storage, and task parallelization.
The scalability analysis is conducted by increasing the workload and the number of resources
for both of the modules.

26
3.3. Motivation
Since last few years, the use of portable computing devices and smart phones has
excessively increased to perform informational searches about health over the Internet. Pew
Internet Project survey of year 2013 reported that around 72% of the Internet users consulted the
Internet to find health information during the year 2012 [3.9]. A total of 16% of the online
information seekers in the said survey were interested in finding the people having similar
concerns, 30% of the users referred to online reviews and treatment services, while 26% of the
users looked for the experiences of others on certain health related issues [3.9]. Moreover, due to
the rising healthcare costs, individuals have also started taking initiatives to keep themselves
healthy. Considering the importance of patient-centric healthcare services, several online tools for
health risk assessments have been developed.
Data mining and machine learning approaches have widely been used for disease risk
prediction, prevention, classification, and disease surveillance. Despite the capabilities of the
aforementioned models in developing better understanding about the causes of diseases and to
learn the appropriate counter measures, they pose realistic challenges concerning the data size,
complexity, and data biases. Consequently, the development of more scalable and efficient
approaches to discover the meaningful patterns from health data is needed more than ever [3.10].
In this regard, an approach that uses collaborative filtering to make risk assessment about diseases
is presented. Contrary to the several existing methodologies that permit disease risk assessment
for only one disease, the proposed CFDRA approach is capable of making risk assessment for
several diseases and several patients simultaneously. Moreover, the CFDRA has capability to
manage large datasets by reducing their sizes. The influential profile attribute that contributes more
than the other attributes in the presence or absence of a disease is selected. Based on the influential

27
attribute, the profiles of all of the existing patients of that disease are retrieved for subsequent
comparison with the profile of the enquiring user.
Online health communities and social networking websites, such as Twitter and Facebook
have also emerged as the big sources of health related data. Users of the social media networks
share and exchange knowledge and experience about various diseases and health related issues.
The apparent purpose of expressing the feelings about health on public platforms like Twitter may
be to seek out the advice or suggestions from the experts who also use social media to share their
experiences. The Pew Internet Project survey [3.9] also reveals that searching online health support
by construing through the health microblogs and Web based health communities proves an
inexpensive or mostly free alternative, particularly for the uninsured individuals. Besides
convenient conversations with peers, psychological support is a major benefit of the online health
communities [3.11].
Considering the efficacy of online health communities, the potential of these communities
needs to be fully utilized to enhance awareness about health related matters and to offer health
consultations at low or no cost. Therefore, this is the appropriate time to develop pervasive tools
and methodologies having integrative support to help users make assessments about the health and
to seek expert advice from doctors and patients participating in the social media communities. This
work also proposes an interaction mechanism between the patients and health experts from
Twitter. Twitter is currently a massive data source containing discussions ranging from political
affairs to the health related issues. According to Symplur [3.12], Twitter currently contains
558,624,884 healthcare tweets, around 10,000 doctor profiles, and 5,039 health communities.
Besides the names of the diseases for which risk assessment is to be performed, the enquiring users
also specify whether they are interested in consulting the doctor experts or non-doctor experts. An

28
important task during expert user recommendation process is to identify the doctors and non-
doctors based on tweets instead of the Twitter profiles because not all of the Twitter users mention
their profession in the profile. Generally, it has been observed that the tweets by the doctors contain
more specialized medical terms related to the disease(s) besides the general disease names,
whereas the non-doctors’ tweets related to health usually contain names of the commonly known
diseases. This observation serves as the basis for the proposed expert user recommendation module
to segregate the doctors and non-doctor experts from the huge corpus of tweets.
It is anticipated that the framework would be useful for individuals interested in making
risk assessment for several diseases and to obtain the health advice at low or no cost. The
framework can be accessed from broad range of devices, such as desktop computers, smartphones,
and tablet PCs to utilize the offered services. The framework ensures ubiquitous delivery of health
related information to patients and can prove a great tool to make users or patients aware about
health affairs so that they could devise their wellness plans accordingly. Moreover, the framework
can be useful to avoid doctor visits for consultation because the information about health issues
can easily be obtained using the presented Web based services. Furthermore, the users are
recommended disease specific experts who may subsequently be contacted via Twitter, email, or
through any other communication medium that is agreed upon by both the patients and the experts.
3.4. Proposed System Architecture
The architecture of the proposed cloud based framework for personalized healthcare
services for disease risk assessment and wellness management comprises of the following major
modules: (a) disease risk assessment module and (b) expert user recommendation module. The
architecture of the proposed framework is depicted in Figure 3.1. The framework is capable of
managing disease risk assessment queries simultaneously for several querying users. Moreover,

29
Figure 3.1: Architecture of the proposed cloud based framework
the expert user recommendation module utilizes the huge corpus of health related tweets to identify
the health experts that are most relevant to the user query. It requires large amount of storage and
parallel processing to periodically update the tweet repositories to efficiently answer users’
queries. Therefore, the framework is implemented as an interface to the cloud environment because
of the key characteristics of the cloud computing, such as the scalability, pervasiveness, and cost
effectiveness [3.13]. The details about the architecture of the proposed framework are presented
in Section 3.4.1 and Section 3.4.2.
3.4.1. Disease Risk Assessment Module
To make assessment about the occurrence of diseases that a person may have in future, an
approach called Collaborative Filtering-based Disease Risk Assessment (CFDRA) is presented.
The CFDRA approach determines the similarities between the profiles of enquiring users and the
existing patients or users who have been diagnosed the same disease. The CF is the most popular
technique employed in recommender systems to predict the information regarding the preferences
of a certain user from large datasets by computing the similarities with the other users [3.14].

30
In recommender systems, the preferences or tastes of different users are considered to be
similar if their assigned ratings/values about different items resemble. However, there are no items
and ratings in the case of disease risk prediction [3.10]. Instead there are different types of
attributes, such as the continuous, categorical, and binary attributes. Therefore, the proposed
framework uses the normalized weights for each of the profile attributes. Normalizing the attribute
values is important because some of the attributes may have significantly high values than the
other attributes that eventually affects the overall assessment score. For example, the value of age
will always be significantly higher than the attributes having binary values. Therefore, normalizing
helps in confining the values between 0 and 1. Figure 3.2 presents the working of disease risk
assessment module. The symbols used throughout the chapter are defined in Table 3.1. Contrary
to various existing approaches, such as [3.15] and [3.16] that focus on developing prediction
models about any specific disease only, the approach proposed in this dissertation is capable of
making predictions for multiple individuals with different disease risk assessment queries. The
framework stores the profiles of existing users having similar diseases together. The rationale is to
avoid the excessive computations that may have to be performed in case when a single query is
matched with the entire database of diseases with millions of dissimilar disease profiles.
Figure 3.2: Disease risk assessment module

31
Table 3.1: Symbols and definitions
Symbol Definition Symbol Definition
𝑄 Set of querying users 𝐼 set of importance scores of all attributes
𝑒 Existing user 𝐼𝑎 importance score of attribute a.
𝑑 Disease for which risk assessment is to be
done 𝑞ϻ Important attribute in user query
ɋ Enquiring user Ʀ Risk assessment score
Ƥ Profiles of existing users 𝑈 Set of users
𝛾 Shortlisted profiles of existing users 𝐾 Set of keywords
𝛿 profiles of users having a particular attribute 𝑎𝑑 Authority score for a disease d
¥ profiles of users without influential attribute ℎ𝑑 Hub score for a disease d
𝐴 set of all attributes in the users’ profiles 𝑀 Matrix
𝐸 List of expert users 𝐾𝑑 set of Keywords against disease d
𝑇𝑑 collection of tweets against disease d 𝑇𝑘 collection of tweets against keyword k
𝑈𝑑 set of users collected who had tweeted about
disease d 𝐶𝑢𝑘𝑑 number of times user u have used
keyword k of disease d in his/her tweets
ᴍ𝑑 user to keyword popularity matrix for disease
d 𝑁 number of required expert users
In other words, to perform the risk assessment about a disease x, only the profiles of
patients or users having disease x should be matched, not the entire database of diseases. The users’
profiles consist of several attributes, such as the age, gender, ethnicity, height, weight, and several
other attributes that are amply specific to a disease. These attributes may have significant impacts
on the presence or absence of a disease in an individual. A disease risk assessment system that
utilizes multiple attributes for numerous diseases, gives rise to high data volumes that eventually
results in the demands for compute-intensive infrastructure. Therefore, to make processing
efficient, the CFDRA minimizes the dataset search space by applying a reduction approach based
on the importance or influence of the attributes. However, it is also ensured that reducing the
dataset size does not affect the prediction accuracy. The profile attributes of a diabetic patient may
include the “age”, “gender”, “ethnicity/race”, “height”, “weight”, “diagnosed high blood sugar or
pre-diabetes”, “diabetes family history”, “physical activity”, “ever observed high blood pressure”,
“blood cholesterol”, and “smoking”. The selection of user profiles is made on the basis of the

32
attribute that highly affects the presence of that disease. For example, family diabetes history is an
important marker for the presence or absence of diabetes in an individual because of the genetic
disposition [3.17]. Therefore, the profiles of users that have a diabetic family history are retrieved
for subsequent profile matching. The approach can be generalized to all of the diseases because
for every disease such influential attributes exist. Moreover, the CFDRA approach observes the
value of the influential attribute in the profile of enquiring user. Based on the observed value, only
the profiles of the existing users are retrieved to compute the similarities. There are a number of
similarity metrics proposed in the literature, such as Pearson Correlation, Cosine Similarity, and
Jaccard index.
The Pearson Correlation is similar to the Cosine Similarity matrix except that it subtracts
the average ratings of all the items given by the users from the value of item rated by that user.
The Pearson correlation performs better if all the ratings are given against similar items, for
example the movies. However, in case of medical records, the values of users for the attributes,
such as the “age” and “family diabetes history” cannot be correlated to each other as one is
continuous and other is a binary attribute. Similarly, the Jaccard Index is used if all the attributes
are binary in nature. Therefore, Cosine Similarity measure is appropriate for medical data where
attributes are of different types, such as continuous, discrete, and binary. The proposed CFDRA
approach also uses the Cosine Similarity for similarity computation between the profile of the
enquiring user and the existing users or patients. To compute the Cosine Similarity between the
profiles of the enquiring user 𝑞 and each of the existing users’ 𝑒, both 𝑞 and 𝑒 are represented as
the vectors and the Cosine of the angle between these two vectors is computed [3.18]. The
following equation is used to compute the Cosine Similarity 𝑠𝑖𝑚 (𝑈𝑞 , 𝑈𝑒):
𝑠𝑖𝑚(𝑞, 𝑒) =∑ (𝑞𝑖×𝑒𝑖
𝑛𝑖=1 )
√∑ (𝑞𝑖)2𝑛𝑖=1 ×√∑ (𝑒𝑖)2𝑛
𝑖=1
(3.1)

33
After the similarities are computed, the following equation is used to compute the risk
prediction 𝑃(𝑞, 𝑑) for disease 𝑑, for a given user:
𝑃(𝑞, 𝑑) = 𝑟𝑞 +∑ 𝑠𝑖𝑚(𝑞,𝑒)(𝑣𝑒,𝑑−𝑣𝑒)𝑒∈𝑈
∑ 𝑠𝑖𝑚(𝑞,𝑒)𝑒∈𝑈 (3.2)
where 𝑟𝑞 is the row mean of each of the attributes of 𝑞, 𝑣𝑒,𝑑 represents the predicted value of
disease 𝑑 for the existing user 𝑒, and 𝑣𝑒 represents the mean for particular attribute of the existing
user. The algorithm for disease risk prediction is presented as Algorithm 3.1.
In Line 1—Line 4, for each attribute in the set of existing profile attributes, Algorithm 3.1
identifies the important or influential attribute with the high count for a particular value of
attributes that may play significant role in the presence or absence of a disease. This is the attribute
that is present in most of the profiles having the enquired disease. The PARFOR statements in the
algorithm show that the tasks are being performed in parallel. The profiles of all of the existing
users are retrieved in Line 5. Line 6—line 16 compare the profiles of each of the enquiring users
with the existing users and the task is executed in parallel for multiple users and multiple diseases.
In Line 7—Line11, it is determined whether the attribute identified in Line 4 is present in the query
of the enquiring user. In case the attribute is found in the profile of the enquiring user with the
value equal to “YES”, the profiles of existing users having the corresponding value of that attribute
are retrieved in Line 8. Otherwise the profiles of the users having value “NO” for that attribute are
retrieved in Line 10. Line 12—Line 14, compute the similarities between the profile of the
enquiring user and the existing users as presented in Eq.3.1. The disease risk assessment score is
computed in Line 15 using Eq. 3.2 and the calculated score is returned in Line 17.

34
3.4.2. Expert User Recommendation Module
The expert user recommendation module finds the expert users who frequently tweet on
Twitter particular to the health activities. The proposed framework considers two types of users as
the expert users namely: (a) the doctors and (b) non-doctor experts. Figure 3.3 depicts the working
of expert user recommendation module. The expert user recommendation module works by
evaluating the tweets to segregate the doctor and non-doctor experts based on the health related
keywords used in tweets. Separating doctors from non-doctors on the basis of tweets is important
because not all of the Twitter users mention their professions in the Twitter profile that makes it
difficult to determine that whether a user is a doctor or a non-doctor.
______________________________________________________________________________ Algorithm 3.1: Disease Risk Assessment
_______________________________________________________________________________
Input: Set of querying users 𝑄 for disease đ
Output: Disease risk assessment score Ʀ for all querying users 𝑄
Definitions: đ = disease profile, ɋ = enquiring user, Ƥ=profiles of existing users, 𝛾=shortlisted
profiles of existing users, 𝛿=profiles of users having a particular attribute,
¥= profiles of users that do not have a particular attribute, 𝐴 = set of all attributes in the users’ profiles,
𝐼= set of importance scores of all attributes, 𝐼𝑎 = importance score of attribute a.
1: 𝐏𝐀𝐑𝐅𝐎𝐑 attribute 𝑎 ∈ 𝐴 do
2: 𝐼𝑎 ← 𝑔𝑒𝑡𝐼𝑚𝑝𝑜𝑟𝑡𝑎𝑛𝑐𝑒(đ)
3: end PARFOR
4: ϻ ← 𝑔𝑒𝑡𝐼𝑚𝑝𝑃𝑟𝑜𝑓𝑖𝑙𝑒𝐴𝑡𝑡𝑟𝑖𝑏𝑢𝑡𝑒𝑠(𝐼)
5: Ƥ ←r𝑒𝑡𝑟𝑖𝑒𝑣𝑒𝑃𝑟𝑜𝑓𝑖𝑙𝑒𝑠( )
6: 𝐏𝐀𝐑𝐅𝐎𝐑 𝑞𝑢𝑒𝑟𝑖𝑛𝑔 𝑢𝑠𝑒𝑟 𝑞 ∈ 𝑄 𝐝𝐨
7: if (𝑞ϻ == 𝑡𝑟𝑢𝑒) then
8: γ ← {ϻ ∈ Ƥ|ϻ ∉ 𝛿 }
9: else
10: 𝛾 ← {ϻ ∈ Ƥ|ϻ ∉ ¥ }
11: end if
12: PARFOR 𝑢𝑠𝑒𝑟 𝑒 ∈ 𝛾 𝐝𝐨
13: 𝑆𝑞𝑒 ← 𝑠𝑖𝑚(𝑞, 𝑒)
14: end PARFOR
15: 𝑅𝑞 ← 𝑔𝑒𝑡𝐴𝑠𝑠𝑒𝑠𝑚𝑒𝑛𝑡𝑆𝑐𝑜𝑟𝑒(𝑆, 𝛾)
16: end PARFOR
17: Return R
_____________________________________________________________________________
______________________________________________________________________

35
To separate the doctors from non-doctors, tweeting patterns of the doctors and non-doctors
were observed. The doctors’ tweets contain not only the generic health terms but also the
specialized medical terminologies pertaining to a disease. For example, for diabetes, the relevant
terms, such as “insulin”, “blood sugar”, “metformin”, “pre-diabetes”, “mellitus”, “Type 1”, “Type
2”, “glucose”, “metabolic”, “polygenic”, “ketogenic” etc. are commonly found in doctors’ tweets.
On the other hand, the tweets by non-doctors usually contain generic keywords including the
disease names and symptoms, such as “feeling sick”, “suffering”, “my doctor”, “blood pressure”,
“aching”, “muscles”, “pain” etc. Although the non-doctors may also use specialized medical terms
in their tweets but it rarely happens. Therefore, to identify the health experts based on the use of
health related terms and keywords in tweets, the hubs and authorities based approach is employed.
WordNet was used to retrieve domain-specific health and medical terminologies. WordNet is a
lexical database for English language comprising of Sets of Synonyms (Synsets), nouns, and verbs
[3.19].
Figure 3.3: Expert user recommendation module
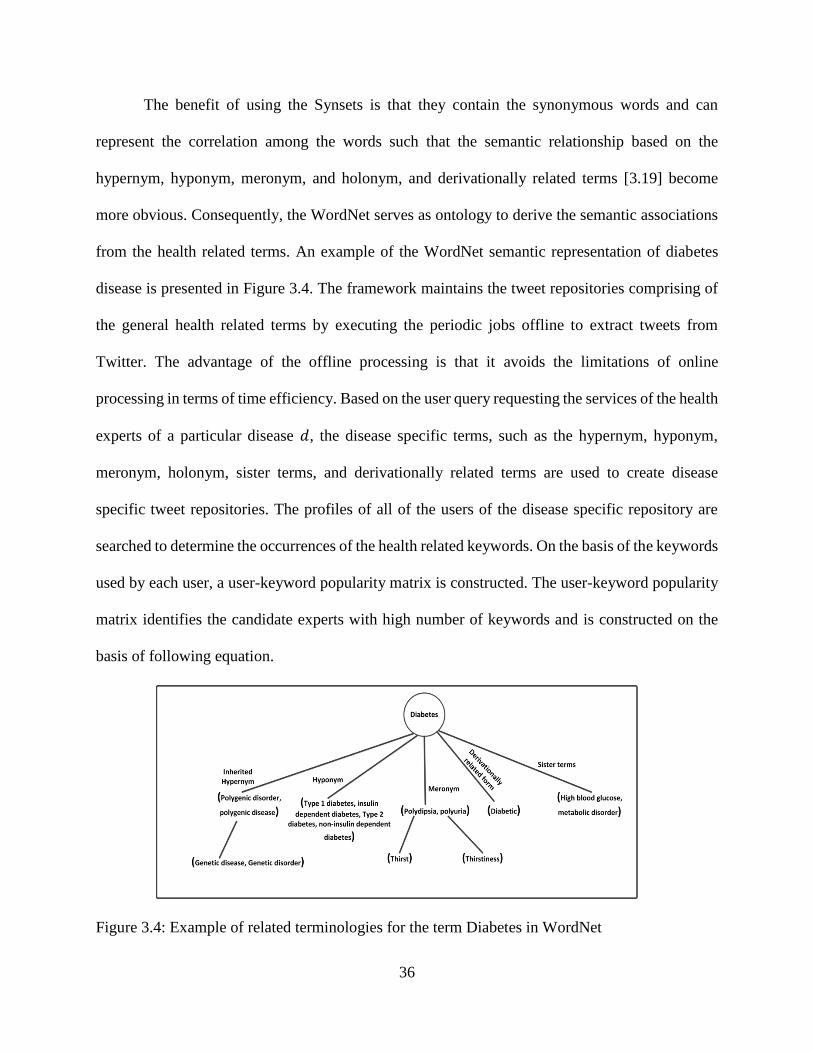
36
The benefit of using the Synsets is that they contain the synonymous words and can
represent the correlation among the words such that the semantic relationship based on the
hypernym, hyponym, meronym, and holonym, and derivationally related terms [3.19] become
more obvious. Consequently, the WordNet serves as ontology to derive the semantic associations
from the health related terms. An example of the WordNet semantic representation of diabetes
disease is presented in Figure 3.4. The framework maintains the tweet repositories comprising of
the general health related terms by executing the periodic jobs offline to extract tweets from
Twitter. The advantage of the offline processing is that it avoids the limitations of online
processing in terms of time efficiency. Based on the user query requesting the services of the health
experts of a particular disease 𝑑, the disease specific terms, such as the hypernym, hyponym,
meronym, holonym, sister terms, and derivationally related terms are used to create disease
specific tweet repositories. The profiles of all of the users of the disease specific repository are
searched to determine the occurrences of the health related keywords. On the basis of the keywords
used by each user, a user-keyword popularity matrix is constructed. The user-keyword popularity
matrix identifies the candidate experts with high number of keywords and is constructed on the
basis of following equation.
Figure 3.4: Example of related terminologies for the term Diabetes in WordNet

37
𝑈𝑖𝑑 = ∑ 𝐾𝑖𝑗
𝑑 𝑗∈𝐽 (3.3)
where 𝑈𝑖 is set of users and 𝐾𝑖𝑗 represents the keyword 𝑗 used by a user 𝑖 specific to any disease
𝑑. The experts identified using the keyword popularity may or may not be the actual health experts
as desired by the user because it is quite probable that despite of the high keyword count and
frequent use of archetypal health terms, the identified candidate expert is a non-doctor (a patient,
family member of the patient, health activists, and health journalists). Therefore, for the enquiring
users interested in interaction with the non-doctor experts, the keyword popularity based approach
works reasonably well. However, when the interaction with the doctors is requested, the approach
based on keyword popularity does not seem effective because it determines popularity on the basis
of the total number of keywords by a user. This leads to the assumption that the users repeating
only a few archetypal keywords in their tweets may possibly be non-doctor experts whereas the
doctors use specialized medical terminologies that are less known to the common people.
Therefore, the keyword popularity is not a true characterization of the capabilities of experts,
particularly for the doctors. It is more important for the framework to accurately identify the
experts as the potential doctors and non-doctor experts for a disease by providing a ranking score
for each of them.
A more appropriate way to avoid the experts identification biased towards the keyword
frequency is to take into account multiple keywords that are related to a specific disease and then
generate the ranking scores. Therefore, Hyperlink-Induced Topic Search (HITS) [3.8] algorithm
is used to identify and rank the experts that are adequately knowledgeable about the health matters.
The HITS algorithm uses the concepts of hubs and authorities to accomplish the ranking task by
performing repeated improvements. The HITS was originally proposed as the solution to the Web
search problem where a page that points to many other pages is considered as a hub whereas an
38
authority is the page pointed by many other pages [3.8]. In other words, a page pointed by the other
pages having high hub scores is assigned the higher authority weights. Likewise, for the pages
pointing to multiple high authority pages, a high hub weight is assigned.
In the proposed framework, the purpose of using hubs and authorities is to identify the
users that use a set of keywords with varying frequencies. Similarly, a set of keywords that is being
used by the experienced users is also identified to make the ranking process more explicit. The
expert users are considered as the hubs, whereas the keywords used by the expert users are
considered as the authorities. The hubs (users) that use good authorities (keywords) are assigned
higher weights. Similarly, the popular keywords used by the good hubs (expert users) are assigned
higher weights that significantly affect the ranking process. In fact, the importance of both the
keywords and the users of keywords are helpful in identifying the experts. To produce the ranking
of the expert users based on the hubs and authority scores for a particular disease 𝑑, a matrix 𝑀
with 𝑈 rows and 𝑉 columns is created. Suppose [ℎ𝑑] and [𝑎𝑑] be the matrices for hub and
authority scores. The authority and hub scores are calculated using Eq. 3.4 and Eq. 3.5,
respectively.
𝑎𝑑 = 𝑀𝑑𝑇 × ℎ𝑑 (3.4)
ℎ𝑑 = 𝑀𝑑 × 𝑎𝑑 (3.5)
Similarly, the authority and hub scores at any i-th iteration are given by Eq. 3.6 and Eq.3.7,
respectively.
𝑎𝑑𝑖 = (𝑀𝑑
𝑇 × 𝑀𝑑 ) × 𝑎𝑑𝑖−1 (3.6)
ℎ𝑑𝑖 = (𝑀𝑑 × 𝑀𝑑
𝑇 ) × ℎ𝑑𝑖−1 (3.7)

39
The approach works recursively by assigning all the hubs and authorities as the initial score
of 1 followed by the authority update rule to the current score. On the resulting scores, the hub
update rule is applied. Algorithm 3.2 presents the steps for the expert user recommendation
module. In Line 2 of Algorithm 3.2, the keywords related to the disease 𝑑 are obtained from the
WordNet. From Line 3–Line 6, the tweets repository is searched against each of the keywords to
identify the disease specific tweets. From Line 7–Line 10, the users that frequently tweet for a
particular disease 𝑑 are identified. From Line 11–Line 16, the tweets are tokenized and it is
identified that how many times a user uses disease specific keywords in his/her tweets. Based on
the results from Line 11–Line 16, the user keyword matrix is generated in line 17. Line 18
identifies the top candidate experts and line 19 identifies the top experts using the hubs and
authorities method. Line 20 selects and returns the required number of top N experts. Line 22
updates the experts list for each disease to respond to the future queries. An example of expert user
identification using the hubs and authorities is given below.
The task of expert user identification and ranking using the hubs and authorities is
explained with the help of an example by capturing the tweets related to diabetes. Suppose 𝑈 =
{𝑈1, 𝑈2, … , 𝑈𝑛} and 𝐾 = {𝐾1, 𝐾2, … , 𝐾𝑛} be the sets of candidate expert users and the keywords,
respectively. Table 3.2 presents the candidate expert users based on the frequency of diabetes
related keywords in the tweets.
The experts were identified on the basis of use of following set of keywords: {K1=Diabetes
mellitus, K2=Polyuria, K3=Polygenic, K4=Diabetes, K5=Blood glucose, K6=Juvenile}. As can be
observed from Table 3.2 that the tweets by users 𝑈2 and 𝑈4 contain only a few keywords and one
keyword used by both of the users has high frequency.

40
Despite not using all of the keywords, the row sum values for the keywords used by 𝑈2 and 𝑈4 are
sufficiently large. Therefore, according to the supposition users 𝑈2 and 𝑈4 can be considered as
the non- doctor experts who only repeat one or a few keywords in the tweets. However, the users
𝑈1 and 𝑈3 are using several keywords pertaining to one disease. To determine the popularity of an
expert, the hub and authority based approach instead of only considering the total count of
keywords used by an expert relies on both the popularity of the keyword and popularity of the
____________________________________________________________________ Algorithm 3.2: Expert User Identification
__________________________________________________________________________
Output: List of expert users 𝐸
Definitions: 𝐷 = set of Diseases, 𝐾𝑑 = set of Keywords against disease d, 𝑇𝑑 = collection of
tweets against disease d, 𝑇𝑘 = collection of tweets against keyword k, 𝑈𝑑 =set of users collected
who had tweeted about disease d, 𝐶𝑢𝑘𝑑 = number of times user u have used keyword k of disease d
in his tweets, ᴍ𝑑= user to keyword popularity matrix for disease d, 𝑁= number of required expert
users
1: PARFOR disease 𝑑 ∈ 𝐷 do
2: 𝑘𝑑 ←keyWordsSearch(𝑑)
3: PARFOR keyword 𝑘 ∈ 𝐾𝑑 do
4: 𝑇𝑘 ← 𝑠𝑒𝑎𝑟𝑐ℎ𝑇𝑤𝑒𝑒𝑡𝑅𝑒𝑝𝑜𝑠𝑖𝑡𝑜𝑟𝑦(𝑘)
5: 𝑇𝑑 ← 𝑇𝑑 ∪ 𝑇𝑘
6: end PARFOR
7: PARFOR tweet 𝑡 ∈ 𝑇𝑑 do
8: 𝑢 ←extractUser(𝑡)
9: 𝑈𝑑 ← 𝑈𝑑 ∪ 𝑢
10: end PARFOR
11: PARFOR user 𝑢 ∈ 𝑈𝑑 do
12: ut ← tokenize(𝑢)
13: PARFOR keyword 𝑘 ∈ 𝑘𝑑 do
14: 𝐶𝑢𝑘𝑑 ← 𝑔𝑒𝑡𝐾𝑒𝑦𝑤𝑜𝑟𝑑𝐶𝑜𝑢𝑛𝑡𝐼𝑛𝑃𝑟𝑜𝑓𝑖𝑙𝑒(𝑢𝑡, 𝑘)
15: end PARFOR
16: end PARFOR
17: ᴍ𝑑 ← 𝑔𝑒𝑛𝑒𝑟𝑎𝑡𝑒𝑀𝑎𝑡𝑟𝑖𝑥(𝑈𝑑 , 𝐾𝑑 , 𝐶𝑑)
18: Ḉ𝑑 ← 𝑔𝑒𝑡𝑇𝑜𝑝𝐶𝑎𝑛𝑑𝑖𝑑𝑎𝑡𝑒𝐸𝑥𝑝𝑒𝑟𝑡𝑠(ᴍ𝑑)
19: 𝑅𝑑 ← 𝑔𝑒𝑡𝑅𝑎𝑛𝑘𝑒𝑑𝐸𝑥𝑝𝑒𝑟𝑡𝑠(ᴍ𝑑)
20: 𝐸𝑑 ← 𝑔𝑒𝑡𝑇𝑜𝑝𝑅𝑎𝑛𝑘𝑒𝑑𝐸𝑥𝑝𝑒𝑟𝑡𝑠(𝑅𝑑 , 𝑁)
21: end PARFOR
22: Update E
_______________________________________________________________________________________

41
expert. Suppose the initial hubs and authority scores be, ℎ𝑑0 = [1,1,1,1]𝑇and 𝑎𝑑
0 =
[1,1,1,1,1,1]𝑇, respectively. By recursively applying the HITS algorithm, the hub and authority
scores are updated in each iteration. Table 3.3 and Table 3.4 present the hub and authority score,
respectively. The algorithm converges at 38-th iteration for the hub score and at the 39-th iteration
for the authority score. The hub and authority scores for the first and last iteration are shown in
Table 3.3 and Table 3.4, respectively. It can be observed from Table 3.3 that the hub score for 𝑈1
in the 1-st iteration has the highest value whereas the users 𝑈3, 𝑈4, and 𝑈2 are at 2-nd, 3-rd, and
4-th positions, respectively. However, as we iterate through the HITS algorithm and apply the hub
update and authority update rules, the hub scores change in each of the iterations. In 38-th iteration,
the hub score of 𝑈4 turns out to be the lowest that actually was 2-nd lowest in the 1-st iteration.
The user 𝑈3 having the second highest hub score in 1-st iteration emerges as the user with the
highest hub score in 38-th iteration.
Table 3.2: User-keyword matrix
K1 K2 K3 K4 K5 K6
U1 6 1 2 2 6 1
U2 - 3 - 10 2 -
U3 3 1 2 4 7 -
U4 3 - - - - 12
Table 3.3: Hub score
Iteration No. U1 U2 U3 U4
1 0.281 0.218 0.265 0.234
38 0.275 0.249 0.278 0.196
Table 3.4: Authority score
Iteration No. K1 K2 K3 K4 K5 K6
1 0.197 0.060 0.067 0.235 0.246 0.191
39 0.190 0.065 0.068 0.258 0.254 0.163

42
Similarly, the hubs scores at 38-th iteration for users 𝑈1 and 𝑈2 are the second and third
highest, respectively. Table 3.4 presents the authority score for each of the keywords. It can be
observed that 𝐾4 and 𝐾5 gain the position of two keywords having the highest and second highest
authority score. It means that both 𝐾4 and 𝐾5 are the most important keywords at the convergence
iteration. The hub and authority scores presented in Table 3.3 and Table 3.4 sufficiently validate
our statement that for being the most popular and the most expert user it is not necessary to use or
repeat the popular words only. Instead, it depends on both the importance of the keyword as well
as the importance of the users of that keyword.
It can be noted from Table 3.2 that the keywords 𝐾4 and 𝐾5 are among the most popular
keywords because of their high frequencies. On the other hand, Table 3.3 shows the highest
authority scores for 𝐾4 and 𝐾5; whereas the authority score for 𝐾1 is the third highest that had low
count even than 𝐾6. The keyword 𝐾4 besides having the higher frequency is also being used by
𝑈1 and 𝑈3 that results in high authority score for 𝐾4. Interestingly, 𝐾6 that was used twelve times
by 𝑈4 has the lowest authority score and the reason is that it is being used by the user with the low
hub score. As a whole, the hubs that use good authorities (keywords) and the use of good keywords
by the experienced hubs affects the overall ranking score. The expert users that gain high hub
scores at the convergence iteration are considered as the doctor experts while the others with low
hub scores are identified as the non-doctor experts. In the above example, 𝑈1 and 𝑈3 are accurately
identified as the doctor experts whereas 𝑈2 and 𝑈4 are correctly identified as the non-doctor
experts. Therefore, depending on whether the query of the enquiring user demands for consultation
with the doctor or non-doctor expert, the list of users identified as the hubs can be sorted
accordingly to offer the recommendation. In conclusion, the hubs and authority based popularity
ranking shows that to derive the importance of the users, merely the excessive use of only one or

43
a few keywords is not necessary. Instead the importance of the keywords and users and the use of
several disease specific keywords with reasonably large frequency also affect the overall hub and
authority scores.
Moreover, the framework uses caching mechanism to reduce the time consumption for
queries requiring expert user identification for the same diseases by multiple users. In other words,
the time required for duplicate searches to identify experts is reduced by temporarily storing the
results of users’ queries in cache. For each user query, the results are cached for a small time and
if within that time a user query is received requesting the experts for the same disease, then that
query is also responded by selecting the expert from the cached list. This reduces the query
response time and also can allow the system to scale better. However, it is also important to
mention that overly caching and storing the results for a quite longer period of time may degrade
the accuracy and can result in increased demand of resources, such as memory.
3.5. Prototype Implementation
The prototype of the framework is implemented as Software as a Service (SaaS). The SaaS
model of cloud permits to host the software as the service that is made available to the customers
via Internet [3.3]. A key benefit of the SaaS model is the significant reduction in Information
Technology (IT) costs at the customers’ end. The users are relieved of the tasks of infrastructure
development and maintenance [3.20]. Instead the users are charged according to the pay-as-you-
go model to access the services. Based on the user query for risk assessment of a particular disease,
the framework performs the profile matching of one user with multiple existing users or patients
having the similar disease through the collaborative filtering. The experiments were conducted on
Ubuntu cloud computing setup comprising of Supermicro SuperServer SYS-7047GR-TRF
systems. The end users can access the framework to specify their queries using computers,

44
smartphone, and other handheld devices. The mapping of the proposed framework to the cloud
environment is presented in Figure 3.5.
It is important to mention that the patients having similar disease profiles are stored
together in the framework. Consequently, a particular user query requesting assessment for any
disease is only mapped to the patients having profiles similar to that of the enquiring user. For
multiple users, the process can be applied simultaneously to multiple user profiles in a parallel
manner. The framework also offers a service to help users interact with the disease experts on the
Twitter. To access the tweets from Twitter, twitteR package of R [3.21] was used. The framework
contains a general tweets repository that is further subdivided into disease specific tweet
repositories by matching with the disease specific keywords obtained from the WordNet semantic
ontology. The expert users as specified in the query of enquiring user are segregated from the tweet
repositories based on the use of disease specific keywords and ranked using the hubs and
authorities based approach.
Figure 3.5: Cloud service mapping of the proposed framework

45
All of the above mentioned tasks related to expert user recommendation are preprocessed
and are performed in offline mode by executing parallel jobs to avoid the overhead occurring due
to real-time processing for time consuming tasks, such as the extraction of tweets from Twitter,
processing the tweets to maintain disease specific tweet repositories, and segregation of the expert
users. Based on a user query, the preprocessed list of disease specific experts is retrieved and
provided to the user. This helps in efficiently responding to the user queries in real-time. Moreover,
to ensure that the users are provided the updated information, the task of offline preprocessing is
performed periodically to update both the tweet repositories and the lists of experts.
3.6. Results and Discussion
To determine the efficacy of the framework experiments were conducted. The results for
the two modules are discussed in detail in the proceeding subsections.
3.6.1. Evaluation of Disease Risk Assessment Module
The performance of the proposed CFDRA module was evaluated through comparison with
various popular approaches and classifiers, such as the CART, logistic regression, Naïve Bayes
classifier, BF decision tree, MLP, Bayesian Network, RF, RoF, and the approach presented in
[3.15]. The brief description of the related techniques used for comparison is presented below.
3.6.1.1. Classification and Regression Tree (CART)
The CART is a tree based model for classification that uses the cross-validation for the
selection of appropriate tree [3.16]. The method works by recursively partitioning the data space
where each partition can be represented as a decision tree. The CART based approaches have been
applied on various clinical and demographics variables for classification purposes.

46
3.6.1.2. Logistic Regression
Logistic regression is a standard classification method widely used for disease risk
prediction. The outcomes in logistic regression are the class labels based on multiple features or
predictors [3.22].
3.6.1.3. Naïve Bayes
Naïve Bayes uses the strong attribute independence assumption and is used to develop
models with high predictive capabilities [3.23]. The conditional independence of attributes greatly
minimizes the computation cost. The posterior probability of occurring of 𝑋 given each 𝐶𝑖 is
calculated as in Eq. 3.8.
𝑃(𝐶𝑖|𝑋) =𝑃(𝑋|𝐶𝑖)𝑃(𝐶𝑖)
𝑃(𝑋) (3.8)
3.6.1.4. Best First (BF) tree
The BF tree expands the nodes in best-first order. The node that maximally minimizes the
impurity is considered as the best node and is included in the decision tree [3.24]. An attribute
from all the context attributes is selected and the branches are made based on some predefined
criteria. The training object pairs extending from the root node are split into subsets. The
aforementioned process is repeated for a chosen branch of tree till a specific number of expansions
of the tree.
3.6.1.5. Bayes Net
The Bayesian Network classifier is a probabilistic model that characterizes a set of random
variables and their conditional dependence upon each other through a Directed Acyclic Graph
(DAG) [3.25]. The Bayesian Networks are used to represent the relationship between the
symptoms and diseases that are subsequently used to compute the probability of occurrence of a
disease.

47
3.6.1.6. Multilayer Perceptron (MLP)
The MLP is class of supervised neural networks that is frequently used in medical decision
support systems for diagnoses. The multilayer perceptron comprises of at least three or more layers
of nodes, namely the input layer, hidden layer, and the output layer [3.26]. For the input received
at the input layer, processing is performed at the successive layers till the output is received at the
output layers.
3.6.1.7. Random Forest (RF)
The RF is an ensemble learner capable of generating several classifiers and then integrating
their results. The RF creates multiple CART trees and each of them is trained on a bootstrap sample
of the original training dataset [3.27]. Each of the trees in RF casts the vote for certain input and
the classifier output is subsequently computed by majority voting.
3.6.1.8. Rotation Forest (RoF)
The RoF is a relatively new ensemble classifier for feature extraction and is capable of
transforming the dataset while preserving all of the information using the Principle Component
Analysis (PCA) [3.28]. By rotating the subspaces of the original dataset, the classifiers with
features are constructed. In addition we, also compared the result of the proposed CFDRA
approach with the Support Vector Machine (SVM) based approach presented in [3.15].
The NHANES (2009-2010) [3.29] survey data was used for comparison of the CFDRA
with the above mentioned approaches. The NHANES is a program of study for health and nutrition
status assessment of children and adults in the United States. The reason to use NHANES 2009-
2010 dataset is that it encompasses the life styles of the population of the U.S. with sufficiently
large amounts of data on demographics, diet, examination, and laboratory reports. Experiments
were conducted to make risk assessment for diabetes. The variables used to perform the risk
assessment for diabetes include “age”, “gender”, “ethnicity/race”, “height”, “weight”, “ever

48
diagnosed high blood sugar or pre-diabetes”, “diabetes family history”, “physical activity”, “ever
observed high blood pressure”, “blood cholesterol”, “smoking”, and “ever diagnosed diabetes”.
The data of over 5,000 users with the ages ranging from 18-years to 80-years was collected.
The dataset was evaluated using the k-fold cross validation with k=10. The cross validation is
typically a method used to estimate the predictive capability of a model [3.30]. The dataset is
divided into k-folds, where one fold is used as the testing fold while the remaining k-1 folds are
used as the training folds. Repeating the process k-times ensures that all of the examples both from
the training and testing data are used for analysis. To evaluate the performance of the CFDRA
approach with the other approaches, the common model evaluation metrics, such as the precision,
recall, and F-measure [3.31] were used.
Precision is the ratio of correct (True Positives) disease predictions regarding the presence
or absence of a disease to the total number of occurrences of disease (True Positive (TP) + False
Positive (FP)), given as:
𝑃𝑟𝑒𝑐𝑖𝑠𝑜𝑛 =𝑇𝑃
𝑇𝑃 +𝐹𝑃 (3.9)
Recall is defined as the ratio of correctly identified patients to the total size of testing set.
In other words, recall is the probability of identification of a randomly selected user profile in the
set and is given as:
𝑅𝑒𝑐𝑎𝑙𝑙 =TP
TP +FN (3.10)
where FN stands for False Negative.
F-measure uses both the precision and recall and is the harmonic mean of precision and
recall values and is given as:
𝐹 − 𝑚𝑒𝑎𝑠𝑢𝑟𝑒 =2TP
2TP+FP +FN (3.11)

49
The approach was evaluated by testing the accuracy against the values of the attribute “ever
diagnosed diabetes” (YES or NO) in the dataset. The “YES” and “NO” respectively represent that
the person is either a diabetic patient or not a patient. Figure 3.6 presents the comparison results
for the case “YES” when the test patients had diabetes, whereas the comparison results for the case
“NO” are presented in Figure 3.7. The SVM based approach presented in [3.15] is depicted as
“SVM” in Figure 3.6 and Figure 3.7.
The reason to evaluate the algorithms for both types of aforementioned data is that
estimating the algorithm on only one type of examples (YES or NO) does not accurately predict
the presence or absence of a disease. A good prediction technique should identify both the patients
and healthy individuals with higher accuracy. As can be observed from Figure 3.6 and Figure 3.7
that the CFDRA approach achieved significantly high precision, recall, and F-measure and
performed better than several compared approaches.
The other approaches, such as the BF tree, RoF, SVM, Naïve Bayes, and MLP also
exhibited reasonably good results. However, logistic regression and the RF turned low in terms of
accuracy. The results by the logistic regression, Naïve Bayes, RF, and RoF were more dependent
on the attribute “disease family history” while the attributes “height” and “weight” did not have
any significant effect on the prediction.
On the other hand, in CFDRA, the attribute “ever diagnosed high blood sugar or pre-
diabetes” was observed as the most important attribute due to the high count of negative (No)
responses by the users. In conclusion, the presented approach of identifying one important attribute
first and then retrieving the profiles on the basis of that attribute not only achieves high accuracy
but also is computationally efficient because of the smaller datasets.

50
3.6.2. Evaluation of Expert User Recommendation Module
To evaluate the performance of the expert user recommendation module, around 3,363
profiles (doctors and non-doctors) of Twitter users containing a total of 396,655 tweets by using
the keywords related to the disease “diabetes” were collected. Downloading the tweets using
Twitter API is restricted by the rate limits that eventually requires large amount of time to collect
the tweets. Therefore, the task was performed offline by executing periodic jobs. The keywords
presented in Table 3.5 were used by using the WordNet dictionary to retrieve the tweets. Around
3% of the user profiles were manually identified and flagged as medical doctors due to their self-
claim as doctor on their Twitter profile. The recommended lists of doctors as a result of applying
the hubs and authority based approach were compared with the profiles that were manually
collected. The total number of TP, TN, FP, and FN were determined and on the basis of those the
precision, recall, and F-measure scores were calculated.
Figure 3.6: Comparison of the proposed CFDRA approach with the related approaches for case
(YES)

51
Figure 3.7: Comparison of the proposed CFDRA approach with the related approaches for case
(NO)
Moreover, the hub and authority based approach to identify and rank the experts was
compared with the popularity based approach using the row sum method and the approaches
presented in [3.32] and [3.33]. The approach presented in [3.32] identifies the topical authorities
in microblogs by using the features, such as the topical signals and mention impacts of the users
for calculating the ranked lists. The approach presented in [3.33] identifies the expert users by
calculating their topical expertise. Each technique is executed 20 times and their average results
about precision, recall, and F-measure are shown in Figure 3.8, Figure 3.9, and Figure 3.10. It can
be observed that the values for precision, recall, and F-measure for the proposed approach termed
as Expert User Recommendation Module (EUR) in Figure 3.8, Figure 3.9, and Figure 3.10 are
higher than the compared approaches for Top-k experts, where k = (5, 10,15, 20).
Moreover, the results for precision, recall, and F-measure for the proposed approach are
significantly higher than the compared approaches even for large values of k (for example, k=15
and k=20). Among the three compared approaches, the approach proposed in [3.33] performed

52
substantially better than the other two approaches. However, the accuracy of the popularity based
approach using the row sum method was significantly low. This testifies the efficacy of the
proposed hubs and authorities based approach that segregates the expert users based on the use of
several important keywords by the popular experts.
3.6.3. Complexity Analysis
The complexity analysis of the algorithms for the disease risk assessment and expert user
recommendation are presented in this section. Algorithm 3.1 presents the steps used for disease
risk assessment. Line 1–Line 4 of algorithm 3.1 takes 𝑂 (𝑛 × 𝑎), where n represents the number
of profiles and a is the number of profile attributes. The operation at Line 5 takes 𝑂 (𝑛) to execute.
Execution of either of Line 8 and Line 10 takes 𝑂 (𝑛). Each of the Line 12–Line 14 executes in
𝑂 (𝑛). Line 15 calculates the risk assessment score and also has complexity 𝑂 (𝑛). The overall
complexity from Line 6–Line 16 will be 𝑂(𝑄 × 𝑛), where 𝑄 is the set of enquiring users. The total
complexity becomes 𝑂 ((𝑛 × 𝑎) + (𝑄 × 𝑛)). Because a is very small as compared to n, therefore,
the complexity in worst case is considered as 𝑂 (𝑄 × 𝑛). Moreover, the parallel execution of
Table 3.5: WordNet keywords used to retrieve tweets
Diabetes Specific Terms Used
Diabetes
Pre-diabetes
Insulin
Blood sugar
Blood glucose
Metformin
Diabetes mellitus
Type 1 diabetes
Type 2 diabetes
Metabolic
disorder
Polygenic
disorder
Ketogenic
Insulin dependent
diabetes
Insulin independent
diabetes
Polydipsia
Polyuria
Adult onset diabetes
Diabetes insipidus
Ketosis resistant
diabetes
Hypoglycemic
agents
Nephrogenic
diabetes insipidus
Juvenile diabetes Ketoacidosis-
prone diabetes
Episodic ketoacidosis
Autoimmune
diabetes

53
algorithm further results in the decrease in complexity, which is given as 𝑂((𝑄 × 𝑛) 𝑝⁄ ), where p
represents the number of processors used for computations.
Algorithm 3.2 presents the steps to identify and rank the expert users from the Twitter using
the hubs and authorities based method. Line 2 of Algorithm 3.2 executes in 𝑂 (𝑘), where 𝑘 is the
number of keywords. Line 3–Line 6 search the repositories and have complexity 𝑂 (𝑇 × 𝑘), where
𝑇 represents the tweets. The operations in Line 7-Line 10 extract the users based on the use of
keywords and have combined complexity of 𝑂(𝜕 × 𝑇 × 𝑘) = 𝑂(∪). In other words, it is the worst
case complexity for extracting all the possible users from the database. Line 11–Line 16 execute
in 𝑂(∪× 𝑥 × 𝑘), where 𝑥 be the number of tokens. Line 17 and Line 18 execute in 𝑂(∪× 𝑘) and
𝑂(∪), respectively. Line 19 takes 𝑂(𝑛 × (∪2+ 𝑘2)) to identify and subsequently rank the users.
The total complexity of Algorithm 3.2 for 𝑑 diseases becomes 𝑂(𝑑 × ( (𝑇 × 𝑘) + (∪× 𝑥 × 𝑘) +
(𝑛 × (∪2+ 𝑘2))).
Figure 3.8: Comparison of the Precision of the proposed EUR approach with related approaches

54
3.6.4. Scalability Analysis
The performance of the framework was also evaluated in terms of scalability. An algorithm
is scalable if by increasing the resources, such as the number of processors, the efficiency of the
algorithm does not decrease significantly [3.34]. In other words, with the increase in workload the
processing time should be maintained within desirable limits by increasing the number of
resources, such as the processors. The elasticity or scalability of the cloud permits the on-demand
procurement of resources.
Amazon Elastic Compute Cloud (EC2) [3.35], the commercial cloud service provider, also
provides the resources, for example, the processors, memory, and storage on the basis of prices
that the consumers are willing to pay. Therefore, the effects of varying the number of processors
and the data sizes on execution time were observed because it is the most critical factor that
determines the efficiency of the proposed framework in terms of query response time.
Figure 3.9: Comparison of the Recall of the proposed EUR approach with related approaches

55
Figure 3.10: Comparison of the F-measure of the proposed EUR approach with related
approaches
Figure 3.11 presents the effects of increasing the number of processors and the number of
user profiles on the execution time for the disease risk assessment module. For the disease risk
assessment module, increasing one processor results in decrease in the execution time by 12.69 %
on an average, whereas doubling the amount of data increases the execution time by 28.97 % on
an average. Figure 3.12 also presents the effects of increasing the number of processors and the
data size on execution time for the expert user recommendation module. It can be observed from
Figure 3.12 that the execution time increases significantly with the increase in data size. However,
increasing the number of processors results in minimizing the execution time. With the increase
of one processor, the execution time decreases by 7.15 % on an average, whereas doubling the
amount of data increases the execution time by 9.01 % on an average. For both of the modules,
relatively small decreases in time consumption were observed when the number of processors was
increased over six. The offline processing time per query for the expert user recommendation
module is still very high. The apparent reason for increase in time consumption is that the

56
overheads, such as the processor startup time, and inter-processor communication time also
contribute to the total time consumption [3.34]. Therefore, increasing the additional number of
processors results in increased overheads that contribute to the increased response time. The offline
processing time per query for Therefore, the proposed framework periodically executes the jobs
in offline mode to collect the tweets from the Twitter, evaluates the tweets based on the disease
specific keywords, updates the disease specific tweet repositories, and identifies and subsequently
ranks the experts. A user query requesting a recommendation about the experts is responded by
returning the expert users identified during the offline processing. This results in response time
against a query because all of the compute-intensive tasks are already preprocessed by the cloud
using Algorithm 3.2. Moreover, to give a better insight about the performance of each of the
modules in terms of scalability, numbers of Transactions Per Second (TPS) per processor are also
computed. This analysis helps in determining the ability of the framework to handle the TPS per
processor.
Figure 3.11: Relationship between the processing time, no. of processors, and data size for
CFDRA

57
Figure3.12: Relationship between the processing time, no. of processors, and data size for EUR
Figure 3.13: Transactions per second per processor for the CFDRA approach
For each of the disease risk assessment module and the expert user recommendation
module, the number of transactions is defined differently. For the disease risk assessment module,
the number of existing users’ profiles that the framework is able to compare per second is
considered as the TPS. Likewise, the amount of data size in MBs per second is the TPS for the
expert user recommendation module.

58
Figure 3.14: Transactions per second per processor for the EUR approach
Figure 3.13 and Figure 3.14 present the analysis according to the number of TPS per
processor for workloads of different sizes for risk assessment module and expert recommendation
module, respectively.
3.7. Conclusions and Future Work
In this chapter, a cloud based framework that enables the Web and mobile users to make
risk assessments about probable diseases is presented. Collaborative filtering based approach for
disease risk assessment that computes similarities between the profiles of enquiring users and the
existing users is employed. The results of proposed disease risk assessment approach were
compared to various approaches and classifiers, such as the CART, Naive Bayes, logistic
regression, MLP, BF-tree, RF, RoF, SVM, and Bayesian Network. The accuracy of the proposed
approach was found significantly higher than the approaches used for comparison. Moreover, an
approach that utilizes Twitter data to offer users an opportunity to interact with the health experts
for consultation is presented. By observing the tweets related to health, the health experts were
identified and ranked them by using the concept of hubs and authorities. The comparison of the
approach with the state-of-the-art approaches shows significant improvements in terms of
2 4 6 8 10 12
0.2
0.25
0.3
0.35
0.4
No. of Processors
TP
S p
er P
roce
ssor
103MB
206MB
309MB

59
accuracy. It is expected that the proposed framework will prove as the basis for the researchers to
combine the predictive modeling approaches and the social media networks to develop
collaborative health communities where the patients can obtain health information and seek advice
from the experts without any cost.
The framework will be extended in future by mining the tweets for diseases based on the
geographical locations of the users. The geographical locations will help to understand the current
spread of diseases and to identify and recommend the doctors based on the diseases in specific
area. Recommending the doctors to the users belonging to the same geographical region can help
the individuals or patients to contact the doctors physically as well, if required. In addition, another
important open issue worth exploring is identification of fake user profiles from Twitter. Several
machine learning-based, graph theory-based, and honeypot harvesting approaches have been
proposed recently for the said purpose [3.36], [3.37], and [3.38]. The techniques collect the users’
behaviors through tweet patterns and classify them as genuine or fake. Likewise identification of
fake profiles through analysis of tweet contents, reputation scores, number of duplicate tweets, or
number of URLs per tweet has also been performed [3.39]. Integrating the approaches employed
in the above mentioned works to identify fake users with the proposed framework will certainly
enhance the reliability and accuracy of the system.
3.8. References
[3.1] J. Bughin, M. Chui, and J. Manyika, “Clouds, big data, and smart assets: Ten tech-
enabled business trends to watch,” McKinsey Quarterly56, no. 1, 2010, pp. 75-86.
[3.2] M. A. Barrett, O. Humblet, R. A. Hiatt, and N. E. Adler, “Big data and disease
prevention: From quantified self to quantified communities,” Big Data 1, no. 3, 2013, pp.
168-175.

60
[3.3] A. Abbas, K. Bilal, L. Zhang, and S. U. Khan, “A cloud based health insurance plan
recommendation system: A user centered approach, “Future Generation Computer
Systems,vols. 43-44, 2015, pp. 99-109.
[3.4] K. Mille, “Big Data Analytics in Biomedical Research,” Biomedical Computation
Review, 2012, pp. 14-21.
[3.5] S. U. Khan, “Elements of Cloud Adoption,” IEEE Cloud Computing Magazine, vol. 1,
no. 1, 2014, pp. 71-73.
[3.6] B. Kayyali, D. Knott, and S. V. Kuiken, “The big-data revolution in US health care:
Accelerating value and innovation,” Mc Kinsey & Company, 2013, pp. 1-13.
[3.7] “Twitter”, http:// www.twitter.com, accessed on September 13, 2014.
[3.8] D. Easley and J. Kleinberg, Networks, Crowds, and Markets: Reasoning About a Highly
Connected World, Cambridge University, Press, 2010.
[3.9] S. Fox, M. Duggan, “Health online 2013,” http://www.pewinternet.org/files/old-
media/Files/Reports/PIP_HealthOnline.pdf, accessed on September 1, 2014.
[3.10] N. V. Chawla, and D. A. Davis, “Bringing big data to personalized healthcare: a patient-
centered framework,” Journal of general internal medicine28, no. 3, 2013, pp. 660-665.
[3.11] K. Zhao, J. Yen, G. Greer, B. Qiu, P. Mitra, and K. Portier, “Finding influential users of
online health communities: a new metric based on sentiment influence,” Journal of the
American Medical Informatics Association, 2014, pp. 1-7.
[3.12] “Healthcare Social Media Analytics,” http://www.symplur.com/healthcare-social-media-
analytics/, accessed on September 18, 2014.

61
[3.13] A. R. Khan, M. Othman, S. A. Madani, and S. U. Khan, “A Survey of Mobile Cloud
Computing Application Models,” IEEE Communications Surveys and Tutorials, vol. 16,
no. 1, 2014, pp. 393-413.
[3.14] A. Abbas, L. Zhang, and S. U. Khan, “A Survey on Context-aware Recommender
Systems Based on Computational Intelligence Techniques,” Computing, vol. 97, no. 7,
2015, pp. 667-690.
[3.15] W. Yu, T. Liu, R. Valdez, M. Gwinn, and M. J. Khoury, “Application of support vector
machine modeling for prediction of common diseases: the case of diabetes and pre-
diabetes,” BMC Medical Informatics and Decision Making, vol. 10, no. 1, 2010, pp. 16
[3.16] K. E. Heikes, D. M. Eddy, B. Arondekar, and L. Schlessinger, “Diabetes Risk Calculator
A simple tool for detecting undiagnosed diabetes and pre-diabetes,” Diabetes Care 31,
no. 5, 2008, pp. 1040-1045.
[3.17] J. Lindström, Jaana, and J. Tuomilehto, “The Diabetes Risk Score: A practical tool to
predict type 2 diabetes risk,” Diabetes care 26, no. 3, 2003, pp. 725-731.
[3.18] B. Sarwar, G. Karypis, J. Konstan, and J. Riedl, “Item-based collaborative filtering
recommendation algorithms,” In Proceedings of the 10th ACM international conference
on World Wide Web, 2001, pp. 285-295.
[3.19] G. A. Miller, “WordNet: a lexical database for English,” Communications of the
ACM 38, no. 11, 1995, pp. 39-41.
[3.20] A. Abbas and S. U. Khan, “A Review on the State-of-the-Art Privacy Preserving
Approaches in E-Health Clouds,” IEEE Journal of Biomedical and Health Informatics,
vol. 18, no. 4, 2014, pp. 1431-1441.

62
[3.21] “twitteR: R based Twitter client,” http://cran.r
project.org/web/packages/twitteR/index.html, accessed on October1, 2014.
[3.22] J. G. Liao, and K. –V. Chin, “Logistic regression for disease classification using
microarray data: model selection in a large p and small n case,” Bioinformatics 23, no.
15, 2007, pp.1945-1951.
[3.23] S. Palaniappan, and R. Awang, “Intelligent heart disease prediction system using data
mining techniques,” In IEEE/ACS International Conference on Computer Systems and
Applications, 2008, pp. 108-115.
[3.25] R. R. Bouckaert, “Bayesian network classifiers in weka for version 3-5-7,” Artificial
Intelligence Tools, vol. 11, no. 3, 2008, pp. 369-38.
[3.24] H. Shi, “Best-first decision tree learning,”
http://citeseerx.ist.psu.edu/viewdoc/download;jsessionid=966CB8346D86A79ECF45344
B4CB76D82?doi=10.1.1.149.2862&rep=rep1&type=pdf, accessed on October 8, 2014.
[3.26] H. Yan, Y. Jiang, J. Zheng, C. Peng, and Q. Li, “A multilayer perceptron-based medical
decision support system for heart disease diagnosis,” Expert Systems with
Applications 30, no. 2, 2006, pp. 272-281.
[3.27] M. Khalilia, S. Chakraborty, and M. Popescu, “Predicting disease risks from highly
imbalanced data using random forest,” BMC medical informatics and decision
making 11, no. 1, pp. 2011, pp. 51
[3.28] J. J. Rodriguez, L. I. Kuncheva, and C. J. Alonso, “Rotation forest: A new classifier
ensemble method,” IEEE Transactions on Pattern Analysis and Machine Intelligence, 28,
no. 10 2006, pp. 1619-1630.

63
[3.29] “National Health and Nutrition Examination Survey,”
http://wwwn.cdc.gov/nchs/nhanes/search/nhanes09_10.aspx, accessed on September 29,
2014.
[3.30] C. Porcel, A. T. Lorente, M. A. Martínez, and E. H. Viedma, “A hybrid recommender
system for the selective dissemination of research resources in a Technology Transfer
office,” Information Sciences 184, no. 1, 2012, pp. 1-19.
[3.31] P. Bedi and R. Sharma, “Trust based recommender system using ant colony for trust
computation,” Expert Systems with Applications, vol. 39, no. 1, 2012, pp. 1183-1190.
[3.32] A. Pal, and S. Counts, “Identifying topical authorities in microblogs,” In Proceedings of
the fourth ACM international conference on Web search and data mining, 2011, pp. 45-
54.
[3.33] Z. Cheng, J. Caverlee, H. Barthwal, and V. Bachani, Who is the Barbecue King of
Texas? A Geo-Spatial Approach to Finding Local Experts on Twitter,
http://faculty.cse.tamu.edu/caverlee/pubs/cheng_sigir14.pdf, accessed on October 14,
2014.
[3.34] M. Ahmed, I. Ahmad, and S. U. Khan, “A Theoretical Analysis of Scalability of the
Parallel Genome Assembly Algorithms,” in IEEE/EMB/ESEM/BMES International
Conference on Bioinformatics Models, Methods and Algorithms (BIOINFORMATICS),
Rome, Italy, January 2011, pp. 234-237.
[3.35] “Amazon EC2 Pricing,” http://aws.amazon.com/ec2/pricing/, accessed on October 12,
2014.
[3.36] S. Gurajala, J. S. White, B. Hudson, and J. N. Matthews, “Fake Twitter accounts: profile
characteristics obtained using an activity-based pattern detection approach,”

64
In Proceedings of the 2015 ACM International Conference on Social Media & Society,
2015, pp. 9.
[3.37] K. Thomas, D. McCoy, C. Grier, A. Kolcz, and Vern Paxson, “Trafficking Fraudulent
Accounts: The Role of the Underground Market in Twitter Spam and Abuse,”
In USENIX Security, 2013, pp. 195-210.
[3.38] K. Lee, B. David Eoff, and J. Caverlee, “Seven Months with the Devils: A Long-Term
Study of Content Polluters on Twitter,” In AAAI Int’l Conference on Weblogs and Social
Media (ICWSM), 2011, pp. 1-8.
[3.39] A.H. Wang, “Don't follow me: Spam detection in Twitter,” In Proceedings of the 2010
IEEE International Conference on Security and Cryptography (SECRYPT), 2010, pp. 1-
10.

65
4. A CLOUD BASED FRAMEWORK FOR IDENTIFICATION OF
INFLUENTIAL HEALTH EXPERTS FROM TWITTER2
4.1. Introduction
In this chapter, a cloud based scalable framework is proposed to support both the desktop
and mobile users to seek advice related to health affairs from the health experts who frequently
use Twitter. The framework analyzes the tweets related to different diseases by various doctors
and determines the most suitable health experts for a particular disease in that geographical area.
Twitter has emerged as vibrant health information source containing more than 784,893,181 health
related tweets, around 10,000 doctors and over 6,200 healthcare communities [4.1]. The
aforementioned figures are evidence of the increased use of Twitter for health related issues that
enables the quick information exchange without cost. The framework mainly comprises of two
modules: (a) candidate experts identification module and (b) influential user identification module.
The candidate experts are identified by using a variant of Hyperlink-Induced Topic Search (HITS)
[4.2] approach. Subsequently, the candidate experts are further analyzed to determine the
influential experts for a disease. The influential users are identified according to the prioritized
criteria indicated in the query of the querying user. The users can find the influential health experts
based on multiple criteria, such as: (a) number of followers of the expert, (b) health related tweets
2 This paper has been accepted in 15th International Conference on Scalable Computing and
Communications (ScalCom), Beijing, China, August 2015. The material in this chapter was co-
authored by Assad Abbas, Muhammad Usman Shahid Khan, Mazhar Ali, Samee U. Khan, and L.
T. Yang. Assad Abbas had primary responsibility for conducting experiments and collecting
results. Assad Abbas was the primary developer of the conclusions that are advanced here. Assad
Abbas also drafted and revised all versions of this chapter. Samee U. Khan served as proofreader
of the contents presented.
66
by the expert, (c) analyzing the followers’ sentiments in replies to the tweets by expert, and (d) the
retweets of the experts’ tweets. The rationale for offering multiple selection criteria is that only
one criterion cannot be a true characterization of the expertise of an individual. For example, the
following relationship on Twitter is slight casual where some individuals might just randomly
follow others who in courtesy can follow them back. Therefore, the reciprocity of the following
relationship is not a strong indicator of an individual’s expertise [4.3]. The proposed framework
exhibits great potential to turn the Twitter into a collaborative online health community where
people can discuss their health matters with the experts without any cost.
The framework performs the identification of multiple influential users simultaneously
across different geographical locations. Maintaining large tweet repositories requires scalable
infrastructure with massive storage and efficient processing. Therefore, cloud computing services
are utilized because of their ability to dynamically scale up and scale down according to the
workload characteristics. The framework executes the periodic jobs to update and maintain tweet
repositories and to subsequently identify the health experts. The reason to perform the offline
processing for identification of candidate experts and the influential users is that it may incur high
time overheads if the processing is performed online. Therefore, offline processing avoids the
limitations of online processing and minimizes the query response time. The key contributions of
the methodology are as follows:
A scalable framework that utilizes the cloud computing services to identify the influential
health experts from Twitter is presented.
A variant of HITS approach is employed to identify the candidate health experts based on the
health related keywords in their tweets.

67
An influence metric is proposed, which calculates the influence of the experts in terms of the
number of followers, sentiment analysis of the replies to the tweets by followers, health related
tweets, and the retweets to the experts’ tweets.
The framework is capable of managing multiple queries simultaneously by executing parallel
jobs to identify the experts from different geographical areas.
The scalability of the framework is demonstrated for workloads of different sizes.
4.2. Proposed System Architecture
The proposed framework utilizes the cloud computing services to identify health experts
from Twitter that best match with users’ queries. The Software as a Service (SaaS) implementation
of the framework allows the availability of the health expert recommendation service by means of
Internet. The tweets repositories are maintained by periodically executing the jobs to retrieve the
tweets from Twitter. To identify the expert users, the following tasks are performed: (a)
identification of candidate experts and (b) calculation of influential users. The architecture of the
proposed framework is presented in Figure 4.1. The steps to identify the experts are presented in
Algorithm 4.1.
4.2.1. Identification of Candidate Experts
Based on a user query, the tweets from the health experts are analyzed and parsed to extract
disease specific keywords. For the disease specific terminologies to analyze the tweets, WordNet
database [4.5] is used in the research. The benefit of using WordNet is that it is capable of
identifying the relationships between different keywords by using the hypernym, hyponym,

68
Figure 4.1: Architecture of the proposed cloud based framework for influential experts’
identification
meronym, holonym, and derivationally related terms [4.6]. Interested readers are encouraged to
consult [4.5] and [4.6] for more details on the hypernym, hyponym, meronym, holonym, and
derivationally related terms. Based on the frequency of health related keywords by the health
experts in their tweets, a keyword popularity matrix is generated. The set of users 𝑈 for a particular
disease 𝑑 is represented as below:
𝑈𝑖𝑑 = ∑ 𝐾𝑖𝑗
𝑑 𝑗∈𝐽 (4.1)
where 𝐾𝑖𝑗 is the j-th keyword used by the user 𝑖 for a particular disease 𝑑. However, the popularity
of the health experts based on the keywords count is not an exact depiction of the real health
experts because it only considers the total number of keywords in the tweets used by a particular
user. Consequently, the users who frequently repeat a few keywords in tweets may emerge as the
top experts. Therefore, to accurately identify the health experts, it is essential to consider the
frequency of keywords, importance of keywords, and the importance of the particular experts who

69
use the keywords. To this end, a variant of the hubs and authorities based approach is used to
identify the candidate expert users. The concept of hubs and authorities is based on a Hyperlink-
Induced Topic Search (HITS) approach that has been used in Web search such that the page that
points to several other pages is called hub whereas the pages that are pointed to by several other
pages are called authorities [4.2].
The proposed framework considers the health experts as the hubs and the keywords as the
authorities. An issue with the HITS approach is that the good hubs point mostly to the good
authorities. Therefore, the ranking decisions using the HITS for experts are mostly based on the
frequency of keywords used by important experts. However, there are multiple parameters that
contribute for identification of good hubs. The parameters include the usage of multiple different
keywords by an expert, importance (frequency) of the particular keywords, and the importance of
the hubs using those keywords. Therefore, the HITS approach is modified by multiplying the hub
scores with the number of distinctive authorities pointed by the hubs. Consequently, the final
ranking score for the hubs is more balanced and is not dependent merely on the frequency of
keywords. To identify the candidate experts for a particular disease 𝑑, a matrix 𝐴 with 𝑀 rows and
𝑁 columns is constructed. The authority and hub scores using Eq. 4.2 and Eq. 4.3, respectively are
calculated as follows:
𝑎𝑑 = 𝐴𝑑𝑇 × ℎ𝑑 (4.2)
ℎ𝑑 = 𝐴𝑑 × 𝑎𝑑 × Ƥ (4.3)
where 𝑎𝑑 and ℎ𝑑 represent the hubs and authorities, respectively and Ƥ is the number of distinct
authorities pointed by each of the hubs. The approach recursively works by assigning the hubs and
authorities scores initially equal to 1. In each of the iterations, the hub and authority scores are

70
updated and the scores at the converging iteration are considered as the final hub and authority
scores.
4.2.2. Influential User Identification
After the candidate experts have been identified through the hubs and authorities based
approach, the approach further refines the process of expert user identification to ensure that the
querying users are recommended the most relevant experts. Therefore, a metric is introduced that
computes the influence of each of the candidate experts. The influence of a user is calculated based
on: (a) the number of followers of the expert on Twitter, (b) total health related tweets, (c)
sentiments of the followers in replies to the tweets by experts, and (d) retweets.
The intuition behind using the aforementioned multiple criteria is that only single criteria,
for example the number of followers is not sufficient to determine the influence or popularity of
an expert on Twitter. Therefore, it is important to evaluate the influence of an expert based on
several different criteria. This will also enable the querying users to evaluate the influence of an
expert based on multiple prioritized criteria. The replies of the followers of a health expert are
important in determining the influence and reputation of a health expert. The users in their replies
to the tweets by the health expert express their sentiments. The sentiments expressed in the tweets
may be positive, negative, or neutral. To classify the sentiments from the replies to the tweets as
positive, negative, or neutral, the methodology uses Stanford CoreNLP library [4.7]. However,
only positive sentiments scores for the replies against all of the tweets of a particular health expert
are considered in the presented approach. It is important to mention that very small number of
replies to the tweets of the expert can also significantly affect the ranking of experts. For example,
if there is only one reply to the tweets of an expert and that too is positive, then it may not be a
true representation of the expertise and influence of a doctor. Therefore, the minimum number of

71
replies are restricted to at least five. The reason for considering the health related tweets as one of
the influence criteria is that a health expert may also tweet about some matters different from the
health. Therefore, considering the total number of tweets on all topics by the health experts may
significantly affect the total influence calculated for that expert. Likewise, the numbers of retweets
by the followers of an expert are also an important factor that can portray the influence and
popularity of an expert.
The users that are interested in finding the health experts based on the number of followers
assign high importance to that criteria in their queries. The users are returned a ranked list of the
health experts that best match with their query. The criterion with the high importance or priority
indicated by the user is assigned higher weights whereas those with the low importance are
assigned lower weights while ranking the experts. Weight assignment is an important task to rank
the experts based on some certain criteria. Rank Order Centroid (ROC) method [4.8] is employed
to assign weights to different criteria. In the ROC method, the weights to different attributes or
decision criteria are assigned according to their relative importance. The weight assignment using
the ROC is performed as follows:
𝑊𝑖 = (1
𝑘) ∑ (
1
𝑛) 𝑛
𝑘=1 (4.4)
where 𝑘 represents the number of different decision criteria. The final influence Ī is calculated as
follows:
Ī = ∑ (𝐶𝑟𝑛 × 𝑊𝑛)𝑘𝑛=1 (4.5)
where 𝐶𝑟𝑛 refers to the particular criteria and 𝑊𝑛 is the weight assigned to that criteria
Algorithm 4.1 presents the steps to identify and rank the influential health expert users
from the Twitter using the variant of HITS approach and the proposed influence metric. Line 2 of
Algorithm 4.1 executes in 𝑂 (𝑘), where k is the number of keywords. Line 3—Line 6 search the
repositories and have complexity 𝑂 (𝑇 × 𝑘), where 𝑇 represents the tweets. The operations

72
__________________________________________________________________________________
Algorithm 4.1: Expert User Identification
__________________________________________________________________________________
Output: List of health experts 𝐻𝐸
Definitions: 𝐷 = set of diseases, 𝐾𝑑 = set of Keywords against disease d, 𝑇𝑑 = tweets for disease d,
𝑇𝑘 = tweets collection for a keyword k, 𝑈𝑑 =set of users who tweet about a particular disease d,
𝐶𝑢𝑘𝑑 = frequency of a keyword k in the tweets of a user u for disease d in his/her tweets, ᴍ𝑑= user to
keyword popularity matrix for disease d, N= number of required expert users, , ҥt=ratio of health related
tweets to the total tweets, ἠ=retweets, Ẃ =weight assigned to each decision criteria, Ī = Influence Matrix,
and 𝑊𝑚 = weighted influence matrix for all possible combinations of weights.
23: PARFOR each 𝑑 ∈ 𝐷 do
24: 𝑘𝑑 ← keyWordsSearch(𝑑)
25: PARFOR each 𝑘 ∈ 𝐾𝑑 do
26: 𝑇𝑘 ← searchTweetRepository(𝑘)
27: 𝑇𝑑 ← 𝑇𝑑 ∪ 𝑇𝑘
28: end PARFOR
29: PARFOR tweet 𝑡 ∈ 𝑇𝑑 do
30: 𝑢 ← extractUser(𝑡)
31: 𝑈𝑑 ← 𝑈𝑑 ∪ 𝑢
32: end PARFOR
33: PARFOR user 𝑢 ∈ 𝑈𝑑 do
34: 𝑢𝑡 ← tokenize(𝑢)
35: PARFOR keyword 𝑘 ∈ 𝑘𝑑 do
36: 𝐶𝑢𝑘𝑑 ← 𝑔𝑒𝑡𝐾𝑒𝑦𝑤𝑜𝑟𝑑𝐶𝑜𝑢𝑛𝑡𝐼𝑛𝑃𝑟𝑜𝑓𝑖𝑙𝑒(𝑢𝑡, 𝑘)
37: end PARFOR
38: end PARFOR
39: ᴍ𝑑 ← 𝑔𝑒𝑛𝑒𝑟𝑎𝑡𝑒𝑃𝑜𝑝𝑀𝑎𝑡𝑟𝑖𝑥(𝑈𝑑 , 𝐾𝑑 , 𝐶𝑢𝑘𝑑)
40: Ḉ𝑑 ← 𝑔𝑒𝑡𝐶𝑎𝑛𝑑𝑖𝑑𝑎𝑡𝑒𝐸𝑥𝑝𝑒𝑟𝑡𝑠(ᴍ𝑑)
41: PARFOR each 𝑐 ∈ Ḉ𝑑 do
42: 𝑓 ← getFollowers(Ud)
43: Ş←getSentimentsScore()
44: ҥt ← getHealthTweets()
45: ἠ←getRetweets()
46: Ī𝑐 ←calculateInfluence(f, Ş, ҥt , ἠ)
47: 𝑊𝑚 ←calculateWeightedMatrix(Ī𝑐, 𝑊)
48: end PARFOR
49: PARFOR each 𝑐𝑤 ∈ 𝑠𝑒𝑡𝑜𝑓𝑃𝑜𝑠𝑠𝑖𝑏𝑙𝑒𝐶𝑜𝑚𝑏𝑖𝑛𝑎𝑡𝑖𝑜𝑛𝑠 𝑜𝑓 𝑤𝑒𝑖𝑔ℎ𝑡𝑠 do
50: 𝐸𝑐𝑤 ← 𝑔𝑒𝑡𝑇𝑜𝑝𝑅𝑎𝑛𝑘𝑒𝑑𝐸𝑥𝑝𝑒𝑟𝑡𝑠(𝑊𝑚𝑐𝑤)
51: end PARFOR
52: Update 𝐻𝐸
53: end PARFOR
___________________________________________________________________________

73
in Line 7—Line 10 extract the users and have complexity 𝑂(𝑈 × 𝑇). Line 11—Line 16 execute in
𝑂(∪× 𝑥 × 𝑘), where 𝑥 be the number of tokens. Line 17 and Line 18 execute in 𝑂(∪× 𝑘) and
𝑂(𝑚 × (∪2+ 𝑘2)), where 𝑚 represents the number of iterations required by the variant of HITS
to converge . Line 20 executes in 𝑂(1) and each of Line 21—Line 25 take 𝑂(𝑇) to execute.
Therefore, the total complexity from Line 19—Line 26 becomes 𝑂(𝑐 × 5𝑇), where 𝑐 being the
number of candidate experts. Line 27—Line 29 execute in 𝑂(24 × 𝑇 𝑙𝑜𝑔(𝑇)), where 𝑇 𝑙𝑜𝑔(𝑇) is
the time complexity to sort the list of top ranked experts. The total complexity of the algorithm to
find the experts for a disease 𝑑 becomes 𝑂(𝑑 × (𝑘(1 + 𝑇)) + (𝑈(𝑇 + 𝑥)) + (𝐾(1 + 𝑈)) +
(𝑚 × (∪2+ 𝑘2)) + (𝑐 + 𝑇𝑙𝑜𝑔𝑇)).
4.3. Results and Discussion
The effectiveness of the approach is evaluated in terms of recommendation accuracy and
scalability against varying workloads. Evaluation results for the expert user recommendation and
scalability are presented in subsequent subsections.
4.3.1. Evaluation of Expert User Recommendation Module
The performance of the expert user recommendation module in terms of accuracy was
evaluated and precision, recall, and F-measure [4.9] were used as the evaluation metrics.
The ratio of the accurately identified health experts (True Positives) to the total occurrences
(True Positive (TP) + False Positive (FP)) is termed as precision and is given as:
𝑃𝑟𝑒𝑐𝑖𝑠𝑜𝑛 =𝑇𝑃
𝑇𝑃 +𝐹𝑃 (4.6)
The identification probability of the randomly selected health expert from the total training
set (True Positive (TP) + False Negative (FN)) is called recall and is given as:
𝑅𝑒𝑐𝑎𝑙𝑙 =𝑇𝑃
𝑇𝑃 +𝐹𝑁 (4.7)

74
F-measure is the harmonic mean of both the precision and the recall values and is
represented as:
𝐹 − 𝑚𝑒𝑎𝑠𝑢𝑟𝑒 =2𝑇𝑃
2𝑇𝑃+𝐹𝑃 +𝐹𝑁 (4.8)
The tweets were collected by using the twitteR package of R [4.10]. The performance in
terms of accuracy was observed by collecting over 20,000 profiles of Twitter users who used the
health related terminologies in their tweets. Around 400,000 tweets related to the diabetes were
collected from the Twitter by using the hypernyms, hyponyms, meronyms, holonym, and
derivationally related terms through the WordNet. The aforementioned numbers also contain the
tweets that were provided by the Symplur on request. The tweets repositories are maintained and
updated by periodically executing the jobs in offline mode. The framework also performs the
computations of the hub and authority scores to identify the candidate experts and the influential
users in offline mode. The reason to perform the aforementioned tasks offline is that it requires
huge amount of storage and processing that eventually results in high query response time.
Therefore, the proposed cloud based framework effectively stores the large amounts of Twitter data
and performs intensive computation operations in offline mode for the identification of health
experts. Moreover, to minimize the query response time, the tweet repositories are preprocessed
based on the geographical locations.
The performance of the approach was evaluated in terms of accuracy by comparing with the
approaches presented in [4.4] and [4.11]. In addition, the proposed approach is compared with the
popularity based ranking approach called as the RowSum method that only considers the frequency
of keywords used by the health experts. The precision, recall, and F-measure for each of the
approaches are presented in Figure 4.2, Figure 4.3, and Figure 4.4, respectively where the proposed
approach is termed as Influential User Recommendation (IUR).

75
The performance of the IUR approach was observed to be sufficiently better as compared
to the other approaches in terms of precision, recall, and F-measure for Top-k experts with k=(5,
10, 15, 20). However, the approach by Cheng et al. [4.10] also turned with high accuracy as
compared to the approach presented in [4.4] and the popularity based approach. The popularity
based approach attained low accuracy particularly for Top-k experts with k= (10, 15, 20).
Interestingly the proposed IUR approach exhibited relatively high accuracy even at large k, such as
k= (15, 20). The comparison of results shows that the proposed approach that first identifies the
candidate experts and then calculates the influence of the candidates offers more accurate
recommendations.
In addition, offering users the facility to search and evaluate the experts by specifying four
different criteria helps to obtain personalized recommendation about help experts. Moreover, the
complexity of the proposed IUR approach is compared with the three approaches used for
comparison. The approach presented in [4.4] takes 𝑂(𝐾 × 𝑇 + 𝑈 𝑙𝑜𝑔 𝑈) to execute whereas the
approach by Cheng et al. [4.11] executes in 𝑂(𝑈 (1
𝑑+ 𝑈) + (𝑘 × 𝑇 + 𝑈 𝑙𝑜𝑔 𝑈)), where 𝑑 is the
distance between the users. Similarly, the complexity of RowSum 𝑂 ((𝑇 × 𝑘) + (𝑈 × 𝑇)+(∪× 𝑥 ×
𝑘) + 𝑇 log 𝑇). Apparently it seems that the proposed IUR methodology has more complexity as
compared to the three approaches. However, this includes the complexity for tweets parsing,
candidate expert identification, influential user identification, and weight assignment. On the other
hand, the compared approaches only consider only single task of experts’ identification. Therefore,
considering that most of the time consuming tasks are performed offline, the complexity of
responding real-time queries for the IUR approach is reasonably acceptable.
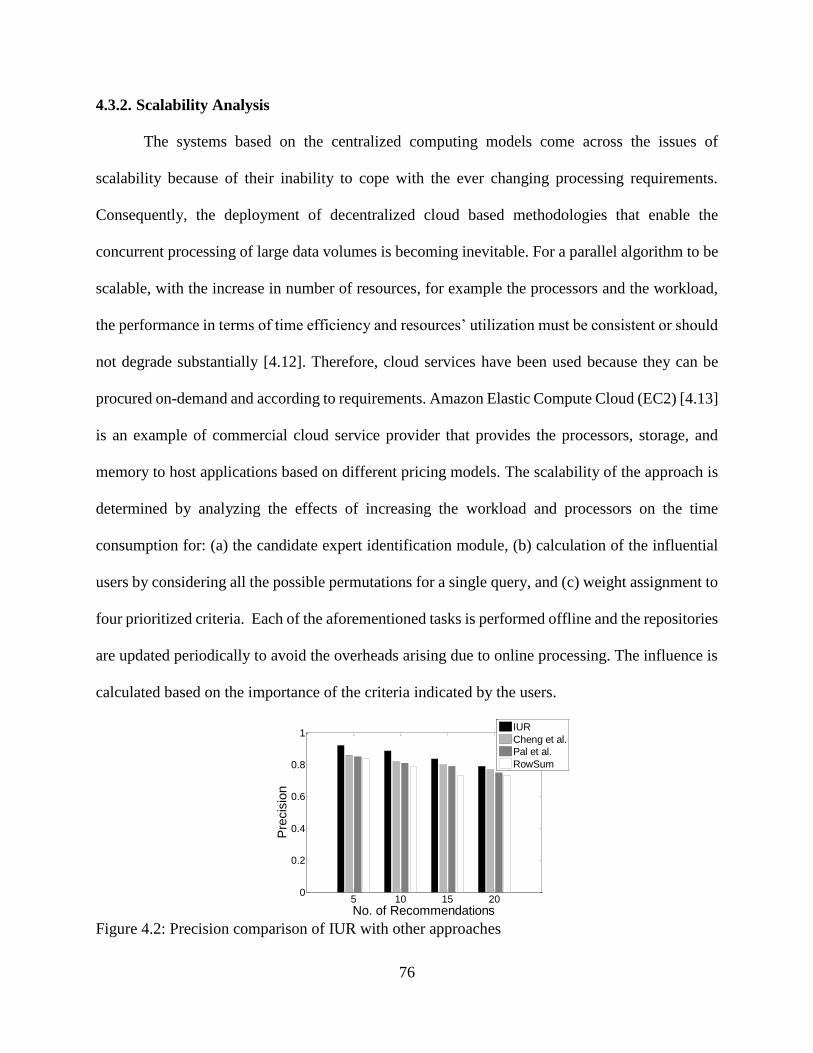
76
4.3.2. Scalability Analysis
The systems based on the centralized computing models come across the issues of
scalability because of their inability to cope with the ever changing processing requirements.
Consequently, the deployment of decentralized cloud based methodologies that enable the
concurrent processing of large data volumes is becoming inevitable. For a parallel algorithm to be
scalable, with the increase in number of resources, for example the processors and the workload,
the performance in terms of time efficiency and resources’ utilization must be consistent or should
not degrade substantially [4.12]. Therefore, cloud services have been used because they can be
procured on-demand and according to requirements. Amazon Elastic Compute Cloud (EC2) [4.13]
is an example of commercial cloud service provider that provides the processors, storage, and
memory to host applications based on different pricing models. The scalability of the approach is
determined by analyzing the effects of increasing the workload and processors on the time
consumption for: (a) the candidate expert identification module, (b) calculation of the influential
users by considering all the possible permutations for a single query, and (c) weight assignment to
four prioritized criteria. Each of the aforementioned tasks is performed offline and the repositories
are updated periodically to avoid the overheads arising due to online processing. The influence is
calculated based on the importance of the criteria indicated by the users.
Figure 4.2: Precision comparison of IUR with other approaches
5 10 15 200
0.2
0.4
0.6
0.8
1
No. of Recommendations
Pre
cis
ion
IUR
Cheng et al.
Pal et al.
RowSum

77
Figure 4.3: Recall comparison of IUR with other approaches
Figure 4.4: F-measure comparison of IUR with other approaches
Because there are four criteria over which users can view the ranking decisions, it makes a
total of 24 different possible combinations to evaluate the final ranking or influence of an expert
for a single query. Obviously, it is impractical to calculate ranking score for each of the
combinations at run-time to manage the queries of users from different geographical regions.
Therefore, executing the parallel and periodic jobs not only avoids high processing delays but also
ensures the availability of updated information at all the times. The performance of all of the
modules is evaluated in terms of time consumption by increasing the number of users and the
number of processor. The time consumption to identify the expert users from 20,542, 41,084, and
5 10 15 200
0.1
0.2
0.3
0.4
0.5
No. of Recommendations
Recall
IUR
Cheng et al.
Pal et al.
RowSum
5 10 15 200
0.1
0.2
0.3
0.4
0.5
No. of Recommendations
F-m
easure
Score
IUR
Cheng et al.
Pal et al.
RowSum

78
82,168 user profiles by varying the number of processors was observed. Figure 4.5 shows the
scalability results with different workloads and number of processors to identify the candidate
health experts using the variant of HITS approach. The results show that increasing number of
users two times resulted in sudden increase in the processing time. However, substantial decreases
in time consumption were observed by increasing the number of processor. On average, by
increasing the number of user profiles twice increases the time consumption by approximately
38.72% whereas increasing one processor resulted in an average decrease of 16.27% for the
candidate experts identification task. It is also important to note that by increasing the number of
processors more than a certain limit, relatively small decreases in processing time were observed.
The reason is that this time also includes the overheads, such as the processor start up time and the
communication time between the two processors. For large number of processors, the
aforementioned overheads also increase and consequently affect the total execution time [4.12].
Figure 4.5: Execution time analysis for different no. of users and processors to identify candidate
experts

79
Figure 4.6: Execution time analysis for different no. of users and processors to identify
influential users
Figure 4.6 shows the execution time corresponding to the three workloads for influential
user identification module. The influential users’ identification module calculates the number of
followers of each of the experts, performs sentiment analysis, and calculates the health related
tweets and the retweets. Consequently, for each candidate expert, four different tasks are to be
performed, which requires parallel task processing to speed up the query response time. By
increasing the number of profiles twice, the average combined increase in time consumption is
72.03% whereas an average decrease of approximately 66.37% is observed by increasing one
processor at a time. Figure 4.7 shows the processing time for weight assignment to various decision
criteria. For each user query, the framework performs weight assignment according to 24 different
combinations. This requires sufficient computations that result in increased processing time, if
performed online. It also appears from Figure 4.7 that the time consumption for weight assignment
task is sufficiently less than the two other modules. The reason is that weight assignment is only
subtask of the process of influential user identification that has to be performed repeatedly.

80
Figure 4.7: Execution time analysis for different no. of users and processors for weight
assignment
It is evident from the above discussion and results that all the tasks starting from the tweets
extraction to the influential user identification require enormous processing time and resources.
Therefore, query response time can only be reduced if all the tasks demanding heaving
computations are preprocessed and periodically updated to ensure the provision of the most recent
information about health experts. The experimental results also reveal that with the increase in
workload and processors, the algorithm substantially maintains the efficiency in terms of time
consumption. Therefore, the proposed cloud based approach is highly effective and can scale up
and scale down depending upon the workloads.
4.4. Conclusions
In this chapter, a framework that enables the users to interact with the health experts from
Twitter to seek advice at no cost is presented. The framework utilizes the cloud infrastructure to
manage huge tweet repositories. The variant of the HITS algorithm is employed to identify the
candidate experts. The approach effectively identified the candidate experts by considering the use
of distinctive keywords, importance of the keywords, and the importance of the experts using the
keywords. To make the ranking process more effective, an influence metric that identifies the

81
influential users from the list of candidate experts was introduced. Experimental results
demonstrate that the proposed framework is highly effective in terms of accuracy as compared to
other approaches. Moreover, the performance of the system in terms of execution time is preserved
at high workload which indicates the scalability of the system.
4.5. References
[4.1] “Healthcare Social Media Analytics,” http://www.symplur.com/healthcare-social-media-
analytics/, accessed on March 10, 2015.
[4.2] D. Easley and J. Kleinberg, Networks, Crowds, and Markets: Reasoning About a Highly
Connected World, Cambridge University, Press, 2010.
[4.3] J. Weng, E. P. Lim, J. Jiang, and Q. He, “Twitterrank: finding topic-sensitive influential
twitterers,” In Proceedings of the third ACM international conference on Web search and
data mining, 2010, pp. 261-270.
[4.4] A. Pal, and S. Counts, “Identifying topical authorities in microblogs,” In Proceedings of
the fourth ACM international conference on Web search and data mining, 2011, pp. 45-
54.
[4.5] G. A. Miller, “WordNet: a lexical database for English,” Communications of the
ACM 38, no. 11, 1995, pp. 39-41.
[4.6] H. Park, J. Yoon, and K. Kim, “Identifying patent infringement using SAO based
semantic technological similarities,” Scientometrics 90, no. 2, pp. 515-529, 2012.
[4.7] C. D. Manning, M. Surdeanu, J. Bauer, J. Finkel, S. J. Bethard, and D. McClosky, “The
Stanford CoreNLP natural language processing toolkit,” In Proceedings of 52nd Annual
Meeting of the Association for Computational Linguistics: System Demonstrations, 2014,
pp. 55-60.

82
[4.8] T. Solymosi, and J. Dombi, “A method for determining the weights of criteria: the
centralized weights,” European Journal of Operational Research 26, no. 1, 1986, pp. 35-
41.
[4.9] P. Bedi and R. Sharma, “Trust based recommender system using ant colony for trust
computation,” Expert Systems with Applications, vol. 39, no. 1, 2012, pp. 1183-1190.
[4.10] “twitteR: R based Twitter client,” http://cran.r-
project.org/web/packages/twitteR/index.html, accessed on March 21, 2015.
[4.11] Z. Cheng, J. Caverlee, H. Barthwal, and V. Bachani, Who is the Barbecue King of
Texas? A Geo-Spatial Approach to Finding Local Experts on Twitter, In Proceedings of
the 37th international ACM SIGIR conference on Research & development in
information retrieval, pp. 335-344. ACM, 2014.
[4.12] M. Ahmed, I. Ahmad, and S. U. Khan, “A Theoretical Analysis of Scalability of the
Parallel Genome Assembly Algorithms,” in IEEE/EMB/ESEM/BMES International
Conference on Bioinformatics Models, Methods and Algorithms (BIOINFORMATICS),
Rome, Italy, January 2011, pp. 234-237.
[4.13] “Amazon EC2 Pricing,” http://aws.amazon.com/ec2/pricing/, accessed on March 19,
2015.

83
5. A CLOUD BASED HEALTH INSURANCE PLAN RECOMMENDATION
SYSTEM: A USER CENTERED APPROACH3
5.1. Introduction
Patient Protection and Affordable Care Act (PPACA) introduces the concepts of
“Insurance Marketplace and Health Insurance Exchanges” to facilitate the individuals and small
businesses to search the suitable health insurance plans [5.1]. More formally, the health insurance
exchange as defined by the U.S Department of Health and Human Services helps the consumers
and small businesses to buy insurance plans by permitting easy comparisons of available plans
based on the price, coverage benefits, and quality [5.2]. Currently, there exist various other Web
based tools that are meant to search health insurance plans. However, such tools are deficient in
providing recommendations about the health insurance plans in accordance with the multifaceted
user requirements. The apparent reason for the incompetence of the existing tools is their
unawareness about the diversified coverage requirements of the users. Moreover, the tools do not
allow consumers to specify their coverage needs and instead only acquire a few parameters, such
as gender, age, and tobacco use as input. Consequently, the users are returned with long lists of
health insurance plans from different insurance providers irrespective of the fact that such
recommendations may not satisfy the requirements of the users. Moreover, filtering such huge data
to find the desired information is an arduous task. Therefore, this is the high time for the
3 This paper has been published in Future Generation Computer Systems (FGCS) journal. The
material in this chapter was co-authored by Assad Abbas, Kashif Bilal, Limin Zhang, and Samee
U. Khan. Assad Abbas had primary responsibility for conducting experiments and collecting
results. Assad Abbas was the primary developer of the conclusions that are advanced here. Assad
Abbas also drafted and revised all versions of this chapter. Samee U. Khan served as proofreader
and checked the results collected by Assad Abbas.
84
development of health insurance plan recommendation systems with the capability to offer
recommendations according to the diverse user coverage needs and financial constraints.
Obviously, such a task can be accomplished by comparing the customer needs with the various
health insurance plans to determine the most feasible plans.
In this regard, this dissertation focuses on the aspect that has not been addressed by the
researchers in the near past. We argue that the existing cloud based e-health services should be
extended to offer knowledge based recommendations about health insurance plans. Previously, a
lot of research has been carried out on the recommendation systems to offer personalized
recommendations about products, services, and locations. However, there is no recommendation
service that offers recommendations about health insurance plans based on the multifaceted
requirements of the users and consumers. Keeping in view the efficacy of deploying the
recommendation system for health insurance plans in the context of the PPACA, we leverage the
use of cloud computing to offer recommendation services according to the user elicited
requirements. Under the perspective of the PPACA, more and more users will be looking for health
plans being offered under the insurance marketplace as well as by the private insurance providers
in coming years. In addition, the health insurance providers are also expected to offer more plans
considering the growth and diversity in the user coverage and cost requirements. As a result, the
volumes of health data across the providers will intensely increase. Consequently, the demand for
expensive Information Technology (IT) infrastructure will increase. Therefore, the cloud
computing services seem quite practical to manage the huge data volumes and to cut the costs
[5.3]. The reason is that the requirements to purchase expensive infrastructure, such as the high
performance computing machines and storage are eliminated when all the processing tasks are
delegated to the cloud services providers [5.4]. The cloud computing paradigm enables the

85
scalability or resizable compute capacity through the virtual machines [5.5]. The services offered
by the cloud computing are offered through a network while ensuring the Quality of Service (QoS)
and are inexpensive and on-demand [5.6]. The cloud users are charged for the use of hardware and
software resources [5.7].
This chapter proposes a cloud based requirements driven recommendation framework for
health insurance plans according to the tailored requirements of users. The rationale behind
offering customized insurance plans is to effectively deal with the immense diversity of the health
insurance coverage requirements among different categories of users. For example, a user that
belongs to a geographical area where certain diseases are more common as compared to other
regions may be more interested to have coverage for those diseases. Likewise, individuals who
interact with chemicals during their work hours are vulnerable to different diseases, such as skin
problems and cancer. Consequently, such individuals might be interested in insurance plans that
offer coverage for the aforesaid problems.
A user centered approach is proposed to offer a rich requirement gathering interface to
elicit user requirements for decision making and insurance plan recommendation. The user
centered aspect of the proposed approach permits the users to specify requirements in terms of cost
and coverage. As a result, the users are enabled to compare various health insurance plans based
on the fulfilment of the criteria laid down by the users themselves. Ontology based methodology
is employed to overcome the issues of data heterogeneity across various health insurance
providers. Each of the health insurance providers maintains a repository of health insurance plans
ontologies in an autonomous way with the facility to add, remove, or update the ontology
repositories. Considering the large numbers of insurance plans by different providers with
heterogeneous data sources, the concept of Data as a Service (DaaS) is employed [5.8]. The DaaS

86
is an approach that is used to retrieve plans data from different providers for subsequent
comparisons with the user requirements. In the proposed framework, the users’ requirements are
captured and transformed into the user ontology. The plan ontologies maintained by each of the
providers are retrieved based on the elicited user requirements using the DaaS. The ontologies
retrieved are matched with the user requirements and a similarity score is calculated. For true
characterization of the effectiveness of the framework, a ranking technique based on the Multi-
attribute Utility Theory (MAUT) is employed. The MAUT is an important analytical technique
that aids in decision analysis by capturing the decision makers’ preferences based on multiple
independent objectives [5.9]. The proposed health insurance plan recommendation system permits
the users to specify the preferred criteria or attributes, such as cost and coverage requirements over
which the recommendation decisions should be based. The preferred attributes are assigned
weights based on their relative importance to the other attributes. We used the Rank Order Centroid
Method (ROC) and the ratio method to test the effectiveness of the plan ranking process. The
experimental results depict that the ROC method is more feasible in ranking the results as
compared to the ratio method of weight assignment. The salient contributions of the methodology
are given below:
A user centered cloud based health insurance recommendation framework to
recommend a ranked list of health insurance plans that best match with the user
coverage requirements and the indicated decision criteria or attributes is presented.
A requirement gathering engine for user requirements’ elicitation and for subsequent
transformation into XML schemas is introduced.

87
A standard ontology representation/schema is proposed to give a standardized
representation to all the plans so that information about all the plans could be retrieved
through the DaaS.
A tree based matching algorithm is proposed to determine the structural similarities
between the users’ elicited requirements and the insurance plans.
A ranking strategy is proposed that ranks the health insurance plans based on various
user specified attributes or criteria in terms of their relative importance using the
MAUT. The decision is based on the significance of attributes, such as: (a) premium,
(b) co-pay, (c) deductibles, (d) co-insurance, (e) maximum benefit, (f) providers
network, and (g) fulfillment of essential, desirable, and optional requirements.
The experiments are conducted on locally administered cloud computing setup to
determine the efficacy of the approach. The interface to the cloud environment is
provided by implementing the system as Software as a Service (SaaS).
5.2. Preliminary Concepts
Before a detailed discussion on the architecture of the proposed cloud based health
insurance plan recommendation system, brief discussion on certain preliminary concepts is
presented. The background and motivation of the proposed cloud based health insurance
recommendation system are presented in Section 5.2.1. Section 5.2.2 presents discussion on the
ontology for health insurance and the concept of DaaS.
5.2.1. Background and Motivation
“Big data as defined by a U. S. congress report in August 2012 is a term used for describing
large volumes of complex and variable data with high velocities that entails sophisticated
techniques to capture, store, distribute, manage, and analyze the information [5.10].” Currently,

88
the electronic health records coupled with the innovative tools for big data analytics have opened
new horizons for mining information to achieve highly effective outcomes [5.11]. The
requirements, such as storage, processing, analysis, and continuous availability of enormous health
data call for utilizing the emerging technologies, such as the cloud computing [5.12]. As already
stated in Section 5.1 that currently there is huge in-flux and out-flux of health data in contemporary
e-health systems that are managed by small and medium sized health organizations. Moreover, the
context of the proposed framework that emphasizes on shifting all the health data and the health
insurance plans data in the e-health systems will significantly upraise the volumes of health data.
Furthermore, the PPACA also mandates the individual and families to have health insurance
coverage. Therefore, it is needed more than ever to offer the consumers such a mechanism that
helps them in selection of the best suited insurance plans in terms of coverage and other aspects,
such as the premium, co-pay, deductibles, co-insurance, the maximum benefit limit of the plan,
and the providers’ network.
Currently, in the United States, the dataset about individuals and family health insurance
plans shortlisted as the qualified health plans under the insurance marketplace comprises of more
than 78,000 medical plans [5.13]. Similarly, for dental insurance, over 45,000 plans have also been
identified in the insurance marketplace [5.14]. The aforementioned numbers only depict the plans
shortlisted as qualified health insurance plans. There could also be other plans that have not yet
been certified under the insurance marketplace. The above numbers are also expected to increase
in near future when more and more consumers will start accessing the insurance marketplace.
Therefore, enormous increase in the health data in e-health systems is expected in near future.
Consequently, the need for the development of sophisticated tools and techniques for big data
analytics in the healthcare domain has significantly increased. However, small and medium sized

89
healthcare organizations may face problems of resource scarcity in terms of hardware, software,
network services, and storage to manage such huge volumes of data and deliver round the clock
access. Therefore, using the cloud computing services in the aforementioned scenario is quite
pertinent because of the key benefits of the cloud, such as scalability [5.15] and elasticity [5.16]
and pay per use model. Another key benefit in embracing the cloud services is the significant
reduction in the infrastructure development and management cost. Therefore, the entities dealing
with the health related data can process the huge volumes of data with the sophisticated computing
machines at affordable prices.
5.2.2. Ontology for Health Insurance Plans
Across the huge corpus of health insurance providers, all the providers maintain their own
datasets locally and possibly the datasets may be heterogeneous in terms of terminology and
structure. The typical issues that may arise from the heterogeneous data formats across different
health insurance providers include the integration and reconciliation of data originated from
multiple health insurance providers. Moreover, the heterogeneity besides data semantics is also
immensely concerned about the structure and representation of data at the source locations.
Consequently, a standardized representation is required to unify the distributed data related to
health insurance plans so that the information about all the providers and plans could be stored in
a standard schema. Ontologies and the semantic web technologies offer the means to present a
standardized representation of distributed data from heterogeneous sources [5.17].
The semantic web is a particularly designed framework that promotes the development of
mechanisms to share and utilize information from multiple resources in a distributed architecture
[5.18]. Ontology consists of vocabulary to describe the particular view of a domain. As defined by
Gruber [5.19], ontology is a specification of conceptualization. Ontology effectively deals with the

90
problem of semantic heterogeneity and depending upon the preciseness of the specification, the
concept of ontology encompasses various data and conceptual models, for example classification,
thesauri, and database schemas [5.20]. Ontology is used to offer a standardized representation to
health insurance data at different providers’ locations with different formats. Besides insurance
plans, the user queries indicating the coverage preferences and financial aspects are also
transformed and represented in ontological form.
To query the heterogeneous health insurance plans repositories, the DaaS model is
employed [5.8]. The DaaS is as an approach for data integration from different sources. In the
proposed framework, each of the providers maintains a repository of plans. Based on the user
elicited requirements, the SaaS based system requests the plan data using the DaaS. The DaaS
combines the data from multiple providers and offers a standardized representation to plans data
to find the match between the user requirements and plans. Despite using the third-party cloud
infrastructure, the proposed framework permits the providers to exercise their autonomous control
over their data because the plans are updated or removed by the providers themselves. Therefore,
apparently no issues pertaining to the security and privacy of the providers’ data arise. Figure 5.1
presents a generic ontology for the health insurance plans over that all the ontologies can be
mapped. Due to space limitations all the levels of the ontology are not presented in Figure 5.1.
To cope with the heterogeneity issues of data sets across various health insurance providers
this research used XML schemas. Although ontology and schema refer to different levels of
abstraction in representation, when both are applied to online sources of information the
relationship becomes obvious [5.21]. The structure and vocabulary for describing the semantics of
information present in documents is provided by ontology, whereas XML schemas are used to

91
Figure 5.1: Generic Ontology for health insurance plans
prescribe the structure and contents of the documents [5.21]. The XML documents can be
represented in the form of labeled trees. An XML tree allows a whole document to be represented
as a root node. The non-terminal or internal nodes represent the elements whereas the contents are
represented at leaf nodes [5.23].
5.3. Proposed System Architecture for Health Insurance Recommendation System
The proposed architecture to manage the massive health insurance data across hundreds of
providers with thousands of insurance plans consists of the following modules: (a) insurance plans
ontology managed and offered by the insurance provider, and delivered as the DaaS, (b) user
requirement gathering module, (c) matching module, and (d) ranking module. In the proposed
cloud based recommendation framework, each insurance provider maintains its own plan
repository autonomously and offers the required information to the system as the DaaS on demand.
The SaaS based implementation permits the user requirement gathering module to elicit the
requirements from the users and transforms the delivered information into ontology that

92
subsequently is captured as an XML schema. The XML schemas represent the information in
hierarchical fashion. Therefore, the common representation of the XML documents is in the form
of labeled trees [5.22]. The user requirements and all the plans residing at the providers’ location
are represented as the trees. In the traditional Document Object Model (DOM) the nodes symbolize
the XML elements, whereas the children represent the attributes [5.24].
Table 5.1: Notations and their meanings
Notation Meaning Notation Meaning Notation Meaning
Ʀ Requirements
tree ϻ𝑒 Essential match γ Sum of matching
and non-matching
nodes
Ƥ Plans tree ϻ𝑑 Desirable match ∪𝑅𝐶 Union of R and C
𝑅𝑒 Essential
requirements ϻ𝑜 Optional match 𝛿𝑠𝑖
Requirements
similarity
𝑅𝑑 Desirable
requirements ℵ𝑒 Essential non-match 𝑃𝑛 Providers
Network
𝑅𝑜 Optional
requirement ℵ𝑑 Desirable non-match 𝜌 Actual value
requested by the
user
𝑃𝑟 Requested
premium ℵ𝑜 Optional non-match 𝜇−𝑒 Weight of the
missing attribute
𝐷𝑟 Requested
deductibles 𝑊𝑖 Weight of ith attribute ϻ𝑒 Essential match
𝐶𝑃𝑟 Requested copay 𝑊𝑖𝑛𝑜𝑟𝑚 Normalized weight ϻ𝑑 Desirable match
𝐶𝐼𝑟 Requested
coinsurance 𝛿𝑟𝑖 Requirements
satisfiability measure ϻ𝑜 Optional match
𝑀𝐵𝑟 Maximum
benefit 𝜇 Desired attribute
value requested by
the user
𝜌 Actual value
requested by the
user
ϻ Matching nodes ℵ Non-matching nodes 𝜕 Labeling function

93
The matching module matches the user requirements tree with multiple plans trees to
determine the structural similarities. The structural similarities between the user requirement tree
and the plans tree are computed by comparing the labels or tags while preserving the parent-child
relationship. The matching module only provides the match details between the user requirements
tree and the plan trees. Therefore, to make the recommendation process more effective, the MAUT
based approach is used to rank the plans according to the criteria laid down by the users. The
MAUT is an important phenomenon used in decision theory based on Multi-Criteria Decision
Making [5.25]. In the MAUT, the decisions are made in such a way that the utility function based
on the attributes or criteria is maximized [5.26]. The utility of each of the alternatives can be
calculated by the decision makers through a multi-attribute utility function and the function with
the highest utility value is selected [5.27]. In the proposed work, the MAUT uses nine attributes to
help users evaluate the recommended plans based on their ranking scores. Figure 5.2 presents the
architecture of the proposed system. The notations used in the text are presented in Table 5.1.
5.3.1. The Matching Module
The matching module matches the user requirements with multiple plans to determine the
similarities. In the proposed framework, both the user requirements and the insurance plans are
represented in the form of trees. To describe the problem of tree matching in the scenario of health
insurance recommendation, some preliminary concepts related to the rooted labeled trees are
presented. In the text to follow, Ʀ, and Ƥ be the trees representing the user requirements and
insurance plan, respectively. Moreover, each single plan in Ƥ is represented as Ƥ𝑘.The tree
matching problem is to find an exact mapping while preserving the ancestry. For an exact
matching, if the label of node in Ʀ, matches the label of node in Ƥ at the corresponding level only
then the descendants of the node in Ʀ, will be matched to descendants of node in Ƥ [5.23].

94
In the presented approach, while eliciting the insurance requirements, the users also
indicate three types of coverage requirements namely: (a) Essential Requirements, (b) Desirable
Requirements, and (c) Optional Requirements. The set 𝑅 = {𝑅𝑒 , 𝑅𝑑 , 𝑅𝑜} is a set where the essential
requirements are represented by 𝑅𝑒, desirable requirements are represented by 𝑅𝑑, and the optional
requirements are represented by 𝑅𝑜. For each 𝑅𝑖 ∈ 𝑅, different weight is assigned to observe the
effect of a match or non-match on the overall similarity value. The set 𝐶 = {𝑃𝑟 , 𝐷𝑟 , 𝐶𝑃𝑟 , 𝐶𝐼𝑟 , 𝑀𝐵𝑟}
represents the customer requirements in terms of cost. The 𝑃𝑟 , 𝐷𝑟 , 𝐶𝑃𝑟 , 𝐶𝐼𝑟 , 𝑃𝑛 represent the
amount in terms of premium, deductibles, co-pay, and co-insurance, respectively, whereas MBr is
the maximum benefit that a user expects from a plan. The variable 𝑃𝑛 represents the providers’
network that users may opt as their healthcare providers. Providers’ network is an important quality
measure that becomes more critical in presence of multiple plans with similar features. The
algorithm to match the user requirements tree with the plan tree is presented as Algorithm 5.1. The
user requirement tree Ʀ and the plan tree Ƥ are provided as input to the algorithm in line 1. Line 2
and line 3 initialize the variables used to calculate the total number of matching and non-matching
nodes, respectively. From line 4—line 10, the algorithm matches the label of the node in Ʀ with
the node at the same level in Ƥk while preserving the ancestry. If a match is found ϻ is incremented
at line 9 and the procedure MatchTree() is recursively called at line 14 to find the matches between
the sub-trees of Ʀ and Ƥ. If the labels of Ʀ, and Ƥ at subsequent levels do not match, it means that
their sub-trees are not matched and the total number of non- matching children in the tree Ʀ, is
calculated at line 16. The matching process is explained with the help of an illustrative example.
Figure 5.3 represents the requirement tree (Ʀ) on left side and the plan tree (Ƥk) on the right side.

95
Plan Ranking
Ranked Plans
Plan Ontology Plan Ontology
Server Server Server
Plan Matching
Plan Retrieval
through DaaS
Plan Retrieval
through DaaS Plan Retrieval
through DaaS
Health Insurance Plan Recommendation
Request
Compute Node Compute Node Compute Node
Plan Ontology
Figure 5.2: Cloud based health insurance recommendation system architecture
For the sake of simplicity, all of the nodes belonging to both the trees are not presented in
Figure 5.3. The tree matching algorithm is applied recursively to perform matching of the
corresponding nodes by comparing labels of the trees Ʀ and Ƥk. If the nodes in both the trees have
the same label, then the sub-trees of Ʀ and Ƥk are compared. A match is considered, if any of the
child nodes of a matched parent matches with the requirement tree label at the same level. If the
labels of the roots of two sub-trees do not match, the algorithm does not compare the subsequent
levels of the mismatching nodes. For example, the node c with the label “outpatient coverage” in
Ʀ, does not match with the corresponding level in Ƥ𝑘 that has “Inpatient Coverage” and “Minor
event coverage” at the same level under the same parent. Therefore, the subsequent levels of node
c will not be compared. The matching algorithm requires the nodes to be at the same level and
should be decedents of the parents with the same labels in both Ʀ and Ƥ𝑘. However, in both of the
trees the two nodes being matched should not be necessarily in the same order. As can be observed

96
in Figure 5.3 that node i at level 4 in Ʀ has label “influenza” whereas in Ƥk the corresponding
node k at the same level has label “Hepatitis C”. However, node l in Ƥ𝑘 has label “influenza”
under the same parent (“immunization shots”) as in the requirement tree. The matching algorithm
exhaustively compares the label of a node in the Ʀ to all the nodes at the same level in Ƥk under
the same parent and finds a match for the label “influenza”. The “” and “” symbols in Figure
5.3 represent the matching and non-matching node. The similarity between the two trees is
calculated as below:
𝛿𝑠𝑖=
𝑀𝑖
𝑇𝑖 (5.1)
where,
𝑀𝑖 = ϻ𝑒 + ϻ𝑑 + ϻ𝑜 (5.2)
____________________________________________________________________
Algorithm 5.1: Tree matching
____________________________________________________________________
Input: user requirement tree Ʀ and plan tree Ƥ𝑘 Output: number of matching and non-matching nodes
1: Procedure MatchTree(Ʀ , Ƥ )
2: ϻ ← 0
3: ℵ ← 0
4: for each node in Ʀ do
5: bool match=false
6: for each node in Ƥ do
7: if (Ʀ. Ɩ==Ƥ. Ɩ) then
8: match=true
9: ϻ ← ϻ + 1
10: break
11: end if
12: end for
13: if (match==true) then
14: MatchTree(Ʀ𝑐 , Ƥ𝑐)
15: else
16: γ ← Find all the non-matching nodes in sub-tree of Ʀ
17: ℵ ← ℵ + γ
18: end if
19: end for
__________________________________________________________________________

97
MMR
jj
ggffdd
iihh
bb cc
ee
aaIndividual
Preventive CareOutpatient coverage
Immunization Shots
Routine Physical Exam
Influenza
Herpes Zoster
Outpatient Surgery
Outpatient Mental Health
Broken leg
dd
mm
hhgg
lljj
cc
ff
aaIndividual
Inpatient Coverage
Hospitalization
Skilled Nursing Facility
ii
Minor event coverage
Requirement Tree Plan Tree
×
××
MMR
ee
bbPreventive Care
Immunization Shots
Routine Physical Exam
Herpes Zoster
Hepatitis C
kkInfluenza
Figure 5.3: An illustrative example for tree matching
𝑁𝑖 = ℵ𝑒 + ℵ𝑑 + ℵ𝑜 (5.3)
𝑇𝑖 = 𝑀𝑖 + 𝑁𝑖 (5.4)
In Eq. 5.1, 𝑀𝑖 and 𝑇𝑖 represent the number of matching requirements, and the total
requested requirements in the user query. The symbol 𝛿𝑠𝑖 is the requirement satisfiability measure
that can have maximum value of 1. The measure represents the percentage of the requirements that
are met by a plan. If all the requirements stated by the users are met, the measure would have the
maximum value of 1.
5.3.2. Plan ranking using the MAUT
The matching module only calculates the similarities between the user requirements and
the stored plans. However, considering the diverse user requirements, in terms of cost and
coverage, there is a need to provide users a ranked list of plans to make the evaluation of plans

98
more effective. The framework allows the users to specify the relative importance or priorities of
various decision attributes. Ranking is imperative because it helps users to evaluate several plans
by altering the relative importance of the attributes to find the suitable plan. This research utilizes
the MAUT approach for ranking the plans that are similar to the customer coverage requirements
as well as the cost requirements.
The MAUT involves the customers in decision making. While stating the coverage needs,
the users also indicate the relative importance of ranking criteria or attributes from both sets 𝐶 and
𝑆 as well as for 𝑃𝑛 . The purpose of using the relative importance is to determine that exactly what
attributes should be given higher weights during the ranking process. The higher the relative
importance of the particular criteria, the higher weight it is assigned as compared to the others.
Consequently, the ranking decisions are biased towards the criteria with higher priorities.
5.3.2.1. Attribute Weight Assignment
A key task in ranking the plans to select the best alternatives using the MAUT approach is
weight assignment to attributes. The proposed approach is user centered that allows the users to
specify the relative importance of decision attributes in relation to other attributes. The attributes
that are given higher relative importance by the users while specifying requirements are assigned
higher weights during the ranking process. Two methods for weight assignment, namely: (a) Rank
Order Centroid (ROC) and (b) Ratio method are used in this research. Both of the weight
assignment methods are described below. The weight assignment using the Rank Order Centroid
(ROC) method is explained below. To rank the identified health insurance plans we used the Rank
Order Centroid (ROC) method [5.28] to assign weights to the users’ specified criteria or attributes.
The ROC method assigns weights to a number of attributes that are ranked according to relative

99
importance [AhP08]. Combining sets 𝑅 and 𝐶 with 𝑃𝑛 a complete set of requirements called ∪𝑅𝐶=
{𝑅𝑒 , 𝑃𝑟 , 𝑅𝑑 , 𝑅𝑜 , 𝐷𝑟 , 𝐶𝑃𝑟 , 𝐶𝐼𝑟 , 𝑀𝐵𝑟 , 𝑃𝑛} is obtained.
The order of elements in the set ∪𝑅𝐶= {𝑅𝑒 , 𝑃𝑟 , 𝑅𝑑, 𝑅𝑜 , 𝐷𝑟 , 𝐶𝑃𝑟 , 𝐶𝐼𝑟 , 𝑀𝐵𝑟 , 𝑃𝑛} indicates the
relative importance of requirement to the user. For instance, 𝑅𝑒 has highest relative importance as
compared to the remaining eight attributes in the set ∪𝑅𝐶. Similarly, the attributes 𝑃𝑟 is the attribute
with the second highest priority. The plan ranking decisions largely depend upon the importance
of the attributes to the consumers or users. The proposed approach allows the users to test the
ranking alternatives by varying the relative importance of different attributes (see Fig 4, where
user can change the order of the criteria elements). The weights of the attributes are calculated
using the following equation for the ROC:
𝑊𝑖 = (1
𝐾) ∑
1
𝑛
𝑘𝑛=𝑖 (5.5)
where, 𝑘 is the number of attributes and 𝑊𝑖 represents the weight of the 𝑖𝑡ℎ attribute to be ranked
using the ROC.
The weight assignment using the Ratio method is explained below: The ratio method
proposed by Edwards [5.29] is another method to assign weights to the attributes for ranking
decisions. Like the ROC method, the decision attributes are ranked in the order of relative
importance. The weights are assigned as multiples of 10 and the attributes with the lowest
importance is assigned weight 10. Typically, the weights to the attributes are assigned at a jump
of 10. However, assigning weights more than the prescribed jump is usually based on the
subjective judgments that sometimes may lead to higher normalized weights. The normalized
weights of each of the attributes are calculated as follows:
𝑊𝑖𝑛𝑜𝑟𝑚 =
𝑤𝑖
∑ 𝑤𝑗𝑘𝑗=1
(5.6)

100
where, 𝑘 is the number of attributes being used in the decision. The weight assignment procedure
is elaborated with the example below. The following raw weights are assigned to each of the
elements of set ∪𝑅𝐶= {𝑃𝑟 , 𝑅𝑒 , 𝑅𝑑 , 𝐷𝑟 , 𝑃𝑛, 𝐶𝑃𝑟 , 𝐶𝐼𝑟 , 𝑀𝐵𝑟 , 𝑅𝑜 , 𝑃𝑛} = {90, 80, 70, 60, 50, 40, 30, 20,
10}. The normalized weight for the attribute 𝑃𝑟 using Eq. 5.6 is calculated as below.
𝑃𝑟= 90/ (90+80+ . . . +10) =0.2. The weights for the other attributes are calculated similarly.
The final ranking of a particular plan is computed by using the attribute function 𝑅 as below:
𝑅𝑖 = ((𝛿𝑠𝑖) × (∑(𝑊 𝑖 × 𝛿𝑟𝑖
))) (5.7)
where, 𝑊 i represents the weights of the attributes calculated through either the ROC or Ratio
method and 𝛿𝑟i is a measure used to determine the satisfiability of the cost based requirements
stated in the user query. The ranking score of a plan is calculated by multiplying the weights of
each element of ∪𝑅𝐶 to the satisfiability value and the similarity score. The measure 𝛿𝑟𝑖 is
calculated as:
𝛿𝑟𝑖=
𝜇
𝜌 , (5.8)
where, 𝜇 and 𝜌 are the desired values requested by the user and the actual value of a particular
attribute present in the plan, respectively. For example, if the user requests a plan with monthly
premium of $150 whereas the actual premium of the plan being offered by the insurance provider
is 175, then the value of the satisfiability measure will be 0.86. If 𝛿𝑟𝑖= 1, then the particular
criteria has the highest satisfiability. If 𝛿𝑟𝑖> 1, the maximum value of 𝛿𝑟𝑖
is still regarded equal
to 1. 𝛿𝑠𝑖 represents the similarity score computed in Eq. 5.1. The framework also permits users to
evaluate the insurance plans by reducing the number of decision attributes. With the reduced
decision attributes, the weights are also adjusted accordingly.
101
5.4. Prototype Implementation
A prototype system was implemented to provide users an interface to the cloud
environment. A requirement engine is used to help users specify their coverage needs and cost
expectations, and the prioritized criteria for decision making. The framework is implemented as
SaaS using modular service oriented architecture. In the SaaS architecture, the software is hosted
as a service that is provided to customers via the aforementioned interface across the Internet
[5.30]. The SaaS can considerably reduce the customers’ IT costs and meets the flexible business
requirements, especially for business management services. One common feature of the SaaS
business services is that the customers’ business data are stored and processed at the service
provider side [5.31]. The SaaS model relieves the users or organizations using cloud services of
the tasks of installation and maintaining the software. Instead the users pay the cloud service
providers for the services. In the proposed framework, the users access the cloud services through
a Web interface module. The interface module collects the requirements information from the
users. The collected information is directed to the cloud based framework. Subsequently, the user
requirements information is transformed into XML based ontology for comparison with the
insurance plans. All the insurance providers maintain the cloud based ontology repository. The
plans from the respective ontology repositories are extracted based on the user requirements using
the DaaS. On receiving the plan ontologies, the user requirements are matched with the plan
ontologies to determine the similarity. However, the similarity matching is not the true
characterization of the effectiveness of a plan to the users because matching does not take into
account the cost criteria. Therefore, the ranking module ranks the matched plans according to the
criteria specified by the user. The experiments were conducted on locally administered Ubuntu

102
cloud computing setup running on 96 core Supermicro SuperServer SYS-7047GR-TRF systems.
Figure 5.4 shows the screenshot of the user requirement capturing module.
5.5. Results and Discussion
To test the validity of the system, real health insurance plans that were shortlisted as
qualified health plans under the insurance marketplace released by the health department [5.13]
were used. The data comprises of more than 78,000 different individual and family health
insurance plans and over 45,000 dental plans. However, the data was not properly organized and
therefore, was not directly usable. Consequently, we used our system to create health insurance
plans by using the aforesaid data. The information depicted in the plans was transformed manually
by keying the data to our system. All of the generated insurance plans were stored as XML
schemas. Around one hundred plans were created to test the system performance. A user study
was conducted to test the effectiveness of recommendations provided by the system. During the
user study the users were guided about the procedures of interacting with the interface. The users
Figure 5.4: User requirement specification interface

103
were asked to conduct the test runs by changing the importance level of desired attributes as listed
in Table 5.2. The underlying reason behind providing the users with the flexibility to test the
ranking results with different prioritized criteria was to observe the variations in the ranked results.
To make the ranking process more explicit different priorities were assigned to the attributes
during different tests for the selection of health insurance plans. The weights were assigned using
the ROC and ratio methods. Both of the methods were tested on the same set of requirements to
determine the effects of weight changes on the overall decision quality and plan recommendation.
The column “Attributes Importance” in Table 5.2 depicts the relative importance of the attributes
during the seven test runs, namely, T1—T7. The attributes are abbreviated in Table 5.2. The weight
assignment by the ROC method and the normalized weight assignment by the ratio method are
presented in Table 5.3. The ranking scores obtained for different plans using the ROC and ratio
methods for weight assignment are presented in Table 5.4 and Table 5.5, respectively.
Table 5.2: Importance of attributes in the test runs
Attribute
Importance
T1 T2 T3 T4 T5 T6 T7
1 ER ER PR PR PR PR ER
2 DR PR ER ER ER ER PR
3 OR DR DR DD DD CP CP
4 PR OR CP CP CP DD DD
5 DD DD DD DR CI CI MB
6 CP CP OR MB MB PN PN
7 CI CI PN OR OR OR DR
8 MB PN CI PN DR DR OR
9 PN MB MB CI PN MB CI
Essential Requirements: ER, Desirable Requirements: DR, Optional Requirements: OR, Premium:
PR, Co-pay: CP, Co-insurance: CI, Max. Benefit: M, Providers Network: PN

104
Table 5.3: Weight assignment using the ROC and the ratio method
Weight
assignment
Method
Attributes
1 2 3 4 5 6 7 8 9
ROC 0.31 0.20 0.14 0.12 0.097 0.078 0.063 0.048 0.036
Ratio 0.2 0.18 0.16 0.13 0.11 0.089 0.067 0.044 0.022
As can be observed from Table 5.4 and Table 5.5 that altering the priority and relative
importance of attributes resulted in different ranking score for the same plan in different tests. For
example, in Table 5.2 during the test T1 the attribute “ER” was assigned the highest importance
while the “DR” was at the second highest importance level. Therefore, they were respectively
assigned the highest and second highest weights by the weight assignment methods and
consequently, the plan AK Aetna Classic 5000 (AKC5) PD had the highest rank value. In test T2,
the importance level was altered and the attribute “PR” was assigned the second highest
importance and the attribute “DR” was at importance level 3 and the plan Premera Preferred Plus
Bronze HAS 5250 turned out with the highest ranking score. With the ratio method, in test T1 with
the same user requirements the plans Premera Preferred Plus Bronze HAS 5250 and AK Aetna
Classic 5000 PD had ranking scores of 0.72 and 0.71 respectively. However, later from test T3 to
test T7, changing the relative importance of decision attributes resulted in more significant
differences among the ranking scores of different plans. Figure 5.5 and Figure 5.6 present the
ranking scores for five plans during the seven conducted tests. Another important observation is
pertaining to the performance of the two weight assignment methods with each other. As can be
observed from Table 5.4 and Table 5.5 that the ranking score achieved using the ROC method
were slightly higher as compared to those obtained using the ratio method. The reason is that the
weight assignment in the ROC method is dependent on the number of attributes or criteria for

105
Table 5.4: Plan ranking using the ROC
Test No. Plan Name
AK Aetna
Classic 5000
PD
Be Connected
Bronze
BlueDirect 70 4000 Humana
National
Preferred Bronze
4850/ 6350
Premera
Preferred Plus
Bronze HSA
5250
T1 0.75 0.65 0.68 0.63 0.71
T2 0.74 0.69 0.72 0.67 0.75
T3 0.75 0.74 0.79 0.71 0.81
T4 0.79 0.80 0.83 0.77 0.85
T5 0.78 0.81 0.87 0.80 0.89
T6 0.72 0.75 0.83 0.73 0.85
T7 0.78 0.74 0.79 0.70 0.82
Table 5.5: Plan ranking using the ratio method
Test No. Plan Name
AK Aetna
Classic
5000 PD
Be
ConnectedBronze
BlueDirect 70 4000 Humana
National
Preferred Bronze
4850/ 6350
Premera Preferred
Plus Bronze HSA
5250
T1 0.71 0.65 0.70 0.64 0.72
T2 0.70 0.66 0.71 0.65 0.73
T3 0.72 0.67 0.74 0.65 0.75
T4 0.77 0.74 0.78 0.71 0.80
T5 0.76 0.76 0.83 0.67 0.79
T6 0.74 0.78 0.77 0.79 0.76
T7 0.74 0.72 0.77 0.68 0.78
making a decision. Since, there are nine attributes; therefore, the weights of the attributes with
high importance are much dispersed, while the attributes with the lowest importance are assigned
very small weights. Alternatively, the normalized weights for the ratio method were obtained by
manually specifying the initial weights for all of the attributes. Before normalizing, the raw
weights assigned to attributes with the highest and the lowest importance were 90 and 10,
respectively. However, increasing the highest raw weight value may result in an increased
normalized value. The reason is that the weight assignment in ratio method is based on the strong
splitting bias that eventually results in higher ranking score of the alternatives. Consequently, the

106
higher raw weights in ratio method could result in higher ranking score for the plans while with
the lower raw weights the differences among the ranking score are very slight. Therefore,
presumably it can be claimed that the ranking results obtained through the ROC weight assignment
method were more balanced as compared to the ratio method.
Figure 5.5: Plan ranking using the ROC method for weight assignment
Figure 5.6: Plan ranking using the ratio method for weight assignment

107
5.6. Conclusions
In this chapter, a cloud based recommendation system for health insurance plans is
presented. Testing the framework at a limited level depicts that the proposed framework is highly
effective in offering customized recommendations about health insurance plans. Particularly, the
flexibility to test the insurance plans by altering the priorities of different attributes is certainly a
beneficial feature that allows comparison among various plans based on multiple criteria. It is also
expected that in near future, the research on health insurance recommendation systems will also
increase in context of the PPACA when more users will start accessing the insurance marketplace.
Therefore, the need for development of techniques and methods for big data in the healthcare
domain will significantly increase.
5.7. References
[5.1] “Insurance Marketplace,” http://www.hhs.gov/healthcare/insurance/index.html.
[5.2] S. Haeder, and D. L. Weimer, “You Can't Make Me Do It: State Implementation of
Insurance Exchanges under the Affordable Care Act,” Public Administration Review,
2013, pp. 1-1.
[5.3] L. Wang, D. Chen, Y. Hu, Y. Ma, and J. Wang, “Towards enabling cyber infrastructure
as a service in clouds,” Computers & Electrical Engineering 39, no. 1, 2013, pp. 3-14.
[5.4] A. N. Khan, ML. M. Kiah, M. Ali, S. A. Madani, and S. Shamshirband, “BSS: block-
based sharing scheme for secure data storage services in mobile cloud environment,” The
Journal of Supercomputing, 2014, pp. 1-31.
[5.5] L. Wang, G. V. Laszewski, M. Kunze, J. Tao, and J. Dayal, “Provide virtual distributed
environments for grid computing on demand,” Advances in Engineering Software 41, no.
2 2010, pp. 213-219.

108
[5.6] L. Wang, M. Kunze, J. Tao, and G. V. Laszewski, “Towards building a cloud for
scientific applications,” Advances in Engineering Software 42, no. 9, 2011, pp. 714-722.
[5.7] L. Wang, J. Tao, R. Ranjan, H. Marten, A. Streit, J. Chen, and D. Chen, “G-Hadoop:
MapReduce across distributed data centers for data-intensive computing,” Future
Generation Computer Systems 29, no. 3, 2013, pp. 739-750.
[5.8] R. Mokadem, F. Morvan, C. G. Guegan, and D. Benslimane, “DSD: A DaaS Service
Discovery Method in P2P Environments,” in New Trends in Databases and Information
Systems, pp. 129-137. Springer International Publishing, 2014.
[5.9] S.-L. Huang, “Designing utility-based recommender systems for e-commerce: Evaluation
of preference-elicitation methods,” Electronic Commerce Research and Applications 10,
no. 4 2011, pp. 398-407.
[5.10] “TechAmerica Foundation Big Data Commission”,
http://www.techamericafoundation.org/bigdata, accessed January 10, 2014.
[5.11] P. B. Jensen, L. J. Jensen, and S. Brunak, “Mining electronic health records: towards
better research applications and clinical care,” Nature Reviews Genetics 13, no. 6, 2012,
pp. 395-405.
[5.12] S. P. Ahuja, S. Mani, and J. Zambrano1, “A survey of the state of cloud computing in
healthcare,” Network and Communication Technologies, Vol. 1, No. 2, September ,
2012, pp. 12-19.
[5.13] QHP Landscape Individual Market, https://data.healthcare.gov/dataset/QHP-Landscape-
Individual-Market-Medical/b8in-sz6k, accessed on December 20, 2013.
[5.14] “Dental plan information for individuals and families,”
https://www.healthcare.gov/dental-plan-information/, accessed on January 11, 2014.

109
[5.15] A. Michael, A. Fox, R. Griffith, A. D. Joseph, R. Katz, A. Konwinski, G. Lee, “A view of
cloud computing,” Communications of the ACM 53, no. 4, 2010, pp. 50-58.
[5.16] I. Foster, Y. Zhao, I. Raicu, and S. Lu, “Cloud computing and grid computing 360-degree
compared,” In IEEE Grid Computing Environments Workshop (GCE'08), 2008. pp. 1-10.
[5.17] J. Li, Q. Li, C. Liu, S. U. Khan, and N. Ghani, “Community-Based Collaborative
Information System for Emergency Management,” Computers & Operations Research,
vol. 42, pp. 116-124, 2012.
[5.18] N. Shadbolt, W. Hall, and T.B.-Lee, “The semantic web revisited,” Intelligent Systems,
IEEE 21, no. 3, 2006, pp. 96-101.
[5.19] T. R. Gruber, “Toward principles for the design of ontologies used for knowledge
sharing,” International journal of human-computer studies 43, no. 5, 1995, pp. 907-928.
[5.20] P. Shvaiko, J. Euzenat, “Ontology matching: state of the art and future challenges,” IEEE
Transactions on Knowledge and Data Engineering, 2012, pp. 1-1.
[5.21] M. Klein, D. Fensel, F. V. Harmelen, and I. Horrocks, “The relation between ontologies
and XML schemas,” Electronic Transactions on Artificial Intelligence, 2001, pp. 1-14.
[5.22] J. Tekli, and R. Chbeir, “A novel XML document structure comparison framework
based-on sub-tree commonalities and label semantics,” Web Semantics: Science,
Services and Agents on the World Wide Web 11, 2012, pp. 14-40.
[5.23] M. A. Tahraoui, K. P.-Sauvagnat, C. Laitang, M. Boughanem, H. Kheddouci, and L.
Ning, “A survey on tree matching and XML retrieval,” Computer Science Review, 2013,
pp. 1-23.
[5.24] Document Object Model, http://www.w3.org/DOM, accessed on January 16, 2014.

110
[5.25] S. D. Pohekar,and M. Ramachandran, “Application of multi-criteria decision making to
sustainable energy planning—a review,” Renewable and Sustainable Energy Reviews 8,
no. 4, 2004, pp. 365-381
[5.26] D. Claudio, G. O. Kremer, W. B. –Llerena, and A. Freivalds,“A Dynamic Multi-Attribute
Utility Theory Based Decision Support System for Patient Prioritization in the
Emergency Department,” IIE Transactions on Healthcare Systems Engineering, 2014, pp.
1-15.
[5.27] Y. -S. Huang, W. –C. Chang, W.-H. Li, and Z.-L. Lin, “Aggregation of utility-based
individual preferences for group decision-making,” European Journal of Operational
Research 229, no. 2 2013, pp. 462-469.
[5.28] T. Solymosi, and J. Dombi, “A method for determining the weights of criteria: the
centralized weights,” European Journal of Operational Research 26, no. 1 1986, pp. 35-
41.
[5.29] W. Edwards, “How to use multi-attribute utility measurement for social decision
making,” Systems, Man and Cybernetics, IEEE Transactions on 7, no. 5, 1977, pp. 326-
340.
[5.30] J. Y. Lee, J. W. Lee, and S. D. Kim, “A quality model for evaluating software-as-a-
service in cloud computing,” In 7th ACIS International Conference on Software
Engineering Research, Management and Applications, 2009, 2009, pp. 261-266.
[5.31] W. –T. Tsai, X. Sun, and J. Balasooriya, “Service-oriented cloud computing
architecture,” In Information Technology: New Generations (ITNG), 2010 Seventh
International Conference on, pp. 684-689.

111
6. SeSPHR: A METHODOLOGY FOR SECURE SHARING OF
PERSONAL HEALTH RECORDS IN THE CLOUD4
6.1. Introduction
Cloud computing has emerged as an important computing paradigm to offer pervasive and
on-demand availability of various resources in the form of hardware, software, infrastructure, and
storage [6.1, 6.2]. Accordingly, the cloud computing paradigm facilitates organizations by
relieving them from the protracted job of infrastructure development and has encouraged them to
trust on the third-party Information Technology (IT) services [6.3]. Additionally, the cloud
computing model has demonstrated significant potential to increase coordination among several
healthcare stakeholders and also to ensure continuous availability of health information, and
scalability [6.4, 6.5]. Furthermore, the cloud computing also integrates various important entities
of healthcare domains, such as patients, hospital staff including the doctors, nursing staff,
pharmacies, and clinical laboratory personnel, insurance providers, and the service providers [6.1,
6.6]. Therefore, the integration of aforementioned entities results in the evolution of a cost effective
and collaborative health ecosystem where the patients can easily create and manage their Personal
Health Records (PHRs). Generally, the PHRs contain information, such as: (a) demographic
information, (b) patients’ medical history including the diagnosis, allergies, past surgeries, and
treatments, (c) laboratory reports, (d) data about health insurance claims, and (e) private notes of
4 This paper is to be submitted to journal. The material in this chapter was co-authored by Mazhar
Ali, Assad Abbas, Muhammad Usman Shahid Khan, and Samee U. Khan. Assad Abbas had
secondary responsibility for developing the security model and conducting experiments. Assad
Abbas also drafted and revised all versions of this chapter. Samee U. Khan served as proofreader
and checked results collected by Assad Abbas.

112
the patients about certain important observed health conditions [6.7]. More formally, the PHRs are
managed through the Internet based tools to permit patients to create and manage their health
information as lifelong records that can be made available to those who need the access [6.8].
Consequently, the PHRs enable the patients to effectively communicate with the doctors and other
care providers to inform about the symptoms, seek advice, and keep the health records updated for
accurate diagnosis and treatment.
6.1.1. Motivation
Despite the advantages of scalable, agile, cost effective, and ubiquitous services offered by
the cloud, various concerns correlated to the privacy health data also arise. A major reason for
patients’ apprehensions regarding the confidentiality of PHRs is the nature of the cloud to share
and store the PHRs [6.9]. Storing the private health information to cloud servers managed by third-
parties is susceptible to unauthorized access. In particular, privacy of the PHRs stored in public
clouds that are managed by commercial service providers is extremely at risk [6.10]. The privacy
of the PHRs can be at risk in several ways, for example theft, loss, and leakage [6.11, 6.12]. The
PHRs either in cloud storage or in transit from the patient to the cloud or from cloud to any other
user may be susceptible to unauthorized access because of the malicious behavior of external
entities. Moreover, there are also some threats by valid insiders to the health-data. Moreover, while
the PHRs are stored on the third-party cloud storage, they should be encrypted in such a way that
neither the cloud server providers nor the unauthorized entities should be able to access the PHRs.
Instead, only the entities or individuals with the ‘right-to-know’ privilege should be able to access
the PHRs. Moreover, the mechanism for granting the access to PHRs should be administered by
the patients themselves to avoid any unauthorized modifications or misuse of data when it is sent
to the other stakeholders of the health cloud environment.

113
Numerous methods have been employed to ensure the privacy of the PHRs stored on the
cloud servers. The privacy preserving approaches make sure confidentiality, integrity, authenticity,
accountability, and audit trial. Confidentiality ensures that the health information is entirely
concealed to the unsanctioned parties [6.13], whereas integrity deals with maintaining the
originality of the data, whether in transit or in cloud storage [6.14]. Authenticity guarantees that
the health-data is accessed by authorized entities only, whereas accountability refers to the fact
that the data access policies must comply with the agreed upon procedures. Monitoring the
utilization of health-data, even after access to that has been granted, is called audit trial [6.1]. This
chapter presents a methodology called Secure Sharing of PHRs in the Cloud (SeSPHR) to
administer the PHR access control mechanism managed by patients themselves. The methodology
preserves the confidentiality of the PHRs by restricting the unauthorized users. Generally, there
are two types of PHR users in the proposed approach, namely: (a) the patients or PHR owners and
(b) the users of the PHRs other than the owners, such as the family members or friends of patients,
doctors and physicians, health insurance companies’ representatives, pharmacists, and researchers.
The patients as the owners of the PHRs are permitted to upload the encrypted PHRs on the cloud
by selectively granting the access to users over different portions of the PHRs. Each member of
the group of users of later type is granted access to the PHRs by the PHR owners to a certain level
depending upon the role of the user. The levels of access granted to different categories of users
are defined in the Access Control List (ACL) by the PHR owner. For example, the family members
or friends of the patients may be given full access over the PHRs by the owner. Similarly, the
representatives of the insurance company may only be able to access the portions of PHRs
containing information about the health insurance claims while the other confidential medical
information, such as medical history of the patient is restricted for such users.

114
The proposed approach also enforces the forward and backward access control. The newly
joining members of a particular user group obtain the keys from the SRS. The shared data is
encrypted by the keys of the owner only. The access to the data for newly joining member is
granted after the approval of the PHR owner. Similarly, a departing user is removed from the ACL
and the corresponding keys for that user are deleted. The deletion of the user keys and removal
from the ACL results in denial of access to the PHR for any illegitimate access attempts after the
user has departed. We also performed the formal analysis of the proposed scheme by using the
High Level Petri Nets (HLPN) and the Z language. The HLPN is used not only to mimic the system
but also offers the mathematical properties that are subsequently employed to investigate the
system’s behavior. The verification is performed with the Satisfiability Modulo Theories Library
(SMT-Lib) and the Z3 solver. The task of verification using the SMT is accomplished by first
translating the petri net model into the SMT along with the specific properties and subsequently
using the Z3 solver to determine if the properties hold or not. The key contributions of the proposed
work are given below:
A mechanism to administer the access control by the patients on the PHRs is presented.
The PHR Confidentiality is ensured by using the El-Gamal encryption and proxy re-encryption
approaches.
The methodology allows the PHR owners to selectively grant access over the portions of PHRs
based on the access level specified in the ACL for different groups of users.
A semi-trusted proxy called SRS is deployed to ensure the access control and to generate the
re-encryption keys for different groups of users. The SRS in the proposed scheme is unable to
learn about the contents of PHR due to the fact that PHRs are by no means transmitted to the
SRS.

115
The proposed patient-centric access control scheme also secures the PHRs from valid insiders.
The scheme also introduces the access mechanism for the departing and newly joining
members.
Formal analysis and verification of the proposed methodology is performed to validate its
working according to the specifications.
6.2. Preliminaries
Before the detailed discussion on the proposed scheme for secure sharing of PHRs among
different groups of users, we present some important preliminary concepts. Section 6.2.1 presents
a brief introduction about El-Gamal encryption. The preliminary concepts related to the proxy re-
encryption are highlighted in Section 6.2.2.
6.2.1. El-Gamal Encryption
El-Gamal encryption system is a public key cryptosystem proposed by T. El-Gamal [6.15]
that is built on Diffie-Hellman key exchange [6.16]. The difficulty in computing the discrete
logarithms establishes the El-Gamal encryption system’s security. El-Gamal encryption mainly
comprises of the steps, such as the initialization, encryption, and decryption [6.17].
6.2.1.1. Initialization
Given a large prime 𝑝 and generator 𝑔 of the multiplicative group 𝑍𝑝∗. Select a random
secret key 𝑥 and compute 𝑏 = 𝑔𝑥 𝑚𝑜𝑑 𝑝. Moreover, (𝑝, 𝑏, 𝑔) represents the generated public key.
6.2.1.2. Encryption
The message 𝑚 is encrypted by the sender by obtaining the receiver’s public key (𝑝, 𝑏, 𝑔)
as follows:
𝛾 = 𝑔𝑥 𝑚𝑜𝑑 𝑝 (6.1)
and,

116
𝛿 = 𝑚 ∗ (𝑔𝑥)𝑘 (6.2)
The encrypted message 𝐸(𝑚) = (𝛾, 𝛿) is sent to the receiver.
6.2.1.3. Decryption
The encrypted message E (m) after it is received by the receiver is decrypted by means of
the private key x and the decryption factor as follows:
𝑑 = (𝛾𝑝−1−𝑥) 𝑚𝑜𝑑 𝑝 (6.3)
The encrypted message 𝑚 is recovered as:
(𝐷(𝐸(𝑚)) = (𝑑) ∗ 𝛿 𝑚𝑜𝑑 𝑝 (6.4)
6.2.2. Proxy Re-encryption
The proxy re-encryption approach originally presented in [6.18] proposed to employ a
third-party having the capability to transfigure the enciphered text that was encrypted for one of
the communicating parties to be decrypted by the other user or party. The main operations in the
proxy re-encryption include setup, key generation, encryption, and decryption [6.4].
6.3. The Proposed SeSPHR Methodology
The proposed scheme employs proxy re-encryption for providing confidentiality and
secure sharing of PHRs through the public cloud. The architecture of the proposed SeSPHR
methodology is presented in Figure 6.1. The methodology considers the cloud servers as the
untrusted entity and therefore, introduces a semi-trusted server called the Setup and Re-encryption
Server (SRS) as the proxy. Proxy Re-encryption based approach is used for the SRS to generate
the re-encryption keys for secure sharing of PHRs among the users. The PHRs are encrypted by
the patients or PHR owners and only the authorized users having the keys issued by the SRS can
decrypt the PHRs. Moreover, the users are granted access to the specific portions of PHRs as
deemed important by the PHR owner. The proposed approach is secure as compared to various

117
other constructions used in the sense that the SRS in the proposed framework is never transmitted
the PHR data. Instead, the responsibility of the SRS is to manage the keys while the encryption
operations are performed by the PHR owners whereas the decryption is performed at the requesting
users’ end having the valid decryption keys.
6.3.1. Entities
The proposed methodology to share the PHRs in the cloud environment involves three
entities namely: (a) the cloud, (b) Setup and Re-encryption Server (SRS), and (c) the users. Brief
description about each of the entities is presented below.
6.3.1.1. The Cloud
The scheme proposes the storage of the PHRs on the cloud by the PHR owners for
subsequent sharing with other users in a secure manner. The cloud is assumed as un-trusted entity
and the users upload or download PHRs to or from the cloud servers. As in the proposed
methodology the cloud resources are utilized only to upload and download the PHRs by both types
of users, therefore, no changes pertaining to the cloud are essential.
6.3.1.2. Setup and Re-encryption Server (SRS)
The SRS is a semi-trusted server that is responsible for setting up public/private key pairs
for the users in the system. The SRS also generates the re-encryption keys for the purpose of secure
PHR sharing among different user groups. The SRS in the proposed methodology is considered as
semi-trusted entity. Therefore, we assume it to be honest following the protocol generally but
curious in nature. The keys are maintained by the SRS but the PHR data is never transmitted to
the SRS. Encryption and decryption operations are performed at the users’ ends. Besides the key
management, the SRS also enforces the access control over the shared data in the cloud.

118
6.3.1.3. Users
Generally, the system has two types of users: (a) the patients (owners of the PHR who want
to securely share the PHRs with others) and (b) the family members or friends of patients, doctors
and physicians, health insurance companies’ representatives, pharmacists, and researchers. In
SeSPHR methodology, the friends or family members are considered as private domain users
whereas all the other users are regarded as the public domain users. The users of both the private
and public domain may be granted different levels of access to the PHRs by the PHR owners. For
example, the users that belong to private domain may be given full access to the PHR, whereas the
public domain users, such as physicians, researchers, and pharmacists may be granted access to
some specific portions of the PHR. Moreover, the aforementioned users may be granted full access
to the PHRs if deemed necessary by the PHR owner.
6.3.2. The PHR Partitioning
To enforce the fine-grained access control for different types of users, the PHR is logically
partitioned into the following four portions:
Personal Information;
Medical information;
Insurance related information;
Prescription information;
In other words, the SeSPHR methodology allows the patients to exercise the fine-grained access
control over the PHRs. All of the users in the system are required to be registered with the SRS
However, it is noteworthy that the above said partitioning is not inflexible. It is at the discretion of
the user to partition the PHR into lesser or more number of partitions. The PHRs can be
conveniently partitioned and can be represented in formats, for example XML. Moreover, the

119
PHR Storage on Cloud
PHR Owner
11
22PHR
Information
Encrypted PHR
PHR Encryption33
PHR Users
Setup and Re-encryption server
Re-encryption keys management and
distribution
Tran
smit
Param
eter
s
PHR StorageCloud Servers
Applications
PH
R f
ile
acc
ess
re
qu
est
PH
R f
ile
do
wn
loa
d
44
55
Re-encryption key request
Re-encryption key provided
66
77
Figure 6.1: Architecture of the proposed SeSPHR methodology
PHR owner may place more than one partition into same level of access control. Any particular
user might not be granted a full access on the health records and some of the PHR partitions may
be restricted to the user. For example, a pharmacist may be given access to prescription and
insurance related information whereas personal and medical information may be restricted for a
pharmacist. Likewise, family/friend may be given full access to the PHR. A researcher might only
need the access to the medical records while de-identifying the personal details of the patients. The
access rights over different PHR partitions are determined by the PHR owner and are delivered to
the SRS at the time of data uploading to the cloud.
6.3.3. Working of the Proposed Methodology
The proposed SeSPHR methodology comprises of the steps namely: (a) setup, (b) key
generation, (c) encryption, and (d) decryption. Each of the steps is discussed below:

120
6.3.3.1. Setup
The proposed methodology works on groups 𝐺1 and 𝐺2 with the prime order 𝑞. The
bilinear mapping of 𝐺1 and 𝐺2 is 𝐺1 × 𝐺1 → 𝐺2. A parameter 𝑔 is a random generator such that
𝑔 ∈ 𝐺1. The variable 𝑍 is another random generator such that 𝑍 = 𝑒(𝑔, 𝑔) ∈ 𝐺2.
6.3.3.2. Key Generation
The public/private key pairs are generated by the SRS for the set of authorized users. The
keys are generated as following:
𝑆𝐾𝑖 = 𝑥𝑖 , 𝑃𝐾𝑖 = 𝑔𝑥𝑖 (6.5)
where 𝑥𝑖 ∈ 𝑍𝑞∗ . The 𝑆𝐾𝑖 and 𝑃𝐾𝑖 represent the private and public key of the user 𝑖, respectively.
The keys are securely transmitted to the corresponding users
6.3.3.3. Encryption
Suppose any patient P needs to upload his/her PHR onto the cloud. The patient client
application generates random number(s) equal to the PHR partitions placed in the distinct access
level groups by the user. In our case, we consider that all of the four partitions described in Section
6.3.2 are at different access levels. Therefore, in our case four random variables 𝑟1, 𝑟2, 𝑟3, 𝑟4 ∈ 𝑍𝑞∗
are generated. The variable 𝑟𝑖 is used to encrypt i-th partition of the PHR. Each partition is
encrypted separately by the client application. The XML format conveniently allows the
application to perform encryption/decryption on logical partitions of the PHR. The encryption of
the aforesaid partitions of the PHR is performed as follows.
𝐶𝑝𝑒𝑟 = 𝑍𝑟1 . 𝑃𝐻𝑅𝑝𝑒𝑟 (6.6)
where PHRper refers only to the personal partition of the PHR and Cper is the semi-encrypted file
that contains the personal partition as encrypted text.
𝐶𝑖𝑛𝑠 = 𝑍𝑟2 . 𝑃𝐻𝑅𝑖𝑛𝑠 (6.7)

121
where 𝑃𝐻𝑅𝑖𝑛𝑠 refers only to the insurance partition of the PHR and Cins is the semi-encrypted file
that contains the insurance partition as encrypted text in addition to the 𝐶𝑝𝑒𝑟 that was encrypted in
the previous step.
𝐶𝑚𝑒𝑑 = 𝑍𝑟3 . 𝑃𝐻𝑅𝑚𝑒𝑑 (6.8)
where 𝑃𝐻𝑅𝑚𝑒𝑑 refers only to the medical information partition of the PHR and 𝐶𝑚𝑒𝑑 is the semi-
encrypted file that contains the insurance partition as encrypted text in addition to the Cper and
Cins that were encrypted in the previous steps.
𝐶 = 𝑍𝑟4 . 𝑃𝐻𝑅𝑝𝑟𝑒𝑠 (6.9)
where 𝑃𝐻𝑅𝑝𝑟𝑒𝑠 refers only to the prescription information partition of the PHR. Here, 𝐶 represents
the complete encrypted file that contains all of the partitions in the encrypted form. Therefore, we
have not used the subscript with the last step of encryption.
It is noteworthy that the sequence of encryption may be changed and the above given
sequence is not hard and fast. In addition to the above stated encryptions, the client also calculates
the following parameters.
𝑅𝑝𝑒𝑟_𝑃 = 𝑔𝑟1𝑥𝑝 (6.10)
𝑅𝑖𝑛𝑠_𝑃 = 𝑔𝑟2𝑥𝑝 (6.11)
𝑅𝑚𝑒𝑑_𝑃 = 𝑔𝑟3𝑥𝑝 (6.12)
𝑅𝑝𝑟𝑒𝑠_𝑃 = 𝑔𝑟4𝑥𝑝 (6.13)
where 𝑥𝑝 is the private key of the patient that is uploading the PHR. The parameter 𝑅 is used to
generate the re-encryption key for the partition indicated in the subscript of each 𝑅. The 𝑃 in the
subscript shows that the parameter 𝑅 is generated by the user 𝑃. The completion of the encryption
phase is followed by the upload of complete encrypted file C to the public cloud. The parameters

122
𝑅𝑝𝑒𝑟_𝑃, 𝑅𝑖𝑛𝑠_𝑃, 𝑅𝑚𝑒𝑑_𝑃, and 𝑅𝑝𝑟𝑒𝑠_𝑃 are transmitted to the SRS along with the file identification for
which these parameters are generated.
6.3.3.4. Decryption
Suppose a user 𝑈 wants to access the encrypted PHR (𝐶) uploaded by the patient 𝑃. The
user 𝑈 downloads the 𝐶 directly from the cloud (after the cloud authentication process). Afterwards
the user 𝑈 requests the SRS to compute and send the corresponding 𝑅 parameters that are used for
decryption. The SRS checks the ACL for the requesting user and determines whether the access to
the partition for which the user has requested 𝑅, is granted by the PHR owner or not. According to
the access permissions specified in the ACL, the SRS will generate the corresponding parameters
and will send those to the requesting user.
In the following text, we will show the generation of 𝑅 for all of the partitions to clarify
the process at a single place. Therefore, we assume that user 𝑈 has access to all of the partitions.
The SRS calculates the re-encryption key and 𝑅 and transmits it to the user 𝑈. The re-encryption
keys and 𝑅 are calculated below:
𝑅𝐾𝑃→𝑈 = 𝑔𝑥𝑈𝑥𝑃 (6.14)
where 𝑅𝐾𝑃→𝑈 is the re-encryption key from patient 𝑃 to user 𝑈 whereas 𝑥𝑈 and 𝑥𝑃 re the private
keys of 𝑈 and 𝑃, respectively. Subsequently, the parameters 𝑅 for all of the partitions
corresponding to the user 𝑈 are calculated according to the following equations.
𝑅𝑝𝑒𝑟𝑈= 𝑒 (𝑅𝐾𝑃→𝑈 , 𝑅𝑝𝑒𝑟𝑝
) = 𝑒 (𝑔𝑥𝑈𝑥𝑃 , 𝑔𝑟1𝑥𝑃) = 𝑒(𝑔, 𝑔)𝑟1𝑥𝑈 =
𝑍𝑟1 𝑥𝑈 (6.15)
where 𝑅𝑝𝑒𝑟_𝑈 is the parameter used to decrypt the partition ‘personal information’ and is applicable
for the user 𝑈.

123
Similarly, R parameters for other partitions corresponding to user 𝑈 are calculated in Eq.
6.16, Eq. 6.17, and Eq. 6.18.
𝑅𝑖𝑛𝑠_𝑈 = 𝑒(𝑅𝐾𝑃→𝑈, 𝑅𝑖𝑛𝑠_𝑃) = 𝑒 (𝑔𝑥𝑈𝑥𝑃 , 𝑔𝑟2𝑥𝑃) = 𝑒(𝑔, 𝑔)𝑟2𝑥𝑈 =
𝑍𝑟2 𝑥𝑈 (6.16)
𝑅𝑚𝑒𝑑_𝑈 = 𝑒(𝑅𝐾𝑃→𝑈, 𝑅𝑚𝑎𝑒𝑑_𝑃) = 𝑒 (𝑔𝑥𝑈𝑥𝑃 , 𝑔𝑟3𝑥𝑃) = 𝑒(𝑔, 𝑔)𝑟3𝑥𝑈 = 𝑍𝑟3 𝑥𝑈 (6.17)
𝑅𝑝𝑟𝑒𝑠_𝑈 = 𝑒(𝑅𝐾𝑃→𝑈, 𝑅𝑝𝑟𝑒𝑠_𝑃) = 𝑒 (𝑔𝑥𝑈𝑥𝑃 , 𝑔𝑟4𝑥𝑃) = 𝑒(𝑔, 𝑔)𝑟4𝑥𝑈 = 𝑍𝑟4 𝑥𝑈 (6.18)
The above given parameters are provided to the user 𝑈 that decrypts each of the partitions based
on the following equations.
𝑃𝐻𝑅𝑝𝑒𝑟 =𝐶𝑝𝑒𝑟
𝑅𝑝𝑒𝑟_𝑈
1𝑥𝑈
(6.19)
𝑃𝐻𝑅𝑖𝑛𝑠 =𝐶𝑖𝑛𝑠
𝑅𝑖𝑛𝑠_𝑈
1𝑥𝑈
(6.20)
𝑃𝐻𝑅𝑚𝑒𝑑 =𝐶𝑚𝑒𝑑
𝑅𝑚𝑒𝑑_𝑈
1𝑥𝑈
(6.21)
𝑃𝐻𝑅𝑝𝑟𝑒𝑠 =𝐶𝑝𝑟𝑒𝑠
𝑅𝑝𝑟𝑒𝑠_𝑈
1𝑥𝑈
(6.22)
The decryption of the last partition will result in complete PHR in plain form. As mentioned earlier,
the user will obtain the 𝑅 parameter from the SRS for only the partition(s) for which access is
allowed to the requesting user.
6.3.3.5. Newly joining members
A new member can enter into the group by registering with the SRS. The new members are
registered to the system by the SRS according to their roles and the approval for registering the

124
new members is granted by the PHR owner. The SRS generates a pair of public/private keys. The
keys are securely transmitted to the users (new members). Initially, at the time of registration, the
new members are given the default access right as specified by the PHR owner depending upon
the type of group in which the newly joining member is registered. However, if a certain user needs
the extended access rights over the PHRs, then such rights are granted after the approval of the
PHR owner. Moreover, a user in the family/friend category can only be added by the approval of
the PHR owner. The ACL is updated after the registration of the new user along with the date of
joining. The joining user is granted access to the files from the date of joining unless specified
otherwise by the PHR owner.
6.3.3.6. Departing User
If due to any reason any of the users of the PHR is required to depart, then the PHR owner
notifies the SRS to revoke the granted access. The SRS deletes the keys corresponding to the
departing user and removes the user from the ACL. The system does not need to change the keys
for every user and also it does not require the re-encryption of entire data.
6.4. Discussion
The proposed methodology provides the following services for the PHRs shared over the
public cloud.
Confidentiality;
Secure PHR sharing among the groups of authorized users;
Securing PHRs from unauthorized access of valid insiders;
Forward and backward access control;
In the proposed methodology, the cloud is not considered a trusted entity. The features of
cloud computing paradigm, such as shared pool of resources, multi tenancy, and virtualization

125
might generate many sorts of insider and outsider threats to the PHRs that are shared over the
cloud. Therefore, it is important that the PHRs should be encrypted before storing at the third-party
cloud server. The PHR is first encrypted at the PHR owner’s end and is subsequently uploaded to
the cloud. The cloud merely acts as a storage service in the proposed methodology. The encryption
keys and other control data are never stored on the cloud. Therefore, at the cloud’s end the
confidentiality of the data is well achieved. Even if the unauthorized user at the cloud by some
means obtains the encrypted PHR file, the file cannot be decrypted because the control data does
not reside at the cloud and the confidentiality of the PHR is ensured.
The uploaded PHRs are encrypted by the owner and the rest of the users in the system
obtain the plain data by utilizing the re-encryption key that is computed by the SRS. The SRS
generates the re-encryption parameters only for the allowed partitions corresponding to the
requesting user. Therefore, a compromised legitimate group member does not disturb the privacy
of the whole system.
The ACL specifies all of the rights pertaining to each of the users and are specified by the
PHR owner. The rights are specified based on the categories of the users and are extended/limited
by the approval of the PHR owner. The SRS calculates and sends the re-encryption parameters
based on the specified rights on the partitions. Therefore, even the legitimate users cannot access
the unauthorized partition.
The newly joining member obtains the keys from the SRS. The shared data is encrypted by
the keys of the owner only. The access to the data for newly joining member is granted by the
approval of the SRS. Moreover, introducing a new key in the system does not require re-encryption
of the whole data. Similarly, a departing user is removed from the ACL and the corresponding
keys are deleted. The deletion of the user keys and removal from the ACL results in denial of

126
access to the PHR for any illegitimate access attempts afterwards. Therefore, the proposed
methodology is effectively secure because it restricts the access of departing users (forward access
control) and permits the new users to access the past data (backward access control). The SRS is
considered a semi-trusted authority that is honest but curious. In general, the SRS is assumed to
follow the protocol honestly. Although the SRS generates and stores the key pair for each of the
users, the data whether encrypted or plain is never transmitted to the SRS. The SRS is only
responsible for key management and re-encryption parameters generation. Moreover, the access
control is also enforced by the SRS.
6.5. Formal Analysis and Verification
Before presenting the detailed analysis of the proposed methodology for secure sharing of
the PHRs in the cloud, brief introduction about the HLPN, SMT-Lib, and Z3 are presented. Section
6.5.1 presents preliminaries about the HLPN, whereas the basics about the SMT-Lib and Z3 solver
are presented in Section 6.5.2. The formal analysis of the proposed methodology is presented in
Section 6.5.3.
6.5.1. High Level Petri Nets (HLPN)
The petri nets are the tools that are employed to graphically and mathematically model the
systems [6.19]. The petri nets are capable of modeling a variety of systems that can be
characterized as the parallel, concurrent, distributed, non-deterministic, asynchronous, and
stochastic [6.20]. To model the working of the SeSPHR methodology, we used the HLPN, which
is a variant of the conventional petri nets. The HLPN is a structure comprising of 7-tuples and is
characterized as 𝑁 = (𝑃, 𝑇, 𝐹, 𝜑, 𝑅, 𝐿, 𝑀0) [6.24]. Each of the tuples is defined below:
𝑃 represents the set of places;
𝑇 characterizes the transitions set such that 𝑃 ∩ 𝑇 = ∅ ;

127
𝐹 is used to represent the flow relation and is given by 𝐹 ⊆ (𝑃 × 𝑇) ∪ (𝑇 ∪ 𝑃).
The data type mapping of a particular place 𝑃 is given by the mapping function 𝜑 such that
𝜑: 𝑃 → 𝑇𝑦𝑝𝑒;
𝑅 states the rules that are used to map the transitions 𝑇;
𝐿 represents the label used for mapping 𝐹 to the 𝐿;
The initial marking is given by 𝑀0.
The information about the structure of the petri net is given by the variables (𝑃, 𝑇, 𝐹)
whereas the variables (𝜑, 𝑅, 𝐿) represent the static information. In other words, the semantics of
the information do not change throughout the system.
Each of the places in HLPN has different types of tokens. The enabling transitions in the
HLPN only occur when the pre-conditions for that transition hold. In addition, to enable a certain
transition the variables from the inward flows are utilized. Similarly, to fire the transitions, the
variables from outgoing flows are used by the post-conditions.
6.5.2. The Z3 Solver and SMT-Lib
Satisfiability Modulo Theory (SMT) is employed to validate the satisfiability of formulas
applied on various theories of interest. Originated from the theory of Boolean Satisfiability Solvers
(SAT), the SMT-Lib offers an input platform and benchmarking framework for system evaluation
[6.21]. Besides various other application areas, the SMT has been used in deductive software
verification [6.19]. Along with the SMIT-Lib, we also used Z3 solver. The Z3 solver is theorem
prover and an automated satisfiability checker that is developed at the Microsoft Research. Having
support for a diverse range of theories, the Z3 solver focuses on unraveling the problems that rise
in software verification. Moreover, the Z3 solver determines the satisfiability of certain set of
formulas for the built-in-theories of SMT-Lib [6.22].

128
6.5.3. Formal Verification
Formal verification is the procedure that is used to determine the precision and correctness
of a particular system. We employed the bounded model checking [6.23] technique for verification
using the SMT-Lib and Z3 solver A Boolean formula is said to be satisfiable only if any of the
system inputs that are acceptable drive the underlying state transition system to the state that
terminates after finite sequence of state transitions [6.19]. The bounded checking process includes
various tasks namely: (a) the specification, (b) model representation, and (c) verification [6.19].
Specification is the system’s description stating the rules that the system must satisfy whereas the
model representation refers to the mathematical modeling of the entire system. Likewise, the
verification of the model involves the utilization of a tool to determine whether a specification is
specified by the system or not. Figure 6.2 presents the HLPN model for the SeSPHR. Table 6.1
and Table 6.2 present the data types and mappings, respectively. In HLPN model presented in
Figure 6.2, all the transitions belonging to set 𝑇 are represented by the rectangular black boxes
whereas the circles represent the palaces belonging to set 𝑃. The SeSPHR methodology was
discussed in detail in Section 6.3. The system starts with the setup and key generation phase. The
setup and key generation process is represented by transition Gen_Keys and the following equation
maps to it.
𝑅 (𝐺𝑒𝑛_𝑘𝑒𝑦𝑠) = ∀ 𝑥1 ∈ 𝑋1|
𝑥1[4] ≔ 𝐺𝑒𝑛_ 𝑔(𝑥1[1]) ∧ 𝑥1[5] ≔ 𝐺𝑒𝑛 _𝑍𝑞∗(𝑥1[1] ∧ 𝑥1[2] ≔
𝐺𝑒𝑛_𝑆𝐾𝑖(𝑥1[1] ∧ 𝑥1[3] ≔ 𝐺𝑒𝑛_𝑃𝐾𝑖(𝑥1[1]) ∧ 𝑋1′ = 𝑋1 ∪ {𝑥1} (6.23)
The transition send_keys represents the process of delivering the keys to the users in the system.
The following rule maps to the transition.
(𝑠𝑒𝑛𝑑−𝑘𝑒𝑦𝑠) = ∀ 𝑥2 ∈ 𝑋2, ∀ 𝑥3 ∈ 𝑋3|𝑥3[1] ≔ 𝑥2[1] ∧ 𝑥3[2] ≔ 𝑥2[2] ∧𝑥3[3] ≔ 𝑥2[3] ∧ 𝑥3[6] ≔ 𝑥2[6] ∧ 𝑥3[8] ≔ 𝑥2[4] ∧ 𝑋3
′ = 𝑋3 ∪ {𝑥3} (6.24)

129
Whenever the encryption of the PHRs before uploading to the cloud is required, a random number
is generated by the PHR owner according to the number of partitions in the PHR. The transition
Gen_ri and the associated rule are given as below.
𝑅 (𝐺𝑒𝑛_𝑟𝑖) = ∀𝑥4 ∈ 𝑋4|𝑥4[5] ≔ 𝐺𝑒𝑛_𝑟𝑖(𝑥4[4]) ∧ 𝑋4′ = 𝑋4 ∪ {𝑥4} (6.25)
After the generation of the random number the encryption performed as following.
𝑅 (𝐸𝑛𝑐𝑟𝑦𝑝𝑡 _𝑃𝑖) = ∀𝑥5 ∈ 𝑋5|
𝑥5[7] ≔ 𝑒𝑛𝑐𝑟𝑦𝑝𝑡 (𝑥5[4], 𝑥5[5], 𝑥5[6]) ∧ 𝑋5′ = 𝑋5 ∪ {𝑥5} (6.26)
The 𝑅 parameters are calculated by the PHR owner used for generating re-encryption keys
according to the process described in Section 6.3. The transition 𝐶𝑜𝑚𝑝𝑡_ 𝑅 represents the process
and maps to the following rule.
𝑅(𝐶𝑜𝑚𝑝𝑡_𝑅) = ∀𝑥6 ∈ 𝑋6|
𝑥6[9] ≔ 𝑐𝑜𝑚𝑝_ 𝑅𝑖 (𝑥6[2], 𝑥6[8], 𝑥6[5]) ∧ 𝑋6′ = 𝑋6 ∪ {𝑥6} (6.27)
After the completion of encryption process, the encrypted data is transmitted to the cloud server.
The following transition and equation represents the process.
𝑅(𝑠𝑒𝑛𝑑_𝐶) = ∀𝑥7 ∈ 𝑋7, ∀𝑥8 ∈ 𝑋8𝑥8[1] ≔ 𝑥7[7] ∧ 𝑋8′ = 𝑋8 ∪ {𝑥8} (6.28)
The calculated 𝑅 parameters are sent to the SRS. The transition 𝑠𝑒𝑛𝑑_𝑅𝑖 shows the associated rule
as below:
𝑅(𝑠𝑒𝑛𝑑−𝑅𝑖) = ∀ 𝑥9 ∈ 𝑋9, ∀ 𝑥10 ∈ 𝑋10|
𝑥10[7]: = 𝑥9[9] ∧ 𝑥10[8] ≔ 𝑥9[4] ∧ 𝑋10′ = 𝑋10 ∪ {𝑥10} (6.29)
The encrypted PHR is downloaded by the requesting user from the cloud according to the below
transition and associated rule:
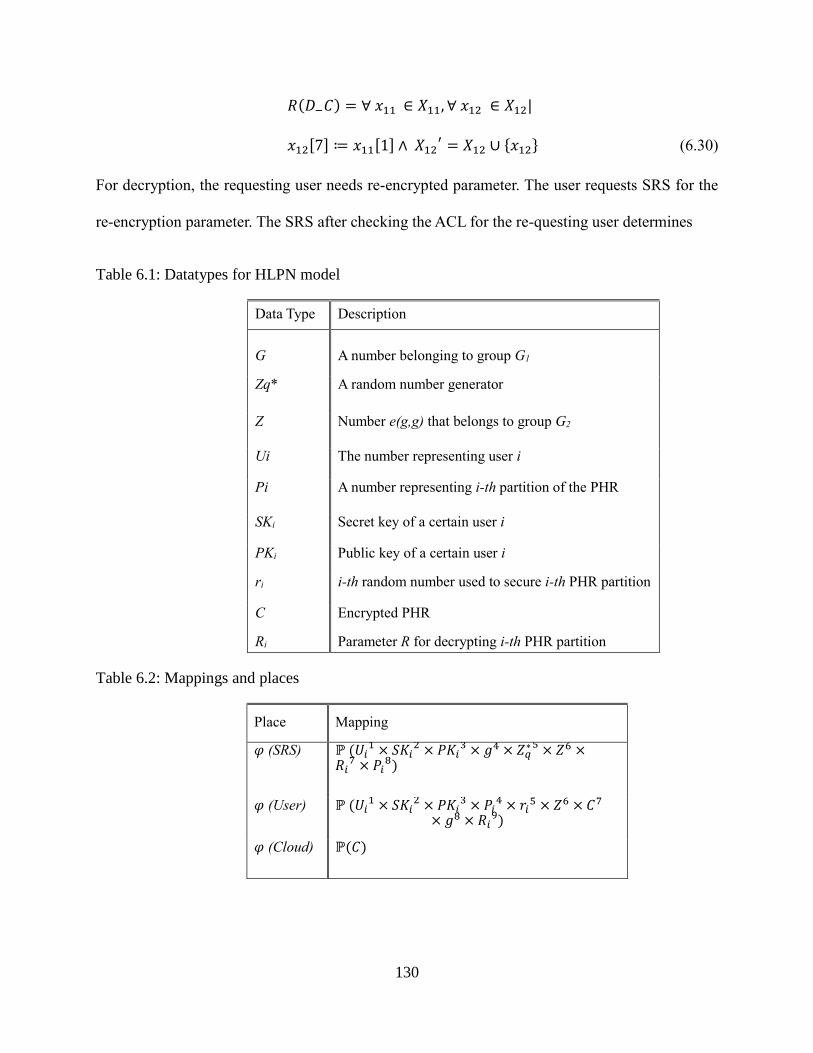
130
𝑅(𝐷−𝐶) = ∀ 𝑥11 ∈ 𝑋11, ∀ 𝑥12 ∈ 𝑋12|
𝑥12[7] ≔ 𝑥11[1] ∧ 𝑋12′ = 𝑋12 ∪ {𝑥12} (6.30)
For decryption, the requesting user needs re-encrypted parameter. The user requests SRS for the
re-encryption parameter. The SRS after checking the ACL for the re-questing user determines
Table 6.1: Datatypes for HLPN model
Data Type Description
G A number belonging to group G1
Zq* A random number generator
Z Number e(g,g) that belongs to group G2
Ui The number representing user i
Pi A number representing i-th partition of the PHR
SKi Secret key of a certain user i
PKi Public key of a certain user i
ri i-th random number used to secure i-th PHR partition
C Encrypted PHR
Ri Parameter R for decrypting i-th PHR partition
Table 6.2: Mappings and places
Place Mapping
𝜑 (SRS) ℙ (𝑈𝑖1 × 𝑆𝐾𝑖
2 × 𝑃𝐾𝑖3 × 𝑔4 × 𝑍𝑞
∗ 5 × 𝑍6 ×𝑅𝑖
7 × 𝑃𝑖8)
𝜑 (User) ℙ (𝑈𝑖1 × 𝑆𝐾𝑖
2 × 𝑃𝐾𝑖3 × 𝑃𝑖
4 × 𝑟𝑖5 × 𝑍6 × 𝐶7
× 𝑔8 × 𝑅𝑖9)
𝜑 (Cloud) ℙ(𝐶)

131
whether the user has been granted access to uploaded message, the manager computes the re-
encryption parameters and sends to the requesting user. This is done in the following rule:
𝑅(𝐷−𝑅_𝑆) = ∀ 𝑥13 ∈ 𝑋13, ∀ 𝑥14 ∈ 𝑋14|𝑥13[1] = 𝑥14[1] ∧ 𝑥13[8] = 𝑥14[4] ∧ 𝑥14[9]
≔ 𝑥13[7] ∧ 𝑋13′ = 𝑋13 ∪ {𝑥13} ∧ 𝑋14
′ = 𝑋14 ∪ {𝑥14} (6.31)
If the requesting user does not belong to the access list, then the request for re-encryption
parameters fails and is shown is the rule below:
𝑅(𝐷−𝑅 _ 𝐹) = ∀𝑥15 ∈ 𝑋15 , ∀ 𝑥16 ∈ 𝑋16|
𝑥15 [1] ≠ 𝑥16 ∨ 𝑥15[8] ≠ 𝑥16[4] ∧ 𝑋15′ = 𝑋15 ∧ 𝑋16
′ = 𝑋16 (6.32)
After receiving the required parameters, the user decrypts the PHR as per following equation.
𝑅(𝐷𝑒𝑐𝑟𝑦𝑝𝑡−𝐶) = ∀ 𝑥17 ∈ 𝑋17|𝑥17[4] = 𝑑𝑒𝑐𝑟𝑦𝑝𝑡 (𝑥17[7], 𝑥17[9]) ∧
𝑋17
′= 𝑋17 ∪ {𝑥17} (6.33)
6.5.4. Verification of Properties
To determine whether the presented SeSPHR scheme operates according to the
specifications, we performed verification of the properties. The following properties pertinent to
the working of SeSPHR methodology are verified.
A valid user in the system cannot obtain the re-encryption parameters for a PHR partition
for which the user is not granted the access.
The encryption and decryption is performed correctly as specified by the system.
Any unauthorized user is not able to generate the re-encryption parameters and decrypt the
PHR.

132
Figure 6.2: The HLPN model of the proposed SeSPHR methodology
The translation of the described model to SMT-Lib was performed and verification was
done through the Z3 solver. The solver exhibited the practicality of the model in accordance with
the stated properties. After encryption, the Z3 solver in total consumed 0.07 seconds to upload user
data and followed by a subsequent down-load and decrypt operation for a different user in the
group.
6.6. Performance Evaluation
6.6.1. Experimental Setup
The performance of the SeSPHR methodology to securely share the PHRs among different
types of users was evaluated by developing a client application in Java. The entities of the proposed
SeSPHR methodology include the cloud, SRS, and the users. We used Amazon Simple Storage
Services (Amazon S3) [6.24] as our cloud storage. The Amazon Web Services SDK (AWS) for
Java was used to obtain the Java APIs for AWS services. The SRS that actually is responsible to
generate the public/private key pairs and re-encryption keys is implemented as a third-party server.

133
The client application uses the Java Pairing Based Cryptography (JPBC) library to encrypt the
PHR data [6.25]. From the JPBC library we used Type A pairing that is constructed on the curve
𝑦2 = 𝑥3 + 𝑥 on the prime field 𝐹𝑞. The prime number q is set to be of 64 bytes or 512 bits. Due
to the fixed size of the prime number, the encryption and decryption process was carried out in the
chunks of 64 bytes. The experiments were conducted on the computer having Intel® Core i7-2600
CPU @ 3.40 GHz with 8 GB RAM.
6.6.2. Experimental Setup
The performance of the SeSPHR methodology was evaluated with regard to the time
consumed for key generation, encryption, decryption, and turnaround time. The results for each of
the above evaluation criteria are discussed below.
6.6.2.1. Key Generation
As stated earlier in Section 6.3 that the SRS is responsible for generating the public/private
key pairs for the users belonging to the set of authorized users. However, the key generation time
for the systems with large numbers of users may affect the overall performance of the system.
Therefore, we evaluated the performance of the SeSPHR in terms of the time consumed for the
key generation step for different number of user. The time consumption for generating keys for
10, 100, 500, 1000, 5000, and 10,000 users in presented in Figure 6.3. Contrary to the general trend
of increased key generation time when the number of users increases, it can be observed from
Figure 6.3 that with the increased number of users, the corresponding increase in the key
generation time is not uniform. For example, the time consumption to generate keys for 10 users
is 0.6 second whereas for 100 users, the key generation time increases to 0.97 second. Likewise,
the key generation time for 10,000 users is observed 2.16 seconds, which is also very reasonable
considering the high number of users. The key generation time for newly joining members is also

134
minimal because such members join occasionally and generating keys for a single user is indeed
an efficient process.
6.6.2.2. Key Generation
The time consumption of the SeSPHR methodology to encrypt and decrypt the data files
of varying sizes is also evaluated. The file sizes used for the experimentation are 50 KB, 100 KB,
Figure 6.3: Time consumption for key generation
Figure 6.4: Time consumption for encryption
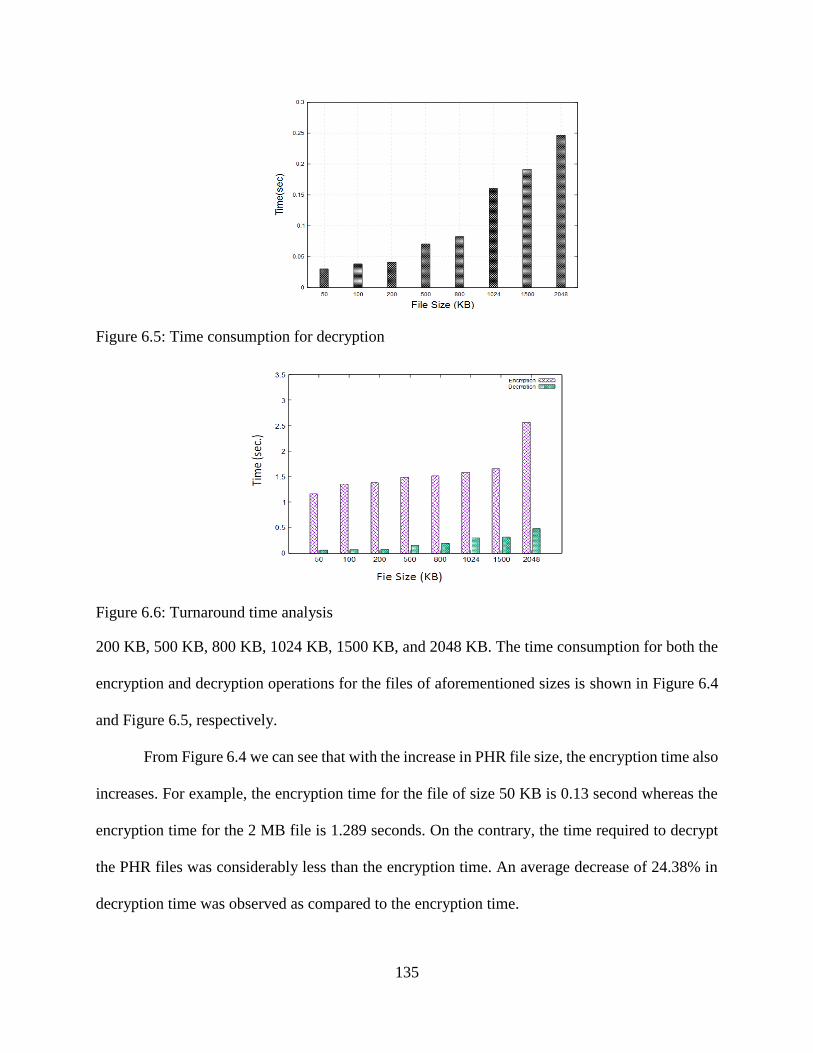
135
Figure 6.5: Time consumption for decryption
Figure 6.6: Turnaround time analysis
200 KB, 500 KB, 800 KB, 1024 KB, 1500 KB, and 2048 KB. The time consumption for both the
encryption and decryption operations for the files of aforementioned sizes is shown in Figure 6.4
and Figure 6.5, respectively.
From Figure 6.4 we can see that with the increase in PHR file size, the encryption time also
increases. For example, the encryption time for the file of size 50 KB is 0.13 second whereas the
encryption time for the 2 MB file is 1.289 seconds. On the contrary, the time required to decrypt
the PHR files was considerably less than the encryption time. An average decrease of 24.38% in
decryption time was observed as compared to the encryption time.

136
6.6.2.3. Turnaround Time
The performance of the scheme was also evaluated in terms of the turnaround time for both
the encryption and decryption operations. The turnaround time for encryption is given as:
𝑇𝑇𝑒𝑛𝑐= 𝑡𝐸𝑛𝑐 + 𝑡𝑢𝑝 (6.34)
where 𝑡𝐸𝑛𝑐 and 𝑡𝑢𝑝 respectively are the times for encryption and upload of the PHRs onto the
cloud. Similarly, the turnaround time for decryption operation is calculated as:
𝑇𝑇𝑑𝑒𝑐= 𝑡𝐷𝑒𝑐 + 𝑡𝑑𝑜𝑤𝑛 (6.35)
where 𝑡𝐷𝑒𝑐 and 𝑡𝑑𝑜𝑤𝑛 represent the decryption time and the download time, respectively. The
turnaround time for both the 𝑇𝑇𝑒𝑛𝑐 and 𝑇𝑇𝑑𝑒𝑐
are presented in Fig 6.6. It can be observed from Figure
6.6 that the turnaround time 𝑇𝑇𝑑𝑒𝑐for a file of certain size is far less time than the 𝑇𝑇𝑒𝑛𝑐
of the
corresponding file. The reason for the 𝑇𝑇𝑒𝑛𝑐 being significantly higher than the 𝑇𝑇𝐷𝑒𝑐
is that 𝑇𝑇𝑒𝑛𝑐
includes 𝑡𝑢𝑝, the time to upload the PHRs on the cloud that by itself requires more time. Therefore,
the upload time significantly affects the turnaround time 𝑇𝑇𝑒𝑛𝑐 for the encryption operation.
6.6.2.4. Complexity Analysis
We also compared the SeSPHR methodology in terms of key distribution, public and
private key sizes, and decryption complexity with the approaches presented in [6.13] and [6.26].
The comparison of the SeSPHR with the aforementioned approaches is presented in Table 6.4.
The definitions of the notations used in Table 6.4 are presented in Table 6.3.
The owners are responsible for encrypting the data for both the users of personal/private
domain and the public domain. Typically, the users in the personal/private domain are fewer than
the public domain users because the personal domain only contains the families or friends of the
patients whereas the public domain users include doctors, researchers, pharmacist and any other
users authorized by the PHR owner. The key distribution complexity of the SeSPHR for users of
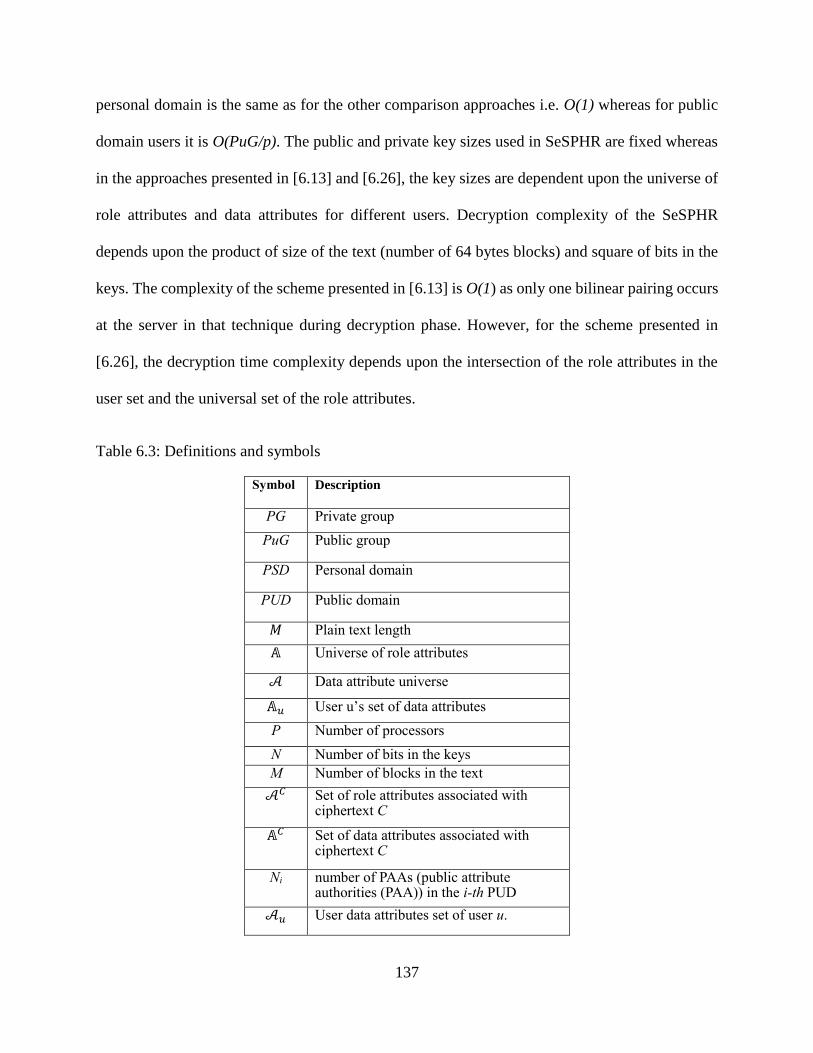
137
personal domain is the same as for the other comparison approaches i.e. O(1) whereas for public
domain users it is O(PuG/p). The public and private key sizes used in SeSPHR are fixed whereas
in the approaches presented in [6.13] and [6.26], the key sizes are dependent upon the universe of
role attributes and data attributes for different users. Decryption complexity of the SeSPHR
depends upon the product of size of the text (number of 64 bytes blocks) and square of bits in the
keys. The complexity of the scheme presented in [6.13] is O(1) as only one bilinear pairing occurs
at the server in that technique during decryption phase. However, for the scheme presented in
[6.26], the decryption time complexity depends upon the intersection of the role attributes in the
user set and the universal set of the role attributes.
Table 6.3: Definitions and symbols
Symbol Description
PG Private group
PuG Public group
PSD Personal domain
PUD Public domain
𝑀 Plain text length
𝔸 Universe of role attributes
𝒜 Data attribute universe
𝔸𝑢 User u’s set of data attributes
P Number of processors
N Number of bits in the keys
M Number of blocks in the text
𝒜𝐶 Set of role attributes associated with ciphertext C
𝔸𝐶 Set of data attributes associated with ciphertext C
Ni number of PAAs (public attribute authorities (PAA)) in the i-th PUD
𝒜𝑢 User data attributes set of user u.

138
Table 6.4: Comparison of SeSPHR with other approaches
SeSPHR [6.13] [6.26]
Key
Distribution
O(PG/P)
(private
group)
O(1)
(patient)
O(PuG/p)
(Public
group)
O(PSD)
(Owner)
O(1)
(User)
O(PUD)
(Public
group)
O(PSD)
(Owner
group)
O(1)
(User)
O(
∑ 𝑃𝑈𝐷𝑖𝑚𝑖=1 )
(Public
group)
Public Key
size
1024 bits |𝔸|𝑘
+ 𝑁𝑖
(PUDk)
|𝒜| + 1
(Owner)
∪ |𝔸|𝑘
PUD
|𝒜|
(Owner)
Private Key
size
512 bits |𝔸u| +1
(Public
User)
|𝒜u|+1
(personal user)
𝔸u
(Public
user)
|𝒜u|
(Personal user)
Decryption
complexity
𝑂(𝑛2 × 𝑚) O(1) (w/delegation) O(𝒜u ∩ 𝒜C) or O(𝔸𝑢 ∩ 𝔸𝐶)
6.7. Conclusions
In this chapter, a methodology to securely store and transmit the PHRs to the authorized
entities in the cloud is proposed. The methodology preserves the confidentiality of the PHRs and
enforces a patient-centric access control to different portions of the PHRs based on the access
provided by the patients. We implemented a fine-grained access control method in such a way that
even the valid system users cannot access those portions of the PHR for which they are not
authorized. The role of the semi-trusted proxy is to generate and store the public/private key pairs
for the users in the system. In addition to preserving the confidentiality and ensuring patient-centric
access control over the PHRs, the methodology also administers the forward and backward access
control for departing and the newly joining users, respectively. Moreover, we formally analyzed
and verified the working of SeSPHR method-ology through the HLPN, SMT-Lib, and the Z3
solver. The performance evaluation was done on the on the basis of time consumed to generate
keys, encryption and decryption operations, and turnaround time. The experimental results exhibit
the viability of the SeSPHR methodology to securely share the PHRs in the cloud environment.

139
6.8. References
[6.1] A. Abbas and S. U. Khan, “A Review on the State-of-the-Art Privacy Preserving
Approaches in E-Health Clouds,” IEEE Journal of Biomedical and Health Informatics,
vol. 18, no. 4, pp. 1431-1441, 2014.
[6.2] S. U. Khan, “Elements of Cloud Adoption,” IEEE Cloud Computing Magazine, vol. 1,
no. 1, pp. 71-73, 2014.
[6.3] A. Abbas, K. Bilal, L. Zhang, and S. U. Khan, “A cloud based health insurance plan
recommendation system: A user centered approach, “Future Generation Computer
Systems, vols. 43-44, pp. 99-109, 2015.
[6.4] A. N. Khan, ML M. Kiah, S. A. Madani, M. Ali, and S. Shamshirband, “Incremental
proxy re-encryption scheme for mobile cloud computing environment,” The Journal of
Supercomputing, Vol. 68, No. 2, 2014, pp. 624-651.
[6.5] R. Wu, G.-J. Ahn, and H. Hu, “Secure sharing of electronic health records in clouds,” In
8th IEEE International Conference on Collaborative Computing: Networking,
Applications and Work-sharing (CollaborateCom), 2012, pp. 711-718.
[6.6] I. A. T. Hashem, I. Yaqoob, N. B. Anuar, S. Mokhtar, A. Gani, and S. U. Khan, “The
Rise of Big Data on Cloud Computing: Review and Open Research Issues,” Information
Systems, vol. 47, pp. 98-115, 2015.
[6.7] J. Li, “Electronic personal health records and the question of privacy,” Computers, 2013,
DOI: 10.1109/MC.2013.225.
[6.8] D. C. Kaelber, A. K. Jha, D. Johnston, B. Middleton, and D. W. Bates, “A research
agenda for personal health records (PHRs),” Journal of the American Medical
Informatics Association, vol. 15, no. 6, 2008, pp. 729-736.

140
[6.9] S. Yu, C. Wang, K. Ren, and W. Lou, “Achieving secure, scalable and fine-grained data
access control in cloud computing,” in Proceedings of the IEEE INFOCOM, March 2010,
pp. 1-9.
[6.10] S. Kamara and K. Lauter, “Cryptographic cloud storage,” Financial Cryptography and
Data Security, vol. 6054, pp. 136–149, 2010.
[6.11] T. S. Chen, C. H. Liu, T. L. Chen, C. S. Chen, J. G. Bau, and T.C. Lin, “Secure Dynamic
access control scheme of PHR in cloud computing,” Journal of Medical Systems, vol. 36,
no. 6, pp. 4005–4020, 2012.
[6.12] M. Johnson, “Data hemorrhages in the health-care sector,” Financial Cryptography and
Data Security, vol. 5628, pp. 71–89, Apr. 2009.
[6.13] M. Li, S. Yu, Y. Zheng, K. Ren, andW. Lou, “Scalable and secure sharing of personal
health records in cloud computing using attribute-based encryption,” IEEE Transactions
on Parallel and Distributed Systems, 2013, vol. 24, no. 1, pp. 131–143.
[6.14] Z. Xiao and Y. Xiao, “Security and privacy in cloud computing,” IEEE Communications
Surveys and Tutorials, vol. 15, no. 2, pp. 1–17, Jul. 2012.
[6.15] T. ElGamal, “A public key cryptosystem and a signature scheme based on discrete
logarithms,” in Proceedings of CRYPTO 84 on Advances Cryptology, 1985, pp. 10-18.
[6.16] W. Diffie, and M. E. Hellman, “New directions in cryptography,” IEEE Transactions on
Information Theory, vol. 22, no. 6, 1976, pp. 644-654.
[6.17] D. Thilakanathan, S. Chen, S. Nepal, R. Calvo, and L. Alem, “A platform for secure
monitoring and sharing of generic health data in the Cloud,” Future Generation Computer
Systems, vol. 35, 2014, pp. 102-113.

141
[6.18] M. Blaze, G. Bleumer, and M. Strauss, “Divertible protocols and atomic proxy
cryptography,” in Proceedings of EUROCRYPT ’98, 1998, pp. 127-144.
[6.19] S. U. R. Malik, S. U. Khan, and S. K. Srinivasan, “Modeling and Analysis of State-of-
the-art VM-based Cloud Management Platforms,” IEEE Transactions on Cloud
Computing, vol. 1, no. 1, pp. 50-63, 2013.
[6.20] T. Murata, “Petri Nets: Properties, Analysis and Applications, “Proceedings of the IEEE,
vol. 77, no. 4, pp. 541-580, Apr. 1989.
[6.21] L. D. Moura, and N. Bjørner. "Satisfiability modulo theories: An appetizer." In Formal
Methods: Foundations and Applications, Springer Berlin Heidelberg, 2009, pp. 23-36.
[6.22] S. U. R. Malik, S. K. Srinivasan, S. U. Khan, and L. Wang, “A Methodology for OSPF
Routing Protocol Verification,” in 12th International Conference on Scalable Computing
and Communications (ScalCom), Changzhou, China, Dec. 2012.
[6.23] A. Biere, A. Cimatti, E. Clarke, O. Strichman, and Y. Zhu, “Bounded Model Checking,”
Advances in Computers, vol. 58, 2003, pp. 117-148.
[6.24] “Amazon S3,” http://aws.amazon.com/s3/, accessed on November 14, 2014.
[6.25] A. D. Caro, and V. Iovino, “jPBC: Java pairing based cryptography,” in IEEE
Symposium on Computers and Communications (ISCC), 2011, pp. 850-855.
[6.26] L. Ibraimi, M. Asim, and M. Petkovic, Secure management of personal health records by
applying attribute-based encryption, Technical Report, University of Twente, 2009.

142
7. CONCLUSIONS AND FUTURE WORK
This dissertation proposed solutions to offer personalized services for: (a) disease risk
assessment and identification of health experts from Twitter and (b) identification of health
insurance plans according to the tailored requirements of users. Moreover, the dissertation also
proposed a methodology to implement patient-centric access control on the health data.
In Chapter 3 and Chapter 4, patient-centric methodologies that facilitate users in devising
wellness plans to keep themselves healthy were presented. The methodologies include a disease
risk assessment module and expert user identification and recommendation module. The disease
risk assessment module employs collaborative filtering to compare the profiles of the enquiring
users with the profiles of existing users. Experimental results show that the results of the proposed
disease risk assessment approach were better as compared to several approaches and classifiers,
such as CART, Naive Bayes, Bayesian Network, logistic regression, MLP, BF-tree, RF, RoF, and
SVM. The expert user recommendation module utilizes tweets data to help users interact with
health experts who frequently use Twitter. Besides doctors, the framework considered some non-
doctors, such as current or past patients of a particular disease or the family members of a patient,
who often tweet about the health related issues, as the health experts. Therefore, it is important to
distinguish between doctors and non-doctors on the basis of their tweets so that the enquiring users
can select preferred type of experts. To separate doctors from non-doctors, we employed an
approach that is based on the concept of hubs and authorities. We also aim to extend the framework
by identifying experts from the same geographical areas where the enquiring users belong. In
addition, another possible direction is to segregate the fake user profiles from the genuine profiles
on Twitter. The methodology presented in Chapter 4 proposes an influence metric to identify the
influential health experts from Twitter by considering: (a) the number of experts’ followers, (b)

143
health related tweets by the experts, (c) analysis of sentiments of followers in replies to the tweets
by the expert, and (d) the retweets of the experts’ tweets. We also conducted the scalability analysis
by increasing the number of processors and workloads and observed the effects on overall time
consumption.
In Chapter 5 a methodology to search for the personalized health insurance plans was
presented. The presented method permit users to evaluate the health insurance plans based on
multiple cost and coverage criteria. To overcome the heterogeneity issue, a standard ontology for
health insurance plans is presented. A methodology that compares one user’s requirements with
the entire list of plans of a particular plan category was proposed and an approach to rank the health
insurance plans using the MAUT was proposed. The proposed framework will further be enhanced
such that the users are offered recommendations about the popular plans in addition to those plans
retrieved as a result of user queries.
In Chapter 6, an approach to implement patient-centric access control over the PHRs in the
cloud was presented. The proposed SeSPHR method ensures the confidentiality of the health data
and also permits the owners of health records to selectively share the information for with different
groups of users. In addition, the issues of forward and backward access control were also handled
for the departing and newly joining members. The proposed method was also verified using the
HLPN, SMT-Lib, and Z3 solver. Experimental results revealed that the methodologies presented
in this dissertation significantly achieved their intended outcomes. Moreover, it is expected that
methodologies presented in this dissertation will not only facilitate users in utilizing health related
recommendation services but will also increase their level of trust while using the cloud computing
services.