Embed Size (px)
Citation preview
CLR Reviewed by: Peer Reviewed by: CLR Review Coordinator
Pradeep Mitra, Surajit Goswami, Consultants, IEGHE
Luis Alvaro Sanchez, Consultant, IEGHE
Mark Sundberg Manager, IEGEC
Lourdes Pagaran, CLR Coordinator, IEGEC
CLR Review Independent Evaluation Group
1. CAS/CPS Data
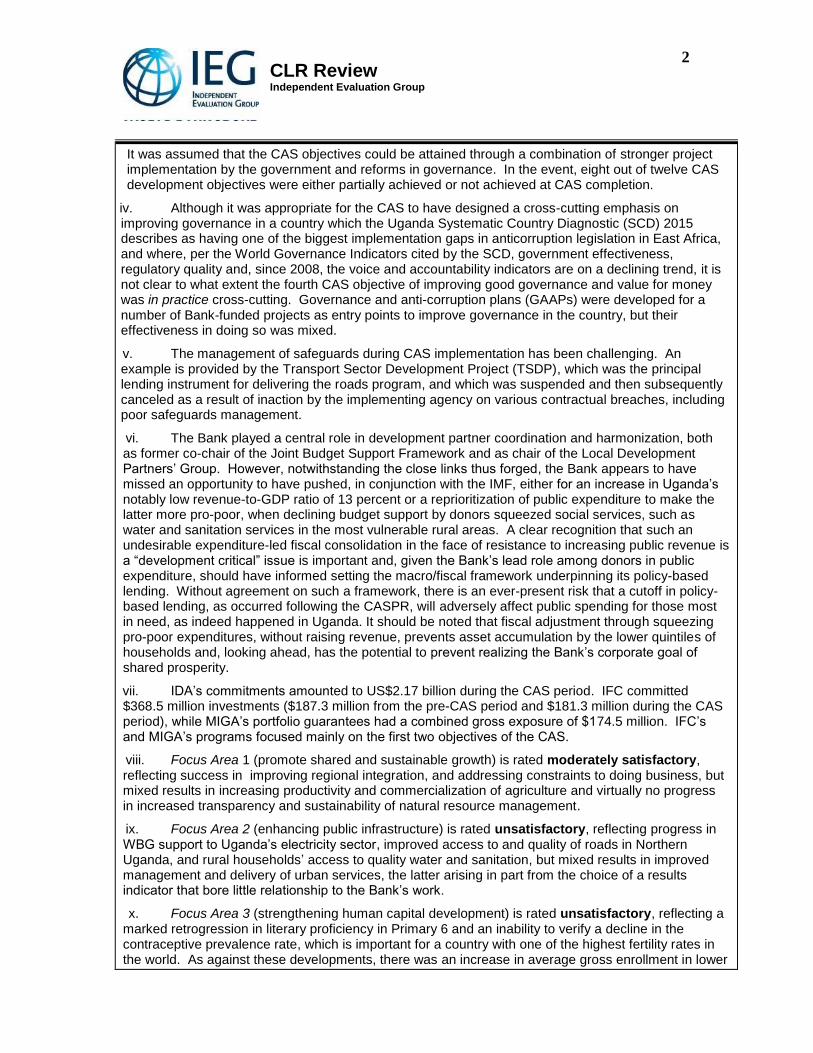
Country: Republic of Uganda
CAS/CPS Year: FY2011—FY2015 CAS/CPS Period: FY11-15
CASCR/CPSCR Review Period: FY2011—FY2015
Date of this review: April 13, 2016
2. Ratings
CLR Rating IEG Rating
Development Outcome: Moderately Unsatisfactory Moderately Unsatisfactory
WBG Performance: Fair Fair
3. Executive Summary
i. Despite maintaining an annual average growth rate of around 7 percent during 1987 to 2010,albeit starting from a low base, Uganda is a low income country with a GNI per capita of $660 in 2014,a figure lower than the average for low-income countries. Per capita GDP grew at 3.6 percent perannum during this period, reflecting a fertility rate which, at 6.2 percent per woman, is one of thehighest in the world. Headcount poverty shrank to nearly a third of its 1987 level—from 56 percent tounder 20 percent in 2013. The FY11-15 CAS, which was designed jointly by the Bank, IFC and MIGA,selectively assisted the Government in implementing its National Development Plan by focusing onfour strategic objectives: first, promoting inclusive and sustainable economic growth; second,enhancing public infrastructure; third, strengthening human capital; and a cross-cutting fourthobjective, improving good governance and value for money. The objectives of the CAS, which wasselectively aligned with Uganda’s development strategy, were relevant for a country with poorinfrastructure, weak public service delivery, low levels of human capital, and underdevelopedinstitutions.
ii. Notable successes during the period of CAS implementation included fostering deeper regionalintegration with landlocked Uganda’s neighbors by WBG support for regional projects, helping improvethe inefficient administration and poor security of the country’s land registration system. Mentionshould also be made of an encouragingly positive instance of internal WBG coordination across theBank, IFC and MIGA in the energy sector.
iii. The CAS program was based however on an optimistic reading of the country’s capacity toimplement projects and a fortiori of its ability to reach the CAS objectives. Furthermore, the indicatorschosen to assess progress towards CAS objectives in the results framework were not always chosenappropriately. Nor was the contribution of IFC’s program integrated into the results framework.Notwithstanding emerging signs of problems in the Bank’s portfolio and with less than 70 percent ofCAS outcomes on track, the opportunity provided by the CAS Progress Report to recalibrate thedesign of the program was missed. Instead, the CASPR adjusted the WBG’s instrument mix,discontinuing the DPL instrument in response to emerging governance and development challenges,and shifting new commitments towards infrastructure, notably roads and power supply and generation.
2 CLR Review Independent Evaluation Group
It was assumed that the CAS objectives could be attained through a combination of stronger project implementation by the government and reforms in governance. In the event, eight out of twelve CAS development objectives were either partially achieved or not achieved at CAS completion.
iv. Although it was appropriate for the CAS to have designed a cross-cutting emphasis onimproving governance in a country which the Uganda Systematic Country Diagnostic (SCD) 2015describes as having one of the biggest implementation gaps in anticorruption legislation in East Africa,and where, per the World Governance Indicators cited by the SCD, government effectiveness,regulatory quality and, since 2008, the voice and accountability indicators are on a declining trend, it isnot clear to what extent the fourth CAS objective of improving good governance and value for moneywas in practice cross-cutting. Governance and anti-corruption plans (GAAPs) were developed for anumber of Bank-funded projects as entry points to improve governance in the country, but theireffectiveness in doing so was mixed.
v. The management of safeguards during CAS implementation has been challenging. Anexample is provided by the Transport Sector Development Project (TSDP), which was the principallending instrument for delivering the roads program, and which was suspended and then subsequentlycanceled as a result of inaction by the implementing agency on various contractual breaches, includingpoor safeguards management.
vi. The Bank played a central role in development partner coordination and harmonization, bothas former co-chair of the Joint Budget Support Framework and as chair of the Local DevelopmentPartners’ Group. However, notwithstanding the close links thus forged, the Bank appears to havemissed an opportunity to have pushed, in conjunction with the IMF, either for an increase in Uganda’snotably low revenue-to-GDP ratio of 13 percent or a reprioritization of public expenditure to make thelatter more pro-poor, when declining budget support by donors squeezed social services, such aswater and sanitation services in the most vulnerable rural areas. A clear recognition that such anundesirable expenditure-led fiscal consolidation in the face of resistance to increasing public revenue isa “development critical” issue is important and, given the Bank’s lead role among donors in publicexpenditure, should have informed setting the macro/fiscal framework underpinning its policy-basedlending. Without agreement on such a framework, there is an ever-present risk that a cutoff in policy-based lending, as occurred following the CASPR, will adversely affect public spending for those mostin need, as indeed happened in Uganda. It should be noted that fiscal adjustment through squeezingpro-poor expenditures, without raising revenue, prevents asset accumulation by the lower quintiles ofhouseholds and, looking ahead, has the potential to prevent realizing the Bank’s corporate goal ofshared prosperity.
vii. IDA’s commitments amounted to US$2.17 billion during the CAS period. IFC committed$368.5 million investments ($187.3 million from the pre-CAS period and $181.3 million during the CASperiod), while MIGA’s portfolio guarantees had a combined gross exposure of $174.5 million. IFC’sand MIGA’s programs focused mainly on the first two objectives of the CAS.
viii. Focus Area 1 (promote shared and sustainable growth) is rated moderately satisfactory,reflecting success in improving regional integration, and addressing constraints to doing business, butmixed results in increasing productivity and commercialization of agriculture and virtually no progressin increased transparency and sustainability of natural resource management.
ix. Focus Area 2 (enhancing public infrastructure) is rated unsatisfactory, reflecting progress inWBG support to Uganda’s electricity sector, improved access to and quality of roads in NorthernUganda, and rural households’ access to quality water and sanitation, but mixed results in improvedmanagement and delivery of urban services, the latter arising in part from the choice of a resultsindicator that bore little relationship to the Bank’s work.
x. Focus Area 3 (strengthening human capital development) is rated unsatisfactory, reflecting amarked retrogression in literary proficiency in Primary 6 and an inability to verify a decline in thecontraceptive prevalence rate, which is important for a country with one of the highest fertility rates inthe world. As against these developments, there was an increase in average gross enrollment in lower
3 CLR Review Independent Evaluation Group
secondary education and the number of health care deliveries in government and other health care facilities surpassed targets.
xi. Focus Area 4 (improve good governance and value for money) is rated moderatelyunsatisfactory. There was improvement in transparency and efficiency of public financialmanagement and public procurement as well as strengthened public sector managementaccountability at national and local levels. However, this focus on governance was intended to becross-cutting. Governance and anti-corruption plans (GAAPs) were developed for a number of Bank-funded projects as entry points to improve governance in the country but their effectiveness in doing sowas mixed.
xii. IEG finds that the results framework was not invariably helpful in tracking progress towardsCAS objectives. First, a notable omission is the imperfect integration of IFC’s and MIGA’s programsunder focus areas 1 and 2 into the results framework, an omission which, unless recognized, runs therisk of underestimating the achievement of the corresponding CAS objective. Second, in certaincases, the use of inappropriately chosen indicators led either to the WBG’s interventions not beingadequately captured or to a CAS objective not being accomplished even if the indicator used tomeasure it is met. Third, there are instances of objectives that did not have indicators where WBG’scontribution could be verified with the instruments available at CAS completion.
xiii. IEG is in broad agreement with the lessons drawn by the CLR from the experience of CASimplementation. They are: (1) the need for a focused results framework with specific, measurable,assignable, realistic and time-related indicators, (2) alignment of CPF objectives and indicators with theNDPII, (3) realism in project design and adequate time for project preparation, (4) a strong emphasison portfolio management, and (5) WBG leadership in development partner coordination and dialoguewith the government. However, IEG would add three other lessons. First, the CAS progress reportshould be seen as an important opportunity to realistically assess CAS implementation, taking intoaccount all the available evidence, and to redesign the program if so warranted by that assessment.Second, the CAS results framework should integrate IFC’s and MIGA’s programs more fully and selectindicators that allow the links between WBG interventions and progress towards CAS objectives to beclearly seen. Third, in the event of a resumption of policy-based lending, the Bank should assess thepro-poor nature of public expenditure carefully and ensure that the macro/fiscal framework that itsupports includes measures to raise Uganda’s low revenue-to-GDP ratio and does not penalize pro-poor spending.
4. Strategic Focus
Overview of CAS/CPS Relevance:
Relevance of the WBG Strategy:
1. Congruence with Country Context and Country Program. Despite maintaining an annualaverage growth rate of around 7 percent during 1987 to 2010, albeit starting from a low base, Ugandais a low income country with a GNI per capita of $660 in 2014. Per capita GDP grew at 3.6 percentper annum during this period, reflecting a fertility rate which, at 6.2 percent per woman, is one of thehighest in the world. Headcount poverty shrank to a third of its 1993 level—from 56 percent to under20 percent in 2013. While much of the poverty reduction occurred due to rising agricultural incomes,this was on account of good weather and favorable crop prices rather than increasing productivity,which renders it susceptible to shocks. Thus, vulnerability is high, as the poor and the vulnerable havelimited recourse to social safety nets or access to finance. Uganda's high fertility rate threatens toworsen the capacity of the labor market to absorb the growing number of young entrants intoremunerative self-employment or higher-paying jobs. The country faces major challenges, whichinclude poor infrastructure, weak public service delivery, low levels of human capital, andunderdeveloped institutions. These features, along with a host of other constraints facing Uganda, are
4 CLR Review Independent Evaluation Group
reflected in the government’s 5-year (FY2011—2015) National Development Plan (NDP) and Vision 2040. The NDP has eight objectives: (i) increase household income and promote equity; (ii) enhance the availability and quality of gainful employment; (iii) enhance human capital development; (iv) improve the stock and quality of economic infrastructure; (v) increase access to quality social services; (vi) promote science, technology, innovation and information and communications technology (ICT) toenhance competitiveness; (vi) strengthen good governance, defense and security; and (vii) promotesustainable population and use of the environment and natural resources. The NDP also addressedcross-cutting issues such as gender, governance, urbanization, decentralization, climate change andregional cooperation.
2. The FY11-15 CAS, which was prepared jointly by the Bank, IFC and MIGA, selectivelyassisted the Government in implementing the NDP by focusing on four strategic objectives: first,promoting inclusive and sustainable economic growth; second, enhancing public infrastructure; third,strengthening human capital; and fourth, a cross-cutting objective, improving good governance andvalue for money. The objectives of the CAS, being broadly aligned with Uganda’s developmentstrategy, were relevant. Emerging governance and development challenges during the period of CASimplementation led to adjustments in the WBG’s portfolio in the CASPR but no change in the strategicobjectives of the CAS.
Relevance of Design
3. The strategic objectives of the CAS sought to create an enabling environment for privatesector-led growth by improving the business environment, strengthening physical infrastructure andhuman capital and raising the functioning of public sector institutions and their capacity for servicedelivery. Meeting Uganda’s development challenges required that the WBG program proceed along abroad front. While the areas of engagement as identified in the design of the CAS were appropriate,the inadequate implementation of most Bank interventions, which is reflected in eight of the twelveobjectives of the CAS being either partially achieved or not achieved, suggests that CAS design wasgenerally based on an overly optimistic reading of Uganda’s institutional capacity to meet theobjectives of the program. Nor, with fewer than 70 percent of CAS outcomes on track and with anincreasing proportion of projects and commitments at risk, was the opportunity provided by theCASPR used to recalibrate the design of the program and tighten its implementation. The CASPRargued instead that a discontinuance of the DPL instrument that had been in use since 2001, and ashift towards infrastructure investments, notably roads and power supply and generation, together withgovernance reforms and improved project implementation by the government, would put the programback on track. In the event, these assumptions did not hold at CAS completion. There was anincrease in the number of problem projects and in projects at risk and commitments at risk during theCAS period. A disconnect had opened up between inadequate progress towards meeting CASobjectives and the optimism in DO or IP ratings of individual projects In summary, the design of boththe CAS and CASPR was overly ambitious in relation to implementation capacity.
4. The emphasis of IFC’s program was on Focus Areas 1 and 2 and led to advances in the easeof doing business through support for extending the reach of financial institutions to Small and MediumSized Enterprises. IFC also supported projects in roads, railways and hydropower, in particular theBujagali Hydropower plant, the Umeme electricity distribution company serving the Kampala area andfinanced the Rift Valley Railways to rehabilitate the Kenya-Uganda railway. MIGA's program was alsooriented towards Focus Areas 1 and 2 through support for the energy sector as well as foreign directinvestment in agribusiness, and manufacturing.
Selectivity
5. Overall CAS design incorporated some of the lessons learned from the 2010 CASCR, includingthe desirability of focusing on fewer outcomes, which resulted in a condensed results framework with12 outcomes and 21 indicators. The previous CAS results framework had included 40 outcomes and56 indicators. Moreover, the bulk of the program carried forward an agenda that had been underimplementation for some time and where Uganda had pioneered several initiatives. Indeed, meeting
5 CLR Review Independent Evaluation Group
Uganda’s development challenges, which included poor infrastructure, weak public service delivery, low levels of human capital, and underdeveloped institutions required the WBG’s program to proceed along a broad front. Thus, the number of objectives does not appear to have been excessive.
Alignment
6. The CAS program has an objective of promoting shared and sustainable economic growth,which sought, inter alia, to boost the incomes of agricultural households, where many of Uganda’spoor live, through job creation. In order to facilitate asset accumulation by the poor, other strategicCAS objectives targeted non-income dimensions of deprivation through strengthening human capitaland providing access to quality water and sanitation. Shared prosperity had not been adopted as acorporate goal when the CAS was written and the focus in the Uganda program appeared to havebeen on inclusive growth. The Systematic Country Diagnostic 2015 reports that, during the 20-yearperiod 1993—2013, consumption growth of the bottom 40 percent, who were mainly from the conflict-ravaged northern region of the country, was 3 percent per annum, which was lower than that of the top60 percent.
5. Development Outcome
Overview of Achievement by Objective:
Focus Area I: Promote Shared and Sustainable Economic Growth
Objective 1 Address constraints for doing business
7. The government began to address the inefficient administration and poor security of thecountry's land registration system, while also updating and strengthening the policy and regulatoryframework for land management and administration. The indicator--time taken to register property (landand buildings)— is reported in the CLR as having been reduced from 77 days to 34 days against atarget of 30 days. IEG was unable to verify these numbers. Figures drawn from the ISR assessment ofthe Competitiveness and Enterprise Development project indicate that the figure was 42 days inNovember 2015, which is a few months after CAS completion. Furthermore, this figure is broadlyconsistent with that reported in Doing Business. However, this is but one aspect of addressingconstraints to business. When account is taken of IFC’s program, which resulted in the establishment ofan e-licensing registry as the definitive repository of all licenses in Uganda that reduced the time andfees associated with obtaining a license and also introduced online filing for taxpayers, including SMEs,the objective is considered mostly achieved.
8. Bank support to this objective was provided through PRSC9 and the Competitiveness andEnterprise Development Project (CEDP), while IFC support was provided through the InvestmentClimate Reform Program and Investment/advisory services to banks to expand lending to small andmedium enterprises.1 Non-lending took the form of the ICT Policy Dialogue, PPP and Capital Marketsand Public Investment Management TA.
Objective 2 Improved connectivity for regional integration
9. The WBG supported the Government's construction of one-stop border posts between Ugandaand Kenya and Uganda and Rwanda. The indicator--transit time through the Northern corridor fromMombasa to Kigali--was reduced from 19 days to 6 days against a target of 13 days. IEG agrees withthe CLR that this achievement is commendable, since the implementation of regional agreements,
1 IFC’s Uganda Primary Mortgage Market Initiative indicated in the CLR was completed in FY10, before the review period began
6 CLR Review Independent Evaluation Group
involving a larger number of stakeholders is more challenging, while noting that this was made possible by the supranational umbrella provided by the East African Community.
10. Bank support was provided through the East Africa Trade and Transport Facility and theTransport Sector Development project. IFC/MIGA's support took the form of investment/guarantee forthe Kenya-Uganda Railway, which is a vital trade link from the coast of Kenya into Uganda and theEASSy cable project for ICT backbone. Non-lending support was provided through a Bank report on"Regional Integration, Trade and Growth in the Great Lakes Region of Africa". The WBG packagealleviated the burden of Uganda being landlocked and the objective is considered achieved.
Objective 3 Increased productivity and commercialization of agriculture:
11. Uganda's agricultural sector was supported through the Bank's Agricultural Technology andAdvisory Services project (ATAAS), the Northern Uganda Social Action Fund (NUSAFII), the EABPP,the Program for Control of Avian Flu and the EMCBP-SILII, LVEMP and the Water Management andDevelopment Project, as well as non-lending products, viz., reports on Inclusive Growth, and onOperationalizing Agriculture and IFC/MIGA's Investments/Guarantee for agribusiness, together withIFC's advisory services. The ATAAS project, however, faced substantial difficulties duringimplementation, including changes in government policy, which prevented the National AgriculturalAdvisory Services (NAADS), from providing advice and disseminating improved technologies tofarmers. One of the two indicators-- the percentage increase in agricultural real income of ruralhouseholds--turned out to be 33 percent, against an original target of 20 percent which the CLRconsiders achieved. However, IEG considers this to be partially achieved due to the considerabledifficulty of measuring income with accuracy, particularly in a weak data and information collectionenvironment. Indeed a restructuring of the project caused both the original baseline and the target tobe revised downwards. A second indicator--an increase in the share of farm production marketed byNAADS targeted beneficiaries from 25 percent to 50 percent-- could not be evaluated due tocancellation of the relevant component of the project, and is thus considered not achieved. IEG doesnot find plausible the observation in the CLR that increases in crop yields are a substitute for theoriginal indicator. Based on the fact, noted in the Systematic Country Diagnostic, that agriculturalincomes have risen on account of good weather and favorable crop prices, rather than increasingproductivity, the objective of increased commercialization and productivity of agriculture is consideredpartially achieved.
Objective 4 Increased transparency and sustainability of natural resource management
12. Bank support for this objective was provided through the Sustainable Management CountryProgram (SLMCP), the Water Management and Development project (WMDP), SustainableManagement of the Mineral Resources Project (SMMRP) and LVEMP, as well as through non-lending,viz., a report on Environment and Climate Change Analysis. The indicator, which was the proportion ofland in the Katonga basin that was brought under improved land use management, and for which thetarget was 50 percent starting from a baseline of zero, could not be verified. Furthermore, thediscussion in the CLR encourages the impression that the objective was not achieved. The inability todetermine what progress was made in increasing transparency and sustainability of natural resourcemanagement is unfortunate in view of the emphasis in the Systematic Country Diagnostic 2015 on theimportance of sustainable land and water management for continued poverty reduction in Uganda.
13. IEG rates focus area I as Moderately Satisfactory.
7 CLR Review Independent Evaluation Group
Focus Area II: Enhance Public Infrastructure
Objective 5 Increased Access to Electricity
14. Overall access to electricity in Uganda is 14 percent, well below the average access rate of 24percent for countries in Sub-Saharan Africa. It is estimated that the Bank's OBA project (grid basedconnections only) and ERT-2 project (both grid and off-grid connections) provided connections to397,015 rural individuals, which represents 75 percent of the target set for increased connections, wasthus partially achieved. It is worth noting that the indicator refers to the number of connections andmakes no reference to the quality of the service provided. A second indicator, which related to the flowof electricity through the Masaka substation, and which had been introduced into the results frameworkat CASPR to replace an indicator on unmet demand, was not realized on account of the Kawanda-Masaka transmission line not being completed during the CAS period, was thus not achieved.
15. WBG support to Uganda's power infrastructure through the Bujagali hydropower plant (BHPP),combining an IDA partial risk guarantee, an IFC loan and a MIGA guarantee is highlighted as anexample of commendable internal coordination within WBG. In addition, the electricity distributioncompany Umeme, supplying over 600,000 customers in the Kampala area, was supported by IFCequity and loans, as well as a MIGA guarantee.
16. The objective of increased access to electricity is partially achieved.
Objective 6 Improved access to and quality of roads in project areas in Northern Uganda
17. WBG support to the target beneficiaries was delivered through the Transport SectorDevelopment project (TSDP), which was subsequently canceled on account of challenges in meetingsafeguards standards. The number of people with access to an all season road in the Gulu and WestNile districts increased from a baseline of 3,520,000 to 4,234,744 against a target outcome indicator of4,950,000 (but this number according to the CLR maybe an overestimate) and the indicator was thuspartially achieved. Another indicator of reducing travel time on the Gulu-Nimule and Vurra-Oruba roadsfrom 2 hours to 1.5 hours was achieved.
18. In view of cancellation of the TSDP, the principal lending instrument for delivering the roadsprogram, owing to inaction by the implementing agency on various contractual breaches, including poorsafeguards management, this objective is rated partially achieved.
8 CLR Review Independent Evaluation Group
Objective 7 Increased access to quality water and sanitation services
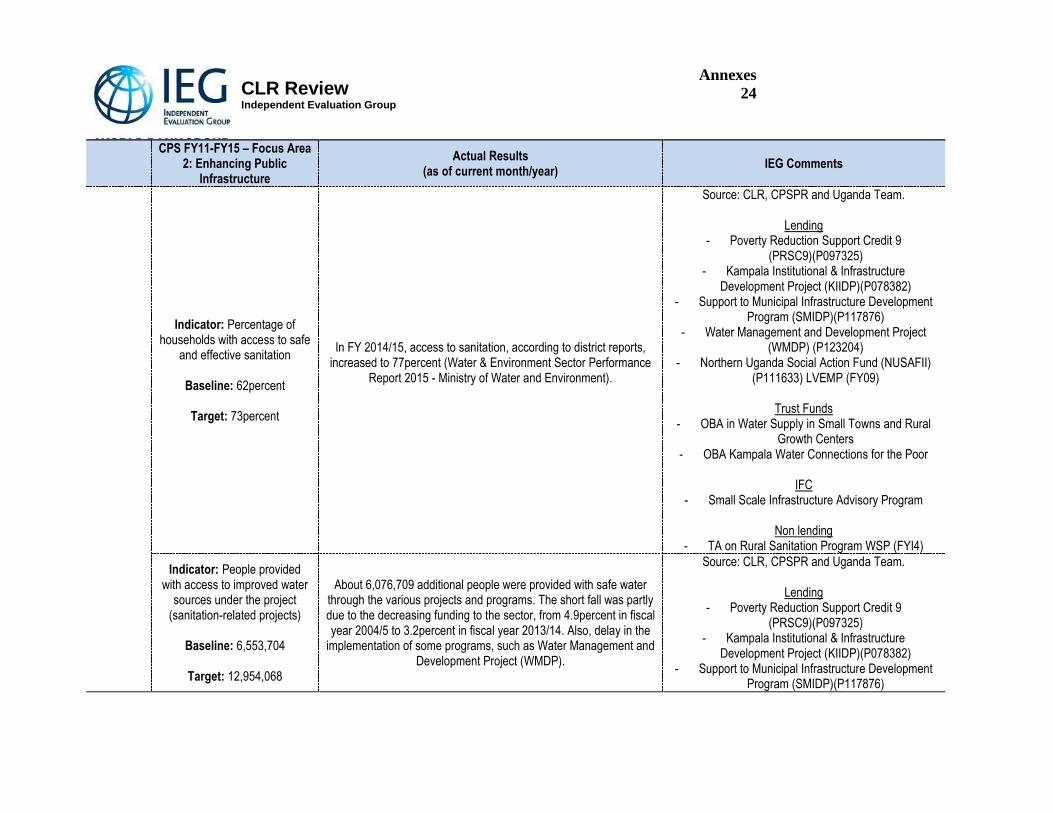
19. The proportion of rural households with access to safe and effective sanitation increased from abaseline of 62 percent to 77 percent, compared to an outcome indicator target of 73 percent. Thus IEGrates this indicator as achieved. Bank support was provided by PRSC9, the Kampala Institutional andInfrastructure Development Project (KIIDP), Support to Municipal Infrastructure Development Program(SMIDP), Water Management and Development Project (WMDP), the Northern Uganda Social Action
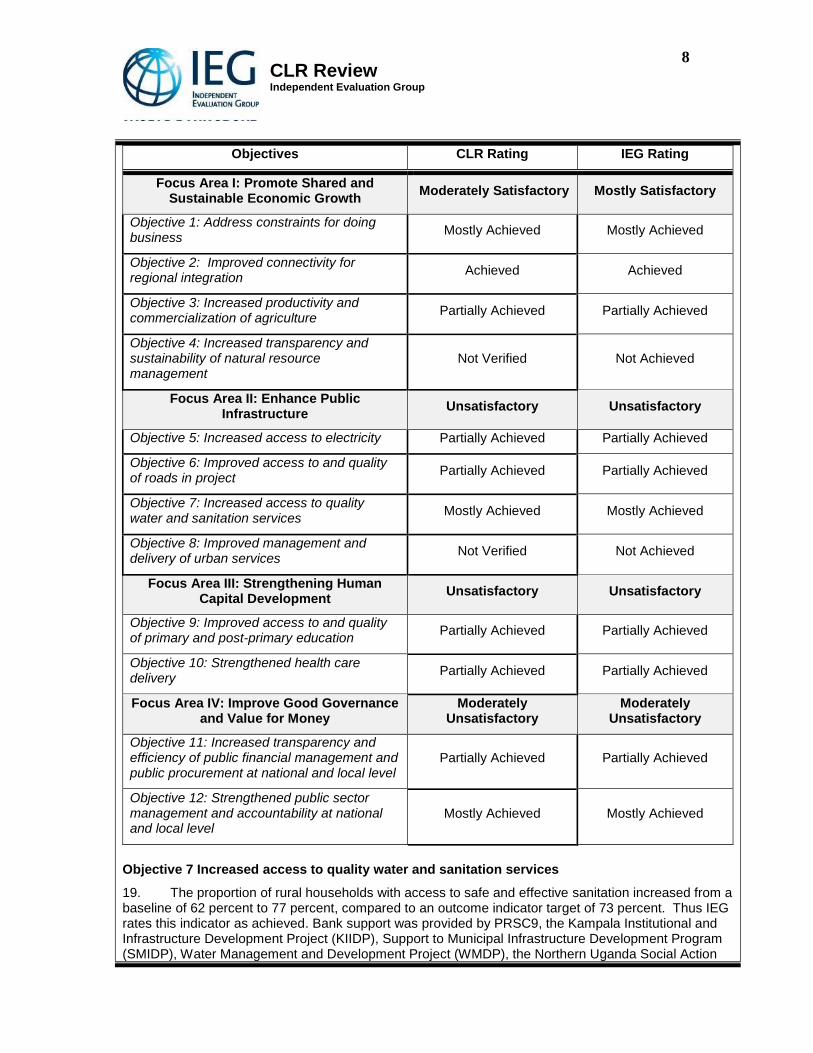
Objectives CLR Rating IEG Rating
Focus Area I: Promote Shared and Sustainable Economic Growth
Moderately Satisfactory Mostly Satisfactory
Objective 1: Address constraints for doing business
Mostly Achieved Mostly Achieved
Objective 2: Improved connectivity for regional integration
Achieved Achieved
Objective 3: Increased productivity and commercialization of agriculture
Partially Achieved Partially Achieved
Objective 4: Increased transparency and sustainability of natural resource management
Not Verified Not Achieved
Focus Area II: Enhance Public Infrastructure
Unsatisfactory Unsatisfactory
Objective 5: Increased access to electricity Partially Achieved Partially Achieved
Objective 6: Improved access to and quality of roads in project
Partially Achieved Partially Achieved
Objective 7: Increased access to quality water and sanitation services
Mostly Achieved Mostly Achieved
Objective 8: Improved management and delivery of urban services
Not Verified Not Achieved
Focus Area III: Strengthening Human Capital Development
Unsatisfactory Unsatisfactory
Objective 9: Improved access to and quality of primary and post-primary education
Partially Achieved Partially Achieved
Objective 10: Strengthened health care delivery
Partially Achieved Partially Achieved
Focus Area IV: Improve Good Governance and Value for Money
Moderately Unsatisfactory
Moderately Unsatisfactory
Objective 11: Increased transparency and efficiency of public financial management and public procurement at national and local level
Partially Achieved Partially Achieved
Objective 12: Strengthened public sector management and accountability at national and local level
Mostly Achieved Mostly Achieved
9 CLR Review Independent Evaluation Group
Fund (NUSAFII) and LVEMP. IFC support was provided through the Small Scale Infrastructure Advisory Program and TA on the Rural Sanitation Program WSP. A second indicator of providing an additional 6,076,709 people with safe water through sanitation-related projects was mostly achieved, with the shortfall caused in part by underfunding of the sector but also on account of delays in implementation of some programs, such as the WMDP. This objective is rated mostly achieved.
Objective 8 Improved management and delivery of urban services
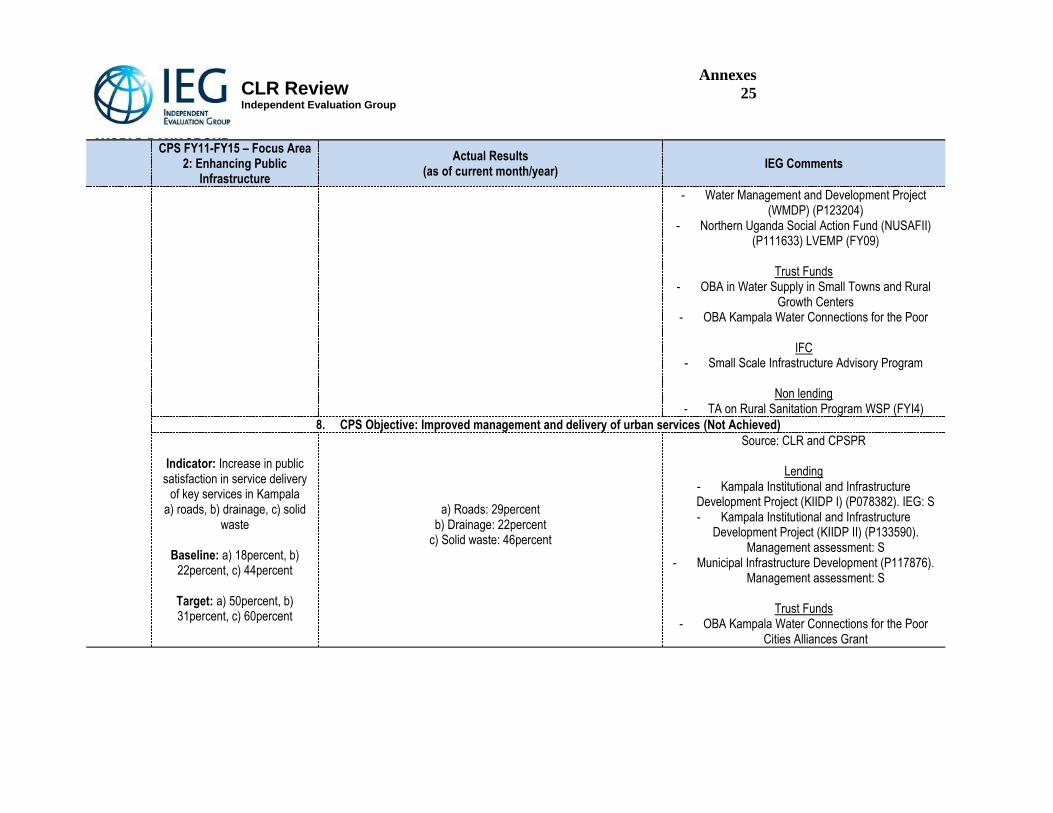
20. WBG support to this objective was provided through the Kampala Institutional andInfrastructure Development Projects (KIIDP I and II) and the Uganda Support to Municipal InfrastructureDevelopment Program (USMID). None of the indicators, which related to increased public satisfactionwith the delivery of services in roads (29 percent), drainage (22 percent) and solid waste (46 percent)was met and the objective was not achieved. The CLR explains that the levels of satisfaction measuredby the citizen report card surveys covered overall services in Kampala, and not just KIIDP 1, which onlymarginally contributed to results. The objective was not achieved but this is in part on account of aflawed results framework, where the link between the WBG intervention and the indicator is tenuous.
21. IEG rates focus area II as Unsatisfactory.
Focus Area III: Strengthening Human Capital Development.
Objective 9 Improved access to and quality of primary and post-primary education
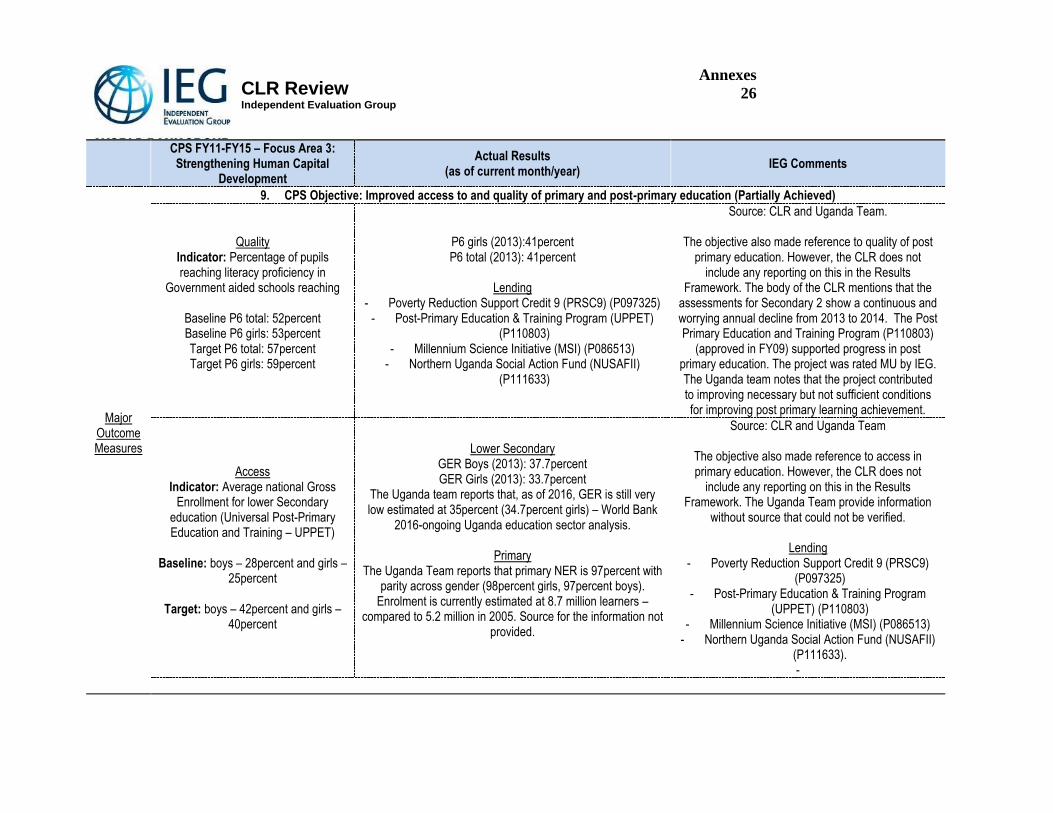
22. Although this is not reported in the results framework, primary school enrolment in Uganda hasincreased significantly and gender parity has been achieved in primary education. IDA supported theobjective of pupils reaching literary proficiency in Government aided schools through PRSC9, the Post-Primary Education and Training Program (UPPET), the Millennium Science Initiative (MSI) and theNorthern Uganda Social Action Fund (NUSAFII). Literary proficiency for boys and girls in Primary 6declined from 52 percent for boys and 53 percent for girls respectively in 2010 to 41 percent for both in2013, against a target of 57 percent for boys and 59 percent for girls. While no assessment for Primary6 learners was conducted in 2014 due to lack of funding, the CLR notes that the assessments forSecondary 2 show an annual decline from 2013 to 2014. The literary proficiency targets for P6 weretherefore missed by a long way. Furthermore, the CLR mentions that the school system remains largelyinefficient with high dropout rates and low levels of completion. A second indicator of average grossenrollment for lower secondary education for boys and girls increased from a baseline of 28 percentand 25 percent respectively in 2010 to 37.7 percent and 33.7 percent for boys and girls respectively in2013, against targets of 42 percent and 40 percent respectively, with updated figures for 2014 awaited.Thus, the target was partially achieved. This objective is rated a barely borderline partially achieved onaccount of the decline in literary proficiency when, per the results indicator, positive improvement hadbeen expected.
Objective 10 Strengthened health care delivery
23. Support for strengthening Uganda's capacity for health care delivery was provided by theUganda Health Systems Strengthening Project and OBA Reproductive Health Program Pilot in WesternUganda (and the East Africa Public Health Laboratory Networking Project--a regional project)Deliveries taking place in Government and PNFP Health Facilities increased from 34 percent in 2010--11 to 52.7 percent in 2014--15 against a target of 45 percent which was thus achieved Achievementagainst a second target of increasing the contraceptive prevalence rate from a baseline of 24 percent to35 percent could not be verified, pending availability of DHS 2016, but it is noted that the CPR was 30percent in 2011, as reported in the DHS. Thus this outcome indicator is rated as not achieved. Theobjective is rated partially achieved.
24. IEG rates focus area III as Unsatisfactory.
10 CLR Review Independent Evaluation Group
Focus Area IV: Improve Good Governance and Value for Money
Objective 11 Increased transparency and efficiency of public financial management and public procurement at national and local level
25. The objective was supported by the Bank's PRSC9, the Municipal Infrastructure DevelopmentProgram (SMIDP), the Northern Uganda Social Action Fund (NUSAFII), the Kampala Infrastructure andInstitutional Development Project (KIIDP), the Health Systems Strengthening Project (HSSP), the PublicService Performance and Enhancement Project and through the provision of non-lending technicalassistance to the GAC. There was an increase in the number of local governments publishing theirfinancial transfers from a baseline of 48 percent to 100 percent against a target of 90 percent, whichwas achieved. Notwithstanding the provision of non-lending TA to the Procurement RegulatoryAuthority (PPDA), however, the number of contracts with complete procurement records in compliancewith PPDA regulations, which is a second indicator, declined from 32 percent to 17 percent over theCAS period, against a target of 70 percent and the target was not achieved by a wide margin. The CLRnotes that the PEFA rating for competition, value for money and controls in procurement was only D+ in2012, which constitutes no improvement since the 2008 PEFA survey and is one of the worstperforming dimensions in Uganda's PFM system. This objective is rated partially achieved.
Objective 12 Strengthened public sector management accountability at national and local level
26. Support for reducing the degree of discrepancy between staff paid through the payroll andactual staff, as revealed through inspections and payroll audits, was provided through the UgandaPublic Service Performance Enhancement Project. The degree of discrepancy was reduced from abaseline of 15 percent to 0, against a target of 5 percent, which was thus achieved. WBG support for asecond indicator --the percentage of the population satisfied with performance of local governments--was provided by the Local Government Management Services Delivery project, the Local GovernmentServices Delivery II project, the Uganda Public Services Performance Enhancement project and PRSCs7, 8 & 9. The percentage of population satisfied was targeted for an increase from a baseline of 46percent to 70 percent. However, the National Service Delivery Survey 2012, which was going to beused to measure satisfaction, was not conducted due to lack of funding. An adequate response to thisindicator is expected to become available after the production of the final report of the National ServiceDelivery Survey 2015. This indicator is rated not achieved. A third indicator of 10 value for moneyaudits prepared per annum by the Auditor General and discussed in Parliament against a baseline of 6per annum, which had been introduced by the CASPR into the results matrix, was met in audit year2015. WBG support was provided through PRSC9, the Financial Sector Development Policy Credit andthe Uganda Public Service Performance Enhancement project. This indicator was achieved. Thisobjective is rated mostly achieved.
27. It was appropriate for the CAS to have designed a cross-cutting emphasis on improvinggovernance as its fourth focus area in a country which the Uganda Systematic Country Diagnostic 2015describes as having one of the biggest implementation gaps in anticorruption legislation in East Africaand which assesses the country’s capacity to control corruption as having reached an all-time lowFurthermore, according to the World Governance Indicators cited by the SCD, governmenteffectiveness and regulatory quality are on a declining trend and the voice and accountabilityenvironment, which had improved between 2003 and 2008, has also deteriorated. However, it is notclear to what extent focus area IV in the CAS of improving good governance and value for money wasin practice cross-cutting. In elaborating on the CLR, the team has asserted that governance and anti-corruption plans (GAAPs) developed for six Bank-funded projects as entry points to improvegovernance in the country were having a positive impact on the overall implementation of Bankprojects. IEG notes however that the positive impact claimed on project implementation was mixed.Thus, notwithstanding the development of a Governance and Anti-Corruption (GAC) diagnostic for thetransport sector and the development of a GAC action plan for the Transport Sector DevelopmentProject (TSDP), the project was suspended and subsequently canceled.
11 CLR Review Independent Evaluation Group
28. IEG rates this focus area IV of a cross-cutting focus on improving governance and value formoney as Moderately Unsatisfactory.
Overall Assessment and Rating
29. IEG rates the overall outcome under the Uganda CAS as Moderately Unsatisfactory. Eight outof the twelve objectives under the program were partially achieved or not achieved. It is true that, in anumber of areas, the results framework obscured the links between WBG interventions, outcomeindicators and progress towards CAS objectives. Even allowing for that, however, the objectives of theprogram were too ambitious in relation to the government's capacity for implementation. This wasalready clear at the time when the CASPR assessed implementation of the country strategy, whenfewer than 70 percent of CAS outcome indicators were on track. However, the progress report arguedthat a discontinuance of DPLs and a shift towards larger, transformative operations, which took the formof infrastructure investments, viz., roads and power supply and generation, together with governancereforms and stronger project implementation by the government, would suffice to achieve the CASoutcomes. The CLR mentions that, for its own part, the Bank could have facilitated implementation byfollowing up expeditiously on issues arising in country portfolio performance reviews. In the event,government effectiveness, regulatory quality and, since 2008, the voice and accountability environmenthave been on a declining trend and the Uganda Systematic Country Diagnostic observes that thecapacity to control corruption appears to have reached an all-time low Nor did the CASPR reorient theresults framework to ensure that the links between interventions, indicators and progress towards CASoutcomes were made clearer. Finally, while governance and anti-corruption plans were developed for anumber of Bank-funded projects as entry points to improve governance in the country in an effort tomake focus area 4 on good governance and value for money genuinely cross-cutting, theireffectiveness in doing so was mixed.
6. WBG Performance
Lending and investments
30. As of end-January 2010, Uganda had sixteen IDA-financed operations with a net commitmentamount of US$1.3 billion. In addition, there were five regional projects and an IDA guarantee ofUS$115 million for the Private Power Generation (Bujagali) project. About 68 percent of commitmentswere allocated to energy, mining, environment, urban development and transport. About 22 percentwere allocated to education and social development, 8 percent to finance and public sectordevelopment and 1 percent to economic and public sector management. There were 48 trust funds,most of which were linked to lending operations, that provided nearly US$65 million. They focusedmainly on environment (GEF), renewable energy (GEF), demobilization and reintegration of ex-combatants (MDTF), avian influenza, sanitation and hygiene (WSP), monitoring and evaluation (IDF),and piloting output-based aid in health and water supply (GPOBA).
31. During the CAS period, IDA made commitments totaling $2.17 billion for 19 operations,including two regional projects. There were 48 Trust Fund activities amounting to [$256] million thatwere active during FY11—15 (with 31 TF activities approved during FY11—15 amounting to $213million).
32. On average, resources committed by IDA for investment operations were disbursed at a slowerrate in Uganda (17 percent) than for the Africa region (21 percent) and Bank wide (22 percent).
33. The Uganda portfolio was somewhat riskier than the Africa region and Bank wide portfolios.During FY11--15, the Uganda portfolio had 23 percent of projects at risk compared to 21 percent for theAfrica region and 20percent Bank-wide. On a commitment basis, the Uganda portfolio had 30 percentof commitments at risk, compared to 27 percent for the Africa region and 19 percent Bank-wide. IEG
12 CLR Review Independent Evaluation Group
reviewed the ICRs of 15 projects that exited the portfolio during FY11--15 and rated the development outcomes of 11 of them as moderately satisfactory or above.
34. There were eight IFC investment projects, with US$187.3 million of net commitment, at theinception of the review period that were active during the review period (see Annex Table 9). More than80 percent of this portfolio was to support two projects towards electricity generation and distribution.During the review period, IFC committed through 13 investments another US$181.3 million, of whichabout half went towards electricity distribution. The CLR made no comments on the IFC portfolio. Of the21 investments in the portfolio, two (both in the health sector) were cancelled, and three have closed.IEG has not reviewed any of these projects. The 16 active projects are being implemented asenvisaged.
35. MIGA provided coverage that supported six investments for US$174.5 million, 97 percent ofwhich were for four projects towards electricity generation and distribution (see Annex Table 12).
Analytic and Advisory Activities and Services
36. A program of analytic and advisory work and advisory activities and services, including 26pieces of Economic and Sector Work (ESW) and 25 Technical Assistance (TA) tasks was deliveredduring the FY11--FY15 period. The ESW program included, among others, studies on RegionalIntegration and Trade, Inclusive Growth, Demography and Growth, a public expenditure review onRoads, an Environment and Growth review, a study on Environmental Sanitation, and an FSAP update.The CLR mentions that the Inclusive Growth study informed the formulation of the Agriculture DSIP andthe design and preparation of pipeline operations, and that the PER on roads made recommendationson design, land take, procurement and monitoring and evaluation in relation to national roads, toimprove value for money and absorption capacity. Other than this, the listing of non-lending bystrategic CAS objective in the column on Bank program instruments in Annex 1 on the CPS resultsmatrix evaluation does not provide enough information to assess to what extent this instrumentinformed lending operations. Nor does the CLR describe what was done to disseminate economic andsector work.
37. IFC had four advisory service (AS) projects approved before the review period for US$1.9million, which were implemented during the review period (see Annex Table 10). During the reviewperiod, IFC approved nine new AS projects amounting to over US$20.0 million of total funds. Of thesethirteen projects, two were terminated, five have closed, and six are active. Four of the five closedprojects were rated Mostly Successful or better at completion but IEG has not validated them as yet. Ofthe six active projects, five are being implemented as envisaged. Only the Kampala – NinjaExpressway PPP is running behind schedule.
Results Framework
38. The Results Framework of the FY11--FY15 CAS was adjusted in the CAS Progress Report.The CASPR mentions that this was done in order to avoid attribution problems and to better captureoutcomes of CAS interventions. It is the adjusted framework that is used by the CLR to assessprogress against the program's objectives. IEG has three observations on the results framework (RF).First, the RF does not integrate IFC’s and MIGA’s programs adequately. This can potentially influencethe assessment of progress towards CAS objectives. For example, addressing inefficiencies in landregistration, although important in a poor, agrarian economy, is part of the business environmentnarrative and would not merit a rating of “mostly achieved” for addressing constraints to doing business,unless IFC’s work on simplification of licensing and online filing for taxpayers, including small andmedium enterprises is also taken into account. A similar observation could be made about increasingaccess to electricity. The omission of IFC/MIGA programs can also lead to other kinds of problems,such as losing sight of important issues that require monitoring. This is exemplified by the need tomonitor tariff increases to ensure the financial health of Umeme, which is an IFC-and MIGA-supported
13 CLR Review Independent Evaluation Group
electricity distribution company in the Kampala area. Second, there are instances where the RF has indicators that marginalize the effect of the Bank’s interventions. As an example, the indicator used to assess progress towards the CAS objective of improving management and delivery of urban services calls for measuring satisfaction with service delivery in Kampala using citizen report card surveys. However, the report cards covered overall Kampala services, and not just those from the Bank’s Kampala Institutional and Infrastructure Development project (KIIDP 1), which contributed only marginally to the results. Third, there are instances where progress towards CAS objectives could not be assessed because indicators that had been chosen in the RF could not be verified at CAS completion. An example of this problem is provided by the inability to verify progress towards increasing transparency and sustainability of natural resource management, an area that the Systematic Country Diagnostic 2015 emphasizes as being important for continued poverty reduction in Uganda.
Partnerships and Development Partner Coordination
39. The main development partners in Uganda are USAID, the European Union, the UnitedKingdom, the African Development Union and Japan. The Bank has traditionally played a central rolein development partner coordination and harmonization, both as permanent co-chair of the former JointBudget Support Framework (JBSF) which included the twelve budget support development partnersand as chair of the Local Development Partners' Group (LDPG). The CLR notes that the Bank led theprocess that culminated in a new and broader framework for the partnership dialogue, involving alldevelopment partners, which will henceforth serve as a joint platform for high-level dialogue ondevelopment effectiveness.
Safeguards and Fiduciary Issues
40. The Transport Sector Development Project (TSDP) was suspended and then subsequentlycancelled as a result of inaction by the implementing agency to various contractual breaches, includingpoor safeguards management, by the contractor. On December 19, 2014, the Inspection Panel (IP)received from community members of Bigodi Township, a Request for Inspection in relation to theKamwenge to Fort Portal road financed under the TSDP Additional Finance. The Panel did notregister the Request in order to provide Bank Management with an opportunity to address theirconcerns. In September 2015, the IP received another Request for Inspection and subsequentlyregistered the case, thereafter suspending and cancelling the project. The CLR reports that “lessonsfrom the TSDP have informed a comprehensive review of safeguards management across the entireportfolio, with the aim of enhancing monitoring of safeguards management.”
41. Overall compliance with the Environmental Assessment safeguard was uneven. It wassatisfactory in Energy and Mining, Agriculture, and Education sectors, which engaged full timeenvironmental specialists during implementation. However, compliance with the EnvironmentalAssessment was not satisfactory or was unclear for projects in the Finance and Markets, Public SectorGovernance, and Urban Development sectors, reflecting issues related to low capacity of implementingagencies or lack of information in ICRs to validate full compliance. For example, under the PrivateSector Competitiveness II project, the limited capacity of the implementing agency in charge ofenvironmental and social safeguards issues for the industrial park resulted in significant delays leadingto the cancelling of the corresponding sub-component. Compliance with social safeguards, especiallywith Involuntary Resettlement, also reflected similar issues on low capacity of implementing agenciesand lack of information for validation. Reporting under the Third Phase of the Road DevelopmentProgram on the implementation progress of Resettlement Action Plan (RAP) was a challenge. By theend of the project many complaints were still pending and were to be settled under injurious affection.According to the ICR, the “implementing agency did not handle, in a timely manner, cases of delayedcompensation of project-affected persons, leading to delayed site handover, which resulted in delays in
14 CLR Review Independent Evaluation Group
completion of the civil works contracts.” Projects in the Energy and Mining and Urban Development sectors also triggered safeguards on Cultural Property and Natural Habitats, but the ICRs didn’t provide any evidence to validate full compliance.
42. During the FY11 to FY 15 Review Period, INT received seventy-five complaints related to Bankoperations. Of these seventy-five complaints, twenty-one resulted in INT investigations, of which threeare still open - two of those are in Regional Operations. Of the closed investigations (18), nine weresubstantiated and the remainder (nine) could either not be substantiated to a point that a sanction couldbe initiated or were confirmed as unfounded (3).
Ownership and Flexibility
43. The program described in the CAS and The CASPR was broadly aligned with the NationalDevelopment Plan (NDP) and Vision 2040. However, drawing on a joint European Union-IEGevaluation of budget support to Uganda, the CLR notes that the overall relevance of objectives wasgradually reduced by diverging priorities, as well as missed opportunities in several major policy areas,such as increasing revenue mobilization, controlling population growth, strengthening the revenue baseand capacity of local governments, reducing gender inequities and prioritizing agriculture. In responseto emerging concerns about governance and corruption, the Bank's program was adjusted in theCASPR by discontinuing the DPL instrument--several development partners had already ceasedproviding budget support--and shifting towards infrastructure projects which, between CASPR and CAScompletion, came to account for 57 percent of commitments, compared to 19 percent between the CASand the CASPR.
WBG Internal Cooperation
44. A positive example of internal WBG coordination is provided by the Bujagali hydropower plant(BHPP), which is the biggest in Uganda, a country where access to electricity is low. Support to BHPPwas provided through an IDA partial risk guarantee, an IFC loan and a 20-year MIGA guarantee.Further MIGA support to the energy sector came in the form of an amended risk guarantee whichinsured additional equity investment in BHPP. IFC and MIGA also cooperated well in supportingUmeme, the electricity distribution company.
Risk Identification and Mitigation
45. The CAS had identified the following risks to CAS implementation: (I) political fragility andethnicity, (ii) oil discovery and the resource curse, (iii) high population growth; (iv) urban poor and ayouth bulge, (v) regional instability and spillovers, (vi) weather and climate risks. The overall IDAprogram was intended to be self-adjusting in order to mitigate some of the risks highlighted in the CAS.The CASPR made clear however that the major challenge lay in the area of governance, with theextent of progress in reducing patronage and corruption being unclear. Mitigation measures envisagedin the CAS included a governance matrix to map risks and regular reviews of governance risks toinform adjustments to the Bank’s program. Apart from highlighting the adjustment to the portfolioundertaken at CASPR, the CLR does not however provide any information on how regularly thesereviews were undertaken and what impact they had on mitigating risks to the Bank’s program. Withrespect to the oil sector, the institutional structures that promote transparency and accountability wereidentified as the key mitigation measures. On youth unemployment, the Bank identified collaborationwith the Youth Unemployment Network to update the National Action Plan for youth unemployment inUganda as a mitigating measure.
15 CLR Review Independent Evaluation Group
Overall Assessment and Rating
46. IEG rates WBG performance as Fair.
47. The objectives of the CAS, which sought to emphasize economic growth led by the privatesector, while providing the elements of an enabling environment in the form of improved physical andhuman capital, and strengthening “center of government” institutions as well as those entrusted withservice delivery, and underpinned by a cross-cutting emphasis on governance, were broadly wellaligned with Uganda’s NDP and Vision 2040. However, what the CAS sought to accomplish over itsfour-year lifetime reflected an optimistic reading of the country’s implementation capacity. Furthermore,the ongoing monitoring of progress towards CAS objectives was partly obscured by a results frameworkthat did not integrate IFC’s and MIGA’s contributions and that, in some cases, chose indicators thateither could not be influenced by WBG’s interventions or that did not fully capture what the CPSobjectives were trying to accomplish. Nevertheless, progress was made on a number of fronts. Theenergy and transport sectors offer encouraging examples of internal coordination within the World BankGroup. Regional projects, that are normally challenging to implement because of the multiplicity ofstakeholders across countries, surpassed their targets. WBG coordination with governmentcounterparts and other development partners was generally successful.
48. In its assessment of implementation progress to date, the CASPR noted the slower-than-expected pace of implementation, the lower-than-planned level of lending and the fact that less than 70percent of CAS outcomes were on track. It responded to emerging concerns about governancereflected inter alia in deteriorating CPIA ratings on transparency, accountability and corruption inUganda’s public sector, by discontinuing the DPL instrument in a country where it had been used since2001. While this was intended to signal that budget support would not be provided in an environmentmarred by increasing challenges to governance, including a prominent corruption scandal in 2012, thecutoff squeezed social services in the most vulnerable areas, since no agreement had been reachedwith the government that the prevailing macro/fiscal framework would call for increased revenuemobilization in order to protect pro-poor spending. Less attention appears to have been paid howeverto the fact that there was a doubling in the percentage of projects and commitments at risk between2011 and 2013 and the need for appropriate and timely follow up on WBG’s part on issues highlightedin Country Portfolio Performance Reviews. Against this background, the CASPR argued that acombination of (i) adjustments to the lending instrument mix, viz., dropping DPOs and moving towardsinfrastructure projects, (ii) improvements in project implementation by the government, together with (iii)governance reforms, would lead to achievement of the CAS outcomes. An opportunity to tighten CASimplementation and reorient the results framework to help monitor progress was therefore missed atthe time of the CASPR. In the event, the optimistic reading of implementation that underlay the CASand was reconfirmed at CASPR was not borne out and eight out of twelve CAS objectives were eitherpartially achieved or not achieved at CAS completion. The CLR notes a disconnect between the highproportion of CAS objectives rated partially achieved or not achieved and the low percentage ofprojects rated Moderately Unsatisfactory for IP or DO. Furthermore, while governance and anti-corruption plans were developed for a number of Bank-funded projects as entry points to improvegovernance in the country and to make the good governance and value for money a genuinely cross-cutting CAS objectives, their effectiveness in doing so was mixed. Finally, weak compliance withsafeguards affected project implementation and the delivery of results. The cancellation of theTransport Sector Development Project (TSDP) as a result of inaction by the implementation agency tovarious contractual breaches, including poor safeguards management by the contractor, points to weakoversight on the part of the Bank.
7. Assessment of CLR Completion Report
49. The CLR’s framework of analysis is broadly consistent with that of the CAS and the CASPR.It brings out the ambitious nature of the program in relation to Uganda’s capacity to implement it and,on the Bank side, the disconnect between buoyant DO and IP project ratings on the one hand and the
16 CLR Review Independent Evaluation Group
disappointing record with regard to achievement of CAS outcomes on the other. The CLR could have discussed how the results framework could have been improved by making the link between WBG interventions, especially IFC’s and MIGA’s programs, indicators and outcomes much clearer. Finally, the treatment of the contribution made by the AAA program to CAS implementation goes little beyond listing AAA outputs in the results matrix.
8. Findings and Lessons
50. IEG is in broad agreement with the lessons drawn by the CLR from the experience of CASimplementation. They are: (1) the need for a focused results framework with specific, measurable,assignable, realistic and time-related, (2) alignment of CPF objectives and indicators with the NDPII,(3) realism in project design and adequate time for project preparation, (4) a strong emphasis onportfolio management, and (5) WBG leadership in development partner coordination and dialogue withthe government. However, IEG would add three other lessons. First, the CAS progress report shouldbe seen as an important opportunity to realistically assess CAS implementation, taking into account allthe available evidence, and to redesign the program if so warranted by that assessment. Second, theCAS results framework should integrate IFC’s and MIGA’s programs more fully and select indicatorsthat allow the links between WBG interventions and progress towards CAS objectives to be clearlyseen. Third, in the event of a resumption of policy-based lending, the Bank should assess the pro-poor nature of public expenditure carefully and ensure that the macro/fiscal framework that it supportsincludes measures to raise Uganda’s low revenue-to-GDP ratio and does not penalize pro-poorspending.
Annexes
17 CLR Review Independent Evaluation Group
Annex Table 1: Summary Achievements of CPS Objectives
Annex Table 2: Planned and Actual Lending for Uganda, FY11-15
Annex Table 3: Grants and Trust Funds Active in FY11-15 (in US$ million)
Annex Table 4: Analytical and Advisory Work for Uganda, FY11-15
Annex Table 5: IEG Project Ratings for Uganda, FY11-15
Annex Table 6: IEG Project Ratings for Uganda and Comparators, FY11-15
Annex Table 7: Portfolio Status for Uganda and Comparators, FY11-15
Annex Table 8: Disbursement Ratio for Uganda, FY11-15
Annex Table 9: .Net Disbursement and Charges for Uganda, FY11-15
Annex Table 10: List of IFC Investments in Uganda
Annex Table 11: List of IFC Advisory Services for Uganda
Annex Table 12: IFC Net Commitment Activity for Uganda
Annex Table 13: List of MIGA Activities in Uganda (in US$ millions)
Annex Table 14: Total Net Disbursements of Official Development Assistance and Official Aid for Uganda
Annex Table 15: Economic and Social Indicators for Uganda, 2013 - 2015

Annexes
19
CLR Review Independent Evaluation Group
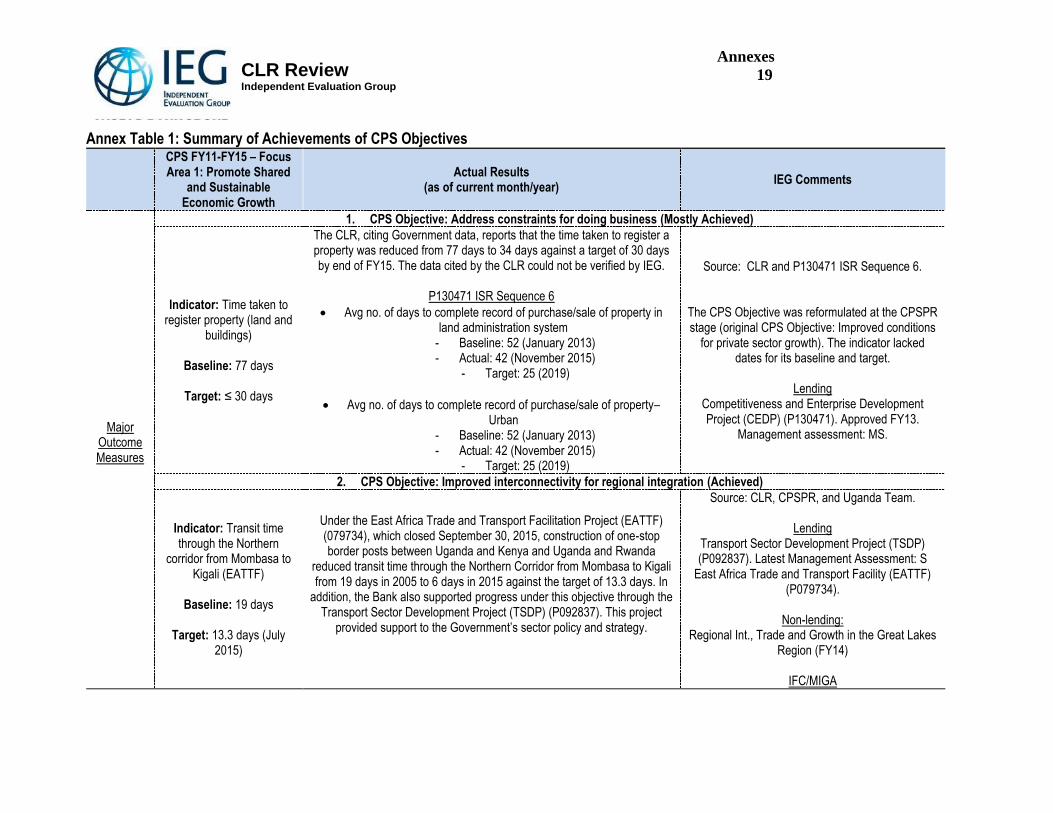
Annex Table 1: Summary of Achievements of CPS Objectives
CPS FY11-FY15 – Focus Area 1: Promote Shared
and Sustainable Economic Growth
Actual Results (as of current month/year)
IEG Comments
Major Outcome Measures
1. CPS Objective: Address constraints for doing business (Mostly Achieved)
Indicator: Time taken to register property (land and
buildings)
Baseline: 77 days
Target: ≤ 30 days
The CLR, citing Government data, reports that the time taken to register a property was reduced from 77 days to 34 days against a target of 30 days by end of FY15. The data cited by the CLR could not be verified by IEG.
P130471 ISR Sequence 6
Avg no. of days to complete record of purchase/sale of property in land administration system
- Baseline: 52 (January 2013) - Actual: 42 (November 2015)
- Target: 25 (2019)
Avg no. of days to complete record of purchase/sale of property–Urban
- Baseline: 52 (January 2013) - Actual: 42 (November 2015)
- Target: 25 (2019)
Source: CLR and P130471 ISR Sequence 6.
The CPS Objective was reformulated at the CPSPR stage (original CPS Objective: Improved conditions
for private sector growth). The indicator lacked dates for its baseline and target.
Lending
Competitiveness and Enterprise Development Project (CEDP) (P130471). Approved FY13.
Management assessment: MS.
2. CPS Objective: Improved interconnectivity for regional integration (Achieved)
Indicator: Transit time through the Northern
corridor from Mombasa to Kigali (EATTF)
Baseline: 19 days
Target: 13.3 days (July
2015)
Under the East Africa Trade and Transport Facilitation Project (EATTF) (079734), which closed September 30, 2015, construction of one-stop border posts between Uganda and Kenya and Uganda and Rwanda
reduced transit time through the Northern Corridor from Mombasa to Kigali from 19 days in 2005 to 6 days in 2015 against the target of 13.3 days. In
addition, the Bank also supported progress under this objective through the Transport Sector Development Project (TSDP) (P092837). This project
provided support to the Government’s sector policy and strategy.
Source: CLR, CPSPR, and Uganda Team.
Lending Transport Sector Development Project (TSDP) (P092837). Latest Management Assessment: S
East Africa Trade and Transport Facility (EATTF) (P079734).
Non-lending:
Regional Int., Trade and Growth in the Great Lakes Region (FY14)
IFC/MIGA
Annexes
20 CLR Review Independent Evaluation Group
CPS FY11-FY15 – Focus Area 1: Promote Shared
and Sustainable Economic Growth
Actual Results (as of current month/year)
IEG Comments
Investment/Guarantee for the Kenya-Uganda Railway
EASSY cable project for ICT backbone.
3. CPS Objective: Increased productivity and commercialization of agriculture (Partially Achieved)
Indicator: Average agricultural income in rural households (in real terms)
Baseline: Ushs 1,654,200
Target: Ushs 2,203,100
In evaluating the CPS, two issues were pertinent as they had a bearing on the evaluation. These were: (1) the ATAAS project implementation was
delayed by one and half years (from board approval to effectiveness); and (2) the project was restructured three years into implementation, with
changes in project components, and one of the implementing agencies.With this in mind, the project was evaluated as being on track to achievingthe target increase in income of rural households in percentage terms. The
baseline and targeted income of Ushs. 4,200,000 and Ushs. 5,040,000 (20percent increase by project end or 10percent at mid-term) may have
been exaggerated. An independent study indicated the average income of farmers in 2010 (the year of approval of project) to be Ushs. 1,654,200. By
2013 average income of farmers had increased to Ushs. 2,203,100 (Independent evaluation by Guide Associates Ltd., 2014). This represented
an increase in income of farm households of 33.2percent in three years. Based on this, the target increase at project mid-term was exceeded. One challenge of using income as an indicator, however, was the unreliability of
farmers’ data/information on their incomes.
Source: CLR, CPSPR, and Uganda Team.
The original baseline was Ushs 4,200,000 and target: Ushs. 5,040,000. Both were revised at the
CPSPR stage. The baseline and target lacked dates.
Lending - Agricultural Technology & Agribusiness
Advisory Project (ATAAS) (P109224).- Northern Uganda Social Action Fund
(NUSAFII) (P111633). This project providedsocial protection that helped minimize
vulnerability in Northern Uganda that was emerging from war, and provided the
opportunity for households and communities to build assets that were critical for re-establishing agricultural production.
- Eastern Africa Agricultural Productivity Project(EAAPP) (FY10). Like ATAAS, this projectcontributed to enhanced research capacity,
technology development and increased agricultural productivity in specified
commodities. This project was complementary to ATAAS, especially in terms of improving the
availability of productivity enhancing technologies.
Annexes
21
CLR Review Independent Evaluation Group
CPS FY11-FY15 – Focus Area 1: Promote Shared
and Sustainable Economic Growth
Actual Results (as of current month/year)
IEG Comments
- Program f. Control of Avian Flu (PCAF) (P110207). This project established the
capacity to manage zoonoses, and in the event that they such epidemics occurred, there would be the capacity to minimize their impact
on agricultural production. - EMCBP- SIL II (FY01) + AF (FY09)
Non-lending
Inclusive Growth (FY11) Water for Agricultural Production (Operationalizing
Agriculture DSIP) (P124856; TF098553).
IFC/MIGA Investments/Guarantee for agribusiness
IFC advisory services
Indicator: Share of farm production marketed by
NAADS targeted beneficiaries
Baseline: 25percent
Target: 50percent
It was not possible to evaluate the CAS based on the second indicator for CAS Outcome 1.3 - share of farm production marketed by target
beneficiaries. Component 4 of the ATAAS project, from which this outcome indicator was derived, had not yet been implemented at the time of the
MTR and was cancelled during restructuring. Instead the CAS was evaluated on percentage increase in average agricultural yields of
participating households. Targets for increases in yields of farmer priority crops in project areas were 15percent and 20percent, for crops and livestock, respectively by fifth year based on the following baselines:
maize, 2.329 t/ha; rice, 2.54 t/ha; beans, 1.505 t/ha (UCA, 2008/09); milk production, 3 l/day; and eggs, 220/bird. According to a survey by Uganda Bureau of Statistics in 2013 (UBOS, 2014), crop yields at farmers’ level
were: maize 3.3 t/ha; rice, 2.5 t/ha and beans, 2.9 t/ha. These represented yield increases of 41.7percent, -1.6percent, and 93percent for maize, rice
and beans, respectively. Reasons given by farmers for these yield
Source: CLR, CPSPR, and Uganda Team.
The CLR was unable to report on the indicator proposed at the CPSPR stage. Alternative indicator
provided.
Lending - Agricultural Technology & Agribusiness
Advisory Project (ATAAS) (P109224).
Annexes
22 CLR Review Independent Evaluation Group
CPS FY11-FY15 – Focus Area 1: Promote Shared
and Sustainable Economic Growth
Actual Results (as of current month/year)
IEG Comments
increases were increased use of improved technologies, better farming practices and good weather
4. CPS Objective: Increased transparency and sustainability of natural resource management (Not Achieved)
Indicator: Area brought under improved land use
management in the Katonga river watershed
(15,224 km2)
Baseline: 0 (2009)
Target: 50percent (7,622km2)
The proposed indicator was finally not included in the main Bank intervention put forward to support progress towards the objective (i.e. Lake Victoria Environmental Management Project Phase II - P100406).
Progress cannot be verified. In lieu of the indicator, the CLR reports that, a 2013 case study of the area indicates that unsustainable farming practices and overgrazing continue to threaten environmental sustainability, leading to soil erosion, which results in increased sediment loads in the available rivers and streams resulting in
pollution and habitat degradation. River Katonga basin, as a strategic water supply source, therefore continues to be under threat from human
activities
Source: CLR, CPSPR and Uganda Team.
Lending - Sustainable Land Management Country
Program (SLMCP) (P108886). - Water Management and Development Project
(WMDP) (P123204) (FY12). - Sustainable Management of Mineral
Resources Project (SMMRP) (P079925).- Lake Victoria Environmental Management
Project Phase II (P100406) LVEMP (FY09)(Regional Project).
AAA Environment and Climate Change Analysis (FY14)
CPS FY11-FY15 – Focus Area 2: Enhancing Public
Infrastructure
Actual Results (as of current month/year)
IEG Comments
Major Outcome Measures
5. CPS Objective: Increased access to electricity (Partially Achieved)
Indicator: Rural people connected through the
extended grid under the projects (number)
Baseline: 824,000
As of October 2015, 79,403 connections have been made in rural and peri-urban areas under the ERT-2 and OBA projects. This is
equivalent to 397,015 rural people connected which represent approximately 75percent of the target).
Source: CLR and CPSPR
Annexes
23
CLR Review Independent Evaluation Group
CPS FY11-FY15 – Focus Area
2: Enhancing Public Infrastructure
Actual Results (as of current month/year)
IEG Comments
Target: 1,352,000
Indicator: Flow of electricity through the Masaka substation
(GWh)
Baseline: 381
Target: 617
The flow of electricity through Masaka substation will be realized once the Kawanda-Masaka transmission line project is completed,
currently scheduled for completion in August 2016.
Source: CLR, CPSPR, and Uganda Team.
Lending Electricity Sector Development Project (ESDP)
(P11973)
6. CPS Objective: Improved access to and quality of roads in project areas (Partially Achieved)
Indicator: Rural people with access to an all season road in
the target area (Gulu and Western Nile districts)
Baseline: 3,520,000
Target: 4,950,000
In the area of road transport, WBG support was delivered through the Transport Sector Development Project (TSDP). Progress was modest in relation to road access with around 700,000 additional people against a target of 1.4 million people having access to all-
weather roads. As per population data available in the 2014 census, and coverage of the all season access roads in the indicated area, the number of
total beneficiaries is 4,234,744 as of 2014, against the target of 4,950,000. The target number of beneficiaries may have been an
overestimate. The numbers are taken from the core sector indicators and it is unclear to what extent TSDP is contributing
especially since it has been cancelled due to serious social safeguards issues.
Source: CLR, CPSPR and P092837 Sequence 11 (August 2015).
Lending
- Transport Sector Development Project (TSDP)(P092837),
- Poverty Reduction Support Credit 9 (PRSC9)(P097325),
- Kampala Institutional & Infrastructure Development Project (KIIDP)(P078382),
- Support to Municipal Infrastructure Development Program (SMIDP)(P117876)
Indicator: Travel time on Gulu-Nimule and Vurra-Oruba roads
(hours)
Baseline: 2
Target: 1.5
The paving works for the Gulu – Atiak road (74 km) and the Vurrra –Oruba roads (92 km) roads have been completed, and the travel time targets achieved. The CLR reports that: For travel time, the targeted reduction of travel time from 120 minutes to 90 minutes
was achieved.
Source: CLR and CPSPR
Lending - Transport Sector Development Project (TSDP)
(P092837). Management assessment: U - Transport Sector Development Project II
(P125590). Management assessment: S - Poverty Reduction Support Credit 9 (PRSC9)
(P097325).
7. CPS Objective: Increased access to quality water and sanitation services (Mostly Achieved)
Annexes
24 CLR Review Independent Evaluation Group
CPS FY11-FY15 – Focus Area 2: Enhancing Public
Infrastructure
Actual Results (as of current month/year)
IEG Comments
Indicator: Percentage of households with access to safe
and effective sanitation
Baseline: 62percent
Target: 73percent
In FY 2014/15, access to sanitation, according to district reports, increased to 77percent (Water & Environment Sector Performance
Report 2015 - Ministry of Water and Environment).
Source: CLR, CPSPR and Uganda Team.
Lending - Poverty Reduction Support Credit 9
(PRSC9)(P097325) - Kampala Institutional & Infrastructure
Development Project (KIIDP)(P078382)- Support to Municipal Infrastructure Development
Program (SMIDP)(P117876) - Water Management and Development Project
(WMDP) (P123204) - Northern Uganda Social Action Fund (NUSAFII)
(P111633) LVEMP (FY09)
Trust Funds - OBA in Water Supply in Small Towns and Rural
Growth Centers - OBA Kampala Water Connections for the Poor
IFC - Small Scale Infrastructure Advisory Program
Non lending - TA on Rural Sanitation Program WSP (FYI4)
Indicator: People provided with access to improved water
sources under the project (sanitation-related projects)
Baseline: 6,553,704
Target: 12,954,068
About 6,076,709 additional people were provided with safe water through the various projects and programs. The short fall was partly due to the decreasing funding to the sector, from 4.9percent in fiscal year 2004/5 to 3.2percent in fiscal year 2013/14. Also, delay in the
implementation of some programs, such as Water Management and Development Project (WMDP).
Source: CLR, CPSPR and Uganda Team.
Lending - Poverty Reduction Support Credit 9
(PRSC9)(P097325) - Kampala Institutional & Infrastructure
Development Project (KIIDP)(P078382)- Support to Municipal Infrastructure Development
Program (SMIDP)(P117876)
Annexes
25
CLR Review Independent Evaluation Group
CPS FY11-FY15 – Focus Area
2: Enhancing Public Infrastructure
Actual Results (as of current month/year)
IEG Comments
- Water Management and Development Project (WMDP) (P123204)
- Northern Uganda Social Action Fund (NUSAFII) (P111633) LVEMP (FY09)
Trust Funds
- OBA in Water Supply in Small Towns and Rural Growth Centers
- OBA Kampala Water Connections for the Poor
IFC - Small Scale Infrastructure Advisory Program
Non lending
- TA on Rural Sanitation Program WSP (FYI4)
8. CPS Objective: Improved management and delivery of urban services (Not Achieved)
Indicator: Increase in public satisfaction in service delivery
of key services in Kampala a) roads, b) drainage, c) solid
waste
Baseline: a) 18percent, b) 22percent, c) 44percent
Target: a) 50percent, b) 31percent, c) 60percent
a) Roads: 29percent b) Drainage: 22percent
c) Solid waste: 46percent
Source: CLR and CPSPR
Lending - Kampala Institutional and Infrastructure Development Project (KIIDP I) (P078382). IEG: S - Kampala Institutional and Infrastructure
Development Project (KIIDP II) (P133590). Management assessment: S
- Municipal Infrastructure Development (P117876). Management assessment: S
Trust Funds
- OBA Kampala Water Connections for the Poor Cities Alliances Grant
Annexes
26 CLR Review Independent Evaluation Group
CPS FY11-FY15 – Focus Area 3: Strengthening Human Capital
Development
Actual Results (as of current month/year)
IEG Comments
Major Outcome Measures
9. CPS Objective: Improved access to and quality of primary and post-primary education (Partially Achieved)
Quality Indicator: Percentage of pupils reaching literacy proficiency in
Government aided schools reaching
Baseline P6 total: 52percent Baseline P6 girls: 53percent Target P6 total: 57percent Target P6 girls: 59percent
P6 girls (2013):41percent P6 total (2013): 41percent
Lending - Poverty Reduction Support Credit 9 (PRSC9) (P097325)
- Post-Primary Education & Training Program (UPPET)(P110803)
- Millennium Science Initiative (MSI) (P086513)- Northern Uganda Social Action Fund (NUSAFII)
(P111633)
Source: CLR and Uganda Team.
The objective also made reference to quality of post primary education. However, the CLR does not
include any reporting on this in the Results Framework. The body of the CLR mentions that the
assessments for Secondary 2 show a continuous and worrying annual decline from 2013 to 2014. The Post Primary Education and Training Program (P110803)
(approved in FY09) supported progress in post primary education. The project was rated MU by IEG. The Uganda team notes that the project contributed to improving necessary but not sufficient conditions for improving post primary learning achievement.
Access Indicator: Average national Gross
Enrollment for lower Secondary education (Universal Post-Primary Education and Training – UPPET)
Baseline: boys – 28percent and girls – 25percent
Target: boys – 42percent and girls – 40percent
Lower Secondary GER Boys (2013): 37.7percent GER Girls (2013): 33.7percent
The Uganda team reports that, as of 2016, GER is still very low estimated at 35percent (34.7percent girls) – World Bank
2016-ongoing Uganda education sector analysis.
Primary The Uganda Team reports that primary NER is 97percent with
parity across gender (98percent girls, 97percent boys). Enrolment is currently estimated at 8.7 million learners –
compared to 5.2 million in 2005. Source for the information not provided.
Source: CLR and Uganda Team
The objective also made reference to access in primary education. However, the CLR does not
include any reporting on this in the Results Framework. The Uganda Team provide information
without source that could not be verified.
Lending - Poverty Reduction Support Credit 9 (PRSC9)
(P097325) - Post-Primary Education & Training Program
(UPPET) (P110803) - Millennium Science Initiative (MSI) (P086513)
- Northern Uganda Social Action Fund (NUSAFII)(P111633). -
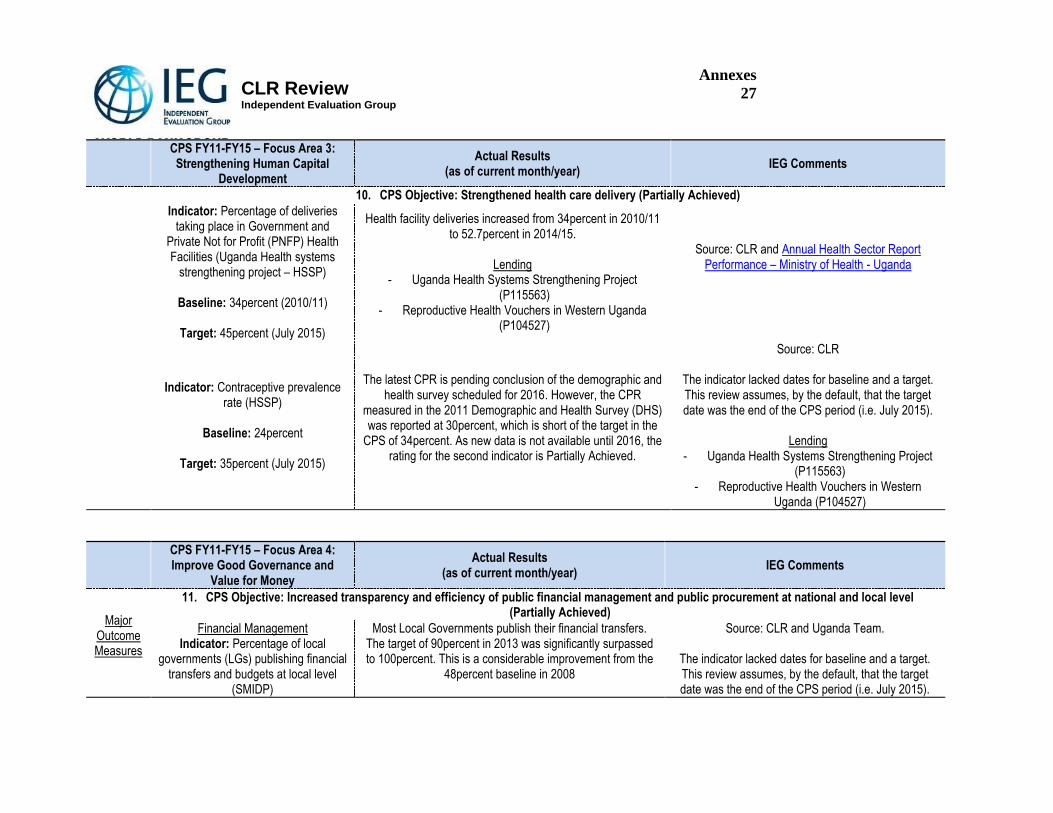
Annexes
27
CLR Review Independent Evaluation Group
CPS FY11-FY15 – Focus Area 3: Strengthening Human Capital
Development
Actual Results (as of current month/year)
IEG Comments
10. CPS Objective: Strengthened health care delivery (Partially Achieved)
Indicator: Percentage of deliveries taking place in Government and
Private Not for Profit (PNFP) Health Facilities (Uganda Health systems
strengthening project – HSSP)
Baseline: 34percent (2010/11)
Target: 45percent (July 2015)
Health facility deliveries increased from 34percent in 2010/11 to 52.7percent in 2014/15.
Lending
- Uganda Health Systems Strengthening Project (P115563)
- Reproductive Health Vouchers in Western Uganda (P104527)
Source: CLR and Annual Health Sector Report Performance – Ministry of Health - Uganda
Indicator: Contraceptive prevalence rate (HSSP)
Baseline: 24percent
Target: 35percent (July 2015)
The latest CPR is pending conclusion of the demographic and health survey scheduled for 2016. However, the CPR
measured in the 2011 Demographic and Health Survey (DHS) was reported at 30percent, which is short of the target in the
CPS of 34percent. As new data is not available until 2016, the rating for the second indicator is Partially Achieved.
Source: CLR
The indicator lacked dates for baseline and a target. This review assumes, by the default, that the target date was the end of the CPS period (i.e. July 2015).
Lending - Uganda Health Systems Strengthening Project
(P115563) - Reproductive Health Vouchers in Western
Uganda (P104527)
CPS FY11-FY15 – Focus Area 4: Improve Good Governance and
Value for Money
Actual Results (as of current month/year)
IEG Comments
Major Outcome Measures
11. CPS Objective: Increased transparency and efficiency of public financial management and public procurement at national and local level (Partially Achieved)
Financial Management Indicator: Percentage of local
governments (LGs) publishing financial transfers and budgets at local level
(SMIDP)
Most Local Governments publish their financial transfers. The target of 90percent in 2013 was significantly surpassed to 100percent. This is a considerable improvement from the
48percent baseline in 2008
Source: CLR and Uganda Team.
The indicator lacked dates for baseline and a target. This review assumes, by the default, that the target date was the end of the CPS period (i.e. July 2015).
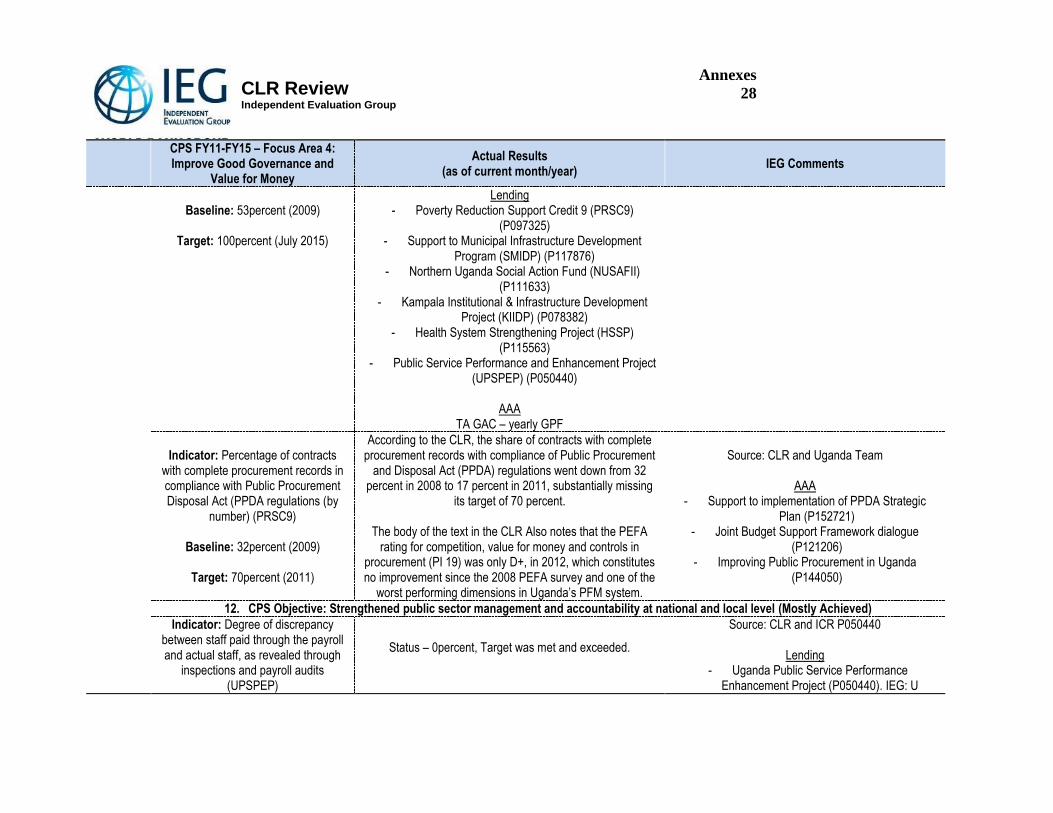
Annexes
28
CLR Review Independent Evaluation Group
CPS FY11-FY15 – Focus Area 4: Improve Good Governance and
Value for Money
Actual Results (as of current month/year)
IEG Comments
Baseline: 53percent (2009)
Target: 100percent (July 2015)
Lending - Poverty Reduction Support Credit 9 (PRSC9)
(P097325) - Support to Municipal Infrastructure Development
Program (SMIDP) (P117876) - Northern Uganda Social Action Fund (NUSAFII)
(P111633) - Kampala Institutional & Infrastructure Development
Project (KIIDP) (P078382) - Health System Strengthening Project (HSSP)
(P115563) - Public Service Performance and Enhancement Project
(UPSPEP) (P050440)
AAA TA GAC – yearly GPF
Indicator: Percentage of contracts with complete procurement records in compliance with Public Procurement Disposal Act (PPDA regulations (by
number) (PRSC9)
Baseline: 32percent (2009)
Target: 70percent (2011)
According to the CLR, the share of contracts with complete procurement records with compliance of Public Procurement
and Disposal Act (PPDA) regulations went down from 32 percent in 2008 to 17 percent in 2011, substantially missing
its target of 70 percent.
The body of the text in the CLR Also notes that the PEFA rating for competition, value for money and controls in
procurement (PI 19) was only D+, in 2012, which constitutes no improvement since the 2008 PEFA survey and one of the
worst performing dimensions in Uganda’s PFM system.
Source: CLR and Uganda Team
AAA - Support to implementation of PPDA Strategic
Plan (P152721) - Joint Budget Support Framework dialogue
(P121206) - Improving Public Procurement in Uganda
(P144050)
12. CPS Objective: Strengthened public sector management and accountability at national and local level (Mostly Achieved)
Indicator: Degree of discrepancy between staff paid through the payroll and actual staff, as revealed through
inspections and payroll audits (UPSPEP)
Status – 0percent, Target was met and exceeded.
Source: CLR and ICR P050440
Lending - Uganda Public Service Performance
Enhancement Project (P050440). IEG: U
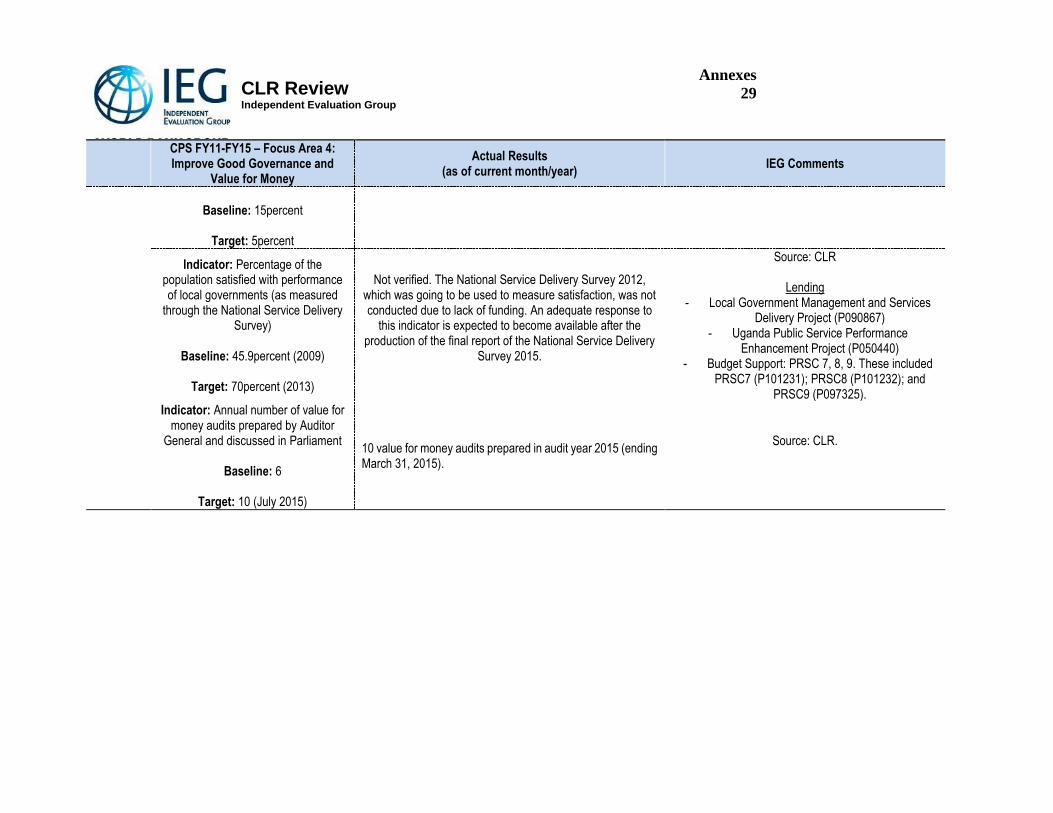
Annexes
29
CLR Review Independent Evaluation Group
CPS FY11-FY15 – Focus Area 4: Improve Good Governance and
Value for Money
Actual Results (as of current month/year)
IEG Comments
Baseline: 15percent
Target: 5percent
Indicator: Percentage of the population satisfied with performance of local governments (as measured
through the National Service Delivery Survey)
Baseline: 45.9percent (2009)
Target: 70percent (2013)
Not verified. The National Service Delivery Survey 2012, which was going to be used to measure satisfaction, was not conducted due to lack of funding. An adequate response to
this indicator is expected to become available after the production of the final report of the National Service Delivery
Survey 2015.
Source: CLR
Lending - Local Government Management and Services
Delivery Project (P090867) - Uganda Public Service Performance
Enhancement Project (P050440) - Budget Support: PRSC 7, 8, 9. These included
PRSC7 (P101231); PRSC8 (P101232); and PRSC9 (P097325).
Indicator: Annual number of value for money audits prepared by Auditor
General and discussed in Parliament
Baseline: 6
Target: 10 (July 2015)
10 value for money audits prepared in audit year 2015 (ending March 31, 2015).
Source: CLR.
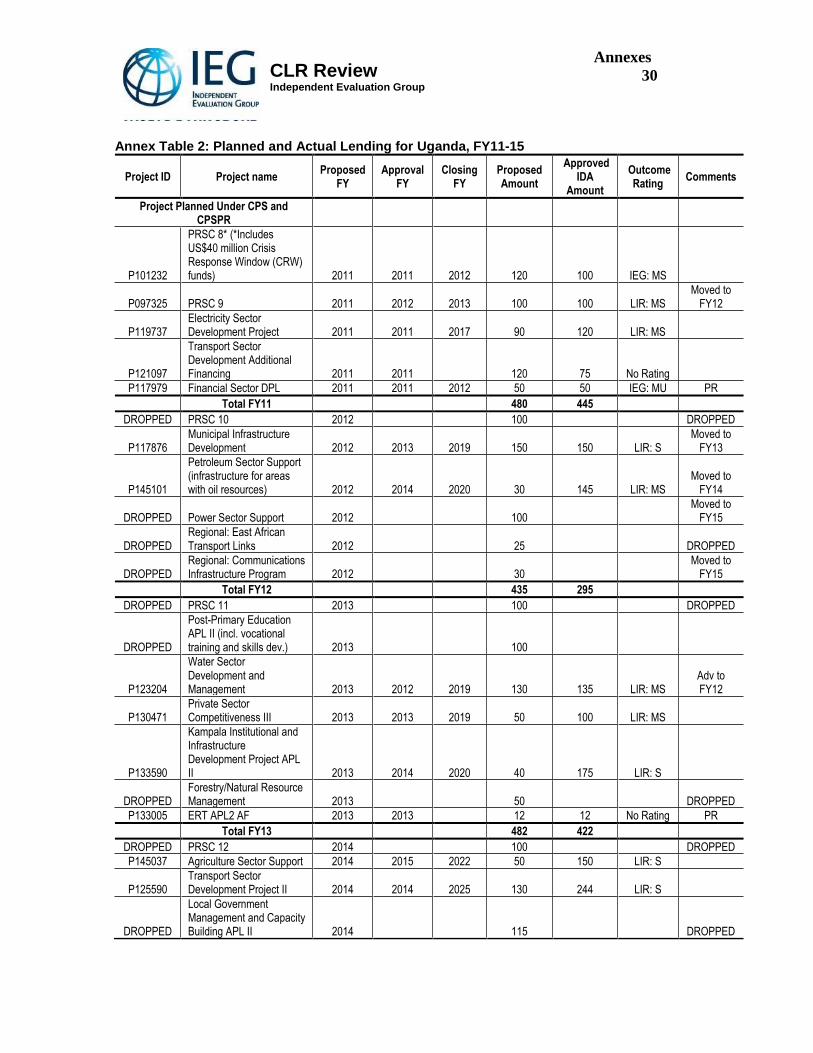
Annexes
30 CLR Review Independent Evaluation Group
Annex Table 2: Planned and Actual Lending for Uganda, FY11-15
Project ID Project name Proposed
FY Approval
FY Closing
FY Proposed Amount
Approved IDA
Amount
Outcome Rating
Comments
Project Planned Under CPS and CPSPR
P101232
PRSC 8* (*Includes US$40 million Crisis Response Window (CRW) funds) 2011 2011 2012 120 100 IEG: MS
P097325 PRSC 9 2011 2012 2013 100 100 LIR: MS Moved to
FY12
P119737 Electricity Sector Development Project 2011 2011 2017 90 120 LIR: MS
P121097
Transport Sector Development Additional Financing 2011 2011 120 75 No Rating
P117979 Financial Sector DPL 2011 2011 2012 50 50 IEG: MU PR
Total FY11 480 445
DROPPED PRSC 10 2012 100 DROPPED
P117876 Municipal Infrastructure Development 2012 2013 2019 150 150 LIR: S
Moved to FY13
P145101
Petroleum Sector Support (infrastructure for areas with oil resources) 2012 2014 2020 30 145 LIR: MS
Moved to FY14
DROPPED Power Sector Support 2012 100 Moved to
FY15
DROPPED Regional: East African Transport Links 2012 25 DROPPED
DROPPED Regional: Communications Infrastructure Program 2012 30
Moved to FY15
Total FY12 435 295
DROPPED PRSC 11 2013 100 DROPPED
DROPPED
Post-Primary Education APL II (incl. vocational training and skills dev.) 2013 100
P123204
Water Sector Development and Management 2013 2012 2019 130 135 LIR: MS
Adv to FY12
P130471 Private Sector Competitiveness III 2013 2013 2019 50 100 LIR: MS
P133590
Kampala Institutional and Infrastructure Development Project APL II 2013 2014 2020 40 175 LIR: S
DROPPED Forestry/Natural Resource Management 2013 50 DROPPED
P133005 ERT APL2 AF 2013 2013 12 12 No Rating PR
Total FY13 482 422
DROPPED PRSC 12 2014 100 DROPPED
P145037 Agriculture Sector Support 2014 2015 2022 50 150 LIR: S
P125590 Transport Sector Development Project II 2014 2014 2025 130 244 LIR: S
DROPPED
Local Government Management and Capacity Building APL II 2014 115 DROPPED
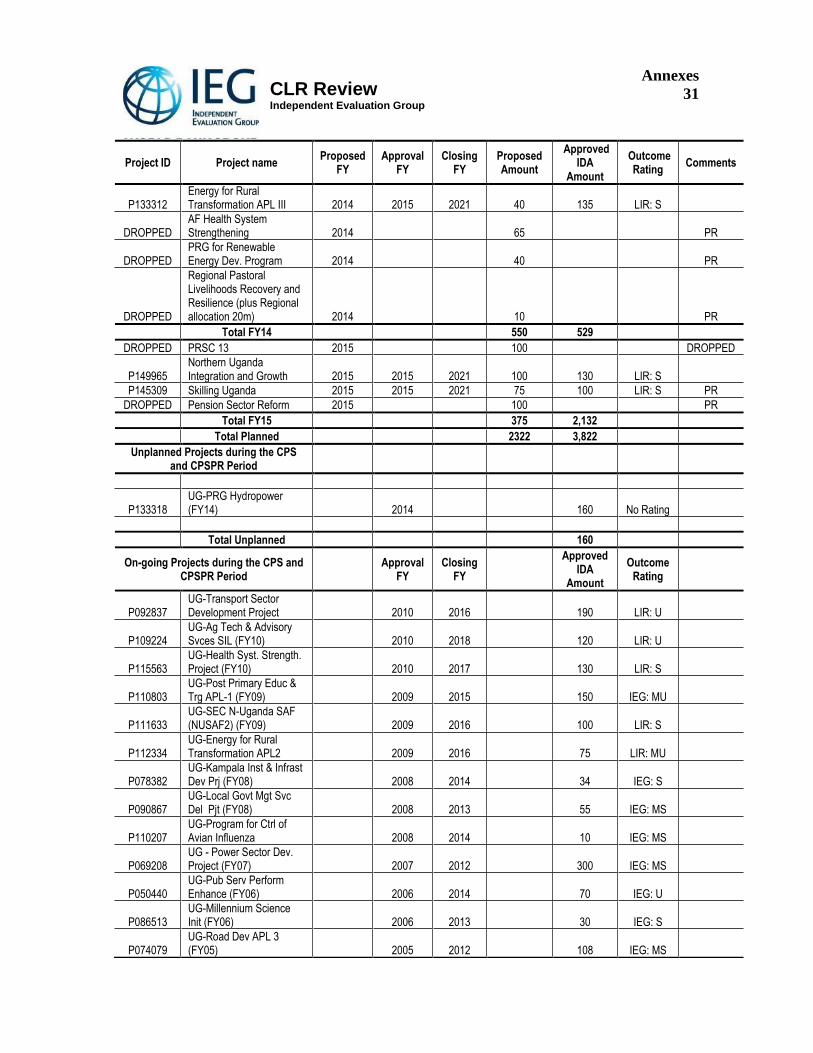
Annexes
31
CLR Review Independent Evaluation Group
Project ID Project name Proposed
FY Approval
FY Closing
FY Proposed Amount
Approved IDA
Amount
Outcome Rating
Comments
P133312 Energy for Rural Transformation APL III 2014 2015 2021 40 135 LIR: S
DROPPED AF Health System Strengthening 2014 65 PR
DROPPED PRG for Renewable Energy Dev. Program 2014 40 PR
DROPPED
Regional Pastoral Livelihoods Recovery and Resilience (plus Regional allocation 20m) 2014 10 PR
Total FY14 550 529
DROPPED PRSC 13 2015 100 DROPPED
P149965 Northern Uganda Integration and Growth 2015 2015 2021 100 130 LIR: S
P145309 Skilling Uganda 2015 2015 2021 75 100 LIR: S PR
DROPPED Pension Sector Reform 2015 100 PR
Total FY15 375 2,132
Total Planned 2322 3,822
Unplanned Projects during the CPS and CPSPR Period
P133318 UG-PRG Hydropower (FY14) 2014 160 No Rating
Total Unplanned 160
On-going Projects during the CPS and CPSPR Period
Approval
FY Closing
FY
Approved IDA
Amount
Outcome Rating
P092837 UG-Transport Sector Development Project 2010 2016 190 LIR: U
P109224 UG-Ag Tech & Advisory Svces SIL (FY10) 2010 2018 120 LIR: U
P115563 UG-Health Syst. Strength. Project (FY10) 2010 2017 130 LIR: S
P110803 UG-Post Primary Educ & Trg APL-1 (FY09) 2009 2015 150 IEG: MU
P111633 UG-SEC N-Uganda SAF (NUSAF2) (FY09) 2009 2016 100 LIR: S
P112334 UG-Energy for Rural Transformation APL2 2009 2016 75 LIR: MU
P078382 UG-Kampala Inst & Infrast Dev Prj (FY08) 2008 2014 34 IEG: S
P090867 UG-Local Govt Mgt Svc Del Pjt (FY08) 2008 2013 55 IEG: MS
P110207 UG-Program for Ctrl of Avian Influenza 2008 2014 10 IEG: MS
P069208 UG - Power Sector Dev. Project (FY07) 2007 2012 300 IEG: MS
P050440 UG-Pub Serv Perform Enhance (FY06) 2006 2014 70 IEG: U
P086513 UG-Millennium Science Init (FY06) 2006 2013 30 IEG: S
P074079 UG-Road Dev APL 3 (FY05) 2005 2012 108 IEG: MS
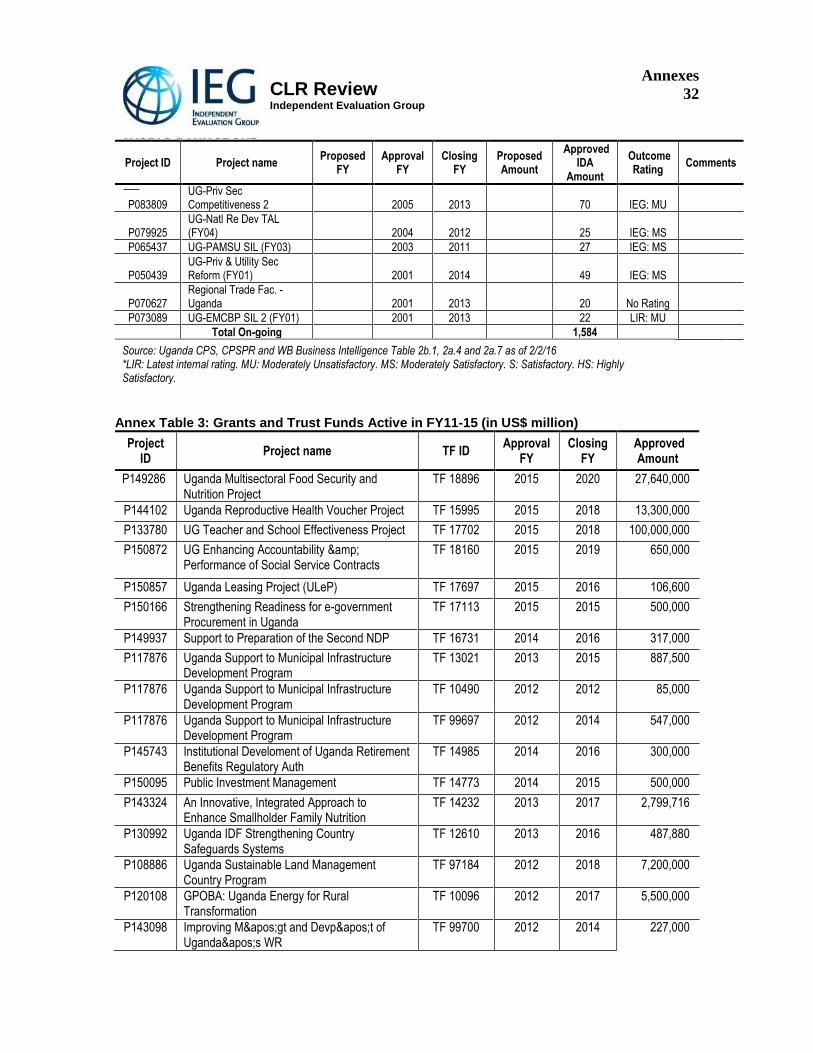
Annexes
32
CLR Review Independent Evaluation Group
Project ID Project name Proposed
FY Approval
FY Closing
FY Proposed Amount
Approved IDA
Amount
Outcome Rating
Comments
P083809 UG-Priv Sec Competitiveness 2 2005 2013 70 IEG: MU
P079925 UG-Natl Re Dev TAL (FY04) 2004 2012 25 IEG: MS
P065437 UG-PAMSU SIL (FY03) 2003 2011 27 IEG: MS
P050439 UG-Priv & Utility Sec Reform (FY01) 2001 2014 49 IEG: MS
P070627 Regional Trade Fac. - Uganda 2001 2013 20 No Rating
P073089 UG-EMCBP SIL 2 (FY01) 2001 2013 22 LIR: MU
Total On-going 1,584
Source: Uganda CPS, CPSPR and WB Business Intelligence Table 2b.1, 2a.4 and 2a.7 as of 2/2/16 *LIR: Latest internal rating. MU: Moderately Unsatisfactory. MS: Moderately Satisfactory. S: Satisfactory. HS: Highly Satisfactory.
Annex Table 3: Grants and Trust Funds Active in FY11-15 (in US$ million)
Project ID
Project name TF ID Approval
FY Closing
FY Approved
Amount
P149286 Uganda Multisectoral Food Security and Nutrition Project
TF 18896 2015 2020 27,640,000
P144102 Uganda Reproductive Health Voucher Project TF 15995 2015 2018 13,300,000
P133780 UG Teacher and School Effectiveness Project TF 17702 2015 2018 100,000,000
P150872 UG Enhancing Accountability & Performance of Social Service Contracts
TF 18160 2015 2019 650,000
P150857 Uganda Leasing Project (ULeP) TF 17697 2015 2016 106,600
P150166 Strengthening Readiness for e-government Procurement in Uganda
TF 17113 2015 2015 500,000
P149937 Support to Preparation of the Second NDP TF 16731 2014 2016 317,000
P117876 Uganda Support to Municipal Infrastructure Development Program
TF 13021 2013 2015 887,500
P117876 Uganda Support to Municipal Infrastructure Development Program
TF 10490 2012 2012 85,000
P117876 Uganda Support to Municipal Infrastructure Development Program
TF 99697 2012 2014 547,000
P145743 Institutional Develoment of Uganda Retirement Benefits Regulatory Auth
TF 14985 2014 2016 300,000
P150095 Public Investment Management TF 14773 2014 2015 500,000
P143324 An Innovative, Integrated Approach to Enhance Smallholder Family Nutrition
TF 14232 2013 2017 2,799,716
P130992 Uganda IDF Strengthening Country Safeguards Systems
TF 12610 2013 2016 487,880
P108886 Uganda Sustainable Land Management Country Program
TF 97184 2012 2018 7,200,000
P120108 GPOBA: Uganda Energy for Rural Transformation
TF 10096 2012 2017 5,500,000
P143098 Improving M'gt and Devp't of Uganda's WR
TF 99700 2012 2014 227,000
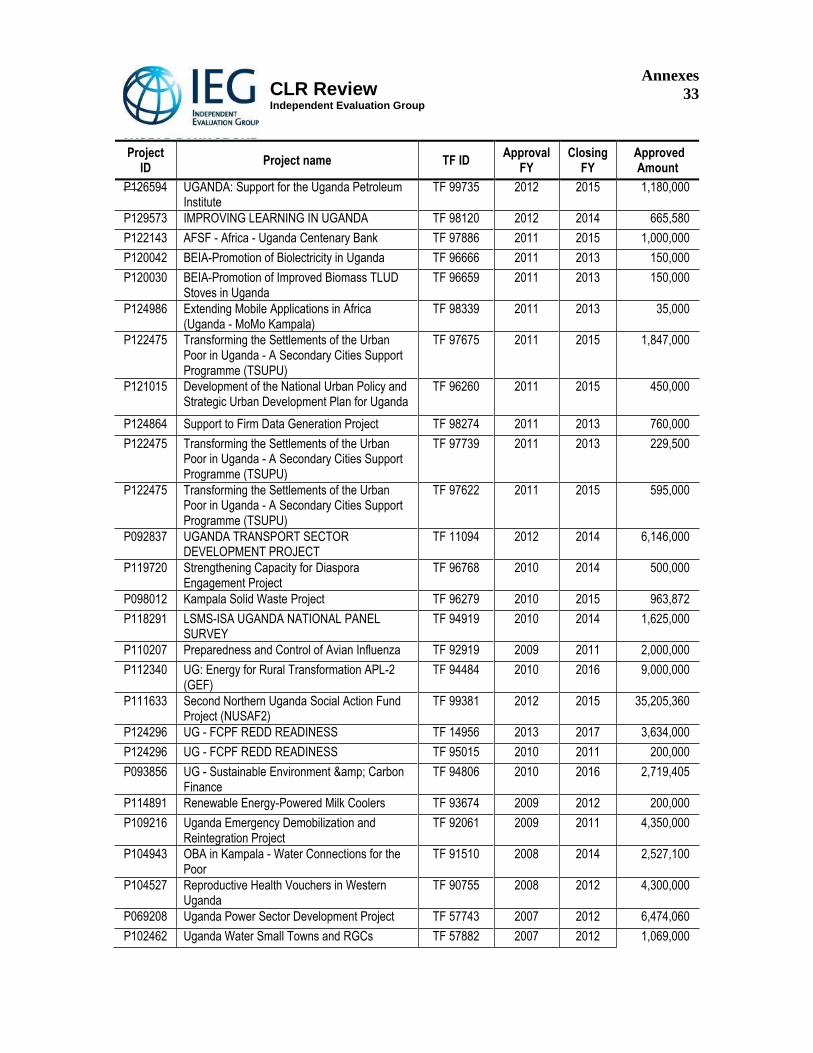
Annexes
33
CLR Review Independent Evaluation Group
Project ID
Project name TF ID Approval
FY Closing
FY Approved
Amount
P126594 UGANDA: Support for the Uganda Petroleum Institute
TF 99735 2012 2015 1,180,000
P129573 IMPROVING LEARNING IN UGANDA TF 98120 2012 2014 665,580
P122143 AFSF - Africa - Uganda Centenary Bank TF 97886 2011 2015 1,000,000
P120042 BEIA-Promotion of Biolectricity in Uganda TF 96666 2011 2013 150,000
P120030 BEIA-Promotion of Improved Biomass TLUD Stoves in Uganda
TF 96659 2011 2013 150,000
P124986 Extending Mobile Applications in Africa (Uganda - MoMo Kampala)
TF 98339 2011 2013 35,000
P122475 Transforming the Settlements of the Urban Poor in Uganda - A Secondary Cities Support Programme (TSUPU)
TF 97675 2011 2015 1,847,000
P121015 Development of the National Urban Policy and Strategic Urban Development Plan for Uganda
TF 96260 2011 2015 450,000
P124864 Support to Firm Data Generation Project TF 98274 2011 2013 760,000
P122475 Transforming the Settlements of the Urban Poor in Uganda - A Secondary Cities Support Programme (TSUPU)
TF 97739 2011 2013 229,500
P122475 Transforming the Settlements of the Urban Poor in Uganda - A Secondary Cities Support Programme (TSUPU)
TF 97622 2011 2015 595,000
P092837 UGANDA TRANSPORT SECTOR DEVELOPMENT PROJECT
TF 11094 2012 2014 6,146,000
P119720 Strengthening Capacity for Diaspora Engagement Project
TF 96768 2010 2014 500,000
P098012 Kampala Solid Waste Project TF 96279 2010 2015 963,872
P118291 LSMS-ISA UGANDA NATIONAL PANEL SURVEY
TF 94919 2010 2014 1,625,000
P110207 Preparedness and Control of Avian Influenza TF 92919 2009 2011 2,000,000
P112340 UG: Energy for Rural Transformation APL-2 (GEF)
TF 94484 2010 2016 9,000,000
P111633 Second Northern Uganda Social Action Fund Project (NUSAF2)
TF 99381 2012 2015 35,205,360
P124296 UG - FCPF REDD READINESS TF 14956 2013 2017 3,634,000
P124296 UG - FCPF REDD READINESS TF 95015 2010 2011 200,000
P093856 UG - Sustainable Environment & Carbon Finance
TF 94806 2010 2016 2,719,405
P114891 Renewable Energy-Powered Milk Coolers TF 93674 2009 2012 200,000
P109216 Uganda Emergency Demobilization and Reintegration Project
TF 92061 2009 2011 4,350,000
P104943 OBA in Kampala - Water Connections for the Poor
TF 91510 2008 2014 2,527,100
P104527 Reproductive Health Vouchers in Western Uganda
TF 90755 2008 2012 4,300,000
P069208 Uganda Power Sector Development Project TF 57743 2007 2012 6,474,060
P102462 Uganda Water Small Towns and RGCs TF 57882 2007 2012 1,069,000
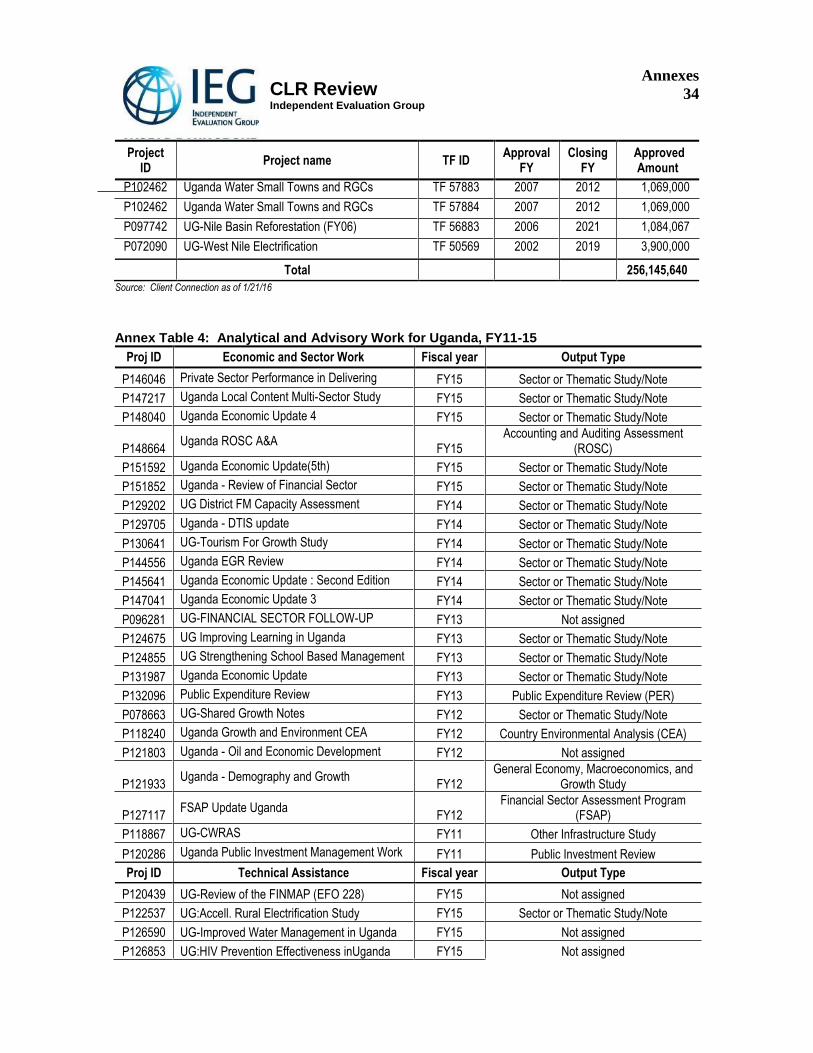
Annexes
34 CLR Review Independent Evaluation Group
Project ID
Project name TF ID Approval
FY Closing
FY Approved
Amount
P102462 Uganda Water Small Towns and RGCs TF 57883 2007 2012 1,069,000
P102462 Uganda Water Small Towns and RGCs TF 57884 2007 2012 1,069,000
P097742 UG-Nile Basin Reforestation (FY06) TF 56883 2006 2021 1,084,067
P072090 UG-West Nile Electrification TF 50569 2002 2019 3,900,000
Total 256,145,640
Source: Client Connection as of 1/21/16
Annex Table 4: Analytical and Advisory Work for Uganda, FY11-15
Proj ID Economic and Sector Work Fiscal year Output Type
P146046 Private Sector Performance in Delivering FY15 Sector or Thematic Study/Note
P147217 Uganda Local Content Multi-Sector Study FY15 Sector or Thematic Study/Note
P148040 Uganda Economic Update 4 FY15 Sector or Thematic Study/Note
P148664 Uganda ROSC A&A
FY15 Accounting and Auditing Assessment
(ROSC)
P151592 Uganda Economic Update(5th) FY15 Sector or Thematic Study/Note
P151852 Uganda - Review of Financial Sector FY15 Sector or Thematic Study/Note
P129202 UG District FM Capacity Assessment FY14 Sector or Thematic Study/Note
P129705 Uganda - DTIS update FY14 Sector or Thematic Study/Note
P130641 UG-Tourism For Growth Study FY14 Sector or Thematic Study/Note
P144556 Uganda EGR Review FY14 Sector or Thematic Study/Note
P145641 Uganda Economic Update : Second Edition FY14 Sector or Thematic Study/Note
P147041 Uganda Economic Update 3 FY14 Sector or Thematic Study/Note
P096281 UG-FINANCIAL SECTOR FOLLOW-UP FY13 Not assigned
P124675 UG Improving Learning in Uganda FY13 Sector or Thematic Study/Note
P124855 UG Strengthening School Based Management FY13 Sector or Thematic Study/Note
P131987 Uganda Economic Update FY13 Sector or Thematic Study/Note
P132096 Public Expenditure Review FY13 Public Expenditure Review (PER)
P078663 UG-Shared Growth Notes FY12 Sector or Thematic Study/Note
P118240 Uganda Growth and Environment CEA FY12 Country Environmental Analysis (CEA)
P121803 Uganda - Oil and Economic Development FY12 Not assigned
P121933 Uganda - Demography and Growth
FY12 General Economy, Macroeconomics, and
Growth Study
P127117 FSAP Update Uganda
FY12 Financial Sector Assessment Program
(FSAP)
P118867 UG-CWRAS FY11 Other Infrastructure Study
P120286 Uganda Public Investment Management Work FY11 Public Investment Review
Proj ID Technical Assistance Fiscal year Output Type
P120439 UG-Review of the FINMAP (EFO 228) FY15 Not assigned
P122537 UG:Accell. Rural Electrification Study FY15 Sector or Thematic Study/Note
P126590 UG-Improved Water Management in Uganda FY15 Not assigned
P126853 UG:HIV Prevention Effectiveness inUganda FY15 Not assigned
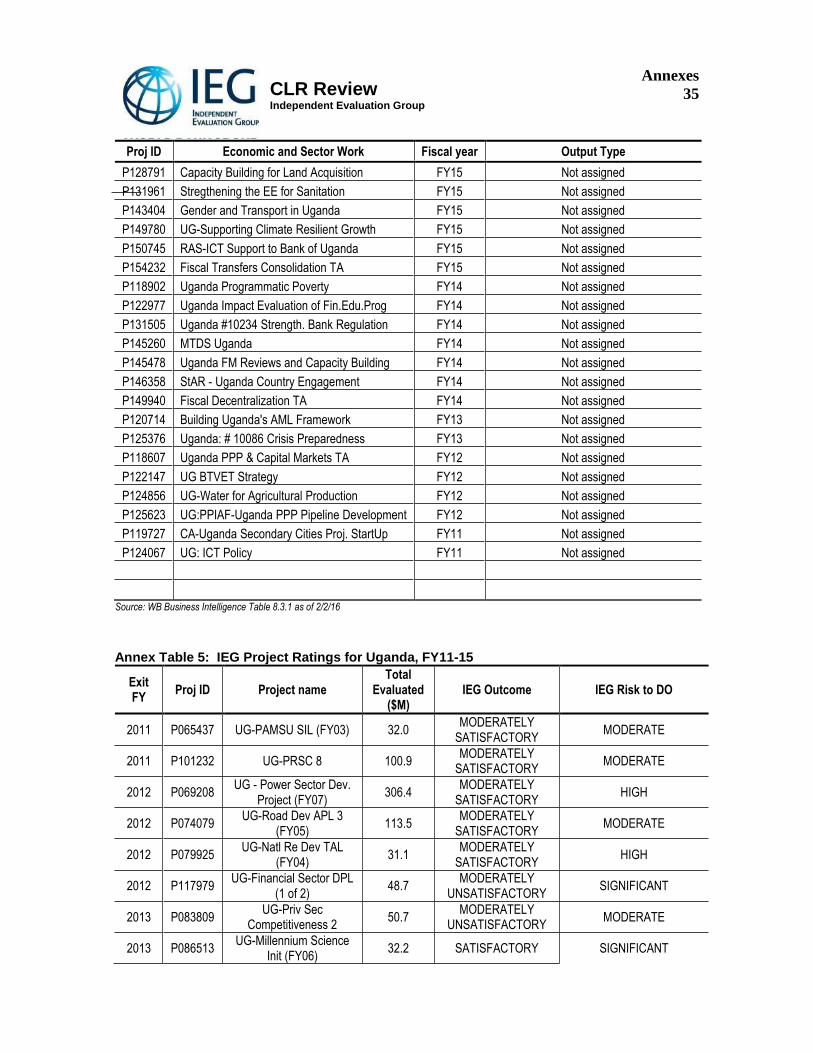
Annexes
35
CLR Review Independent Evaluation Group
Proj ID Economic and Sector Work Fiscal year Output Type
P128791 Capacity Building for Land Acquisition FY15 Not assigned
P131961 Stregthening the EE for Sanitation FY15 Not assigned
P143404 Gender and Transport in Uganda FY15 Not assigned
P149780 UG-Supporting Climate Resilient Growth FY15 Not assigned
P150745 RAS-ICT Support to Bank of Uganda FY15 Not assigned
P154232 Fiscal Transfers Consolidation TA FY15 Not assigned
P118902 Uganda Programmatic Poverty FY14 Not assigned
P122977 Uganda Impact Evaluation of Fin.Edu.Prog FY14 Not assigned
P131505 Uganda #10234 Strength. Bank Regulation FY14 Not assigned
P145260 MTDS Uganda FY14 Not assigned
P145478 Uganda FM Reviews and Capacity Building FY14 Not assigned
P146358 StAR - Uganda Country Engagement FY14 Not assigned
P149940 Fiscal Decentralization TA FY14 Not assigned
P120714 Building Uganda's AML Framework FY13 Not assigned
P125376 Uganda: # 10086 Crisis Preparedness FY13 Not assigned
P118607 Uganda PPP & Capital Markets TA FY12 Not assigned
P122147 UG BTVET Strategy FY12 Not assigned
P124856 UG-Water for Agricultural Production FY12 Not assigned
P125623 UG:PPIAF-Uganda PPP Pipeline Development FY12 Not assigned
P119727 CA-Uganda Secondary Cities Proj. StartUp FY11 Not assigned
P124067 UG: ICT Policy FY11 Not assigned
Source: WB Business Intelligence Table 8.3.1 as of 2/2/16
Annex Table 5: IEG Project Ratings for Uganda, FY11-15
Exit FY
Proj ID Project name Total
Evaluated ($M)
IEG Outcome IEG Risk to DO
2011 P065437 UG-PAMSU SIL (FY03) 32.0 MODERATELY
SATISFACTORY MODERATE
2011 P101232 UG-PRSC 8 100.9 MODERATELY
SATISFACTORY MODERATE
2012 P069208 UG - Power Sector Dev.
Project (FY07) 306.4
MODERATELY SATISFACTORY
HIGH
2012 P074079 UG-Road Dev APL 3
(FY05) 113.5
MODERATELY SATISFACTORY
MODERATE
2012 P079925 UG-Natl Re Dev TAL
(FY04) 31.1
MODERATELY SATISFACTORY
HIGH
2012 P117979 UG-Financial Sector DPL
(1 of 2) 48.7
MODERATELY UNSATISFACTORY
SIGNIFICANT
2013 P083809 UG-Priv Sec
Competitiveness 2 50.7
MODERATELY UNSATISFACTORY
MODERATE
2013 P086513 UG-Millennium Science
Init (FY06) 32.2 SATISFACTORY SIGNIFICANT
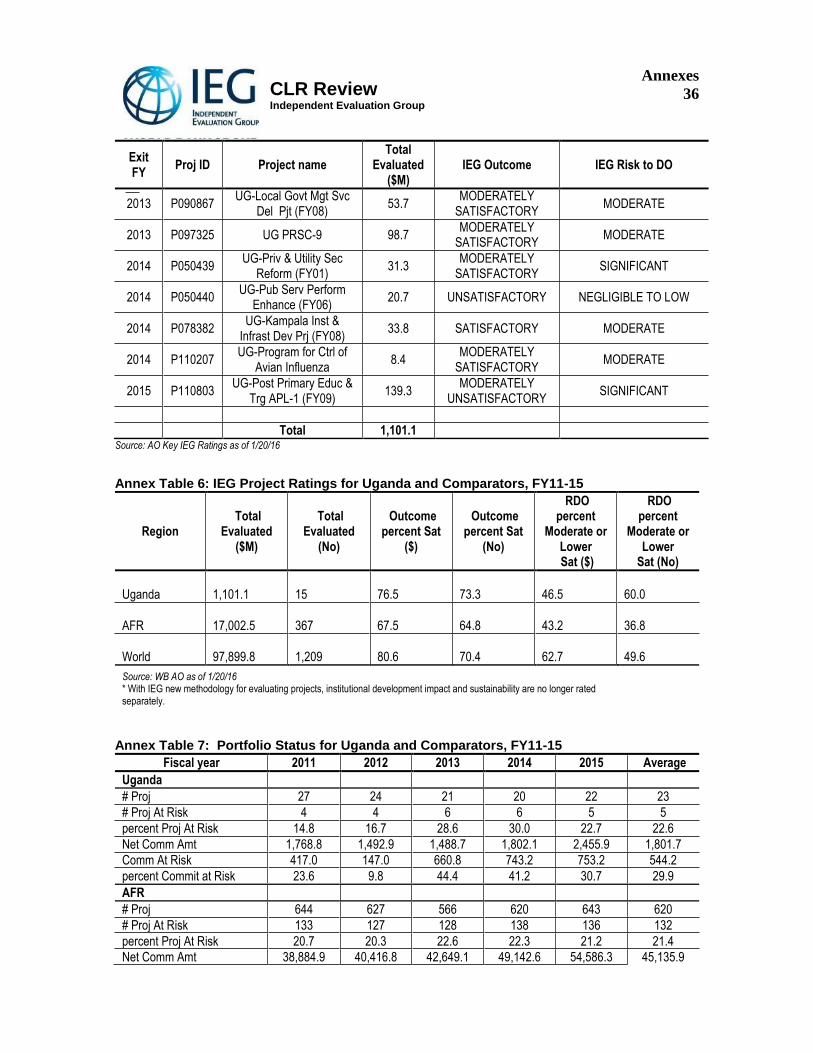
Annexes
36 CLR Review Independent Evaluation Group
Exit FY
Proj ID Project name Total
Evaluated ($M)
IEG Outcome IEG Risk to DO
2013 P090867 UG-Local Govt Mgt Svc
Del Pjt (FY08) 53.7
MODERATELY SATISFACTORY
MODERATE
2013 P097325 UG PRSC-9 98.7 MODERATELY
SATISFACTORY MODERATE
2014 P050439 UG-Priv & Utility Sec
Reform (FY01) 31.3
MODERATELY SATISFACTORY
SIGNIFICANT
2014 P050440 UG-Pub Serv Perform
Enhance (FY06) 20.7 UNSATISFACTORY NEGLIGIBLE TO LOW
2014 P078382 UG-Kampala Inst &
Infrast Dev Prj (FY08) 33.8 SATISFACTORY MODERATE
2014 P110207 UG-Program for Ctrl of
Avian Influenza 8.4
MODERATELY SATISFACTORY
MODERATE
2015 P110803 UG-Post Primary Educ &
Trg APL-1 (FY09) 139.3
MODERATELY UNSATISFACTORY
SIGNIFICANT
Total 1,101.1 Source: AO Key IEG Ratings as of 1/20/16
Annex Table 6: IEG Project Ratings for Uganda and Comparators, FY11-15
Region Total
Evaluated ($M)
Total Evaluated
(No)
Outcome percent Sat
($)
Outcome percent Sat
(No)
RDO percent
Moderate or Lower Sat ($)
RDO percent
Moderate or Lower
Sat (No)
Uganda 1,101.1 15 76.5 73.3 46.5 60.0
AFR 17,002.5 367 67.5 64.8 43.2 36.8
World 97,899.8 1,209 80.6 70.4 62.7 49.6
Source: WB AO as of 1/20/16 * With IEG new methodology for evaluating projects, institutional development impact and sustainability are no longer ratedseparately.
Annex Table 7: Portfolio Status for Uganda and Comparators, FY11-15
Fiscal year 2011 2012 2013 2014 2015 Average
Uganda
# Proj 27 24 21 20 22 23
# Proj At Risk 4 4 6 6 5 5
percent Proj At Risk 14.8 16.7 28.6 30.0 22.7 22.6
Net Comm Amt 1,768.8 1,492.9 1,488.7 1,802.1 2,455.9 1,801.7
Comm At Risk 417.0 147.0 660.8 743.2 753.2 544.2
percent Commit at Risk 23.6 9.8 44.4 41.2 30.7 29.9
AFR
# Proj 644 627 566 620 643 620
# Proj At Risk 133 127 128 138 136 132
percent Proj At Risk 20.7 20.3 22.6 22.3 21.2 21.4
Net Comm Amt 38,884.9 40,416.8 42,649.1 49,142.6 54,586.3 45,135.9
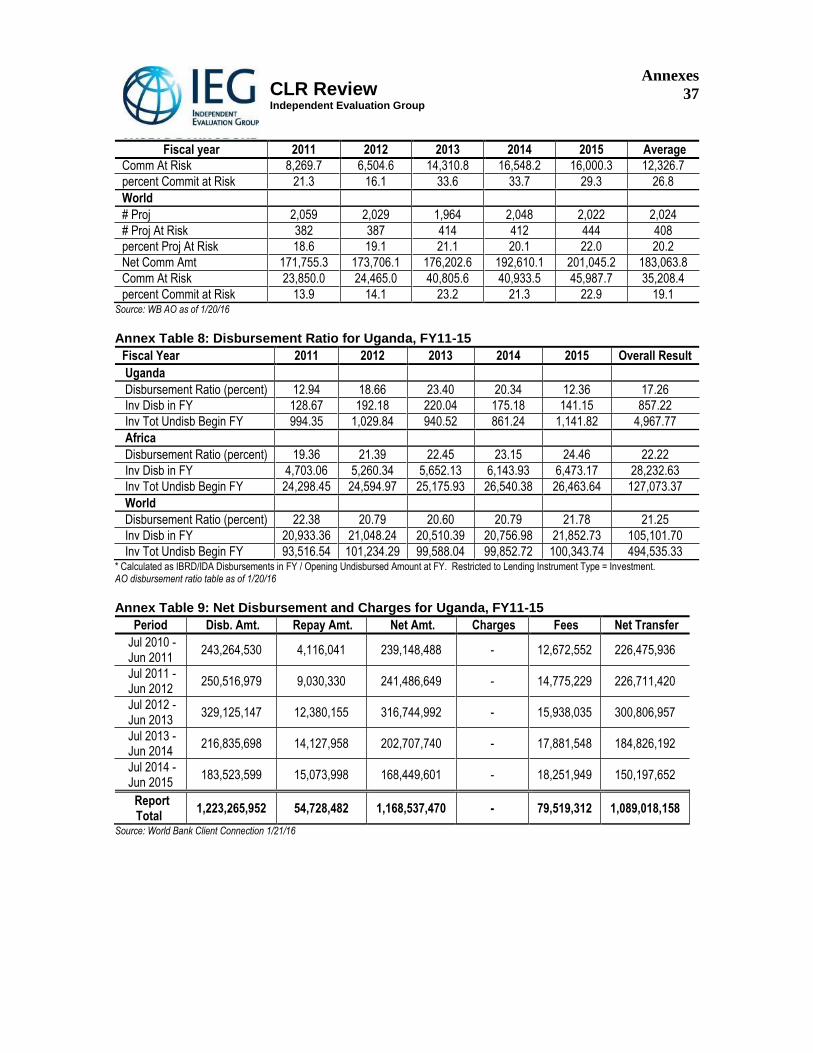
Annexes
37
CLR Review Independent Evaluation Group
Fiscal year 2011 2012 2013 2014 2015 Average
Comm At Risk 8,269.7 6,504.6 14,310.8 16,548.2 16,000.3 12,326.7
percent Commit at Risk 21.3 16.1 33.6 33.7 29.3 26.8
World
# Proj 2,059 2,029 1,964 2,048 2,022 2,024
# Proj At Risk 382 387 414 412 444 408
percent Proj At Risk 18.6 19.1 21.1 20.1 22.0 20.2
Net Comm Amt 171,755.3 173,706.1 176,202.6 192,610.1 201,045.2 183,063.8
Comm At Risk 23,850.0 24,465.0 40,805.6 40,933.5 45,987.7 35,208.4
percent Commit at Risk 13.9 14.1 23.2 21.3 22.9 19.1 Source: WB AO as of 1/20/16
Annex Table 8: Disbursement Ratio for Uganda, FY11-15
Fiscal Year 2011 2012 2013 2014 2015 Overall Result
Uganda
Disbursement Ratio (percent) 12.94 18.66 23.40 20.34 12.36 17.26
Inv Disb in FY 128.67 192.18 220.04 175.18 141.15 857.22
Inv Tot Undisb Begin FY 994.35 1,029.84 940.52 861.24 1,141.82 4,967.77
Africa
Disbursement Ratio (percent) 19.36 21.39 22.45 23.15 24.46 22.22
Inv Disb in FY 4,703.06 5,260.34 5,652.13 6,143.93 6,473.17 28,232.63
Inv Tot Undisb Begin FY 24,298.45 24,594.97 25,175.93 26,540.38 26,463.64 127,073.37
World
Disbursement Ratio (percent) 22.38 20.79 20.60 20.79 21.78 21.25
Inv Disb in FY 20,933.36 21,048.24 20,510.39 20,756.98 21,852.73 105,101.70
Inv Tot Undisb Begin FY 93,516.54 101,234.29 99,588.04 99,852.72 100,343.74 494,535.33 * Calculated as IBRD/IDA Disbursements in FY / Opening Undisbursed Amount at FY. Restricted to Lending Instrument Type = Investment. AO disbursement ratio table as of 1/20/16
Annex Table 9: Net Disbursement and Charges for Uganda, FY11-15
Period Disb. Amt. Repay Amt. Net Amt. Charges Fees Net Transfer
Jul 2010 - Jun 2011
243,264,530 4,116,041 239,148,488 - 12,672,552 226,475,936
Jul 2011 - Jun 2012
250,516,979 9,030,330 241,486,649 - 14,775,229 226,711,420
Jul 2012 - Jun 2013
329,125,147 12,380,155 316,744,992 - 15,938,035 300,806,957
Jul 2013 - Jun 2014
216,835,698 14,127,958 202,707,740 - 17,881,548 184,826,192
Jul 2014 - Jun 2015
183,523,599 15,073,998 168,449,601 - 18,251,949 150,197,652
Report Total
1,223,265,952 54,728,482 1,168,537,470 - 79,519,312 1,089,018,158
Source: World Bank Client Connection 1/21/16
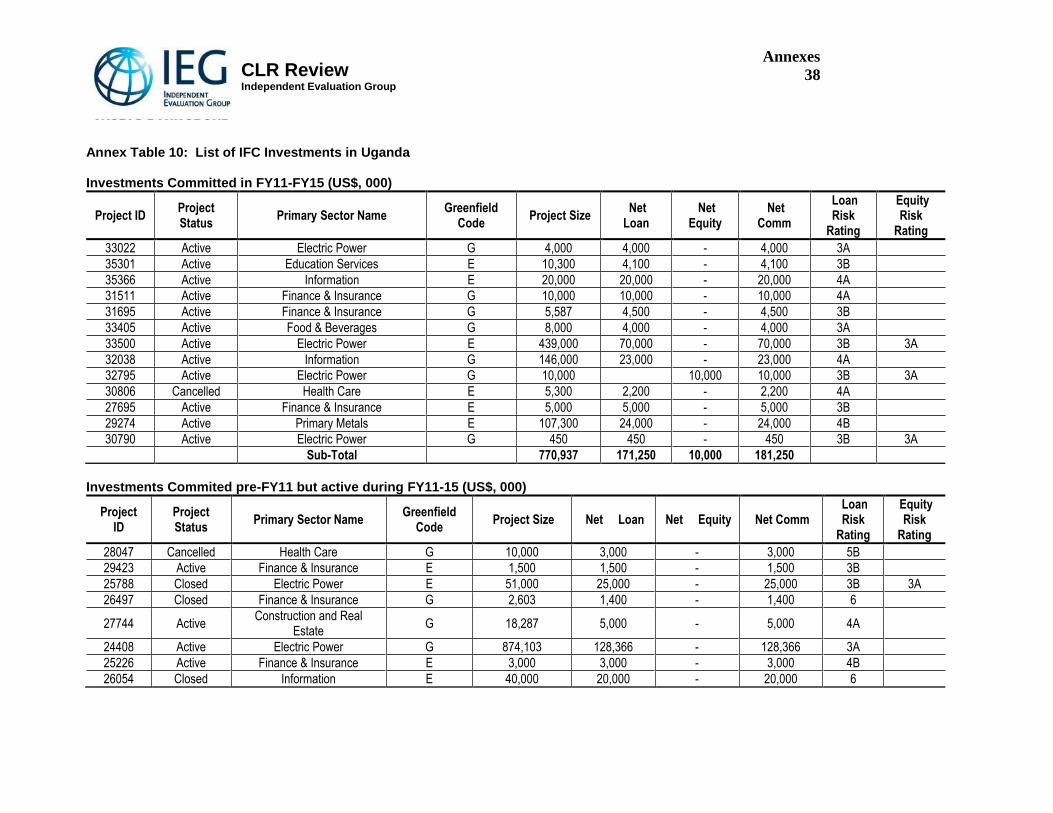
Annexes
38
CLR Review Independent Evaluation Group
Annex Table 10: List of IFC Investments in Uganda Investments Committed in FY11-FY15 (US$, 000)
Project ID Project Status
Primary Sector Name Greenfield
Code Project Size
Net Loan
Net Equity
Net Comm
Loan Risk
Rating
Equity Risk
Rating
33022 Active Electric Power G 4,000 4,000 - 4,000 3A
35301 Active Education Services E 10,300 4,100 - 4,100 3B
35366 Active Information E 20,000 20,000 - 20,000 4A
31511 Active Finance & Insurance G 10,000 10,000 - 10,000 4A
31695 Active Finance & Insurance G 5,587 4,500 - 4,500 3B
33405 Active Food & Beverages G 8,000 4,000 - 4,000 3A
33500 Active Electric Power E 439,000 70,000 - 70,000 3B 3A
32038 Active Information G 146,000 23,000 - 23,000 4A
32795 Active Electric Power G 10,000 10,000 10,000 3B 3A
30806 Cancelled Health Care E 5,300 2,200 - 2,200 4A
27695 Active Finance & Insurance E 5,000 5,000 - 5,000 3B
29274 Active Primary Metals E 107,300 24,000 - 24,000 4B
30790 Active Electric Power G 450 450 - 450 3B 3A
Sub-Total 770,937 171,250 10,000 181,250
Investments Commited pre-FY11 but active during FY11-15 (US$, 000)
Project ID
Project Status
Primary Sector Name Greenfield
Code Project Size Net Loan Net Equity Net Comm
Loan Risk
Rating
Equity Risk
Rating
28047 Cancelled Health Care G 10,000 3,000 - 3,000 5B
29423 Active Finance & Insurance E 1,500 1,500 - 1,500 3B
25788 Closed Electric Power E 51,000 25,000 - 25,000 3B 3A
26497 Closed Finance & Insurance G 2,603 1,400 - 1,400 6
27744 Active Construction and Real
Estate G 18,287 5,000 - 5,000 4A
24408 Active Electric Power G 874,103 128,366 - 128,366 3A
25226 Active Finance & Insurance E 3,000 3,000 - 3,000 4B
26054 Closed Information E 40,000 20,000 - 20,000 6
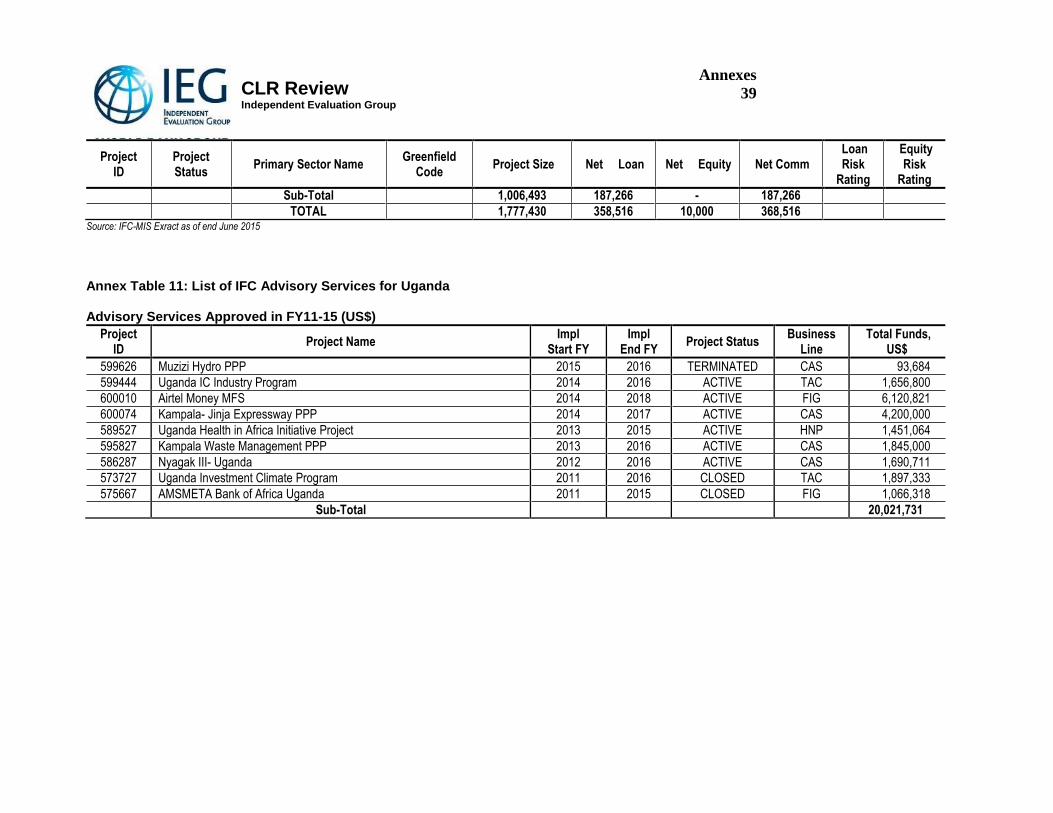
Annexes
39
CLR Review Independent Evaluation Group
Project ID
Project Status
Primary Sector Name Greenfield
Code Project Size Net Loan Net Equity Net Comm
Loan Risk
Rating
Equity Risk
Rating
Sub-Total 1,006,493 187,266 - 187,266
TOTAL 1,777,430 358,516 10,000 368,516 Source: IFC-MIS Exract as of end June 2015
Annex Table 11: List of IFC Advisory Services for Uganda Advisory Services Approved in FY11-15 (US$)
Project ID
Project Name Impl
Start FY Impl
End FY Project Status
Business Line
Total Funds, US$
599626 Muzizi Hydro PPP 2015 2016 TERMINATED CAS 93,684
599444 Uganda IC Industry Program 2014 2016 ACTIVE TAC 1,656,800
600010 Airtel Money MFS 2014 2018 ACTIVE FIG 6,120,821
600074 Kampala- Jinja Expressway PPP 2014 2017 ACTIVE CAS 4,200,000
589527 Uganda Health in Africa Initiative Project 2013 2015 ACTIVE HNP 1,451,064
595827 Kampala Waste Management PPP 2013 2016 ACTIVE CAS 1,845,000
586287 Nyagak III- Uganda 2012 2016 ACTIVE CAS 1,690,711
573727 Uganda Investment Climate Program 2011 2016 CLOSED TAC 1,897,333
575667 AMSMETA Bank of Africa Uganda 2011 2015 CLOSED FIG 1,066,318
Sub-Total 20,021,731
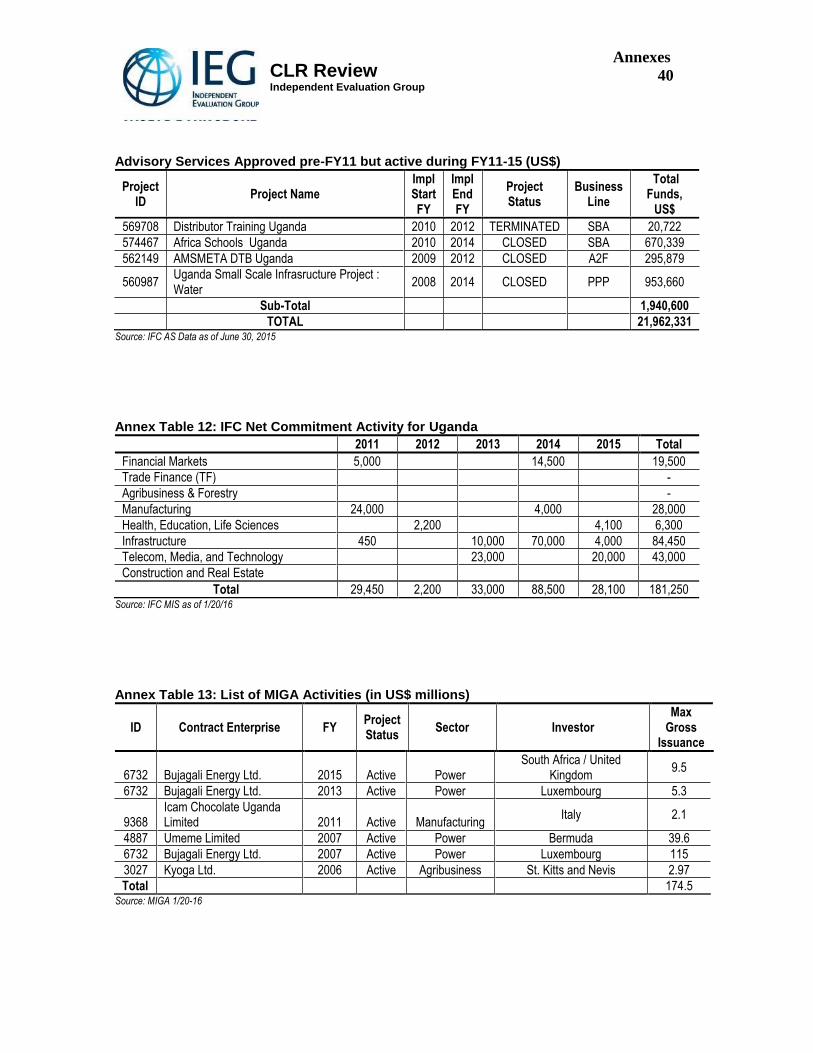
Annexes
40 CLR Review Independent Evaluation Group
Advisory Services Approved pre-FY11 but active during FY11-15 (US$)
Project ID
Project Name Impl Start FY
Impl End FY
Project Status
Business Line
Total Funds,
US$
569708 Distributor Training Uganda 2010 2012 TERMINATED SBA 20,722
574467 Africa Schools Uganda 2010 2014 CLOSED SBA 670,339
562149 AMSMETA DTB Uganda 2009 2012 CLOSED A2F 295,879
560987 Uganda Small Scale Infrasructure Project : Water
2008 2014 CLOSED PPP 953,660
Sub-Total 1,940,600
TOTAL 21,962,331 Source: IFC AS Data as of June 30, 2015
Annex Table 12: IFC Net Commitment Activity for Uganda
2011 2012 2013 2014 2015 Total
Financial Markets 5,000 14,500 19,500
Trade Finance (TF) -
Agribusiness & Forestry -
Manufacturing 24,000 4,000 28,000
Health, Education, Life Sciences 2,200 4,100 6,300
Infrastructure 450 10,000 70,000 4,000 84,450
Telecom, Media, and Technology 23,000 20,000 43,000
Construction and Real Estate
Total 29,450 2,200 33,000 88,500 28,100 181,250 Source: IFC MIS as of 1/20/16
Annex Table 13: List of MIGA Activities (in US$ millions)
ID Contract Enterprise FY Project Status
Sector Investor Max
Gross Issuance
6732 Bujagali Energy Ltd. 2015 Active Power South Africa / United
Kingdom 9.5
6732 Bujagali Energy Ltd. 2013 Active Power Luxembourg 5.3
9368 Icam Chocolate Uganda Limited 2011 Active Manufacturing
Italy 2.1
4887 Umeme Limited 2007 Active Power Bermuda 39.6
6732 Bujagali Energy Ltd. 2007 Active Power Luxembourg 115
3027 Kyoga Ltd. 2006 Active Agribusiness St. Kitts and Nevis 2.97
Total 174.5 Source: MIGA 1/20-16
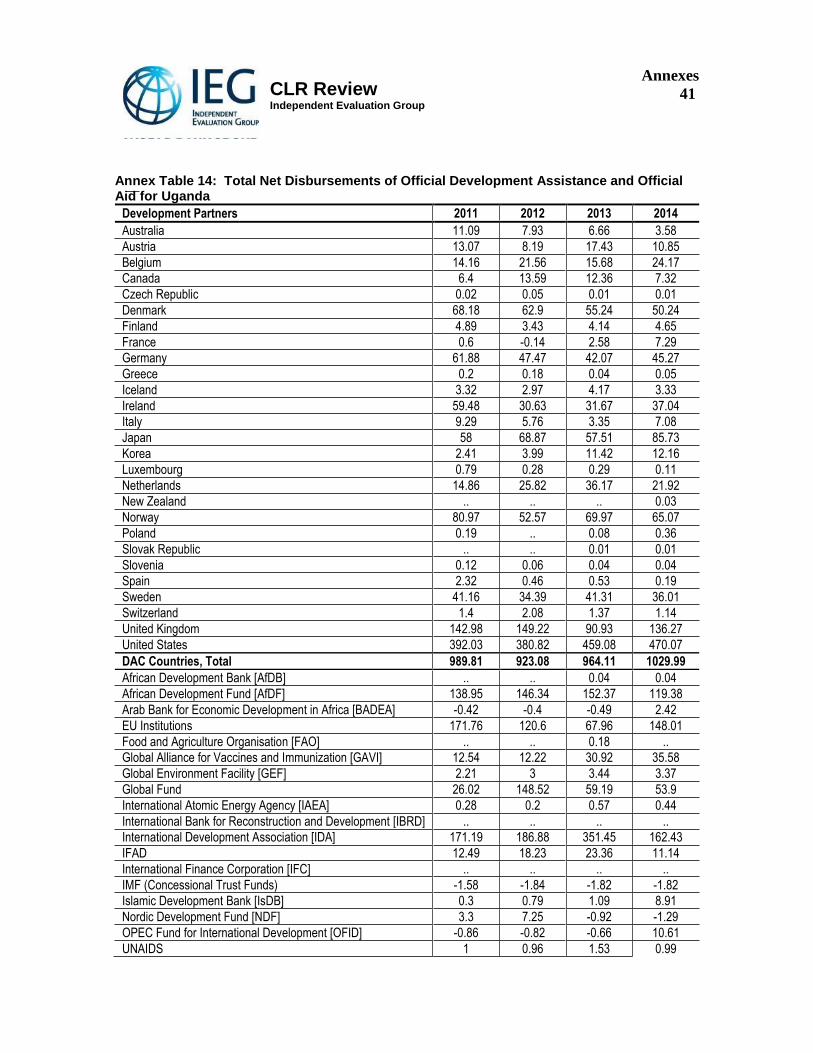
Annexes
41
CLR Review Independent Evaluation Group
Annex Table 14: Total Net Disbursements of Official Development Assistance and Official Aid for Uganda
Development Partners 2011 2012 2013 2014
Australia 11.09 7.93 6.66 3.58
Austria 13.07 8.19 17.43 10.85
Belgium 14.16 21.56 15.68 24.17
Canada 6.4 13.59 12.36 7.32
Czech Republic 0.02 0.05 0.01 0.01
Denmark 68.18 62.9 55.24 50.24
Finland 4.89 3.43 4.14 4.65
France 0.6 -0.14 2.58 7.29
Germany 61.88 47.47 42.07 45.27
Greece 0.2 0.18 0.04 0.05
Iceland 3.32 2.97 4.17 3.33
Ireland 59.48 30.63 31.67 37.04
Italy 9.29 5.76 3.35 7.08
Japan 58 68.87 57.51 85.73
Korea 2.41 3.99 11.42 12.16
Luxembourg 0.79 0.28 0.29 0.11
Netherlands 14.86 25.82 36.17 21.92
New Zealand .. .. .. 0.03
Norway 80.97 52.57 69.97 65.07
Poland 0.19 .. 0.08 0.36
Slovak Republic .. .. 0.01 0.01
Slovenia 0.12 0.06 0.04 0.04
Spain 2.32 0.46 0.53 0.19
Sweden 41.16 34.39 41.31 36.01
Switzerland 1.4 2.08 1.37 1.14
United Kingdom 142.98 149.22 90.93 136.27
United States 392.03 380.82 459.08 470.07
DAC Countries, Total 989.81 923.08 964.11 1029.99
African Development Bank [AfDB] .. .. 0.04 0.04
African Development Fund [AfDF] 138.95 146.34 152.37 119.38
Arab Bank for Economic Development in Africa [BADEA] -0.42 -0.4 -0.49 2.42
EU Institutions 171.76 120.6 67.96 148.01
Food and Agriculture Organisation [FAO] .. .. 0.18 ..
Global Alliance for Vaccines and Immunization [GAVI] 12.54 12.22 30.92 35.58
Global Environment Facility [GEF] 2.21 3 3.44 3.37
Global Fund 26.02 148.52 59.19 53.9
International Atomic Energy Agency [IAEA] 0.28 0.2 0.57 0.44
International Bank for Reconstruction and Development [IBRD] .. .. .. ..
International Development Association [IDA] 171.19 186.88 351.45 162.43
IFAD 12.49 18.23 23.36 11.14
International Finance Corporation [IFC] .. .. .. ..
IMF (Concessional Trust Funds) -1.58 -1.84 -1.82 -1.82
Islamic Development Bank [IsDB] 0.3 0.79 1.09 8.91
Nordic Development Fund [NDF] 3.3 7.25 -0.92 -1.29
OPEC Fund for International Development [OFID] -0.86 -0.82 -0.66 10.61
UNAIDS 1 0.96 1.53 0.99
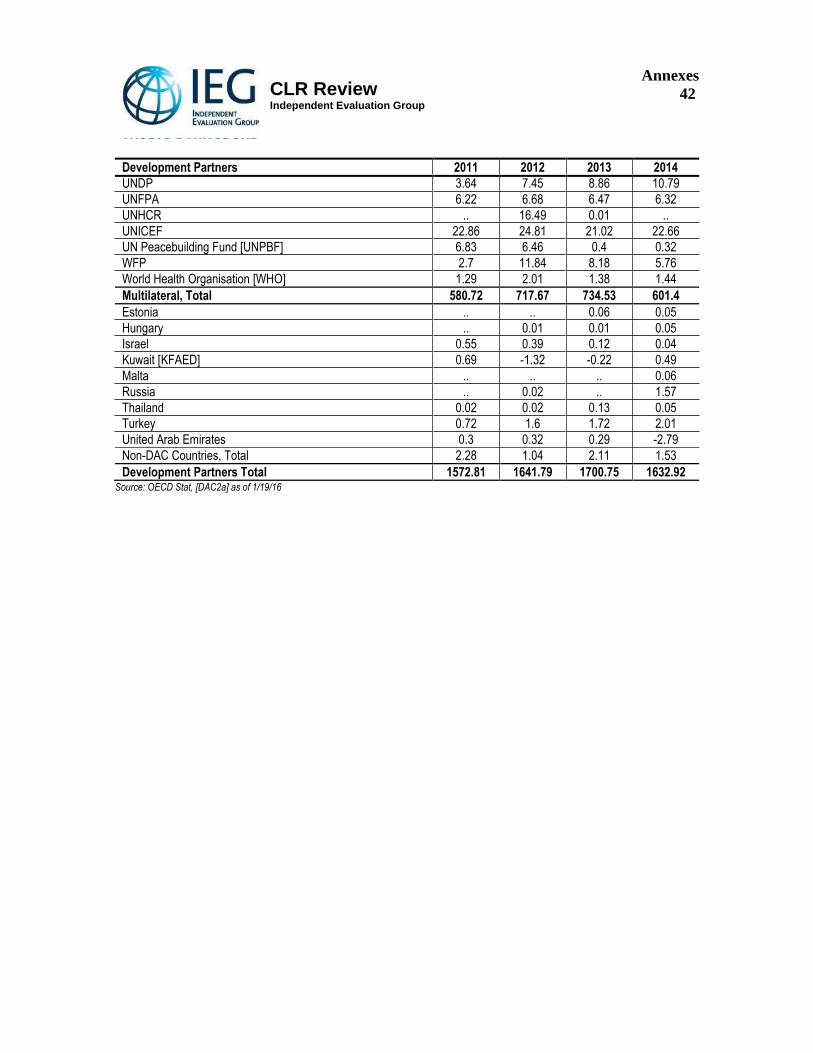
Annexes
42 CLR Review Independent Evaluation Group
Development Partners 2011 2012 2013 2014
UNDP 3.64 7.45 8.86 10.79
UNFPA 6.22 6.68 6.47 6.32
UNHCR .. 16.49 0.01 ..
UNICEF 22.86 24.81 21.02 22.66
UN Peacebuilding Fund [UNPBF] 6.83 6.46 0.4 0.32
WFP 2.7 11.84 8.18 5.76
World Health Organisation [WHO] 1.29 2.01 1.38 1.44
Multilateral, Total 580.72 717.67 734.53 601.4
Estonia .. .. 0.06 0.05
Hungary .. 0.01 0.01 0.05
Israel 0.55 0.39 0.12 0.04
Kuwait [KFAED] 0.69 -1.32 -0.22 0.49
Malta .. .. .. 0.06
Russia .. 0.02 .. 1.57
Thailand 0.02 0.02 0.13 0.05
Turkey 0.72 1.6 1.72 2.01
United Arab Emirates 0.3 0.32 0.29 -2.79
Non-DAC Countries, Total 2.28 1.04 2.11 1.53
Development Partners Total 1572.81 1641.79 1700.75 1632.92 Source: OECD Stat, [DAC2a] as of 1/19/16
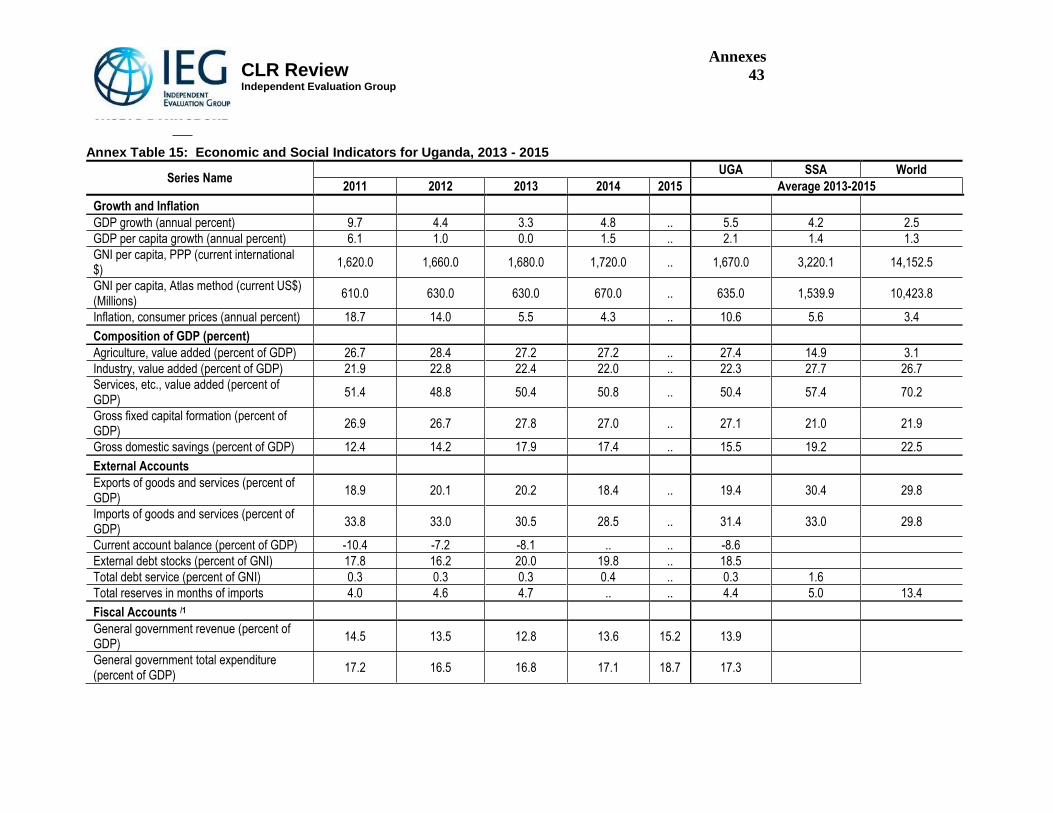
Annexes
43
CLR Review Independent Evaluation Group
Annex Table 15: Economic and Social Indicators for Uganda, 2013 - 2015
Series Name UGA SSA World
2011 2012 2013 2014 2015 Average 2013-2015
Growth and Inflation GDP growth (annual percent) 9.7 4.4 3.3 4.8 .. 5.5 4.2 2.5
GDP per capita growth (annual percent) 6.1 1.0 0.0 1.5 .. 2.1 1.4 1.3
GNI per capita, PPP (current international $)
1,620.0 1,660.0 1,680.0 1,720.0 .. 1,670.0 3,220.1 14,152.5
GNI per capita, Atlas method (current US$) (Millions)
610.0 630.0 630.0 670.0 .. 635.0 1,539.9 10,423.8
Inflation, consumer prices (annual percent) 18.7 14.0 5.5 4.3 .. 10.6 5.6 3.4
Composition of GDP (percent) Agriculture, value added (percent of GDP) 26.7 28.4 27.2 27.2 .. 27.4 14.9 3.1
Industry, value added (percent of GDP) 21.9 22.8 22.4 22.0 .. 22.3 27.7 26.7
Services, etc., value added (percent of GDP)
51.4 48.8 50.4 50.8 .. 50.4 57.4 70.2
Gross fixed capital formation (percent of GDP)
26.9 26.7 27.8 27.0 .. 27.1 21.0 21.9
Gross domestic savings (percent of GDP) 12.4 14.2 17.9 17.4 .. 15.5 19.2 22.5
External Accounts Exports of goods and services (percent of GDP)
18.9 20.1 20.2 18.4 .. 19.4 30.4 29.8
Imports of goods and services (percent of GDP)
33.8 33.0 30.5 28.5 .. 31.4 33.0 29.8
Current account balance (percent of GDP) -10.4 -7.2 -8.1 .. .. -8.6
External debt stocks (percent of GNI) 17.8 16.2 20.0 19.8 .. 18.5
Total debt service (percent of GNI) 0.3 0.3 0.3 0.4 .. 0.3 1.6
Total reserves in months of imports 4.0 4.6 4.7 .. .. 4.4 5.0 13.4
Fiscal Accounts /1 General government revenue (percent of GDP)
14.5 13.5 12.8 13.6 15.2 13.9
General government total expenditure (percent of GDP)
17.2 16.5 16.8 17.1 18.7 17.3
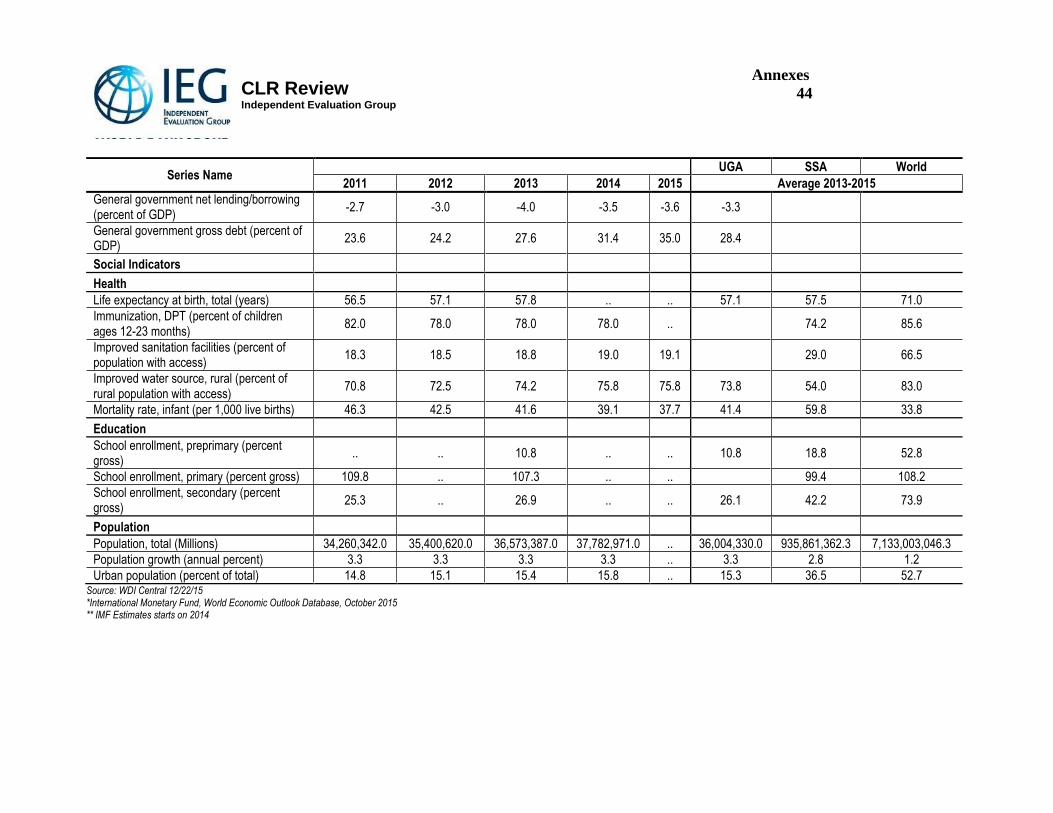
Annexes
44
CLR Review Independent Evaluation Group
Series Name UGA SSA World
2011 2012 2013 2014 2015 Average 2013-2015
General government net lending/borrowing (percent of GDP)
-2.7 -3.0 -4.0 -3.5 -3.6 -3.3
General government gross debt (percent of GDP)
23.6 24.2 27.6 31.4 35.0 28.4
Social Indicators
Health Life expectancy at birth, total (years) 56.5 57.1 57.8 .. .. 57.1 57.5 71.0
Immunization, DPT (percent of children ages 12-23 months)
82.0 78.0 78.0 78.0 .. 74.2 85.6
Improved sanitation facilities (percent of population with access)
18.3 18.5 18.8 19.0 19.1 29.0 66.5
Improved water source, rural (percent of rural population with access)
70.8 72.5 74.2 75.8 75.8 73.8 54.0 83.0
Mortality rate, infant (per 1,000 live births) 46.3 42.5 41.6 39.1 37.7 41.4 59.8 33.8
Education School enrollment, preprimary (percent gross)
.. .. 10.8 .. .. 10.8 18.8 52.8
School enrollment, primary (percent gross) 109.8 .. 107.3 .. .. 99.4 108.2
School enrollment, secondary (percent gross)
25.3 .. 26.9 .. .. 26.1 42.2 73.9
Population Population, total (Millions) 34,260,342.0 35,400,620.0 36,573,387.0 37,782,971.0 .. 36,004,330.0 935,861,362.3 7,133,003,046.3
Population growth (annual percent) 3.3 3.3 3.3 3.3 .. 3.3 2.8 1.2
Urban population (percent of total) 14.8 15.1 15.4 15.8 .. 15.3 36.5 52.7 Source: WDI Central 12/22/15 *International Monetary Fund, World Economic Outlook Database, October 2015 ** IMF Estimates starts on 2014