Embed Size (px)
Citation preview

Club Licensing Benchmarking Report FY2010 & Financial Fair PlayMedia Day – House of European Football, Nyon
25 January 2012

Agenda
• What is the UEFA Club Licensing Benchmarking Report FY2010
Nyon, 25 January 2012
• Highlights of the FY2010 Report
• Next steps

What is the Benchmarking Report?
• The purpose of the report is to paint a comparative m ap of football in Europe across many dimensions:
• Financial, sporting, and licensing perspectives
• In addition to the updated financial figures, this e dition contains:
• Analysis of youth participation
• Examination of head coach profiles and migration
• Exclusive chapter on transfers
Nyon, 25 January 2012

Club Licensing
• Another 4 clubs sportingly qualified for the UEFA Champions League or Europa League were refused entry due to licensing grounds;
• 31 in total from 2004/05 to 2011/12
Nyon, 25 January 2012

Attendances
• Approximately 100 clubs filled their stadium 75% to capacity on average, more than half of these from Germany, England and the Netherlands.
• Over 101 million fans attended domestic club championship matches in Europe;
Nyon, 25 January 2012
• 22 of 48 top divisions (45%) with comparable data recorded an increase in attendances in 2010/11;

Long term investments
• 96% of club head coaches have obtained a UEFA approved coaching licence from their national association;
• 53% is the proportion of minutes played by locally trained players during the 2010/11 competitions
Nyon, 25 January 2012

Youth participation
• U21 players have also increased their presence on the pitch in both the UCL and domestically.
• Despite players moving clubs more often, the average number of club trained players on the pitch during UEFA Champions League group stage matches has increased to 2.5 from 2.1 ten years ago;
Nyon, 25 January 2012
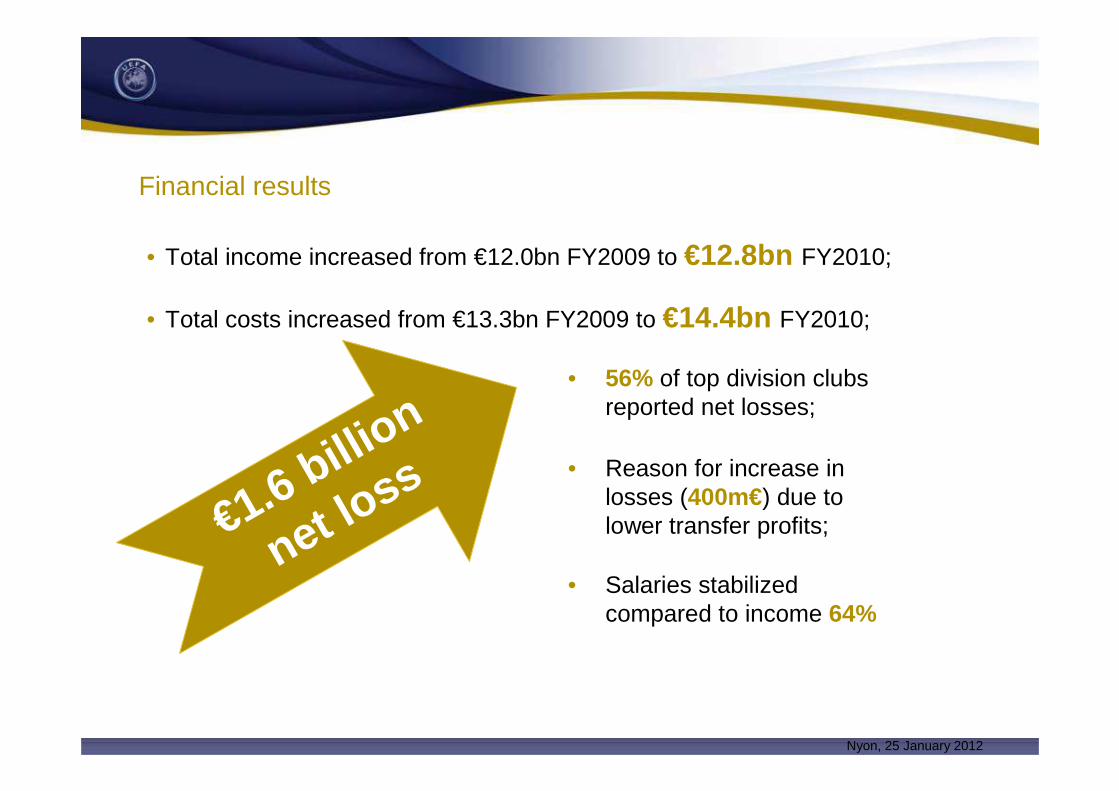
Financial results
• Total income increased from €12.0bn FY2009 to €12.8bn FY2010;
• Total costs increased from €13.3bn FY2009 to €14.4bn FY2010;
€1.6 billion
net loss
• 56% of top division clubs reported net losses;
• Reason for increase in losses (400m€) due to lower transfer profits;
Nyon, 25 January 2012
• Salaries stabilized compared to income 64%
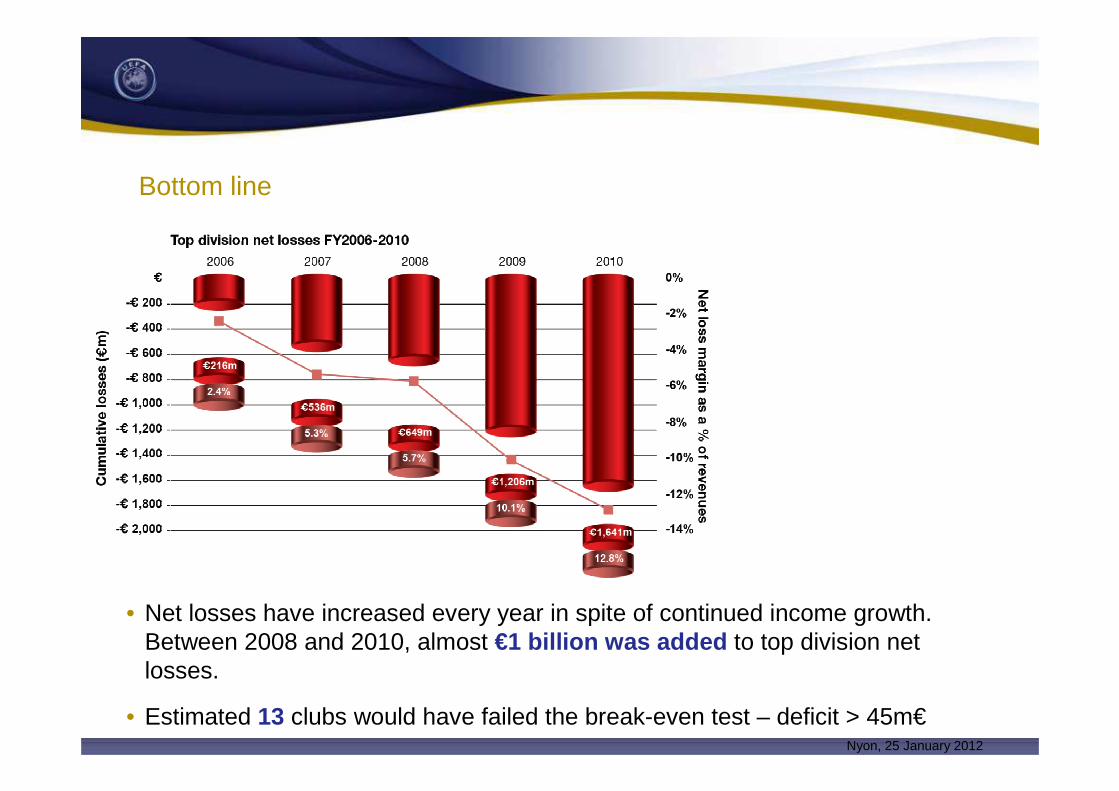
Bottom line
Nyon, 25 January 2012
• Net losses have increased every year in spite of continued income growth. Between 2008 and 2010, almost €1 billion was added to top division net losses.
• Estimated 13 clubs would have failed the break-even test – deficit > 45m€

Financial Fair Play rules
• Soft-implementation on break-even requirement started November 2011;
• Continuous cooperation with the clubs and ECA;
• The test exercise will concern the financial years 2009, 2010 and 2011;
• 18 countries and 39 clubs voluntarily taking part in this test exercise;
• Financial Fair Play rules implemented over a staged approach;
• Overdue payables monitored as from June 2011;
• Full implementation of the break even requirement as from 2012 with first assessment that will be done during the 2013/14 season.
Nyon, 25 January 2012
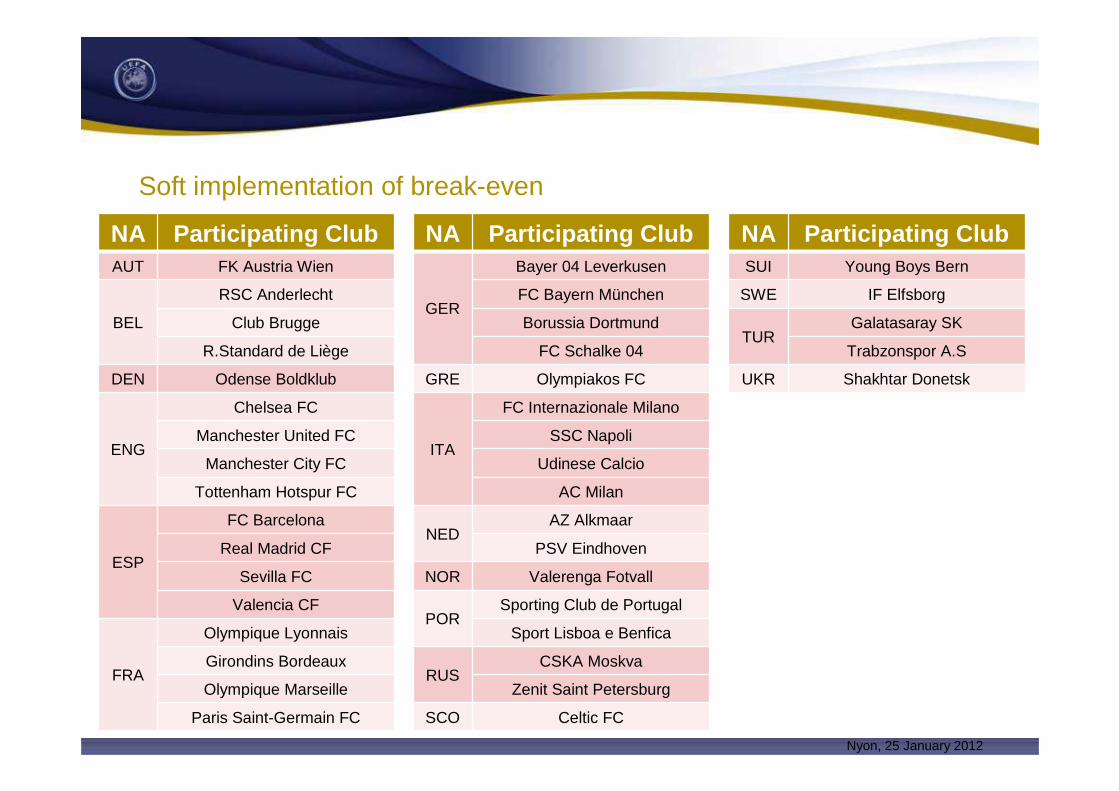
Soft implementation of break-even
NA Participating ClubAUT FK Austria Wien
BEL
RSC Anderlecht
Club Brugge
R.Standard de Liège
DEN Odense Boldklub
ENG
Chelsea FC
Manchester United FC
Manchester City FC
Tottenham Hotspur FC
ESP
FC Barcelona
Real Madrid CF
Sevilla FC
Valencia CF
FRA
Olympique Lyonnais
Girondins Bordeaux
Olympique Marseille
Paris Saint-Germain FC
NA Participating Club
GER
Bayer 04 Leverkusen
FC Bayern München
Borussia Dortmund
FC Schalke 04
GRE Olympiakos FC
ITA
FC Internazionale Milano
SSC Napoli
Udinese Calcio
AC Milan
NEDAZ Alkmaar
PSV Eindhoven
NOR Valerenga Fotvall
PORSporting Club de Portugal
Sport Lisboa e Benfica
RUSCSKA Moskva
Zenit Saint Petersburg
SCO Celtic FC
NA Participating ClubSUI Young Boys Bern
SWE IF Elfsborg
TURGalatasaray SK
Trabzonspor A.S
UKR Shakhtar Donetsk
Nyon, 25 January 2012

Next steps
• Full implementation of the IT tool to collect financial data from clubs in June 2012;
• Continuous training of football clubs and national associations;
• Put in place of all necessary infrastructure to cope with this important project;
• Continuous dialogue and cooperation with EU institutions;
• Strengthening the role of the Club Financial Control Panel – statutory amendments to be approved at next UEFA Congress in Istanbul
Nyon, 25 January 2012

The regulations and the monitoring process

The regulations
• Approved by UEFA EXCO on 27 May 2010;
• The regulations have been discussed with all stakeholders and in particular the clubs (ECA).
Nyon, 25 January 2012

The club licensing and financial fair play objectives
• Protect the integrity of the competitions;• Encourage clubs to operate on the basis of their own
revenues;• Encourage responsible spending for the long-term
benefit of football in infrastructures and youth football;• Ensure that clubs competing in European competitions
have paid their debts towards other clubs and employees;
• Protect the long-term viability and sustainability of European club football.
Nyon, 25 January 2012

Enhanced Overdue Payables and Future Financial Information
Nyon, 25 January 2012
• All clubs competing in UEFA competitions are requested to submit information on overdue payables as at 30.06;
• Clubs presenting warning signs are again requested to submit information on overdue payables as at 30.09;
• Clubs presenting warning signs are requested to also submit FFI
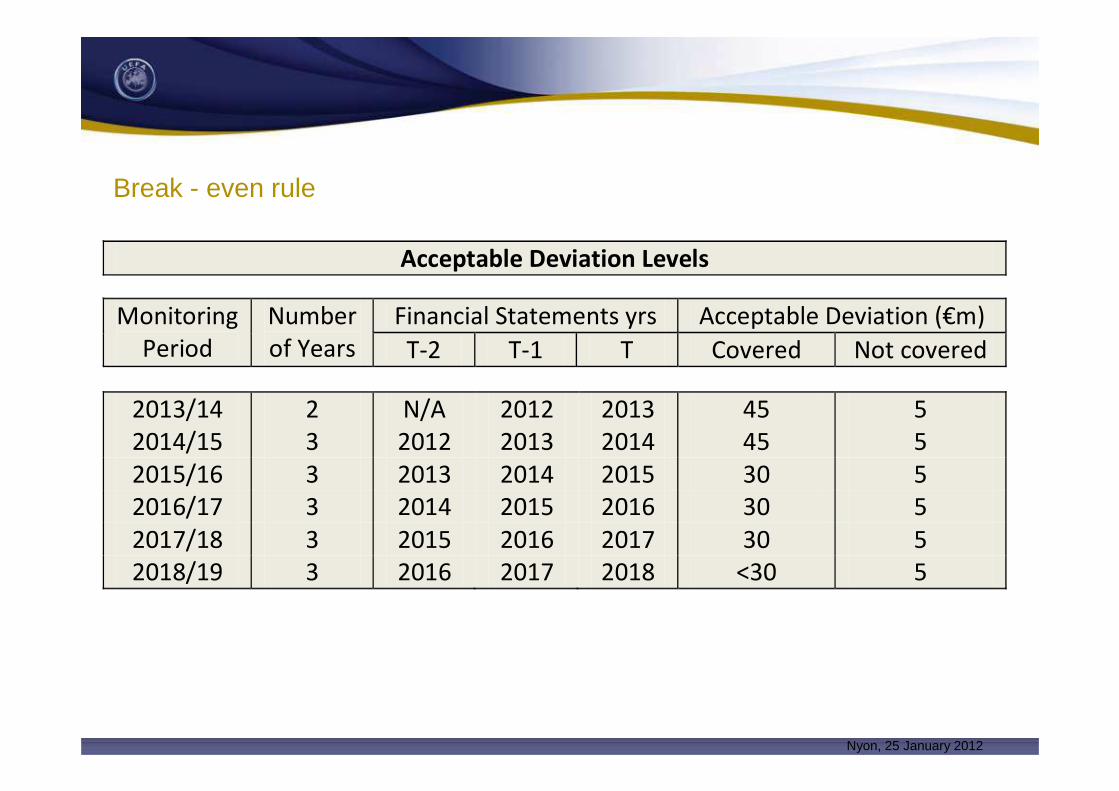
Break - even rule
Nyon, 25 January 2012
Monitoring
Period
Number
of Years
Financial Statements yrs Acceptable Deviation (€m)
T-2 T-1 T Covered Not covered
Acceptable Deviation Levels
2013/14 2 N/A 2012 2013 45 5
2014/15 3 2012 2013 2014 45 5
2015/16 3 2013 2014 2015 30 5
2016/17 3 2014 2015 2016 30 5
2017/18 3 2015 2016 2017 30 5
2018/19 3 2016 2017 2018 <30 5
Proposed amendments to the UEFA Statutes
Club Financial Control Panel
Club Financial Control Body
• CFCB to become part of UEFA’s Organs for the Administration of Justice;
• Competence over Club Licensing and Financial Fair Play matters;
• Appeal against the decision of the CFCB will be made directly to the CAS.
Nyon, 25 January 2012

Potential sanctions
Nyon, 25 January 2012
• Reprimand / Warning
• Fine
• Witholding of revenues from a UEFA competition
• Deduction of points
• Exclusion from future competitions
• Prohibition to register new players in UEFA competitions;
• A restriction on the number of players that a club may register for participation in UEFA competitions
• Disqualification from a competition in progress
Shaded blue new sanctions – still to be approved by UEFA Congress next March

January
February
March
April
May
June
July
August
September
October
November
December
2012
Licensing decisionsby national licensors for 2012/13 season
January
February
March
April
May
June
July
August
September
October
November
December
2013
Licensing decisionsby national licensors for 2013/14 season
Submission overdue payables
information as at 30.06
Submission overdue payables
information as at 30.09 + FFI
Initial submission of break-even
information (FY2012)
Submission overdue payables information
as at 30.06
Submission overdue payables information
as at 30.09 + FFI
January
February
March
April
May
June
July
August
September
October
November
December
2014
Submission overdue payables
information as at 30.06
Submission overdue payables
information as at 30.09 + FFI
Licensing decisions by national licensors for
2014/15 season
Decisions on break-even rule
Submission of break-even information
(FY2013)
Key dates

The financial state of football

Club Incomes
Nyon, 25 January 2012
• Total income increased from €12.0bn FY2009 to €12.8bn FY2010;
• This represented a 6.6%increase over FY2009

How do incomes differ
Nyon, 25 January 2012
• ‘Top’ clubs represent 13% of the 734 top division clubs but generate 67% of revenue ;
• Divisions with the fastest growing revenue are in Russia, Turkey and Ukraine;

Club costs
Nyon, 25 January 2012
• The average percentage of income spent on employee costs, 64%, decreased slightly from FY2009 after four years of increasing percentages;
• Total costs increased 9.3% from €13.2bn in FY2009 to €14.4bn in FY2010

Employee costs
Nyon, 25 January 2012
• There are still 78 clubs spending over 100% of revenues on wages and 254 spent over 70%;
• In FY2010 only 7 top divisions had averages over 80%, down from 11 in FY2009;

How does player spending differ
Nyon, 25 January 2012
• The ten largest spending clubs incurred personnel costs and net transfer costs of €2,196m which was 96% more than the next ten clubs
• These top ten clubs accounted for 24% of all top European division personnel costs

The trends
Nyon, 25 January 2012
• Over the past five years, revenues have increased approximately 9.1% per year with broadcasting driving the growth at 12.4% per year
• Combined employee and net transfer costs grew at an average annual rate of 14.%

Bottom line
Nyon, 25 January 2012
• Net losses have increased every year in spite of continued income growth. Between 2008 and 2010, almost €1 billion was added to top division net losses;
• 52% of clubs had their balance sheet deteriorate during FY2010 by an aggregate of €1,510m

What proportion of clubs are loss making?
Nyon, 25 January 2012
• Clubs in nearly all top divisions contributed to the 36% increase in net losses over FY2009 and 153% over FY2008;
• However the “green” clubs in all countries also means it is possible to break-even and record profits
• 56% loss making clubs
• 65% loss making clubs in UEL and UCL

Preparing for financial fair play
Nyon, 25 January 2012
• 22 countries have at least one club (67 in total) with combined deficits of more than €5m; out of those 67, 13 clubs reported combined deficits of more than €45m
• Clubs from ALL countries are already being monitored for overdue payables;
• As of 30 September 2011, clubs competing in UEFA competitions reported a total of more than €100m deferred payables;
• 90% of clubs competing in UEFA competitions fulfilled the BE criterion

THANK YOU