Embed Size (px)
Citation preview
The World Bank
Cluster 7/Module 1 (C7/M1): Energy Efficiency Issues.
This presentation is one of the support materials prepared for the capacity building program Building Leaders in Urban Transport Planning (LUTP).
Support for LUTP was provided by:
• The World Bank
• Australian Agency for International Development Aid
• The Energy Sector Management Assistance Program (ESMAP), and
• Public-Private Infrastructure Advisory Facility (PPIAF).
The World Bank
Urban transport is rapidly becoming one of the world’s most significant consumers of
energy. The main sources of this energy are non-renewable petroleum based fuels.
The purpose of this module is to understand:
-What factors impact the energy efficiency of urban transport?
-What strategies can be adopted to make urban transport less energy intensive?
Slide 2
The World Bank
Slide 3
This exercise is designed to get you to start thinking about strategies for making urban
transport less energy intensive. Common solutions are to improve the energy efficiency of
transport vehicles and to reduce congestion and needless vehicle idling.
However, in recent years, cities also have been thinking about demand management
strategies that reduce travel demand. The logic is that if demand is less, than so will be
energy consumption.
What kind of measures could you adopt in your city to make people travel less? List 3 such
measures.
Take about 5 minutes to do this exercise.
The World Bank
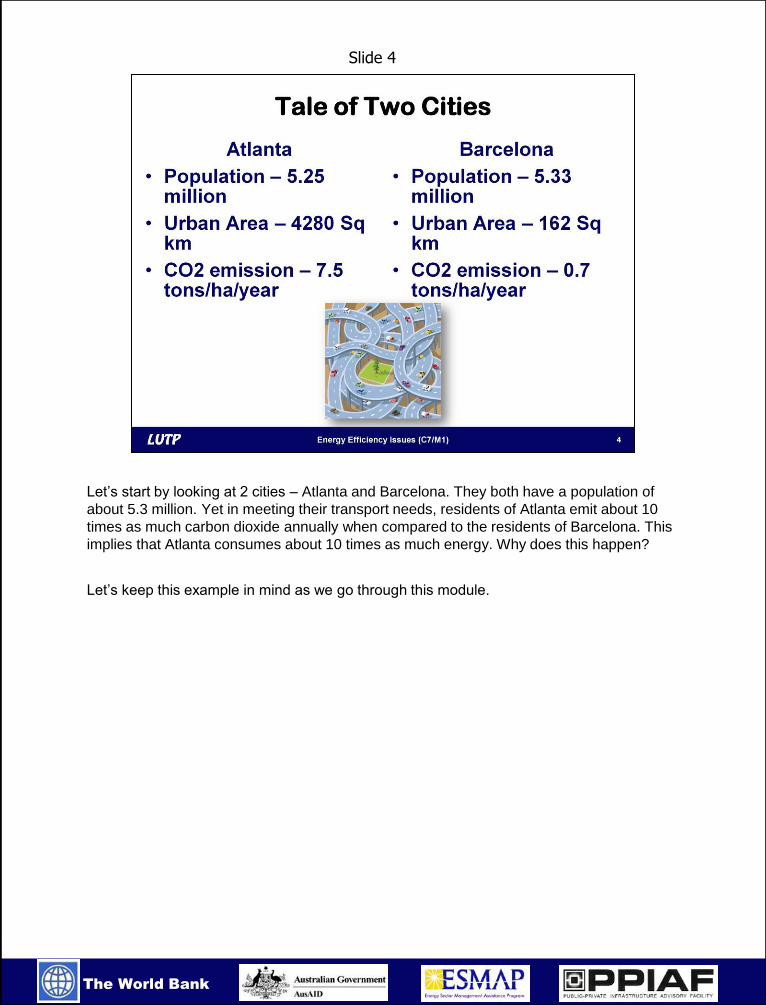
Let’s start by looking at 2 cities – Atlanta and Barcelona. They both have a population of
about 5.3 million. Yet in meeting their transport needs, residents of Atlanta emit about 10
times as much carbon dioxide annually when compared to the residents of Barcelona. This
implies that Atlanta consumes about 10 times as much energy. Why does this happen?
Let’s keep this example in mind as we go through this module.
Slide 4
The World Bank
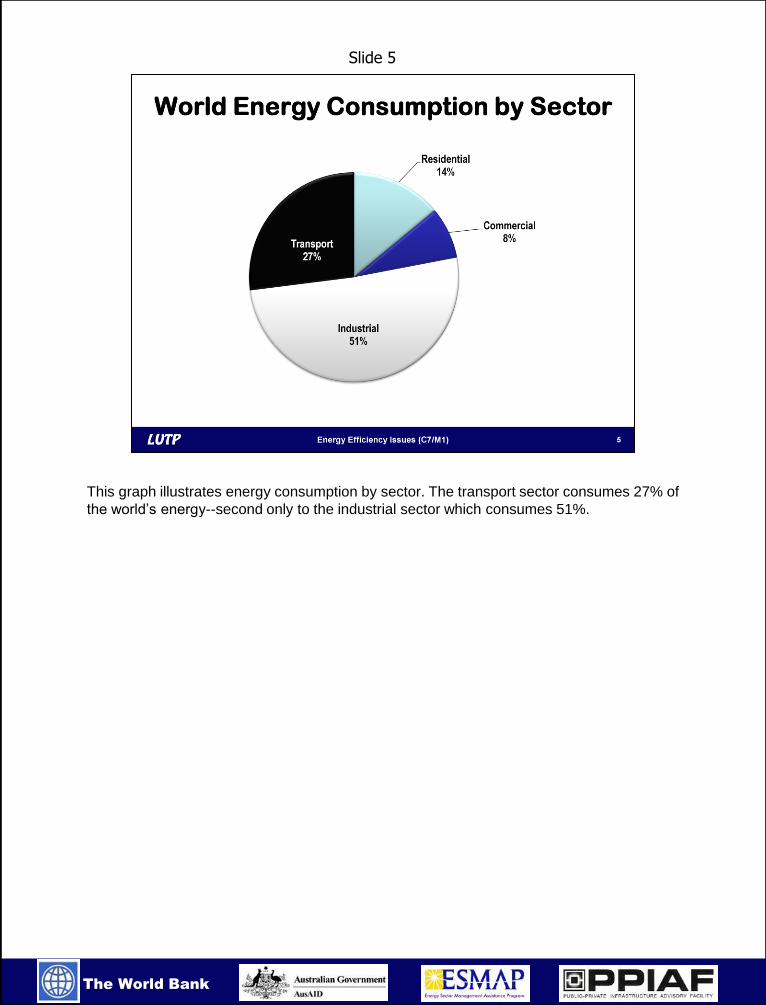
This graph illustrates energy consumption by sector. The transport sector consumes 27% of
the world’s energy--second only to the industrial sector which consumes 51%.
Slide 5
The World Bank
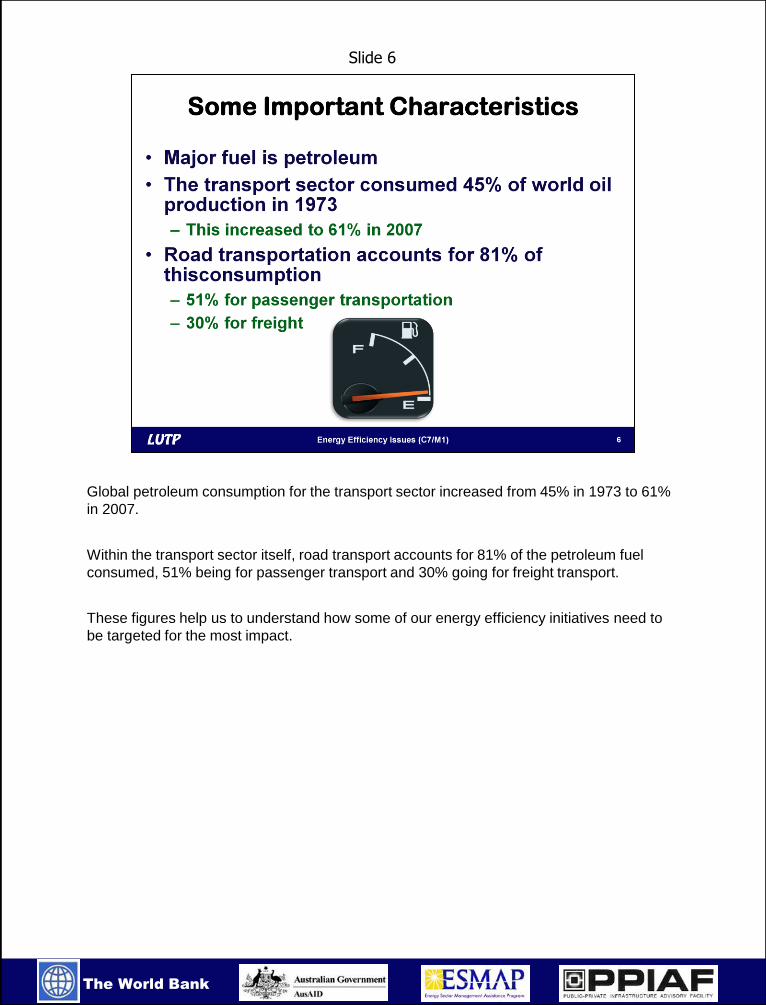
Global petroleum consumption for the transport sector increased from 45% in 1973 to 61%
in 2007.
Within the transport sector itself, road transport accounts for 81% of the petroleum fuel
consumed, 51% being for passenger transport and 30% going for freight transport.
These figures help us to understand how some of our energy efficiency initiatives need to
be targeted for the most impact.
Slide 6
The World Bank
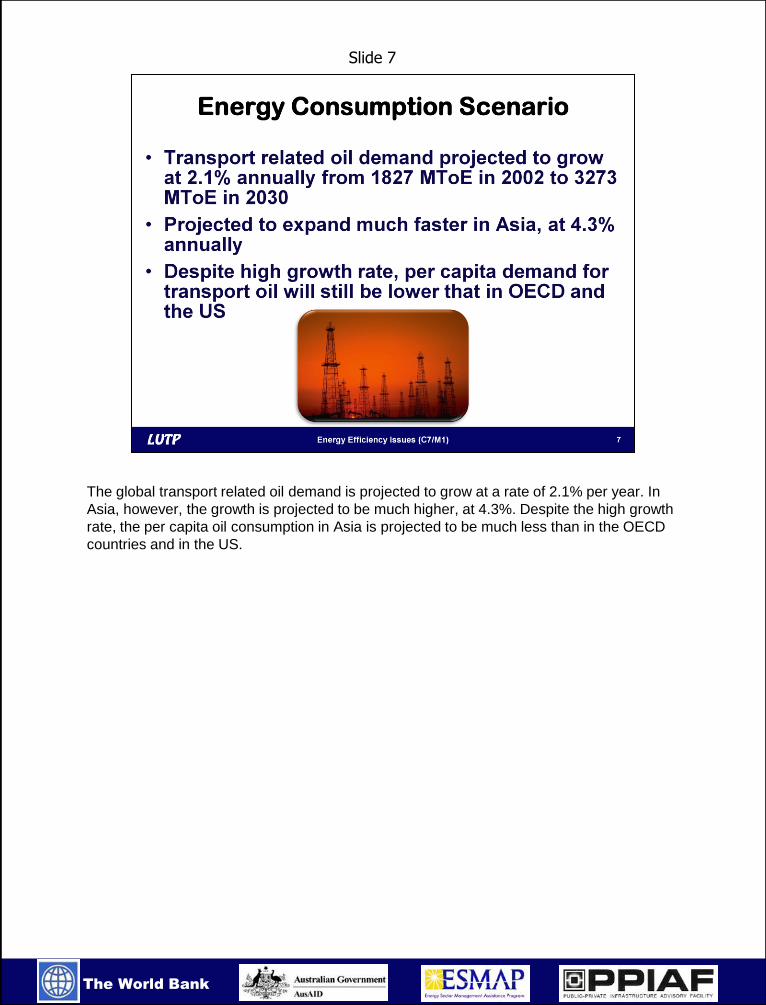
The global transport related oil demand is projected to grow at a rate of 2.1% per year. In
Asia, however, the growth is projected to be much higher, at 4.3%. Despite the high growth
rate, the per capita oil consumption in Asia is projected to be much less than in the OECD
countries and in the US.
Slide 7
The World Bank
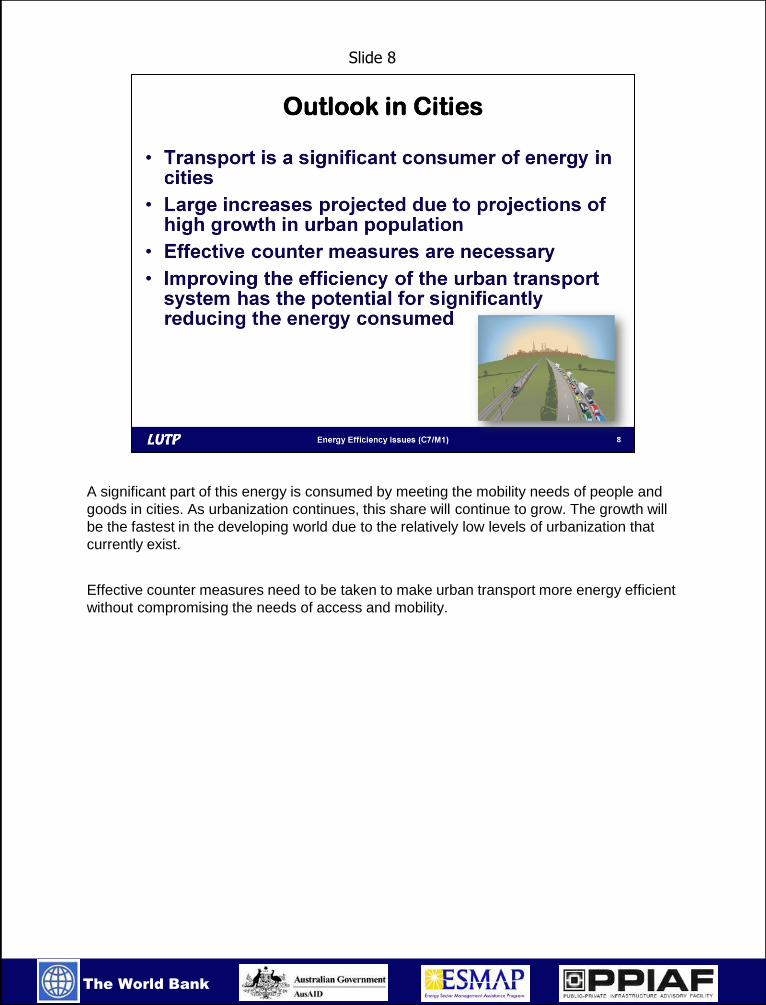
A significant part of this energy is consumed by meeting the mobility needs of people and
goods in cities. As urbanization continues, this share will continue to grow. The growth will
be the fastest in the developing world due to the relatively low levels of urbanization that
currently exist.
Effective counter measures need to be taken to make urban transport more energy efficient
without compromising the needs of access and mobility.
Slide 8
The World Bank
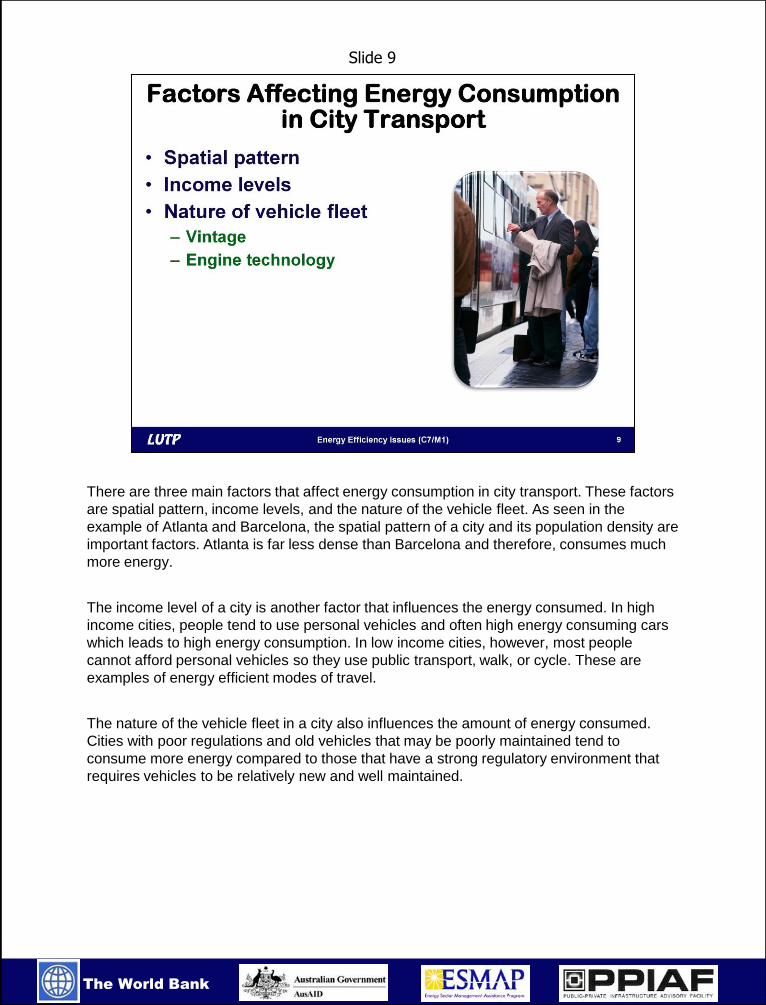
There are three main factors that affect energy consumption in city transport. These factors
are spatial pattern, income levels, and the nature of the vehicle fleet. As seen in the
example of Atlanta and Barcelona, the spatial pattern of a city and its population density are
important factors. Atlanta is far less dense than Barcelona and therefore, consumes much
more energy.
The income level of a city is another factor that influences the energy consumed. In high
income cities, people tend to use personal vehicles and often high energy consuming cars
which leads to high energy consumption. In low income cities, however, most people
cannot afford personal vehicles so they use public transport, walk, or cycle. These are
examples of energy efficient modes of travel.
The nature of the vehicle fleet in a city also influences the amount of energy consumed.
Cities with poor regulations and old vehicles that may be poorly maintained tend to
consume more energy compared to those that have a strong regulatory environment that
requires vehicles to be relatively new and well maintained.
Slide 9
The World Bank
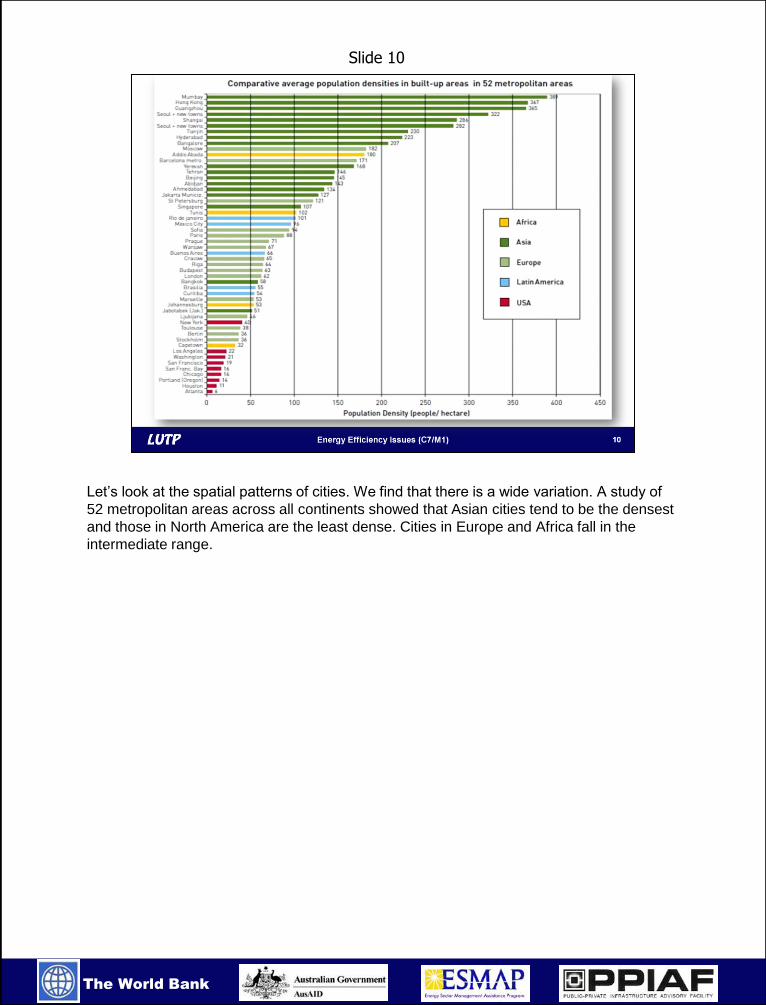
Let’s look at the spatial patterns of cities. We find that there is a wide variation. A study of
52 metropolitan areas across all continents showed that Asian cities tend to be the densest
and those in North America are the least dense. Cities in Europe and Africa fall in the
intermediate range.
Slide 10
The World Bank
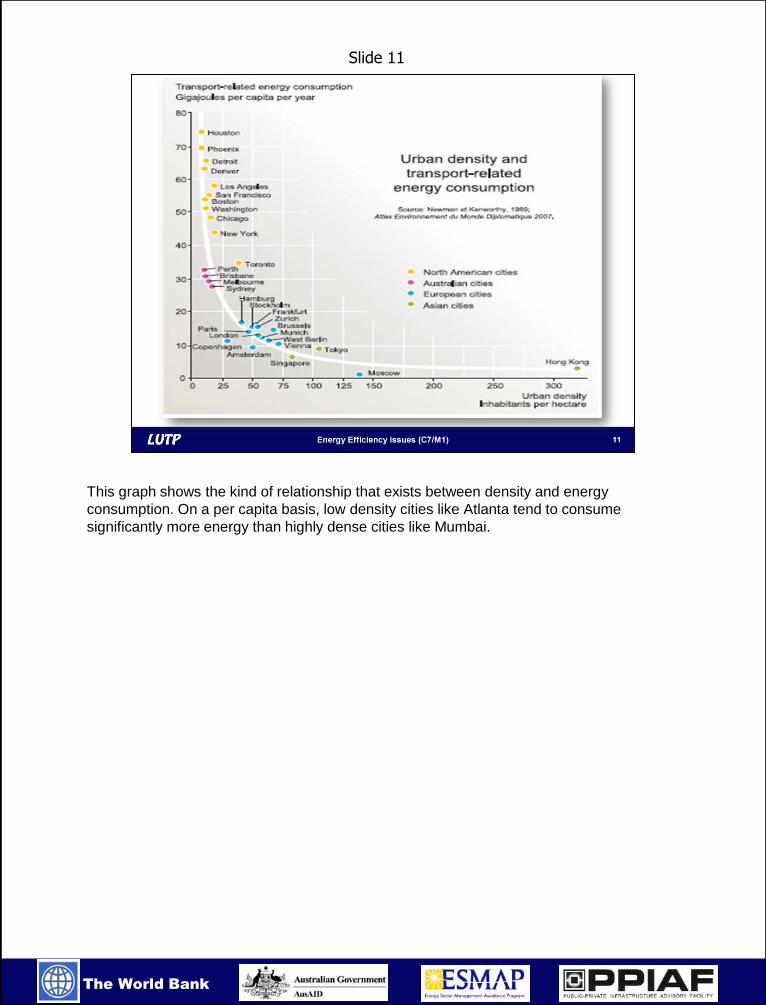
This graph shows the kind of relationship that exists between density and energy
consumption. On a per capita basis, low density cities like Atlanta tend to consume
significantly more energy than highly dense cities like Mumbai.
Slide 11
The World Bank
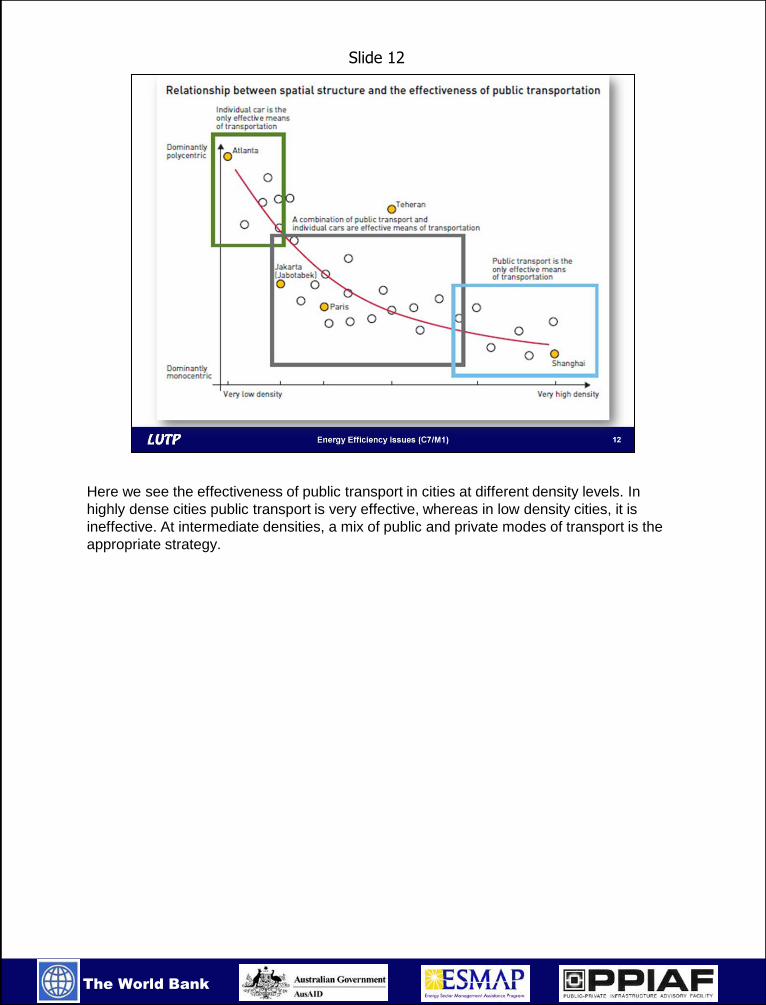
Here we see the effectiveness of public transport in cities at different density levels. In
highly dense cities public transport is very effective, whereas in low density cities, it is
ineffective. At intermediate densities, a mix of public and private modes of transport is the
appropriate strategy.
Slide 12
The World Bank
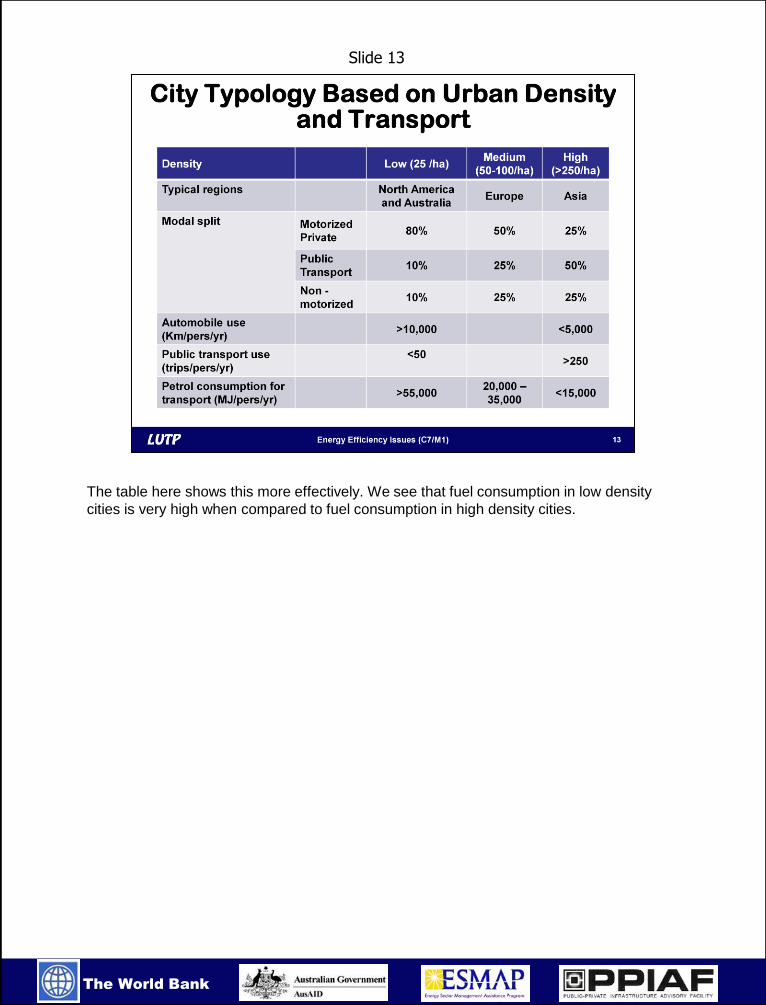
The table here shows this more effectively. We see that fuel consumption in low density
cities is very high when compared to fuel consumption in high density cities.
Slide 13
The World Bank
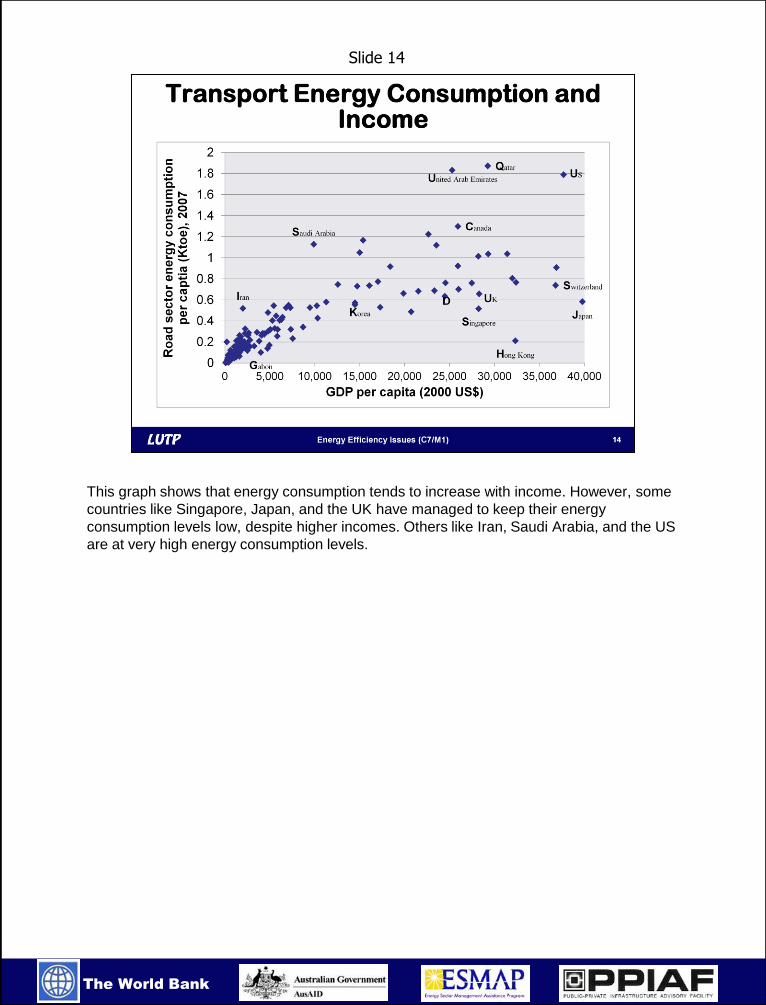
This graph shows that energy consumption tends to increase with income. However, some
countries like Singapore, Japan, and the UK have managed to keep their energy
consumption levels low, despite higher incomes. Others like Iran, Saudi Arabia, and the US
are at very high energy consumption levels.
Slide 14
The World Bank
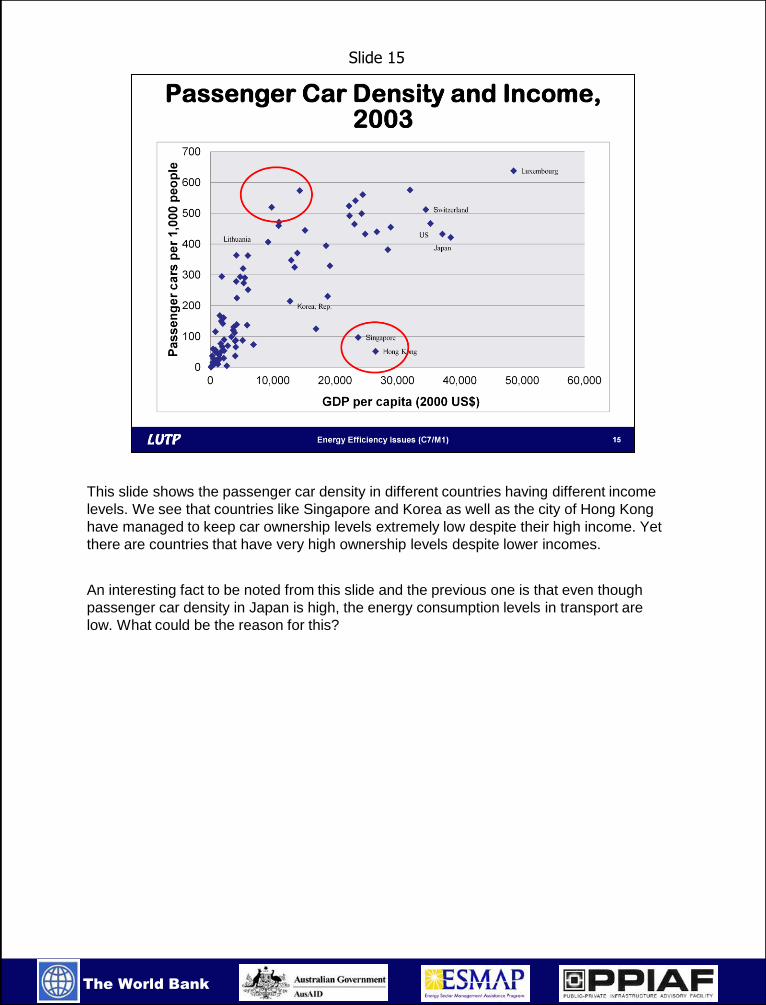
This slide shows the passenger car density in different countries having different income
levels. We see that countries like Singapore and Korea as well as the city of Hong Kong
have managed to keep car ownership levels extremely low despite their high income. Yet
there are countries that have very high ownership levels despite lower incomes.
An interesting fact to be noted from this slide and the previous one is that even though
passenger car density in Japan is high, the energy consumption levels in transport are
low. What could be the reason for this?
Slide 15
The World Bank
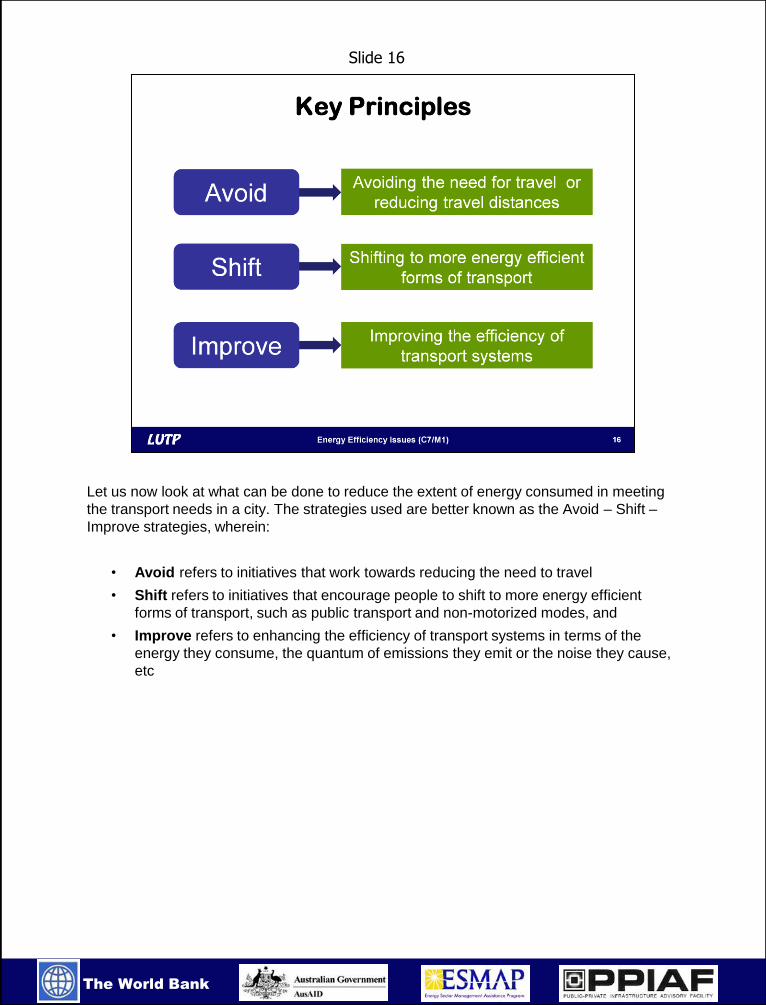
Let us now look at what can be done to reduce the extent of energy consumed in meeting
the transport needs in a city. The strategies used are better known as the Avoid – Shift –
Improve strategies, wherein:
• Avoid refers to initiatives that work towards reducing the need to travel
• Shift refers to initiatives that encourage people to shift to more energy efficient
forms of transport, such as public transport and non-motorized modes, and
• Improve refers to enhancing the efficiency of transport systems in terms of the
energy they consume, the quantum of emissions they emit or the noise they cause,
etc
Slide 16
The World Bank
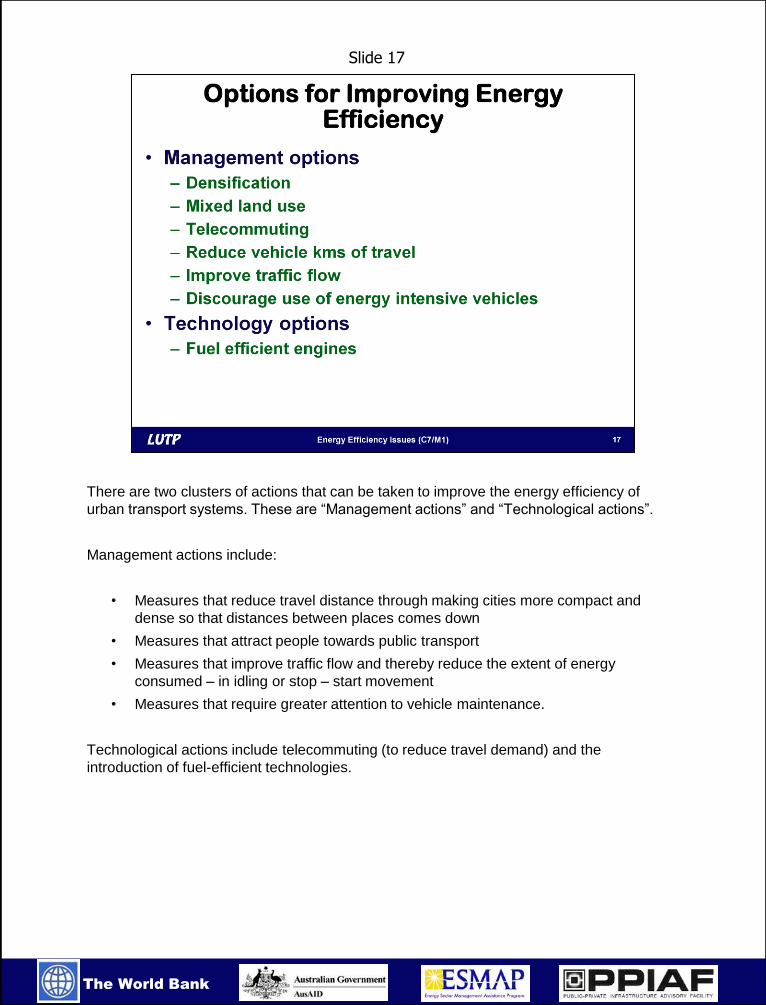
There are two clusters of actions that can be taken to improve the energy efficiency of
urban transport systems. These are “Management actions” and “Technological actions”.
Management actions include:
• Measures that reduce travel distance through making cities more compact and
dense so that distances between places comes down
• Measures that attract people towards public transport
• Measures that improve traffic flow and thereby reduce the extent of energy
consumed – in idling or stop – start movement
• Measures that require greater attention to vehicle maintenance.
Technological actions include telecommuting (to reduce travel demand) and the
introduction of fuel-efficient technologies.
Slide 17
The World Bank
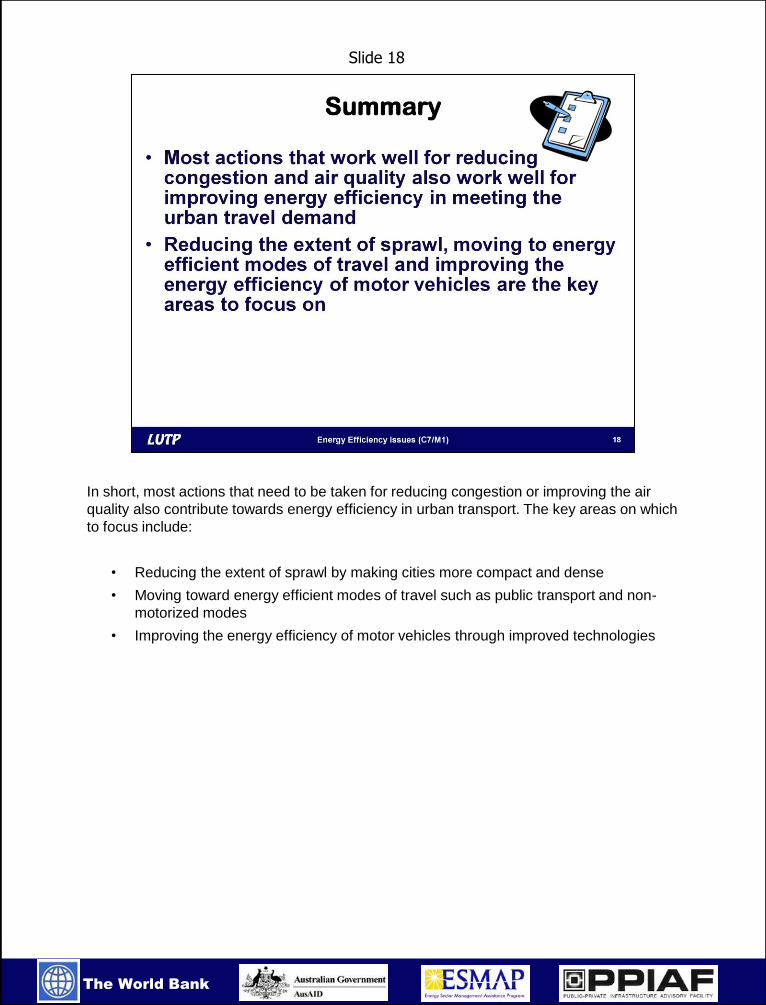
In short, most actions that need to be taken for reducing congestion or improving the air
quality also contribute towards energy efficiency in urban transport. The key areas on which
to focus include:
• Reducing the extent of sprawl by making cities more compact and dense
• Moving toward energy efficient modes of travel such as public transport and non-
motorized modes
• Improving the energy efficiency of motor vehicles through improved technologies
Slide 18


![C7 graham session c7 mon1530_v6[2]](https://img.pdfslide.net/doc/110x75/58ed94c51a28ab717c8b475d/c7-graham-session-c7-mon1530v62.jpg)