Embed Size (px)
Citation preview
30 May – 2 June 2016 | Reed Messe Wien
78th EAGE Conference & Exhibition 2016 Vienna, Austria, 30 May – 2 June 2016
We SBT3 10Clustering of Geological Models for ReservoirSimulation Studies in a Visual AnalyticsFrameworkZ. Sahaf (University of Calgary), H. Hamdi* (University of Calgary), F.Maurer (University of Calgary), L. Nghiem (Computer Modelling Group Ltd)& M. Costa Sousa (University of Calgary)
SUMMARYIn this paper, we introduced a new visual analytics framework to select a few representative models froman ensemble of geostatistical models that can represent the overall production uncertainty. To achieve thispurpose, a new block based similarity metric is defined based on mutual information. This metric iscomputed based on static geological properties and helps to identify geological models with similar flowsimulation results. In the next step, utilizing the computed similarity values, a customized multi attributeclustering algorithm is applied on a set of geological models. One model is selected from each clusterrandomly that results in having a few representative geological models. The whole process is implementedin a visual analytics framework. The proposed workflow was exemplified using some datasets generatedfrom various geostatistical facies realizations using different variogram correlation lengths. The results onthe case studies show that our technique is 70% accurate and much more time efficient in comparison tothe existent techniques. The method is being enhanced for more accurate clustering.
30 May – 2 June 2016 | Reed Messe Wien
78th EAGE Conference & Exhibition 2016 Vienna, Austria, 30 May – 2 June 2016
Introduction
Geological uncertainty is a common problem affecting the prediction of hydrocarbon production
(Ballin et al, 1992). Some of these uncertainties are reflected in the various rock types and their
geometrics present in the subsurface of the earth which largely affect the future prediction (Caers,
2011).
To quantify such uncertainties, geostatistical methods are usually employed to generate multiple
reservoir models honouring both soft and hard data (e.g. well-log, core and seismic). This ensemble of
reservoir models represents an assessment of spatial uncertainty. The ensemble signifies a large
number of equiprobable geological models. Naturally, the associated uncertainty in dynamic
properties such as oil production can be assessed when a large number of models are generated and
when the flow simulations were performed for all the models. This process is costly as a complex
reservoir simulation can take days to complete. On the other hand, such a brute-force approach is not
efficient as the simulation results of some sampled models can be very similar to each other.
Therefore, it is critically important to carefully sample a few geostatistical models which can
reasonably represent the overall uncertainty (Fenik et al, 2009; Idrobo et al, 2000).
The goal of our research is to design and develop visual analytics techniques (Sun et al, 2013) to filter
the geostatistical models and to only select the models that can potentially cover the uncertain space.
The proposed technique can resolve the existing issues of previous studies. Current techniques like
ranking (Deutsch et al; 1996), random selection, or probability-based techniques (Li et al, 2014), are
costly in terms of computation. They are automatic processes preventing domain experts from guiding
the selection process. Moreover, they rely mostly on either simplified fluid flow or unscaled
geological properties that may not give correct results. That is because fluid phases might not follow
the same flow paths in simplified models as they would in realistic models (Majdi Yazdi. 2014).
The main contribution of this study is to introduce a novel visual analytics framework for reducing the
computational cost in uncertainty assessment of dynamic properties by only utilizing the underlying
static model properties while allowing the domain experts to improve the selection process
interactively. Visual analytics methods allow decision makers to combine their human flexibility,
creativity, and background knowledge with the enormous storage and processing capacities of today’s
computers to gain insight into complex problems. In our approach, the users can specify the reduction
level interactively to filter out some models from an initial population of geostatistical realizations.
For instance, the users may want to select 10 or 20 models, depending on the scenario or requirement,
among 100 available models. Moreover, the visualization techniques have been designed to represent
a set of realizations, and to even interactively select a desired spatial 3D region (e.g. a region near a
well) as an area of interest to perform the filtering process accordingly.
We designed a novel distance measure based on the mutual information (MI) (Goshtasby, 2012; Lin,
1998) concept. Distances are computed between all the models and are then used by a multi-attribute
clustering algorithm to create sets of similar models i.e. models whose simulation results will be
potentially similar. We then pick one model from each cluster randomly for flow simulation. We
show the accuracy of our selection method by comparing the simulation results of the selected models
with the simulation results of all models in the initial population: a selection is accurate when the
selected model simulation results are similar to the simulation results of all other models in the
cluster.
Similarity metric calculation
One way to measure the similarity between a pair of 3D models is to represent the models in terms of
two lengthy 1-Dimensional (1D) vectors and use a similarity metric (e.g. Euclidean distance) to
compute the similarity between any two models. However, this approach is not entirely accurate for
addressing this problem as geological models have 3D geometries with correlated properties.
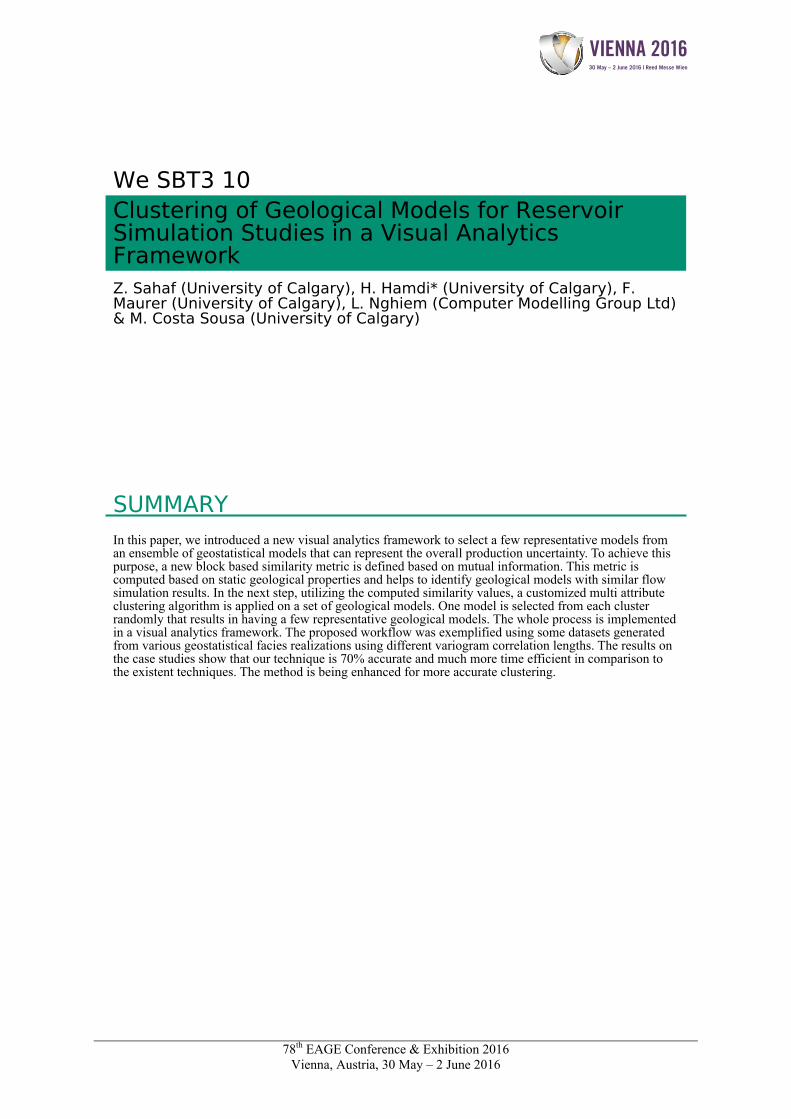
Additionally, the 3D models can have some favourable 3D sub-structures (e.g. channels) that any
appropriate similarity measurement should be able to address their spatial resemblance (Figure 1).
Therefore, we propose to use a moving 3D template to calculate the expected similarity between a
pair of geostatistical realizations. The idea in this proposed method is to divide each 3D model into
30 May – 2 June 2016 | Reed Messe Wien
78th EAGE Conference & Exhibition 2016 Vienna, Austria, 30 May – 2 June 2016
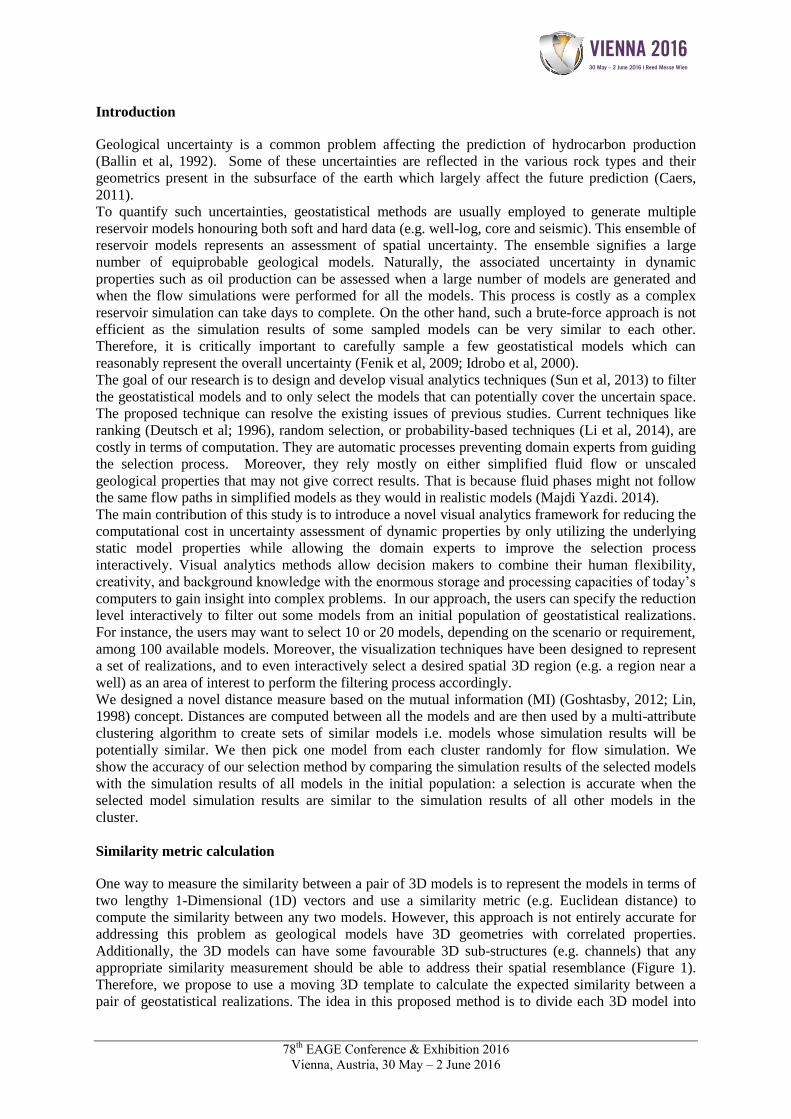
smaller 3D blocks (Figure 2) where each block consists of a specific number of cells. To calculate
similarity between a pair of models, similarity values are computed between corresponding contained
blocks (templates) initially. Next, we take an average of similarity values between all corresponding
blocks of two models. During this process, in order to reduce the bias of the fixed spatial location of
blocks, we move the blocks in certain directions (x, y, z and diagonal) and distances (>1 and <block
size). The final similarity value would be the average of similarity values in all the possible
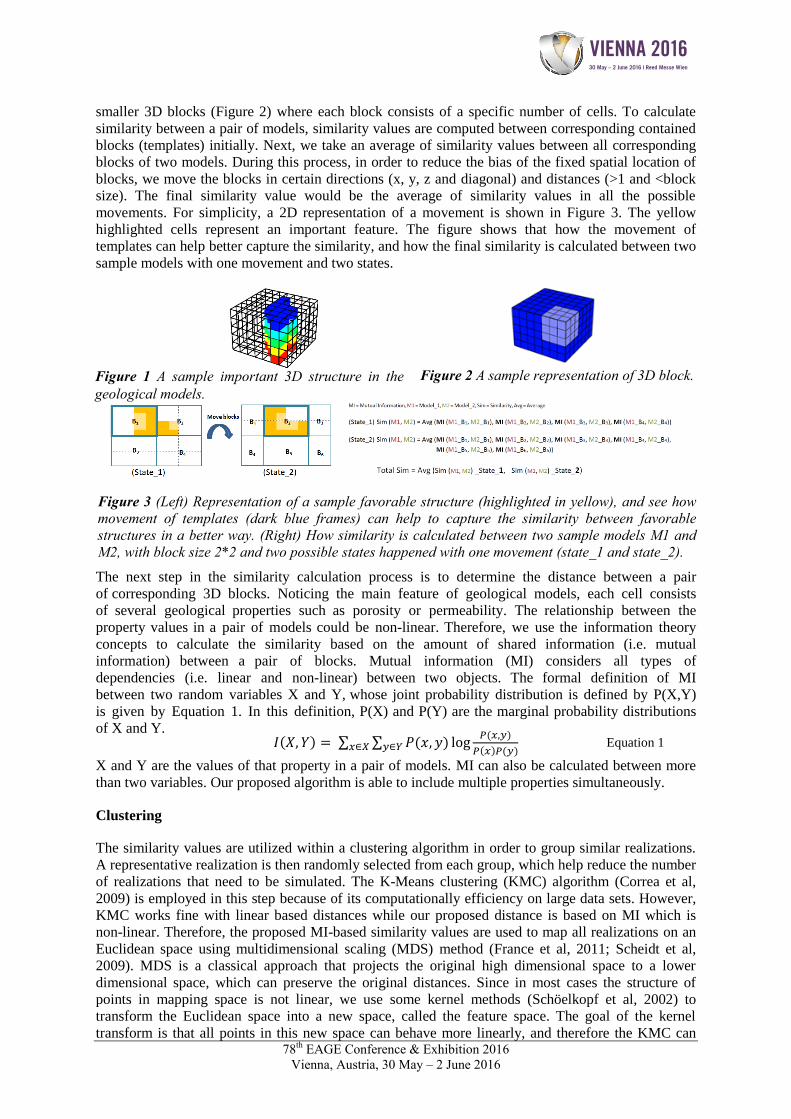
movements. For simplicity, a 2D representation of a movement is shown in Figure 3. The yellow
highlighted cells represent an important feature. The figure shows that how the movement of
templates can help better capture the similarity, and how the final similarity is calculated between two
sample models with one movement and two states.
𝐼(𝑋, 𝑌) = ∑ ∑ 𝑃(𝑥, 𝑦) log𝑃(𝑥,𝑦)
𝑃(𝑥)𝑃(𝑦)𝑦∈𝑌𝑥∈𝑋
X and Y are the values of that property in a pair of models. MI can also be calculated between more
than two variables. Our proposed algorithm is able to include multiple properties simultaneously.
Clustering
The similarity values are utilized within a clustering algorithm in order to group similar realizations.
A representative realization is then randomly selected from each group, which help reduce the number
of realizations that need to be simulated. The K-Means clustering (KMC) algorithm (Correa et al,
2009) is employed in this step because of its computationally efficiency on large data sets. However,
KMC works fine with linear based distances while our proposed distance is based on MI which is
non-linear. Therefore, the proposed MI-based similarity values are used to map all realizations on an
Euclidean space using multidimensional scaling (MDS) method (France et al, 2011; Scheidt et al,
2009). MDS is a classical approach that projects the original high dimensional space to a lower
dimensional space, which can preserve the original distances. Since in most cases the structure of
points in mapping space is not linear, we use some kernel methods (Schöelkopf et al, 2002) to
transform the Euclidean space into a new space, called the feature space. The goal of the kernel
transform is that all points in this new space can behave more linearly, and therefore the KMC can
Figure 1 A sample important 3D structure in the geological models.
Figure 2 A sample representation of 3D block.
Equation 1
Figure 3 (Left) Representation of a sample favorable structure (highlighted in yellow), and see how movement of templates (dark blue frames) can help to capture the similarity between favorable structures in a better way. (Right) How similarity is calculated between two sample models M1 and M2, with block size 2*2 and two possible states happened with one movement (state_1 and state_2).
The next step in the similarity calculation process is to determine the distance between a pair
of corresponding 3D blocks. Noticing the main feature of geological models, each cell consists
of several geological properties such as porosity or permeability. The relationship between the
property values in a pair of models could be non-linear. Therefore, we use the information theory
concepts to calculate the similarity based on the amount of shared information (i.e. mutual
information) between a pair of blocks. Mutual information (MI) considers all types of
dependencies (i.e. linear and non-linear) between two objects. The formal definition of MI
between two random variables X and Y, whose joint probability distribution is defined by P(X,Y)
is given by Equation 1. In this definition, P(X) and P(Y) are the marginal probability distributions
of X and Y.
30 May – 2 June 2016 | Reed Messe Wien
78th EAGE Conference & Exhibition 2016 Vienna, Austria, 30 May – 2 June 2016
provide more reasonable outcome. The visual and interactive representation of the original and the
feature spaces, and their relationships are implemented in our proposed visual analytics framework.
Case Study
The proposed method has been applied to three case studies. In the first case study, three different
correlation ranges are used to generate three facies distributions. For each case, five realizations have
been generated by only changing the random seed in the Sequential Indicator Simulation algorithm
(Deutsch, 2006); leading to having 15 realizations. In the other dataset, instead of changing the facies,
the permeability and porosity distributions have been varied with a similar approach in the previous
dataset; that yields another 15 realizations. Finally, in the third data set, all the permeability, porosity
and facies distributions are changed, which results in a larger number of realizations (100). The latter
dataset helps judge how our method works when a large number of models is available. In all the
three cases, the models dimension is 139*48*9, and the available properties for all the models include
porosity, permeability in all directions, net to gross, and water saturation.
Results
Due to the lack of space, we only show the results for the first case study. To validate our approach,
we performed the flow simulations for all the models using CMG black oil simulator (IMEX 2015).
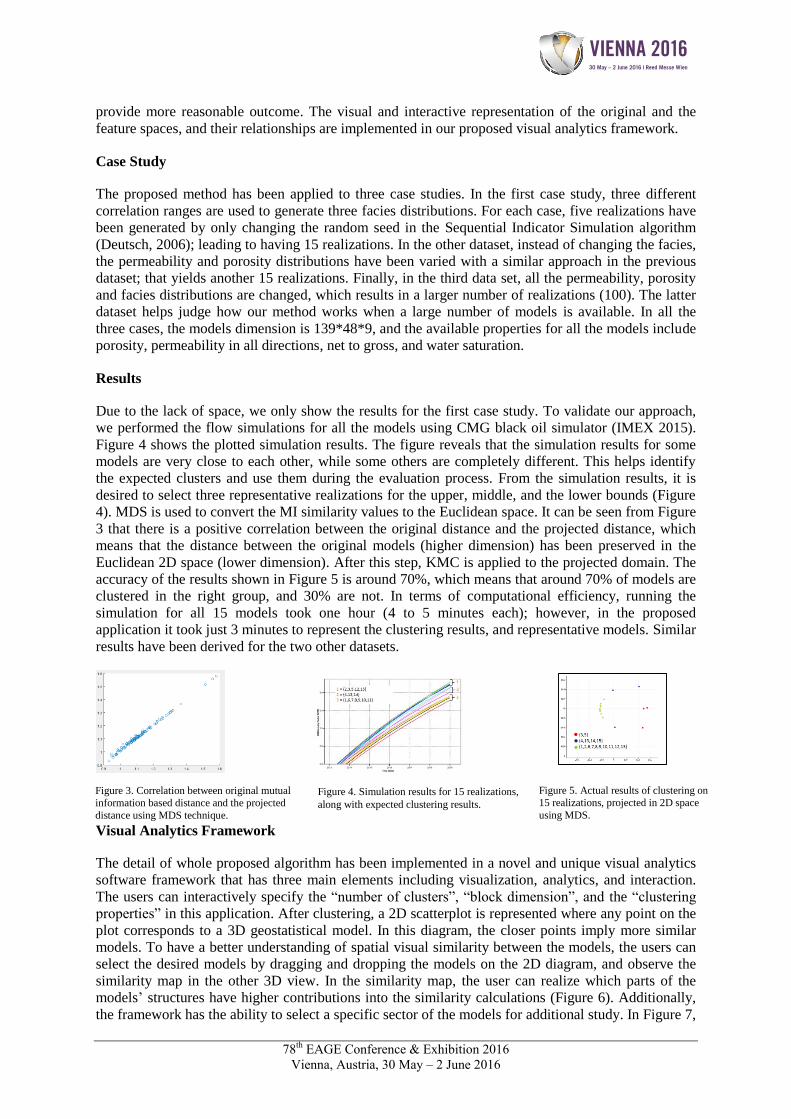
Figure 4 shows the plotted simulation results. The figure reveals that the simulation results for some
models are very close to each other, while some others are completely different. This helps identify
the expected clusters and use them during the evaluation process. From the simulation results, it is
desired to select three representative realizations for the upper, middle, and the lower bounds (Figure
4). MDS is used to convert the MI similarity values to the Euclidean space. It can be seen from Figure
3 that there is a positive correlation between the original distance and the projected distance, which
means that the distance between the original models (higher dimension) has been preserved in the
Euclidean 2D space (lower dimension). After this step, KMC is applied to the projected domain. The
accuracy of the results shown in Figure 5 is around 70%, which means that around 70% of models are
clustered in the right group, and 30% are not. In terms of computational efficiency, running the
simulation for all 15 models took one hour (4 to 5 minutes each); however, in the proposed
application it took just 3 minutes to represent the clustering results, and representative models. Similar
results have been derived for the two other datasets.
Visual Analytics Framework
The detail of whole proposed algorithm has been implemented in a novel and unique visual analytics
software framework that has three main elements including visualization, analytics, and interaction.
The users can interactively specify the “number of clusters”, “block dimension”, and the “clustering
properties” in this application. After clustering, a 2D scatterplot is represented where any point on the
plot corresponds to a 3D geostatistical model. In this diagram, the closer points imply more similar
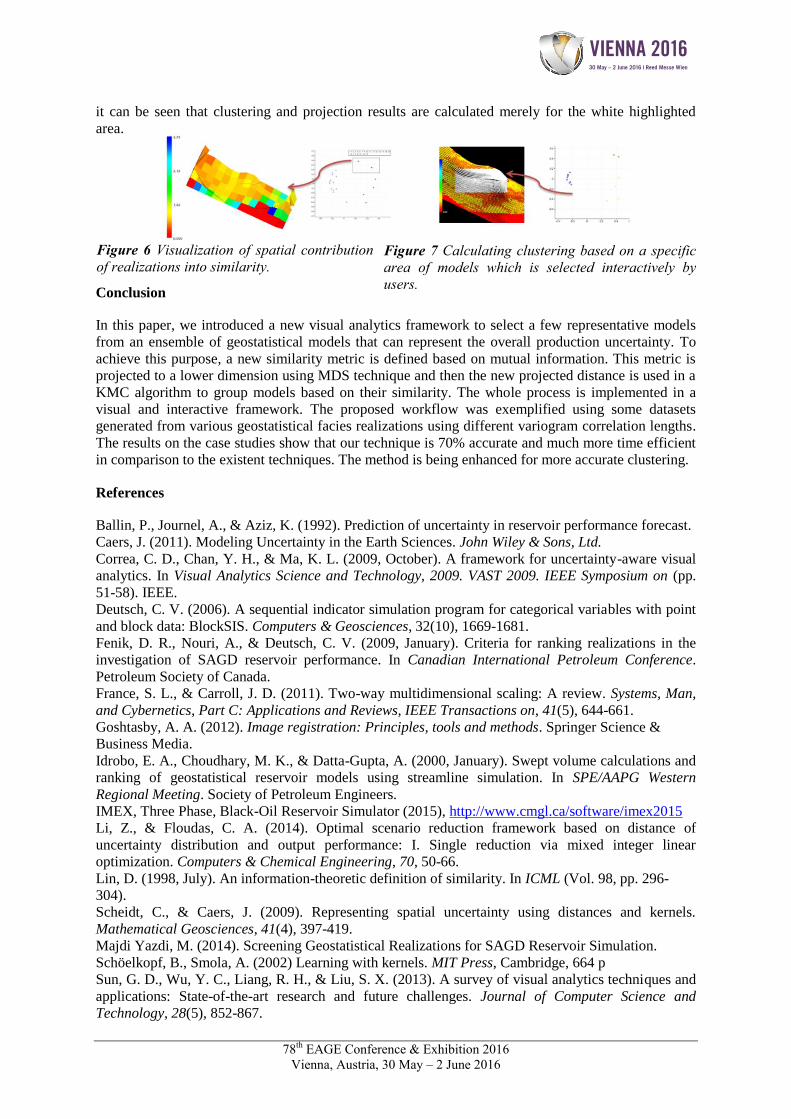
models. To have a better understanding of spatial visual similarity between the models, the users can
select the desired models by dragging and dropping the models on the 2D diagram, and observe the
similarity map in the other 3D view. In the similarity map, the user can realize which parts of the
models’ structures have higher contributions into the similarity calculations (Figure 6). Additionally,
the framework has the ability to select a specific sector of the models for additional study. In Figure 7,
Figure 3. Correlation between original mutual
information based distance and the projected
distance using MDS technique.
Figure 4. Simulation results for 15 realizations,
along with expected clustering results.
Figure 5. Actual results of clustering on
15 realizations, projected in 2D space
using MDS.
30 May – 2 June 2016 | Reed Messe Wien
78th EAGE Conference & Exhibition 2016 Vienna, Austria, 30 May – 2 June 2016
it can be seen that clustering and projection results are calculated merely for the white highlighted
area.
Conclusion
In this paper, we introduced a new visual analytics framework to select a few representative models
from an ensemble of geostatistical models that can represent the overall production uncertainty. To
achieve this purpose, a new similarity metric is defined based on mutual information. This metric is
projected to a lower dimension using MDS technique and then the new projected distance is used in a
KMC algorithm to group models based on their similarity. The whole process is implemented in a
visual and interactive framework. The proposed workflow was exemplified using some datasets
generated from various geostatistical facies realizations using different variogram correlation lengths.
The results on the case studies show that our technique is 70% accurate and much more time efficient
in comparison to the existent techniques. The method is being enhanced for more accurate clustering.
References
Ballin, P., Journel, A., & Aziz, K. (1992). Prediction of uncertainty in reservoir performance forecast.
Caers, J. (2011). Modeling Uncertainty in the Earth Sciences. John Wiley & Sons, Ltd.
Correa, C. D., Chan, Y. H., & Ma, K. L. (2009, October). A framework for uncertainty-aware visual
analytics. In Visual Analytics Science and Technology, 2009. VAST 2009. IEEE Symposium on (pp.
51-58). IEEE.
Deutsch, C. V. (2006). A sequential indicator simulation program for categorical variables with point
and block data: BlockSIS. Computers & Geosciences, 32(10), 1669-1681.
Fenik, D. R., Nouri, A., & Deutsch, C. V. (2009, January). Criteria for ranking realizations in the
investigation of SAGD reservoir performance. In Canadian International Petroleum Conference.
Petroleum Society of Canada.
France, S. L., & Carroll, J. D. (2011). Two-way multidimensional scaling: A review. Systems, Man,
and Cybernetics, Part C: Applications and Reviews, IEEE Transactions on, 41(5), 644-661.
Goshtasby, A. A. (2012). Image registration: Principles, tools and methods. Springer Science &
Business Media.
Idrobo, E. A., Choudhary, M. K., & Datta-Gupta, A. (2000, January). Swept volume calculations and
ranking of geostatistical reservoir models using streamline simulation. In SPE/AAPG Western
Regional Meeting. Society of Petroleum Engineers.
IMEX, Three Phase, Black-Oil Reservoir Simulator (2015), http://www.cmgl.ca/software/imex2015
Li, Z., & Floudas, C. A. (2014). Optimal scenario reduction framework based on distance of
uncertainty distribution and output performance: I. Single reduction via mixed integer linear
optimization. Computers & Chemical Engineering, 70, 50-66.
Lin, D. (1998, July). An information-theoretic definition of similarity. In ICML (Vol. 98, pp. 296-
304).
Scheidt, C., & Caers, J. (2009). Representing spatial uncertainty using distances and kernels.
Mathematical Geosciences, 41(4), 397-419.
Majdi Yazdi, M. (2014). Screening Geostatistical Realizations for SAGD Reservoir Simulation.
Schöelkopf, B., Smola, A. (2002) Learning with kernels. MIT Press, Cambridge, 664 p
Sun, G. D., Wu, Y. C., Liang, R. H., & Liu, S. X. (2013). A survey of visual analytics techniques and
applications: State-of-the-art research and future challenges. Journal of Computer Science and
Technology, 28(5), 852-867.
Figure 6 Visualization of spatial contribution of realizations into similarity.
Figure 7 Calculating clustering based on a specific area of models which is selected interactively by users.