Embed Size (px)
Citation preview
CMBTC 2015 MALTING BARLEY CROP QUALITY ASSESSMENT Preliminary Report
December 14, 2015
2015 Malting Barley Crop Quality Assessment – Preliminary
1365-303 Main Street • Winnipeg, Manitoba, Canada R3C 3G7 • Telephone 204-984-4399 • Fax 204-984-5843 Email [email protected] • Website www.cmbtc.com
Pag
e2
Preliminary Report CMBTC 2015 MALTING BARLEY CROP QUALITY ASSESSMENT
Summary
Barley production in Canada in 2015 is estimated by Statistics Canada at 7.6 million tonnes, up 7% from 7.1 million tonnes last year. The 2015 crop turned out better than expected considering the extreme dryness in spring and early summer, particularly in Alberta and western Saskatchewan. Good rains followed for the balance of summer over the Prairies allowing the crop to recover, although overall yields ended down slightly from 2014. Seeded area is estimated at 2.64 mln hectares (6.51 mln acres) compared with 2.38 mln hectares (5.88 mln acres) in 2014, an increase of 11% (Statistics Canada data). Estimated malting barley seeded area was also up 11.5% to 1.4 mln hectares compared to 1.2 mln hectares in 2014, accounting for 54% of barley seeded area versus 52% in 2014, according to data collected by the Canadian Grain Commission. The quality of 2015 malting barley crop was mixed with some barley suffering chitting and weather damage due to rains at harvest, and high grain protein likely due to drought stress in the early summer. These factors led to a smaller selectable pool of malting barley in Canada for 2015-16 compared with the historical average. As a result of the smaller crop and quality issues, the CMBTC received a modest number of barley samples from the 2015 crop for evaluation purposes. Varieties received included AC Metcalfe, CDC Copeland, AAC Synergy, CDC Kindersley, Newdale and Legacy. These barley samples were collected from different growing areas in western Canada provided by Viterra, Richardson International, Prairie Malt, Canada Malting, MaltEurop, Rahr Malting Canada, and Integrated Grain. With these 2015 new crop barley samples, the CMBTC conducted barley analysis, micro-malting tests as well as pilot malting and brewing trials. The objective of this work is to examine malting quality and brewing performance of these varieties in order to offer processing guidelines for end-users of 2015 Canadian malting barley crop. The test results generated in this study are summarized in this report. Please note only the test results for AC Metcalfe and CDC Copeland are included in this preliminary report. The results for AAC Synergy, CDC Kindersley, Newdale and Legacy will be included in the final report.
2015 Malting Barley Crop Quality Assessment – Preliminary
1365-303 Main Street • Winnipeg, Manitoba, Canada R3C 3G7 • Telephone 204-984-4399 • Fax 204-984-5843 Email [email protected] • Website www.cmbtc.com
Pag
e3
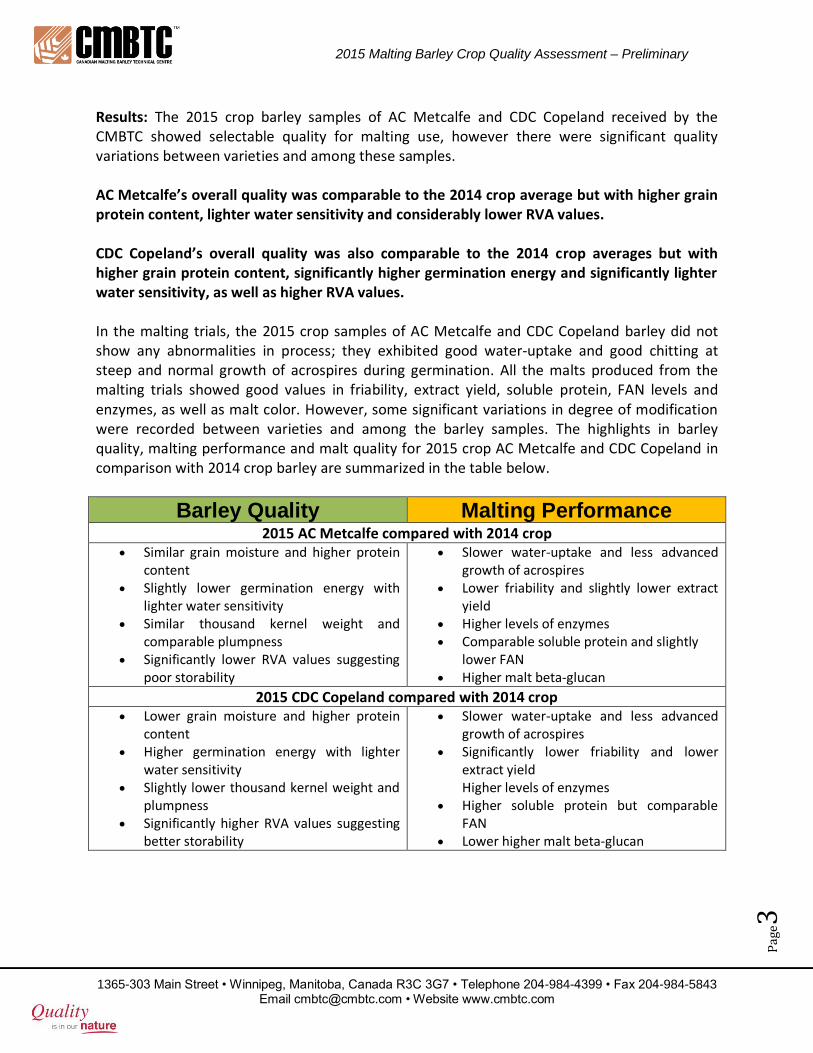
Results: The 2015 crop barley samples of AC Metcalfe and CDC Copeland received by the CMBTC showed selectable quality for malting use, however there were significant quality variations between varieties and among these samples. AC Metcalfe’s overall quality was comparable to the 2014 crop average but with higher grain protein content, lighter water sensitivity and considerably lower RVA values. CDC Copeland’s overall quality was also comparable to the 2014 crop averages but with higher grain protein content, significantly higher germination energy and significantly lighter water sensitivity, as well as higher RVA values. In the malting trials, the 2015 crop samples of AC Metcalfe and CDC Copeland barley did not show any abnormalities in process; they exhibited good water-uptake and good chitting at steep and normal growth of acrospires during germination. All the malts produced from the malting trials showed good values in friability, extract yield, soluble protein, FAN levels and enzymes, as well as malt color. However, some significant variations in degree of modification were recorded between varieties and among the barley samples. The highlights in barley quality, malting performance and malt quality for 2015 crop AC Metcalfe and CDC Copeland in comparison with 2014 crop barley are summarized in the table below.
Barley Quality Malting Performance 2015 AC Metcalfe compared with 2014 crop
Similar grain moisture and higher protein content
Slightly lower germination energy with lighter water sensitivity
Similar thousand kernel weight and comparable plumpness
Significantly lower RVA values suggesting poor storability
Slower water-uptake and less advanced growth of acrospires
Lower friability and slightly lower extract yield
Higher levels of enzymes Comparable soluble protein and slightly
lower FAN Higher malt beta-glucan
2015 CDC Copeland compared with 2014 crop Lower grain moisture and higher protein
content Higher germination energy with lighter
water sensitivity Slightly lower thousand kernel weight and
plumpness Significantly higher RVA values suggesting
better storability
Slower water-uptake and less advanced growth of acrospires
Significantly lower friability and lower extract yield Higher levels of enzymes
Higher soluble protein but comparable FAN
Lower higher malt beta-glucan

2015 Malting Barley Crop Quality Assessment – Preliminary
1365-303 Main Street • Winnipeg, Manitoba, Canada R3C 3G7 • Telephone 204-984-4399 • Fax 204-984-5843 Email [email protected] • Website www.cmbtc.com
Pag
e4
Malting trial results suggested that 2015 crop AC Metcalfe and CDC Copeland barley can be processed under normal processing conditions designed for Canadian two-row malting barley. However, processing conditions that are known to effect malt beta-glucan should be closely monitored when the new crop barley is processed. In the brewing trials the malts produced from 2015 crop barley samples of AC Metcalfe and CDC Copeland all performed satisfactorily without showing processing difficulties. Beers produced from these 2015 crop barley samples all showed satisfactory overall quality, although some quality variations between barley varieties and samples were recorded. The highlights in performance and beer quality are listed in the table below:
Brewing Performance 2015 AC Metcalfe compared with 2014 crop:
Shorter conversion time
Similar time to clear in lautering
Higher malt material yield
Lower wort colour
Lower fermentability
Higher foam stability
Higher beer colour
High final alcohol
Comparable sensory score
2015 CDC Copeland compared with 2014 crop:
Shorter conversion time
Shorter time to clear in lautering
Higher malt material yield
Higher wort colour
Lower fermentability
Higher foam stability
Higher beer colour
Lower final alcohol
Comparable sensory score
Pilot brewing results suggested that 2015 crop AC Metcalfe and CDC Copeland can be brewed under normal processing conditions for Canadian two-row malting barley.

2015 Malting Barley Crop Quality Assessment – Preliminary
1365-303 Main Street • Winnipeg, Manitoba, Canada R3C 3G7 • Telephone 204-984-4399 • Fax 204-984-5843 Email [email protected] • Website www.cmbtc.com
Pag
e5
Introduction
Samples of the 2015 Canadian malting barley crop AC Metcalfe, CDC Copeland, AAC Synergy, CDC Kindersley, Newdale and Legacy included in this study were provided to the CMBTC by Viterra, Richardson International, Prairie Malt, Canada Malting, MaltEurop, Rahr Malting Canada, and Integrated Grain. These barley samples were collected from Alberta, Saskatchewan and Manitoba. To some extent, these barley samples reflect the quality of selectable malting barley of 2015 crop which are available to the customers of Canadian malting barley. Please note that CMBTC was not involved in collecting these barley samples. Please note only the test results for AC Metcalfe and CDC Copeland are included in this preliminary report. The results for AAC Synergy, CDC Kindersley, Newdale and Legacy will be included in the final report.
Barley Quality Analysis
When the newly harvested barley samples of AC Metcalfe and CDC Copeland arrived at the CMBTC, their quality was examined prior to the malting trials, and the test results are summarized in Tables 1 and 2 respectively. Please note the testing results reported in Tables 1 and 2 were generated from a single test except for germination. AC Metcalfe barley samples from 2015 harvest showed varied appearance from bright to noticeable staining. On average, AC Metcalfe samples showed acceptable grain moisture content and good protein content, very good thousand kernel weight and plumpness. 2015 crop AC Metcalfe showed acceptable germination energy but with significant water sensitivity (Table 1). However, RVA values for these samples were significantly lower than desired. Please note that among the nine AC Metcalfe barley samples from the 2015 harvest, only two samples reported RVA values higher than 100. Low RVA values for the 2015 crop AC Metcalfe suggested that these samples have suffered from pre-harvest sprouting. Some decrease in germination during a long-term storage could be expected from barley with low RVA values. Table 1. Analysis of 2015 crop barley samples of AC Metcalfe received at CMBTC
2015 New Crop
AC Metcalfe
Mo
istu
re, %
Pro
tein
, %
Ge
rmin
atio
n,
% (
4m
l, n
=2
)
Ge
rmin
atio
n,
% (
8m
l, n
=2
)
10
00
Ke
rne
l
wt, g
Sizing, %
RVA
>6
/64
sie
ve
>5
/64
sie
ve
Average of 2015 crop (n=9) 11.6 12.8 95.1 82.9 45.4 92.86 5.34 61.0
Std Dev 0.93 0.40 2.33 5.43 3.06 1.15 1.00 45.1
Average of 2014 QS (n=13) 11.7 12.1 95.5 77.7 45.6 92.92 5.46 71.8
Std Dev 1.63 0.47 2.68 8.69 2.53 2.38 2.09 58.61
Average of 2013 QS 12.6 11.9 98.5 88.6 47.2 93.1 4.89 122
Std Dev 1.23 0.15 1.73 10.31 0.99 3.05 2.32 39.7

2015 Malting Barley Crop Quality Assessment – Preliminary
1365-303 Main Street • Winnipeg, Manitoba, Canada R3C 3G7 • Telephone 204-984-4399 • Fax 204-984-5843 Email [email protected] • Website www.cmbtc.com
Pag
e6
In comparison with the 2014 crop AC Metcalfe, on average, 2015 crop AC Metcalfe barley samples showed similar grain moisture, higher protein content, slightly lower germination energy and lighter water sensitivity. The thousand-kernel weight for 2015 crop AC Metcalfe was slightly similar to the 2014 crop; the plumpness was also comparable to the 2014 crop. However RVA values for 2015 crop AC Metcalfe were significantly lower than 2014 crop AC Metcalfe. As observed with AC Metcalfe barley, CDC Copeland barley samples from 2015 harvest also indicated noticeable signs of staining. These CDC Copeland barley samples showed acceptable grain moisture content, desirable protein content, very good thousand kernel weight and plumpness. CDC Copeland barley showed good germination energy but with significant water sensitivity (Table 2). Among the seven 2015 crop CDC Copeland barley samples received at CMBTC only one sample showed very good RVA values (>150), the remaining samples showed low to very low RVA values suggesting poor storability can be expected from 2015 crop CDC Copeland barley. Table 2. Analysis of 2015 crop barley samples of CDC Copeland received at CMBTC
2015 New Crop CDC Copeland
Mo
istu
re, %
Pro
tein
, %
Ge
rmin
atio
n,
%
(4m
l, n
=2)
Ge
rmin
atio
n,
%
(8m
l, n
=2)
10
00
Ke
rne
l
wt, g
Sizing, %
RVA
>6
/64
sie
ve
>5
/64
sie
ve
Average of 2015 crop (n=7) 11.0 12.1 96.6 86.1 47.5 92.59 5.72 63.8 Std Dev 1.48 0.40 2.44 8.63 3.66 5.90 5.50 61.9
Average of 2014 QS (n=8) 13.1 11.1 93.9 76.3 47.1 94.56 3.98 42.4
Std Dev 0.74 0.23 2.60 5.68 1.51 1.61 1.28 21.38
Average of 2013 QS 12.7 11.5 99.3 93.3 52.2 93.60 4.80 146
Std Dev 0.94 0.54 0.96 5.56 4.73 5.66 4.77 19.30
In comparison with the 2014 CDC Copeland barley, on average 2015 crop CDC Copeland barley samples showed significantly lower grain moisture content and higher protein content; significantly higher germination energy and significantly lighter water sensitivity. Thousand kernel weight for 2015 CDC Copeland was slightly higher than the 2014 crop while the plumpness was lower. RVA values for 2015 CDC Copeland were significantly higher than the 2014 crop suggesting slightly better storability than 2014 CDC Copeland.

2015 Malting Barley Crop Quality Assessment – Preliminary
1365-303 Main Street • Winnipeg, Manitoba, Canada R3C 3G7 • Telephone 204-984-4399 • Fax 204-984-5843 Email [email protected] • Website www.cmbtc.com
Pag
e7
1. Pilot Malting Trials Pilot malting trials were conducted with these 2015 crop barley samples of AC Metcalfe and CDC Copeland. Depending on the quantity of the barley samples received at CMBTC, one or multiple pilot malting trials on each of these two varieties were conducted using CMBTC’s pilot malting systems with a batch size of 50-60kg of cleaned barley. The processing conditions used in the malting trials are given in Box 1. Box 1. Malting conditions used for processing AC Metcalfe and CDC Copeland barley
AC Metcalfe STEEPING CYCLES
45 hours (7 hrs Wet – 13 hrs Dry - 10 hrs Wet -14 hrs Dry -1 hr Wet) at 14°C
GERMINATION CONDITIONS Day 1, Day 2, Day 3 & Day 4 @ 14°C
KILNING CONDITIONS
A 21 hour cycle with a 4-hour curing phase at 82°C
CDC Copeland STEEPING CYCLES
44 hours (7 hrs Wet - 14 hrs Dry - 8 hrs Wet -14 hrs Dry -1 hr Wet) at 14°C
GERMINATION CONDITIONS Day 1, Day 2, Day 3 & Day 4 @ 15°C
KILNING CONDITIONS
A 21 hour cycle with a 4-hour curing phase at 82°

2015 Malting Barley Crop Quality Assessment – Preliminary
1365-303 Main Street • Winnipeg, Manitoba, Canada R3C 3G7 • Telephone 204-984-4399 • Fax 204-984-5843 Email [email protected] • Website www.cmbtc.com
Pag
e8
AC Metcalfe
In the malting trials, 2015 crop AC Metcalfe barley samples did not show any processing difficulties. At the end of steep the barley samples obtained satisfactory steep-out moisture content and achieved a very good chitting rate (Table 5). During germination, AC Metcalfe barley samples showed normal growth of acrospires and good modification progress. In comparison with the 2014 crop samples, on average, 2015 crop AC Metcalfe barley samples showed water uptake slightly slower than the 2014 crop and obtained a higher chitting rate at the end of steep. During germination these 2015 AC Metcalfe samples showed good growth of acrospires, which were less advanced than 2014 crop AC Metcalfe. Table 5. Steep-out moisture content, chitting rate and growth profile of acrospires for 2015
AC Metcalfe barley samples
2015 crop AC Metcalfe (n=7)
Steep-out moisture (%) 43.38 (41.1-46.0)
Chitting rate (%) 96.42 (90-100)
Acrospire growth
Process Time 0-¼ (%) ¼-½ (%) ½-¾ (%) ¾-1 (%) >1 (%)
24 hours 1.4 54.3 33.6 10.7 0
48 hours 0 10.7 55.7 32.1 1.4
72 hours 0 0.7 16.4 74.3 8.6
96 hours 0 0 4.3 80 15.7
2014 crop AC Metcalfe (n=3)
Steep-out moisture (%) 44.5
Chitting rate (%) 95.0
Acrospire growth
Process Time 0-¼ (%) ¼-½ (%) ½-¾ (%) ¾-1 (%) >1 (%)
24 hours 0 13.3 60 26.7 0.0
48 hours 0 8.3 45 45.0 0.0
72 hours 0 0 18.33 80.0 1.7
96 hours 0 0 1.67 75.0 23.3
Complete malt analysis was carried out for the pilot malting trials with the 2015 crop AC Metcalfe barley samples, and the analytical results for the trials are given in Table 6. For comparison, the table also includes the average analysis of AC Metcalfe malts generated from the pilot-malting trials carried out at CMBTC with the 2014 and 2013 crop AC Metcalfe barley samples.

2015 Malting Barley Crop Quality Assessment – Preliminary
1365-303 Main Street • Winnipeg, Manitoba, Canada R3C 3G7 • Telephone 204-984-4399 • Fax 204-984-5843 Email [email protected] • Website www.cmbtc.com
Pag
e9
Table 6. Malt Analysis for 2015 crop AC Metcalfe barley samples
Parameter 2015 Crop AC Metcalfe 2014 QS 2013 QS
Mean (n=7) STD Dev Mean Mean
Friability, % 72.7 6.01 82.6 75.8
Fine-extract, % 80.9 0.39 81.3 81.9
F/C Difference, % 1.03 0.70 0.8 0.6
Soluble protein, % 5.27 0.35 5.48 5.34
Total protein, % 12.66 0.57 12.4 11.5
Kolbach Index, % 41.6 2.92 44.0 46.4
Beta-Glucan, ppm 158 85.15 120 163
Diastatic power, L 156 9.87 154 150
-Amylase, D.U. 82.6 2.92 60.4 67.1
Wort colour, ASBC 2.34 0.21 2.30 2.62
Fan, mg/L 220 13.30 216 232
Malting Summary General modification: Under the given process conditions, 2015 crop AC Metcalfe produced malts
with satisfactory quality. The values for friability, F/C difference, soluble protein and beta-glucan content all suggested that the 2015 crop AC Metcalfe barley samples included in the trials produced malts with acceptable modification, however, significant variations in malt friability and beta-glucan content between the trials were recorded.
Extract yield and enzyme levels: In comparison with the trial averages of 2014 and 2013 crop AC Metcalfe samples, on average, the malts produced from 2015 crop AC Metcalfe samples exhibited extract yield slightly lower than the 2014 crop samples but significantly lower than the 2013 crop samples. The 2015 crop malts developed higher levels of enzymes; the diastatic power was slightly
higher than both the 2014 and 2013 crop samples, while the -amylase was significantly higher than the 2014 and 2013 crop samples.
Soluble protein, free amino nitrogen (FAN) and malt colour: The malts produced from 2015 crop AC Metcalfe samples exhibited good protein solubilisation; on average, their soluble protein was comparable to 2014 and 2013 crop AC Metcalfe samples but showing significantly lower Kolbach Index. The malts also developed adequate levels of FAN, which were also comparable to the 2014 crop samples but lower than 2013 crop samples. Malt colour for 2015 crop AC Metcalfe barley was good, which was comparable to 2014 crop samples but slightly lower than the 2013 crop samples.

2015 Malting Barley Crop Quality Assessment – Preliminary
1365-303 Main Street • Winnipeg, Manitoba, Canada R3C 3G7 • Telephone 204-984-4399 • Fax 204-984-5843 Email [email protected] • Website www.cmbtc.com
Pag
e1
0
Comments on the malting process: No difficulties during the malting process were recorded for 2015 crop AC Metcalfe barley samples. They were processed under the normal processing conditions used at CMBTC for quality evaluation of Canadian two-row malting barley. At steep, steep-out moisture of 44-45% and over 85% chitting rate are the targets. The steeping cycle should consist of 2 or 3 wet periods at 14-15°C. In germination, avoid a high temperature and excessive watering to control the growth of acrospires and protein breakdown. In kilning a lower curing temperature (80-82°C) should be considered to avoid excessive malt color formation.
CDC Copeland
In the malting trials, 2015 crop CDC Copeland barley samples did not show any processing difficulties. CDC Copeland barley samples obtained satisfactory steep-out moisture content and excellent chitting rate (Table 7) at the end of steep. During germination, Copeland barley showed good growth of acrospires. In comparison with the 2014 crop CDC Copeland samples, 2015 crop CDC Copeland barley displayed slower water uptake and lower chitting rate at the end of steep. During germination, 2015 crop CDC Copeland barley samples showed growth of acrospires comparable to 2014 crop CDC Copeland. Table 7. Steep-out moisture content, chitting rate and growth profile of acrospires of 2015
crop CDC Copeland barley samples
2015 crop CDC Copeland (n=5)
Steep-out moisture (%) 44.3 (42.3-46.3)
Chitting rate (%) 95 (80-100)
Acrospire growth
Process Time 0-¼ (%) ¼-½ (%) ½-¾ (%) ¾-1 (%) >1 (%)
24 hours 4 58 36 2 0
48 hours 0 11 50 38 1
72 hours 0 3 25 65 6
96 hours 0 0 13 66 21

2015 Malting Barley Crop Quality Assessment – Preliminary
1365-303 Main Street • Winnipeg, Manitoba, Canada R3C 3G7 • Telephone 204-984-4399 • Fax 204-984-5843 Email [email protected] • Website www.cmbtc.com
Pag
e1
1
2014 crop CDC Copeland (n=2)
Steep-out moisture (%) 45.6
Chitting rate (%) 100
Acrospire growth
Process Time 0-¼ (%) ¼-½ (%) ½-¾ (%) ¾-1 (%) >1 (%)
24 hours 0 7.5 47.5 45 0
48 hours 0 7.5 47.5 42.5 2.5
72 hours 0 5.0 30.0 50.0 15.0
96 hours 0 0 10 57.5 32.5
Complete malt analysis was carried out for the micro-malting and pilot malting trials, and the analytical results for the trials are given in Table 8. For comparison, the table also includes the average malt analysis of CDC Copeland malting trials carried out at CMBTC with the 2013 and 2012 crop CDC Copeland barley samples. Table 8. Malt analysis for 2015 CDC Copeland barley samples
Parameter 2015 New Crop 2014 QS 2013 QS
Mean (n=5) Std Dev Mean Mean
Friability, % 76.7 8.72 83.2 91.7
Fine-extract, % 80.4 0.94 81.5 82.0
F/C Difference, % 1.2 0.46 1.25 1.0
Soluble protein, % 5.05 0.48 4.89 5.04
Total protein, % 12.09 0.56 10.98 10.9
Kolbach Index, % 41.8 2.72 44.6 46.3
Beta-Glucan, ppm 211 59.4 226 89
Diastatic power, L 134 6.77 107 127
-Amylase, D.U. 61.7 13.16 40.1 54.8
Wort colour, ASBC 2.42 0.51 2.49 2.14
Fan, mg/L 208 20.2 205 200

2015 Malting Barley Crop Quality Assessment – Preliminary
1365-303 Main Street • Winnipeg, Manitoba, Canada R3C 3G7 • Telephone 204-984-4399 • Fax 204-984-5843 Email [email protected] • Website www.cmbtc.com
Pag
e1
2
Malting Summary
General modification: The values for friability, F/C difference and soluble protein suggested that these 2015 crop CDC Copeland barley samples produced malts with good modification, however, high beta-glucan content indicated that some further modification was needed.
Extract yield and enzyme levels: The malts produced from 2015 crop CDC Copeland barley samples exhibited good extract yield, however, on average, the extract yield was significantly lower than the 2014 and 2013 crop Copeland samples. 2015 crop CDC Copeland malts
developed good levels of enzymes. On average, the diastatic power levels and -amylase levels were significantly higher than that in 2014 and 2013 crop samples.
Soluble protein, free amino nitrogen (FAN) and malt colour: The malts produced from 2015 crop CDC Copeland samples exhibited good protein modification, on average, their soluble protein was slightly higher than the 2014 and 2013 crop Copeland samples, while their Kolbach Index were lower. This was due to higher barley protein for 2015 crop Copeland. Malt colour for 2015 crop CDC Copeland barley was good, on average, the colour was comparable to 2014 crop samples but slightly higher than the 2013 crop samples.
Comments on the malting process:
During the malting process, no difficulties were recorded for 2015 crop CDC Copeland barley samples. 2015 crop CDC Copeland barley can be processed under the normal processing conditions for Canadian two-row malting barley. However, special attention should be given to processing conditions that affect malt beta-glucan content.
Steep-out moisture of 44-45% and over 85% chitting rate is the target. The steeping cycle should consist of 2 or 3 wet periods at 14-15°C. In germination, avoid high temperature and excessive watering to control acrospires growth and protein breakdown. In kilning the curing temperature can be similar to those used for AC Metcalfe (80-82°C).
2015 Malting Barley Crop Quality Assessment – Preliminary
1365-303 Main Street • Winnipeg, Manitoba, Canada R3C 3G7 • Telephone 204-984-4399 • Fax 204-984-5843 Email [email protected] • Website www.cmbtc.com
Pag
e1
3
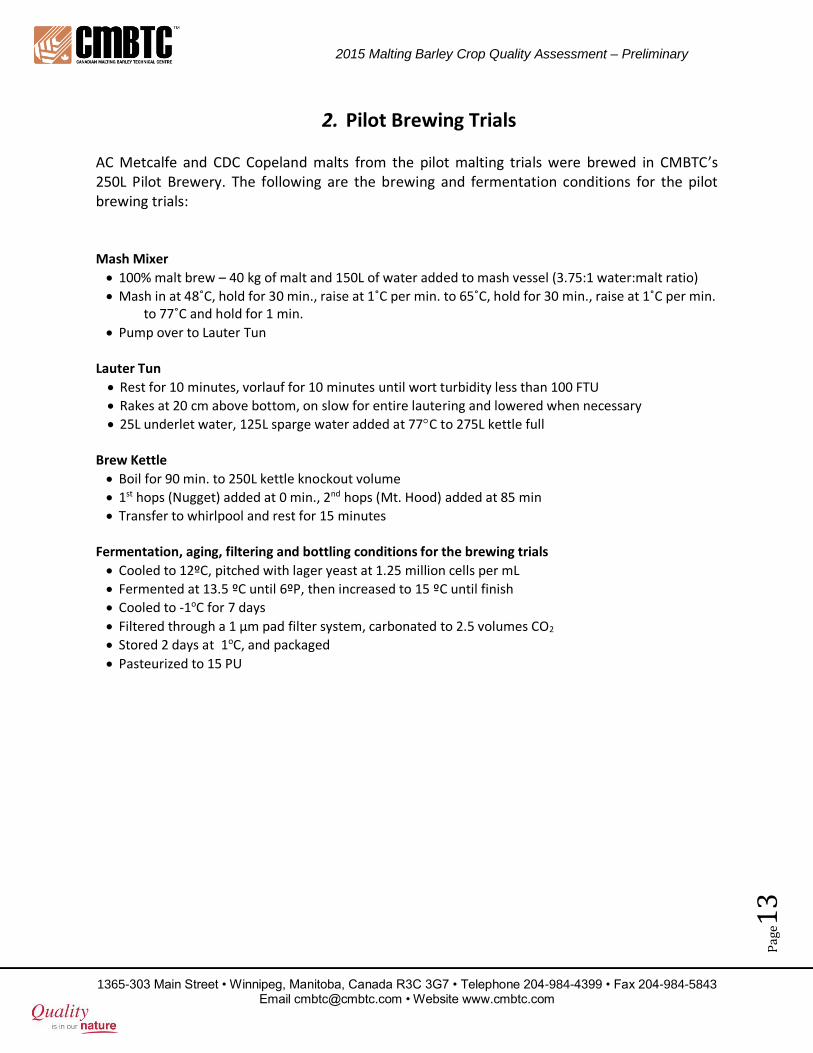
2. Pilot Brewing Trials AC Metcalfe and CDC Copeland malts from the pilot malting trials were brewed in CMBTC’s 250L Pilot Brewery. The following are the brewing and fermentation conditions for the pilot brewing trials:
Mash Mixer
100% malt brew – 40 kg of malt and 150L of water added to mash vessel (3.75:1 water:malt ratio)
Mash in at 48˚C, hold for 30 min., raise at 1˚C per min. to 65˚C, hold for 30 min., raise at 1˚C per min. to 77˚C and hold for 1 min.
Pump over to Lauter Tun Lauter Tun
Rest for 10 minutes, vorlauf for 10 minutes until wort turbidity less than 100 FTU
Rakes at 20 cm above bottom, on slow for entire lautering and lowered when necessary
25L underlet water, 125L sparge water added at 77C to 275L kettle full
Brew Kettle
Boil for 90 min. to 250L kettle knockout volume
1st hops (Nugget) added at 0 min., 2nd hops (Mt. Hood) added at 85 min
Transfer to whirlpool and rest for 15 minutes Fermentation, aging, filtering and bottling conditions for the brewing trials
Cooled to 12ºC, pitched with lager yeast at 1.25 million cells per mL
Fermented at 13.5 ºC until 6ºP, then increased to 15 ºC until finish
Cooled to -1oC for 7 days
Filtered through a 1 µm pad filter system, carbonated to 2.5 volumes CO2
Stored 2 days at 1oC, and packaged
Pasteurized to 15 PU

2015 Malting Barley Crop Quality Assessment – Preliminary
1365-303 Main Street • Winnipeg, Manitoba, Canada R3C 3G7 • Telephone 204-984-4399 • Fax 204-984-5843 Email [email protected] • Website www.cmbtc.com
Pag
e1
4
PILOT BREWING TRIALS WITH AC METCALFE AC Metcalfe brewing results are given in Tables 14 through 16.
Table 9. Brewhouse observations for AC Metcalfe pilot brewing trials
Parameter* 2015 AC Metcalfe Average
2014 AC Metcalfe Average
2013 AC Metcalfe Average
2012 AC Metcalfe Average
Conversion time (min.) 12 17 9.5 15
Time to clear (min.) 7 7 6 5
Lautering time (min.) 47 41 42 38
Malt Material Yield (%) 89.3 87.9 91 89.0
Wort pH 5.34 5.38 5.28 5.10
Wort Colour (SRM) 4.71 4.91 5.32 7.63
*See glossary for detailed explanation of parameters.
In the brewhouse, the AC Metcalfe samples performed well and did not exhibit any processing problems (Table 13). Wort clarity and break in the wort kettle were acceptable for all the samples. Wort taste was also acceptable. The 2015 crop AC Metcalfe recorded a significantly shorter average conversion time than the 2014 crop AC Metcalfe. Average wort color was lower in the 2015 Metcalfe than its previous three crop years. Average wort pH was comparable to last year’s Metcalfe average. 2015 crop AC Metcalfe average time to clear was good and comparable to its previous three crop year’s averages, although lautering time was above the averages of its previous three years. Malt material yield was also good and greater than last year’s crop average.
Table 10. AC Metcalfe wort sugar concentrations (g/L)
Carbohydrate 2015 AC Metcalfe
Average 2014 AC Metcalfe
Average 2013 AC Metcalfe
Average 2012 AC Metcalfe
Average
Maltotetraose 2.76 3.00 2.42 2.63
Maltotriose 13.95 14.06 15.26 14.71
Maltose 58.00 61.36 63.50 57.62
Glucose 12.62 13.24 15.72 15.32
Fructose 1.91 3.01 2.19 3.54

2015 Malting Barley Crop Quality Assessment – Preliminary
1365-303 Main Street • Winnipeg, Manitoba, Canada R3C 3G7 • Telephone 204-984-4399 • Fax 204-984-5843 Email [email protected] • Website www.cmbtc.com
Pag
e1
5
Normal and generally comparable wort sugar spectra were recorded for all the samples (Table 14). The 2015 crop AC Metcalfe recorded slightly lower levels of unfermentable Maltotetraose than the averages of the 2014 crop AC Metcalfe wort samples.
Table 11. AC Metcalfe fermentation observations
Parameter 2015 AC Metcalfe Average
2014 AC Metcalfe Average
2013 AC Metcalfe Average
2012 AC Metcalfe Average
Attenuation Limit (%) 85.0 89.2 89.6 88.8
Average fermentability of the 2015 AC Metcalfe wort was lower than the previous three crop year’s AC Metcalfe averages (Table 15). Table 12. Final beer analysis for AC Metcalfe brewing trials
Parameter 2015 AC Metcalfe Average
2014 AC Metcalfe Average
2013 AC Metcalfe Average
2012 AC Metcalfe Average
Apparent Ext. (Plato) 1.51 1.37 1.41 1.48
Real Ext. (Plato) 3.43 3.27 3.33 3.36
Alcohol (v/v %) 5.26 5.20 5.28 5.17
Color (ASBC) 4.82 3.99 4.68 6.51
pH 4.35 4.25 4.20 4.28
Foam (Nibem) 269 144 164 141
Initial Turbidity (FTU) 261 27.0 36.2 20.7
Chill Turbidity (FTU) 24 Hr 210 29.0 37.5 24.3
The 2015 crop AC Metcalfe produced beer with acceptable quality. 2015 crop AC Metcalfe beers were generally comparable to the averages of 2014, 2013, and 2012 crop AC Metcalfe beers. Final average beer colour for 2015 crop AC Metcalfe beer was higher (darker) than 2014 and 2013 crop AC Metcalfe averages. 2015 crop AC Metcalfe also had slightly higher average beer pH readings than the previous three years.

2015 Malting Barley Crop Quality Assessment – Preliminary
1365-303 Main Street • Winnipeg, Manitoba, Canada R3C 3G7 • Telephone 204-984-4399 • Fax 204-984-5843 Email [email protected] • Website www.cmbtc.com
Pag
e1
6
Figure 1. Average 2015 AC Metcalfe beer organoleptic properties
Rating Scale 0 Less OXIDATION More 10 0 Less Pleasant Palate More Pleasant 10
0 Less Diacetyl More 10 0 Less Bitterness More 10
0 Less Phenols More 10 0 Less Sweetness More 10 0 Less Esters More 10 0 Less Sourness More 10
0 Less Sulfurs More 10 0 Less Maltiness More 10
0 Less Flavour Intensity More 10
The 2015 crop AC Metcalfe average beer scored satisfactorily overall with no major defects apparent during sensory analysis (Figure 1).

2015 Malting Barley Crop Quality Assessment – Preliminary
1365-303 Main Street • Winnipeg, Manitoba, Canada R3C 3G7 • Telephone 204-984-4399 • Fax 204-984-5843 Email [email protected] • Website www.cmbtc.com
Pag
e1
7
PILOT BREWING TRIALS WITH CDC COPELAND CDC Copeland brewing results are given in Tables 17 through 19.
Table 13. Brewhouse observations for CDC Copeland pilot brewing trials
Parameter* 2015 CDC Copeland Average
2014 CDC Copeland Average
2013 CDC Copeland Average
2012 CDC Copeland Average
Conversion time (min.) 16 35 14 12
Time to clear (min.) 5 13 5.5 7
Lautering time (min.) 46 46 42 39
Malt Material Yield (%) 87.3 71.3 89.5 88.0
Wort pH 5.51 5.28 5.28 5.10
Wort Colour (SRM) 6.26 5.06 4.57 9.77
*See glossary for detailed explanation of parameter.
The 2015 crop CDC Copeland averages were better through most of the measured parameters in the brewhouse than the 2014 averages. The 2015 crop CDC Copeland averages showed significantly shorter conversion time and time to clear than the previous year. Malt material yield was also significantly greater than the 2014 crop CDC Copeland averages. Average wort pH was higher than the previous three years. Average wort color was higher than the 2014 and 2013 crop CDC Copeland averages, but significantly lower than the 2012 crop CDC Copeland average. Table 14. CDC Copeland wort sugar concentrations (g/L)
Carbohydrate 2015 CDC
Copeland Average 2014 CDC
Copeland Average 2013 CDC
Copeland Average 2012 CDC
Copeland Average
Maltotetraose 2.74 5.13 2.34 2.67
Maltotriose 14.55 18.71 14.24 15.23
Maltose 55.61 72.61 58.75 56.57
Glucose 12.05 13.84 12.97 14.29
Fructose 2.86 1.67 2.35 4.43
The 2015 crop CDC Copeland exhibited significantly lower levels of fermentable maltose sugars as well as unfermentable maltotetraose sugars compared to the 2014 crop CDC Copeland average (Table 18), but was comparable to the 2013 and 2012 CDC Copeland averages.

2015 Malting Barley Crop Quality Assessment – Preliminary
1365-303 Main Street • Winnipeg, Manitoba, Canada R3C 3G7 • Telephone 204-984-4399 • Fax 204-984-5843 Email [email protected] • Website www.cmbtc.com
Pag
e1
8
Table 15. CDC Copeland fermentation observations
Parameter 2015 CDC Copeland Average
2014 CDC Copeland Average
2013 CDC Copeland Average
2012 CDC Copeland Average
Attenuation Limit (%) 84.0 88.3 90.1 88.9
Average fermentabilty of the wort samples was lower than the previous three CDC Copeland crop years’ averages.
Table 16. Beer analysis for CDC Copeland brewing trials
Parameter 2015 CDC Copeland Average
2014 CDC Copeland Average
2013 CDC Copeland Average
2012 CDC Copeland Average
Apparent Ext. (Plato) 1.72 1.70 1.32 1.47
Real Ext. (Plato) 3.40 3.53 3.48 3.35
Alcohol (v/v %) 4.60 5.01 5.20 5.17
Color (ASBC) 5.13 2.95 3.78 7.21
pH 4.42 4.44 4.25 4.27
Foam (Nibem) 257 181 166 152
Initial Turbidity (FTU) 89.7 31.7 28.3 21.5
Chill Turbidity (FTU) 24 Hr 99.3 31.7 29.3 25.9
The 2015 crop CDC Copeland samples produced beer with a lower average final alcohol concentration than the 2014, 2013, and 2012 crop CDC Copeland average. Final average beer colour for 2015 crop CDC Copeland was higher (darker) than both the 2014 and 2013 crop CDC Copeland average colour readings. 2015 crop CDC Copeland beers had comparable average pH readings to last year’s crop average.

2015 Malting Barley Crop Quality Assessment – Preliminary
1365-303 Main Street • Winnipeg, Manitoba, Canada R3C 3G7 • Telephone 204-984-4399 • Fax 204-984-5843 Email [email protected] • Website www.cmbtc.com
Pag
e1
9
Figure 2. Average 2015 CDC Copeland beer organoleptic properties Rating Scale
0 Less OXIDATION More 10 0 Less Pleasant Palate More Pleasant 10
0 Less Diacetyl More 10 0 Less Bitterness More 10
0 Less Phenols More 10 0 Less Sweetness More 10
0 Less Esters More 10 0 Less Sourness More 10
0 Less Sulfurs More 10 0 Less Maltiness More 10
0 Less Flavour Intensity More 10
During sensory analysis, the 2015 crop CDC Copeland beer received satisfactory average scores (Figure 2). The beer produced from the 2015 crop CDC Copeland was considered normal but with some slight defects. More notably, some dimethyl sulfide and grainy flavours were observed.
2015 Malting Barley Crop Quality Assessment – Preliminary
1365-303 Main Street • Winnipeg, Manitoba, Canada R3C 3G7 • Telephone 204-984-4399 • Fax 204-984-5843 Email [email protected] • Website www.cmbtc.com
Pag
e2
0
For more information, please contact CMBTC: Peter Watts Managing Director Tel: (204) 983-1981 Email: [email protected] Yueshu Li Director of Malting & Brewing Operations Tel: (204) 984-0561 Email: [email protected] Fax: 204-984-5843
Glossary
Attenuation limit: Attenuation limit or Fermentability is important in that it is a measure of the amount of beer that can be produced from the original malt; the higher the better. Brewhouse material efficiency: Brewhouse material efficiency is a metric to determine the ease of obtaining the extract from the mash. Conversion time: Conversion time is a metric that is important for the brewer in regards to the economics of his brewhouse. Longer conversion times could translate into higher operating costs in more energy requirement, higher labour costs or decreased capacity. Conversion time is related to the enzyme content of the malt, and can be manipulated by changing malt: water ratio and temperature. Attenuation limit: A measure of the fermentability or amount of beer that can be produced from the original malt. Typically, a higher value is desired. Runoff time: Time to complete the runoff is a metric that is important for the brewer in regards to the economics of his brewhouse. Longer times could translate into higher operating costs in more energy requirement, higher labour costs or decreased capacity. Runoff time is related to the beta-glucan content of the malt as well as the friability and milling of the malt. Time to clear: Time required for the wort to clear is a metric that is important for the brewer in regards to the economics of his brewhouse as well as the quality of the finished beer. Most brewers want clear wort, it provides better quality beer and also allows for better capacity utilization in fermentation. The time to obtain wort that is clear (less than 100 FTU) is therefore related to capacity and manpower utilization. Wort color: Most international brewers are looking for a lower pale colour to be derived from the malt, so the lower the better. Wort pH: Wort pH is related to beer flavour stability, the higher the pH the more flavour stable the beer is through time. However, the pH cannot be too high or else the possibility of flavour changes and microbiological infection can occur.