Embed Size (px)
Citation preview

CMI
Czech Republic
BIM, NCM
Bulgaria
Supplementary comparison of
measurements of current transformers
EURAMET.EM-S30
Final report
EURAMET Project No 1081
Date: October 2009
Author(s): Emil Dimitrov
Ginka Kumanova
Renata Styblíková
Karel Draxler
Erik Dierikx

Table of contents
1. Introduction ....................................................................................................................3
2. Participants and organisation of the comparison ..............................................................3 2.1. List of participants .............................................................................................3
2.2. Comparison schedule .........................................................................................4 3. Travelling standard and measurement instructions ..........................................................5
3.1. Description of the standard(s).............................................................................5 3.2. Quantities to be measured and conditions of measurement .................................7
3.3. Measurement instructions...................................................................................7 3.4. Deviations from the protocol ..............................................................................7
4. Methods of measurement ................................................................................................8 4.1. Method of CMI ..................................................................................................8
4.2. Method of BIM ..................................................................................................8 5. Measurement results .......................................................................................................9
5.1. Results of the participating institutes ..................................................................9 5.2. Calculation of the reference value and its uncertainty ....................................... 14
5.3. Degrees of equivalence .................................................................................... 14 6. Summary and conclusions............................................................................................. 20
Annex A. Methods of measurement ....................................................................... 21 Annex B. Uncertainty budgets ............................................................................... 23
Annex C. Comparison protocol.............................................................................. 27 Annex D. Optional measurements .......................................................................... 31

Page 3
1. Introduction A supplementary comparison was organized between CMI, Czech Republic and BIM,
Bulgaria, in the field of current transformer ratio measurements. This comparison is registered
as EURAMET project nr. 1081 and EURAMET.EM-S30 in the BIPM key comparison
database.
The aim of the comparison was to demonstrate the improvement and extension of the
calibration and measurement capabilities (CMC’s) of BIM in this working field and to support
the submission of an improved and extended CMC for BIM in Appendix C of the CIPM
mutual recognition arrangement (MRA).
This comparison was organized in the framework of Phare project BG 2005/017-353.02.02,
Lot 1, and was financed in this framework by the EU. This project run from March 2008 to
the end of February 2009.
2. Participants and organisation of the comparison
2.1. List of participants
Participants:
Name: Czech Metrology Institute
Acronym: CMI
Address: Laboratory of Fundamental Metrology
Department of Electromagnetic Quantities
V Botanice 4
150 72 Prague 5
Country: Czech Republic
Contact person: Mrs. Renata Styblíková
Tel.: +420 257 288 335
E-mail: [email protected]
Name: Bulgarian Institute of Metrology, National Centre of Metrology
Acronym: BIM
Address: General Directorate “National Centre of Metrology”
Section “Electric Energy Measurements”
52-B G.M. Dimitrov Blvd.
1040 Sofia
Country: Bulgaria
Contact person: Mr. Emil Dimitrov
Tel.: +359 29702792
E-mail: [email protected]
Comparison coordinator:
Mr. E. Dierikx, VSL Dutch Metrology Institute, The Netherlands
Tel.: +31 15 269 16 88
E-mail: [email protected]

Page 4
2.2. Comparison schedule
The travelling standards were circulated in a schedule A-B-A, as shown in the tables below.
The behaviour of the travelling CMI transformers during the comparison was determined
from the measurements of CMI. The behaviour of the travelling BIM transformer during the
comparison was determined from the measurements of BIM.
In the original schedule, each participant was allowed two weeks to perform the
measurements and to ship the standards to the other participant. However, it appeared that
more time was required to complete the measurements. The actual schedules are given here
below.
CMI transformers
Participant Measurements from to
CMI 21-10-2008 18-11-2008
BIM 04-12-2008 06-01-2009
CMI 30-01-2009 09-02-2009
BIM transformer
Participant Measurements from to
BIM 30-10-2008 14-11-2008
CMI 07-12-2008 21-01-2009
BIM 03-02-2009 03-02-2009
The transport of the travelling standards was arranged by door-to-door parcel service.

Page 5
3. Travelling standard and measurement instructions
3.1. Description of the standard(s)
Description, relevant technical data:
1. Tettex 4720 – for ratios (0.1; 1; 5 and 100) A/5 A; burden max. 5 VA;
accuracy ± 0.01 % and ± 0.5 min
Serial number: 116 426
Owner: CMI
2. CLA 2.2 – 500 A/5 A; class 0.2; burden 5 VA
Serial number: 269954/08
Owner: CMI
3. CLA 3.2 – 1000 A/5 A; class 0.1; burden 5 VA
Serial number: 269955/08
Owner: CMI
4. CLB 10 – 2000 A/5 A; class 0.1; burden 5 VA
Serial number: 269956/08
Owner: CMI
5. I 523 – 4000 A/5 A; class 0.05; nominal burden 15 VA
Serial number: 18/1981
Owner: BIM
Figure 1. CMI Tettex transformer
Figure 2. CMI Tettex transformer

Page 6
Figure 3. CMI transformers
(from left to right CLA 3.2, CLB 10 and CLA 2.2)
Figure 5. CMI transformers
Figure 4. BIM transformer: I 523

Page 7
3.2. Quantities to be measured and conditions of measurement
The quantities to be measured are the current error and the phase displacement.
εX Current error: The error which a transformer introduces into the measurement of a
current and which arises from the fact that the actual transformation ratio is not equal to the
rated transformation ratio. The current error expressed in ppm is given by the formula:
εX (ppm) = 106·( Kn Is – Ip ) / Ip
Kn Rated transformation ratio.
Ip Actual primary current.
Is Actual secondary current when Ip is flowing under the conditions of
measurement.
I/In Excitation current, expressed in percent of rated current.
δX Phase displacement: The difference in phase, expressed in minutes, between the
primary and secondary current vectors, the direction of the vectors being chosen in such a
way that the angle is zero for a perfect transformer. The phase displacement is said to be
positive when the secondary current vector leads the primary current vector.
The measurements were to be performed at a frequency of 50 Hz.
The measurements were to be performed at an ambient temperature of (23 ± 1) ºC.
The comparison was made by measuring the following ratios: primary (4000, 2000, 1000,
500, 100, 5, 1 and 0.5) A / secondary 5 A. All ratios had to be measured with a burden of 5
VA at unity power factor. The measurements were performed at 120 %, 100 %, 20 % and 5 %
of the rated current. For ratios with primary current less than 5 A, the point at 5 % was
replaced by 10 %.
3.3. Measurement instructions
The participants were asked to follow their usual measurement procedure corresponding to
their best measurement capabilities.
3.4. Deviations from the protocol
- The protocol listed the ratio 0.1 A/ 5A as one of the points to be measured. However,
CMI was not ready to perform this measurement. Therefore, it was decided to replace this
measurement with 0.5 A/5 A.
- There was some deviation from the original schedule in the protocol. The actual
schedule of measurements is given in section 2.2 of this report.

Page 8
4. Methods of measurement
4.1. Method of CMI
Comparison against standard current comparator Tettex 4764 (for range of primary current
5 A up to 4 kA) or Tettex 4761 (for range of primary current 1 A and 0,5 A). Errors were
measured by a commercial test set Tettex 2767; used burden Tettex 3691 (set value 5 VA
real).
The reference values for both standards (current comparators) can be linked to the results of
the international comparison EUROMET.EM-S11 (EUROMET project nr. 612).
4.2. Method of BIM
Comparison against standard current transformer with errors measured on commercial test set
Tettex 2767.
- For the the 5 A to 4000 A ratio, the BIM reference standard was an electronically
compensated current comparator Tettex 4764.
- For the 0.5 A to 1 A ratio, the BIM reference standard was a passive current transformer
MWB type NJ 0.5b.
- Both reference standards were calibrated at PTB in 2006.

Page 9
5. Measurement results
5.1. Results of the participating institutes
Reported ambient conditions:
Temperature
°C
Relative Humidity
%
BIM 23.0 ± 1.0 45 ± 5
CMI 23.0 ± 0.5 40 ± 5
Burden: 5 VA; cos = 1
Frequency: 50 Hz
The reported results from both laboratories are given in the graphs and tables on the following
pages.

Page 10
0.5 A / 5 A
-120
-90
-60
-30
0
30
60
90
120
120 100 20 10
I/In [%]
Ratio e
rror
[x 1
0-6]
CMI BIM
0.5 A / 5 A
-1.00
-0.80
-0.60
-0.40
-0.20
0.00
0.20
0.40
0.60
0.80
1.00
120 100 20 10
I/In [%] [m
inute
s]
CMI BIM
CMI CMI BIM BIM
k I/In U( ) U( ) U( ) U( )
(A/A) (%) (x10-6) (x10-6) (minutes) (minutes) (x10-6) (x10-6) (minutes) (minutes)
0.5/5 120 57 21 -0.51 0.09 31 52 -0.19 0.27
0.5/5 100 56 21 -0.46 0.09 31 52 -0.16 0.27
0.5/5 20 71 20 0.08 0.14 52 52 0.41 0.27
0.5/5 10 88 22 0.31 0.17 63 52 0.60 0.27
1 A / 5 A
-50
-25
0
25
50
75
100
125
150
120 100 20 10
I/In [%]
Ratio e
rror
[x 1
0-6
]
CMI BIM
1 A / 5 A
-1.00
-0.80
-0.60
-0.40
-0.20
0.00
0.20
0.40
0.60
0.80
1.00
120 100 20 10
I/In [%]
[m
inute
s]
CMI BIM
CMI CMI BIM BIM
k I/In U( ) U( ) U( ) U( )
(A/A) (%) (x10-6) (x10-6) (minutes) (minutes) (x10-6) (x10-6) (minutes) (minutes)
1/5 120 65 20 -0.38 0.13 31 52 -0.24 0.27
1/5 100 63 20 -0.33 0.13 35 52 -0.22 0.27
1/5 20 77 19 0.20 0.17 61 52 0.34 0.27
1/5 10 95 22 0.43 0.16 73 52 0.42 0.27

Page 11
5 A / 5 A
0
25
50
75
100
125
150
175
200
225
250
120 100 20 5
I/In [%]
Ratio e
rror
[x 1
0-6
]
CMI BIM
5 A / 5 A
-1.00
-0.80
-0.60
-0.40
-0.20
0.00
0.20
0.40
0.60
0.80
1.00
120 100 20 5
I/In [%]
[m
inute
s]
CMI BIM
CMI CMI BIM BIM
k I/In U( ) U( ) U( ) U( )
(A/A) (%) (x10-6) (x10-6) (minutes) (minutes) (x10-6) (x10-6) (minutes) (minutes)
5/5 120 59 30 -0.34 0.09 46 32 0.02 0.11
5/5 100 56 30 -0.29 0.09 56 32 -0.13 0.11
5/5 20 70 28 0.24 0.14 84 32 0.43 0.11
5/5 5 97 25 0.59 0.17 169 52 0.79 0.21
100 A / 5 A
0
25
50
75
100
125
150
175
200
120 100 20 5
I/In [%]
Ratio e
rror
[x 1
0-6
]
CMI BIM
100 A / 5 A
-1.00
-0.80
-0.60
-0.40
-0.20
0.00
0.20
0.40
0.60
0.80
1.00
120 100 20 5
I/In [%]
[m
inute
s]
CMI BIM
CMI CMI BIM BIM
k I/In U( ) U( ) U( ) U( )
(A/A) (%) (x10-6) (x10-6) (minutes) (minutes) (x10-6) (x10-6) (minutes) (minutes)
100/5 120 79 25 -0.39 0.08 74 32 -0.33 0.11
100/5 100 78 27 -0.35 0.08 75 32 -0.32 0.11
100/5 20 75 31 0.17 0.12 81 32 0.25 0.11
100/5 5 108 28 0.53 0.15 146 52 0.76 0.21
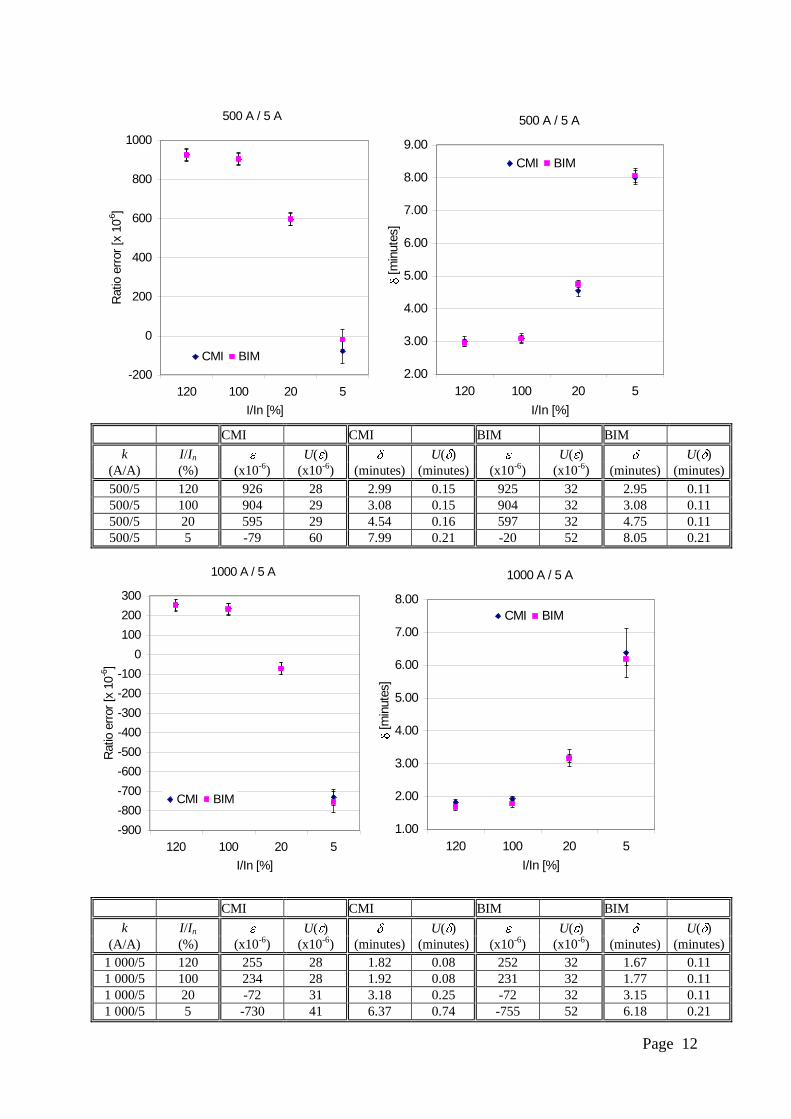
Page 12
500 A / 5 A
-200
0
200
400
600
800
1000
120 100 20 5
I/In [%]
Ratio e
rror
[x 1
0-6]
CMI BIM
500 A / 5 A
2.00
3.00
4.00
5.00
6.00
7.00
8.00
9.00
120 100 20 5
I/In [%]
[m
inute
s]
CMI BIM
CMI CMI BIM BIM
k I/In U( ) U( ) U( ) U( )
(A/A) (%) (x10-6) (x10-6) (minutes) (minutes) (x10-6) (x10-6) (minutes) (minutes)
500/5 120 926 28 2.99 0.15 925 32 2.95 0.11
500/5 100 904 29 3.08 0.15 904 32 3.08 0.11
500/5 20 595 29 4.54 0.16 597 32 4.75 0.11
500/5 5 -79 60 7.99 0.21 -20 52 8.05 0.21
1000 A / 5 A
-900
-800
-700
-600
-500
-400
-300
-200
-100
0
100
200
300
120 100 20 5
I/In [%]
Ratio e
rror
[x 1
0-6
]
CMI BIM
1000 A / 5 A
1.00
2.00
3.00
4.00
5.00
6.00
7.00
8.00
120 100 20 5
I/In [%]
[m
inute
s]
CMI BIM
CMI CMI BIM BIM
k I/In U( ) U( ) U( ) U( )
(A/A) (%) (x10-6) (x10-6) (minutes) (minutes) (x10-6) (x10-6) (minutes) (minutes)
1 000/5 120 255 28 1.82 0.08 252 32 1.67 0.11
1 000/5 100 234 28 1.92 0.08 231 32 1.77 0.11
1 000/5 20 -72 31 3.18 0.25 -72 32 3.15 0.11
1 000/5 5 -730 41 6.37 0.74 -755 52 6.18 0.21

Page 13
2000 A / 5 A
-800
-600
-400
-200
0
200
400
600
120 100 20 5
I/In [%]
Ratio e
rror
[x 1
0-6
]
CMI BIM
2000 A / 5 A
1.00
2.00
3.00
4.00
5.00
6.00
7.00
120 100 20 5
I/In [%]
[m
inute
s]
CMI BIM
CMI CMI BIM BIM
k I/In U( ) U( ) U( ) U( )
(A/A) (%) (x10-6) (x10-6) (minutes) (minutes) (x10-6) (x10-6) (minutes) (minutes)
2 000/5 120 365 48 2.13 0.17 466 32 1.92 0.11
2 000/5 100 335 51 2.32 0.17 445 32 2.13 0.11
2 000/5 20 3 61 3.88 0.19 130 32 4.04 0.11
2 000/5 5 -654 70 6.21 0.22 -383 52 6.22 0.21
4000 A / 5 A
-150
-125
-100
-75
-50
-25
0
25
50
120 100 20 5
I/In [%]
Ratio e
rror
[x 1
0-6
]
CMI BIM
4000 A / 5 A
-0.80
-0.60
-0.40
-0.20
0.00
0.20
0.40
0.60
0.80
1.00
1.20
120 100 20 5
I/In [%]
[m
inute
s]
CMI BIM
CMI CMI BIM BIM
k I/In U( ) U( ) U( ) U( )
(A/A) (%) (x10-6) (x10-6) (minutes) (minutes) (x10-6) (x10-6) (minutes) (minutes)
4 000/5 120 -93 17 0.50 0.08 -87 32 0.40 0.11
4 000/5 100 -92 17 0.53 0.08 -83 32 0.48 0.11
4 000/5 20 -73 18 0.81 0.08 -48 32 0.73 0.11
4 000/5 5 -66 22 0.97 0.12 -42 52 0.92 0.21

Page 14
5.2. Calculation of the reference value and its uncertainty
For the current ratios in the range from 1/5 A/A to 1000/5 A/A, CMI participated in the
supplementary comparison EUROMET.EM-S11 with 15 participants. To allow a comparison
of the BIM results with the results of the participants in EUROMET.EM-S11, the BIM results
are, thus, referred to the reference value of this comparison, as described in Sect. 5.3 below.
For the current ratios 0.5/5 A/A, 2000/5 A/A and 4000/5 A/A, there are no results available
from previous comparisons. For this reason, only the degree of equivalence between the two
laboratories are determined for these ratios.
5.3. Degrees of equivalence
The degree of equivalence (Dij) ( i is for rated transformation ratio and j is excitation current)
of BIM, NCM with respect to the reference values of the comparison EUROMET.EM-S11 is
found from the difference between the BIM result and the CMI result, corrected for the
difference of the CMI results to the reference values of EUROMET.EM-S11, for both the
ratio error and the phase displacement :
CMICMIBIMijD
CMICMIBIMijD
where
CMI (
CMI) is CMI ( CMI ) deviation from the comparison reference values of
EUROMET.EM-S11.
The relevant uncertainties u(Dij) (k=1) are given by:
2
11
22
SCMICMIBIMij uuuDu
2
11
22
SCMICMIBIMij uuuDu
where it is assumed that there is no significant correlation between the results of BIM and the
results of CMI.
The expanded uncertainties U(Dij) (k=2) are:
ijij DuDU 2
ijij DuDU 2

Page 15
For the current ratios 0.5/5 A/A, 2000/5 A/A and 4000/5 A/A the degree of equivalence (Dij)
are:
CMIBIMijD
CMIBIMijD .
The degrees of equivalence are given in the tables and graphs on the following pages.

Page 16
0,5 A / 5 A
-100
-80
-60
-40
-20
0
20
40
60
80
100
120 100 20 10
I/In [%]
D(ε
i) [x 1
0-6
]
0,5 A / 5 A
-1,00
-0,80
-0,60
-0,40
-0,20
0,00
0,20
0,40
0,60
0,80
1,00
120 100 20 10
I/In [%]
D(δ
i) [m
inute
s]
k I/In D( ) U(D( )) D( ) U(D( ))
(A/A) (%) (x10-6) (x10-6) (minutes) (minutes)
0.5/5 120 -26 56 0.32 0.28
0.5/5 100 -25 56 0.30 0.29
0.5/5 20 -19 56 0.33 0.30
0.5/5 10 -25 56 0.29 0.32
1 A / 5 A
-100
-80
-60
-40
-20
0
20
40
60
80
100
120 100 20 10
I/In [%]
D(ε
i) [x10-6
]
1 A / 5 A
-1,00
-0,80
-0,60
-0,40
-0,20
0,00
0,20
0,40
0,60
0,80
1,00
120 100 20 10
I/In [%]
D(δ
i) [m
inute
s]
k I/In D( ) U(D( )) D( ) U(D( ))
(A/A) (%) (x10-6) (x10-6) (minutes) (minutes)
1/5 120 -35 57 0.13 0.30
1/5 100 -29 57 0.11 0.30
1/5 20 -17 57 0.14 0.33
1/5 10 -23 61 -0.02 0.32

Page 17
5 A / 5 A
-100
-80
-60
-40
-20
0
20
40
60
80
100
120 100 20 5
I/In [%]
D(ε
i) [x 1
0-6
]
5 A / 5 A
-1,00
-0,80
-0,60
-0,40
-0,20
0,00
0,20
0,40
0,60
0,80
1,00
120 100 20 5
I/In [%]
D(δ
i) [x 1
0-6
]
k I/In D( ) U(D( )) D( ) U(D( ))
(A/A) (%) (x10-6) (x10-6) (minutes) (minutes)
5/5 120 -14 45 0.37 0.15
5/5 100 0 45 0.17 0.15
5/5 20 14 44 0.19 0.19
5/5 5 72 60 0.20 0.28
100 A / 5 A
-100
-80
-60
-40
-20
0
20
40
60
80
100
120 100 20 5
I/In [%]
D(ε
i) [x10-6
]
100 A / 5 A
-1,00
-0,80
-0,60
-0,40
-0,20
0,00
0,20
0,40
0,60
0,80
1,00
120 100 20 5
I/In [%]
D(δ
i) [m
inute
s]
k I/In D( ) U(D( )) D( ) U(D( ))
(A/A) (%) (x10-6) (x10-6) (minutes) (minutes)
100/5 120 -4 42 0.06 0.14
100/5 100 -3 44 0.04 0.14
100/5 20 7 47 0.09 0.18
100/5 5 38 61 0.24 0.28

Page 18
500 A / 5 A
-100
-80
-60
-40
-20
0
20
40
60
80
100
120 100 20 5
I/In [%]
D(ε
i) [x 1
0-6]
500 A / 5 A
-1,00
-0,80
-0,60
-0,40
-0,20
0,00
0,20
0,40
0,60
0,80
1,00
120 100 20 5
I/In [%]
D(δ
i) [m
inute
s]
k I/In D( ) U(D( )) D( ) U(D( ))
(A/A) (%) (x10-6) (x10-6) (minutes) (minutes)
500/5 120 3 44 -0.04 0.19
500/5 100 4 45 0.00 0.19
500/5 20 5 46 0.21 0.21
500/5 5 63 81 0.06 0.31
1000 A / 5 A
-100
-80
-60
-40
-20
0
20
40
60
80
100
120 100 20 5
I/In [%]
D(ε
i) [x10-6
]
1000 A / 5 A
-1,00
-0,80
-0,60
-0,40
-0,20
0,00
0,20
0,40
0,60
0,80
1,00
120 100 20 5
I/In [%]
D(δ
i) [m
inute
s]
k I/In D( ) U(D( )) D( ) U(D( ))
(A/A) (%) (x10-6) (x10-6) (minutes) (minutes)
1 000/5 120 0 44 -0.14 0.14
1 000/5 100 0 44 -0.14 0.14
1 000/5 20 4 47 -0.03 0.28
1 000/5 5 -22 68 -0.19 0.77

Page 19
2000 A / 5 A
-300
-200
-100
0
100
200
300
120 100 20 5
I/In [%]
D(ε
i) [x 1
0-6
]
2000 A / 5 A
-1,00
-0,80
-0,60
-0,40
-0,20
0,00
0,20
0,40
0,60
0,80
1,00
120 100 20 5
I/In [%]
D(δ
i) [m
inute
s]
k I/In D( ) U(D( )) D( ) U(D( ))
(A/A) (%) (x10-6) (x10-6) (minutes) (minutes)
2 000/5 120 101 58 -0.21 0.20
2 000/5 100 110 60 -0.19 0.20
2 000/5 20 127 69 0.16 0.22
2 000/5 5 271 88 0.01 0.30
4000 A / 5 A
-100
-80
-60
-40
-20
0
20
40
60
80
100
120 100 20 5
I/In [%]
D(ε
i) [x10-6
]
4000 A / 5 A
-1,00
-0,80
-0,60
-0,40
-0,20
0,00
0,20
0,40
0,60
0,80
1,00
120 100 20 5
I/In [%]
D(δ
i) [m
inute
s]
k I/In D( ) U(D( )) D( ) U(D( ))
(A/A) (%) (x10-6) (x10-6) (minutes) (minutes)
4 000/5 120 6 36 -0.10 0.13
4 000/5 100 9 36 -0.05 0.13
4 000/5 20 25 36 -0.08 0.14
4 000/5 5 24 57 -0.05 0.24

Page 20
6. Summary and conclusions For all of the current ratio error measurements, except for the measurements at 2 kA, there is a
good agreement between BIM, NCM (Bulgaria) and CMI (Czech Republic). The cause of this
significant discrepancy was investigated through additional measurements provided by CMI.
The results of these measurements are given in Annex D.
For the current phase displacement measurements, the agreement on several measurement
points is marginal or there are even small discrepancies. This should also be investigated in
further detail.
7. References [1] IEC 60044-1:2002 Edition 1.2 Instrument Transformers – Part 1: Current Transformers
[2] BIPM, IEC, IFCC, ISO,IUPAP, OIML, Guide to the Expression of Uncertainty in
Measurement, International Organization for Standardization, Geneva, First Edition 1993
[3] EUROMET.EM-S11: EUROMET Projects 473 and 612 – Comparison of the
measurement of current transformers (CTs). Final report.

Annex A page 21
Annex A. Methods of measurement
A.1 Detailed description of the BIM measurement set-up and method
of measurement
The measurements were performed using an electronic measurement system. The transformer
test set measures the transfer standard (marked as DUT) errors by dividing the differential
current into two components. These values are evaluated automatically as current error (CE)
and phase displacement (PE) by the test set electronics. The display "In %" on the test set
indicates the percentage of the nominal ratio.
The burden used is an electronic current burden which compensates the ohmic resistance of
the measurement circuit.
A schematic diagram is given below.
Schematic diagram of the BIM set-up
The power supply runs for 6 minutes and must then be switched off for 24 minutes.
Within the 6 minutes, a series of 10 measurements is performed.
This cycle of 30 minutes has been repeated 10 times for each ratio.

Annex A page 22
A.2 Detailed description of the CMI measurement set-up and method
of measurement
In above shown connection a set of SEVERAL measurments was performed.
For the CLA, CLB and Tettex transformers:
3 sets in October - November, 2 sets in January - February
For the transfer standard Tettex 4720 each measurement was performed twice, at first at the
position "1" and then at the position "2" (with commutated primary current) – see figure
below. Resuts of these two measurements were averaged and this mean value was taken as a
result of one measurement.
For the I523 transformer a set of 10 measurements was performed.
kN
PC
IEEE 488
I1
I2X I2N
ICT UNDER TEST
STANDARD TETTEX
4764/4761
CURRENT SOURCE TETTEX
5260
KN LN
lN
AUTOMATIC TRANSFORMER
TEST SET TETTEX 2767
Kx Lx BURDEN TETTEX
3691
lx
kx
I I
P
Basic calibration layout in CMI
ICT under test
supply
transformer
KX KN LX LX
Tettex 2767
TETTEX 2767 AUTOMATIC TEST SET
kX lX lN kN
1
1
2
burden
Tettex 4720 standard
Principle of primary current commutation by measurement of the Tettex 4720 transformer

Annex B page 23
Annex B. Uncertainty budgets
B.1 Detailed uncertainty budget for BIM
Uncertainty Budget: Current error in percent 0,5A/5A 100%
Source of uncertainty Distribution Value Type u(xi) i ci ui(y)
1 repeatability Normal -0.00786 A 6.56E-05 9 1 6.56E-05
2 calibration of the reference standard Normal 0.011 B 0.0025 50 1 0.0025
3 error in the bridge Rectangular 0 B 0.000187 infinity 1 0.000187
4 drift of the reference standard Rectangular 0 B 0.000289 infinity 1 0.000289
5 resolution of test set Rectangular 0 B 2.89E-05 infinity 1 2.89E-05
6 error due to burden setting Rectangular 0 B 5.77E-05 infinity 1 5.77E-05
7 error due to current setting Rectangular 0 B 7.22E-05 infinity 1 7.22E-05
8 circuit and temperature influence Rectangular 0 B 5.77E-05 infinity 1 5.77E-05
y Normal 0.00314 0.002527 52.18759
k = 2.0491
Result = 0.0031 U = 0.0052
Uncertainty Budget: Phase displacement in minutes 0,5A/5A 100%
i Source of uncertainty Distribution Value Type u(xi) i ci ui(y)
1 repeatability Normal -0.3611 A 0.0002161 9 1 0.000216
2 calibration of the reference standard Normal 0.2 B 0.1 50 1 0.1
3 error in the bridge Rectangular 0 B 0.006399 infinity 1 0.006399
4 drift of the reference standard Rectangular 0 B 0.0866 infinity 1 0.0866
5 resolution of test set Rectangular 0 B 0.00289 infinity 1 0.00289
6 error due to burden setting Rectangular 0 B 0.00204 infinity 1 0.00204
7 error due to current setting Rectangular 0 B 0.002448 infinity 1 0.002448
8 circuit and temperature influence Rectangular 0 B 0.00204 infinity 1 0.00204
y Normal -0.1611 0.1325263 infinity
k = 2.0000
Result = -0.16 U = 0.27

Annex B page 24
Uncertainty Budget: Current error in percent 1kA/5A 100%
Source of uncertainty Distribution Value Type u(xi) i ci ui(y)
1 repeatability Normal 0.023101 A 3.82E-06 9 1 3.82E-06
2 calibration of the reference standard Normal 0 B 0.0015 50 1 0.0015
3 error in the bridge Rectangular 0 B 0.000213 infinity 1 0.000213
4 drift of the reference standard Rectangular 0 B 0.00031 infinity 1 0.00031
5 resolution of test set Rectangular 0 B 2.89E-05 infinity 1 2.89E-05
6 error due to burden setting Rectangular 0 B 5.77E-05 infinity 1 5.77E-05
7 error due to current setting Rectangular 0 B 7.22E-05 infinity 1 7.22E-05
8 circuit and temperature influence Rectangular 0 B 5.77E-05 infinity 1 5.77E-05
y Normal 0.023101 0.001551 57.08771
k = 2.0448
Result = 0.0231 U = 0.0032
Uncertainty Budget: Phase displacement in minutes 1kA/5A 100%
i Source of uncertainty Distribution Value Type u(xi) i ci ui(y)
1 repeatability Normal 1.77407 A 0.0002458 9 1 0.000246
2 calibration of the reference standard Normal 0 B 0.05 50 1 0.05
3 error in the bridge Rectangular 0 B 0.008846 infinity 1 0.008846
4 drift of the reference standard Rectangular 0 B 0.0154 infinity 1 0.0154
5 resolution of test set Rectangular 0 B 0.00289 infinity 1 0.00289
6 error due to burden setting Rectangular 0 B 0.00204 infinity 1 0.00204
7 error due to current setting Rectangular 0 B 0.002448 infinity 1 0.002448
8 circuit and temperature influence Rectangular 0 B 0.00204 infinity 1 0.00204
y Normal 1.77407 0.0532742 64.4403153
k = 2.0395
Result = 1.77 U = 0.11

Annex B page 25
Uncertainty Budget: Current error in percent 4kA/5A 100%
Source of uncertainty Distribution Value Type u(xi) i ci ui(y)
1 repeatability Normal -0.00827 A 8.37E-06 9 1 8.37E-06
2 calibration of the reference standard Normal 0 B 0.0015 50 1 0.0015
3 error in the bridge Rectangular 0 B 0.000188 infinity 1 0.000188
4 drift of the reference standard Rectangular 0 B 0.00031 infinity 1 0.00031
5 resolution of test set Rectangular 0 B 2.89E-05 infinity 1 2.89E-05
6 error due to burden setting Rectangular 0 B 5.77E-05 infinity 1 5.77E-05
7 error due to current setting Rectangular 0 B 7.22E-05 infinity 1 7.22E-05
8 circuit and temperature influence Rectangular 0 B 5.77E-05 infinity 1 5.77E-05
y Normal -0.00827 0.001547 56.61524
k = 2.0451
Result = -0.0083 U = 0.0032
Uncertainty Budget: Phase displacement in minutes 4kA/5A 100%
i Source of uncertainty Distribution Value Type u(xi) i ci ui(y)
1 repeatability Normal 0.47874 A 0.0009608 9 1 0.000961
2 calibration of the reference standard Normal 0 B 0.05 50 1 0.05
3 error in the bridge Rectangular 0 B 0.006603 infinity 1 0.006603
4 drift of the reference standard Rectangular 0 B 0.0154 infinity 1 0.0154
5 resolution of test set Rectangular 0 B 0.00289 infinity 1 0.00289
6 error due to burden setting Rectangular 0 B 0.00204 infinity 1 0.00204
7 error due to current setting Rectangular 0 B 0.002448 infinity 1 0.002448
8 circuit and temperature influence Rectangular 0 B 0.00204 infinity 1 0.00204
y Normal 0.47874 0.0529561 62.9150174
k = 2.0405
Result = 0.48 U = 0.11

Annex B page 26
B.2 Detailed uncertainty budget for CMI
Uncertainty budget was calculated for current transformer I523, Ser. No. 18 1981, transformation ratio 4 kA/5 A
Transformation ratio: 4 kA/5 A
Burden: 5 VA real
Point of measurement: I1 = 100 % IN
Used standards: Current comparator Tettex 4764, Ser. No. 143 473
Errors: ±10 ppm and ±0,05 '
Automatic transformer test set Tettex 2767, Ser. No. 141 727
Limits of errors:
Ratio error: ± 0,5 % RDG ± (0,5 % FS or 10 ppm) - greater of both values applies
Used range: 0,1999 %
Phase displacement: ± 0,5 % RDG ± (0,5 % FS or 0,034') - greater of both values applies
Used range: 1,999' and 19,99'
Programmable electronic current burden Tettex 3691, Ser. No. 141 474
Ratio error uncertainty
probable
Source of uncertainty value (ppm) type distribution divisor Ci ui (ppm) Vi
standard current comparator 10 B rectangular 3 1 5.8 ∞
transformer test set 11 B rectangular 3 1 6.1 ∞
Burden 2 B rectangular 3 1 1.2 ∞
circuit configuration 2 B rectangular 3 1 1.2 ∞
repeatability 1 A normal 1 1 0.9 9
combined uncertainty 8.6
expanded uncertainty, k = 2 U ( I)
(ppm) 17.2
Phase displacement uncertainty
probable
Source of uncertainty value ( ' ) type distribution divisor Ci ui ( ' ) Vi
standard current comparator 0.050 B rectangular 3 1 0.03 ∞
transformer test set 0.037 B rectangular 3 1 0.02 ∞
Burden 0.010 B rectangular 3 1 0.01 ∞
circuit configuration 0.010 B rectangular 3 1 0.01 ∞
repeatability 0.011 A normal 1 1 0.01 9
combined uncertainty 0.04
expanded uncertainty, k = 2 U( I) ( ) 0.08
Explanatory notes:
Ci sensitivity coefficient
ui standard uncertainty
Vi degrees of freedom

Annex C page 27
Annex C. Comparison protocol
Comparison of the measurements of current transformers (CTs)
Introduction
This comparison is organized in the framework of, and financed by:
Phare project BG 2005/017-353.02.02, LOT 1.
This project runs from March 2008 to the end of February 2009.
Current transformer measurements made by the participating NMIs support a large number of
measurements made in the electrical generation, supply and distribution industries in their
own countries. They also support many transformer manufacturers.
Participants
BIM - NCM, Sofia, Bulgaria
Address:
Bulgarian Institute of Metrology
General Directorate “National Centre of Metrology”
Section “Electric Energy Measurements”
52-B G.M. Dimitrov Blvd.
1040 Sofia
Emil Dimitrov
Tel. +359 29702792
E-mail: [email protected]
CMI, Czech Metrological Institute, Prague, Czech Republic
Address:
Czech Metrology Institute
Laboratory of Instrument Transformers
V Botanice 4
CZ-150 72 Prague 5
Renata Styblíková
Tel: +420 257 288 335

Annex C page 28
Quantities to be measured
εX Current error: The error which a transformer introduces into the measurement of a
current and which arises from the fact that the actual transformation ratio is not equal
to the rated transformation ratio. The current error expressed in ppm is given by the
formula:
Current error (ppm) = 106.( Kn Is – Ip ) / Ip
Kn Rated transformation ratio.
Ip Actual primary current.
Is Actual secondary current when Ip is flowing under the conditions of measurement.
I/In Excitation current, expressed in percent of rated current.
δX Phase displacement: The difference in phase, expressed in minutes, between the
primary and secondary current vectors, the direction of the vectors being so chosen
that the angle is zero for a perfect transformer. The phase displacement is said to be
positive when the secondary current vector leads the primary current vector.
Co-ordinator
The co-ordinator of this comparison in the Phare project is:
Erik Dierikx
NMI Van Swinden Laboratorium BV
Tel: +31 15 269 1688
Support group of the comparison
The support group of this comparison consists of:
The contact persons from the participating laboratories and the co-ordinator of the
comparison.
Travelling standards
1. Tettex 4720 – for ratios (0.1; 1; 5 and 100) A/5 A; burden max. 5 VA; accuracy ± 0.01
% and ± 0.5 min
Serial number: 116 426
Owner: CMI
2. CLA 2.2 – 500 A/5 A; class 0.2; burden 5 VA
Serial number: 269954/08
Owner: CMI
3. CLA 3.2 – 1000 A/5 A; class 0.1; burden 5 VA
Serial number: 269955/08
Owner: CMI

Annex C page 29
4. CLB 10 – 2000 A/5 A; class 0.1; burden 5 VA
Serial number: 269956/08
Owner: CMI
The insurance value of CMI owned transformers is 1 500 EUR
5. I 523 – 4000 A/5 A; class 0.05; nominal burden 15 VA
Serial number: 18/1981
Insurance value: 1 000 EUR
Owner: NCM
Transportation information
CMI and NCM will be responsible for arranging transportation to each other. CMI and NCM
should inform each other when the travelling standards are sent.
Each laboratory is responsible for proper insurance of the standards during the stay in its
laboratory and during transport to the other laboratory.
Circulation scheme and timetable
Including time for transportation:
For the CMI transformers:
Laboratory Period of measurements
CMI, Czech Republic 20 October 2008 to 10 November 2008
NCM, Bulgaria 10 November 2008 to 1 December 2008
CMI, Czech Republic 1 December 2008 to 7 December 2008
For the NCM transformer:
Laboratory Period of measurements
NCM, Bulgaria 20 October 2008 to 10 November 2008
CMI, Czech Republic 10 November 2008 to 1 December 2008
NCM, Bulgaria 1 December 2008 to 7 December 2008
Measurements
Measurements should be made at frequency 50 Hz.
Measurements should be made at (23 ± 1) ºC.
Comparison will be made by measuring following ratios: 4000, 2000, 1000, 500, 100, 5, 1 &
0.1/ secondary 5 A. All ratios should be measured with a burden 5 VA at unity power factor.
Measurements will be performed with the following % of rated current: 120, 100, 20 and 5.
For ratios with primary current less than 5 A the point 5 % should be replaced with 10 %.

Annex C page 30
Report
The report should be sent to the co-ordinator as soon as possible (or at least within 6 weeks)
after completing the measurements. In addition to the results, the report should contain a brief
description of the measurement technique and all relevant conditions.
The report should contain an uncertainty budget. The uncertainty calculations should comply
with the requirements of the GUM for the calculation of the uncertainty of measurement. The
report should include the degrees of freedom and the complete budget of uncertainty.
The co-ordinator, as independent party, will collect all the measurement reports and will keep
them confidential until all reports have been received. When all reports have been collected,
they will be sent to NCM who will do the data analysis and who will prepare the final report.
The co-ordinator will observe that the original data (including uncertainties) are not changed
anymore.
,by the end of January 2009, the Report - Draft A, will be prepared. The Draft B Report has to
be completed before the end of the project, which is 28 February 2009.
Computation of the reference value
The reference values in this comparison will be the results from the linking laboratory.
Therefore, for most of the measurements, CMI will be the linking laboratory. Only for the
ratio 0.1 A/ 5 A, NCM will be the linking laboratory.
Emil Dimitrov
September 2008
Annex A
Uncertainty budget table
Annex B
Summary of results form (Table)

Annex D page 31
Annex D. Optional measurements
The CLB 10, kI = 2 kA/5 A at a burden 5 VA real is measured in November 2008 and in
February 2009.
After result processing in VSL pilot lab CMI
tried to explore a source of big result
differences between CMI and BIM. It has
emerged that values and measured errors
depend strongly on primary cable position in
the transformer opening. For this reason in
March an error dependence on primary cable
position has been explored (see Fig. 1, CMI
primary conductor was formed by two round
parallel cables).
Results of these measurements are given in
Table 1. Results for the "position 0" are given
partly by results measured in February and
partly by supplementary results measured
later in March.
It can be assumed from results that by the measurements performed in CMI in November the
primary conductor was placed probably in the top part of the transformer opening. The results
of BIM (the last column in Table 1) correspond rather to the "position 1" – primary cables on
the bottom of the transformer opening which was confirmed by BIM laboratory that CLB 10
measurements was performed with copper bus placed on the bottom of the transformer
opening.
We assume that the error dependence on primary conductor position depends on small cross
section of the transformer core (toroidal core dimensions: Ø = 123/108 mm, h = 15 mm).
I [%]
CMI BIM
position 0 position 1 position 2
I (ppm) I (ppm) I (ppm) I (ppm)
120 397 467 355 466
100 369 441 319 445
20 45 188 -14 130
5 -602 -390 -645 -383
I [%] I ( I ( I ( I (
120 2,23 2,25 1,70 1,92
100 2,42 2,45 1,88 2,13
20 3,97 3,93 3,37 4,04
5 6,35 6,15 5,45 6,22
Table 1.
primary
conductor
position 2
position 0
position 1
secondary
terminals
Fig. 1