Embed Size (px)
Citation preview
CMMI/CMS’s Health Care Innovation Awards
and Opportunities for Philanthropy to
Advance Population Health
Patrick H. Conway, MD
Darshak Sanghavi, MD
The CMS Innovation Center
The purpose of the Center is to test innovative
payment and service delivery models to reduce
program expenditures under Medicare, Medicaid,
and CHIP… while preserving or enhancing the
quality of care furnished.
- The Affordable Act

Delivery System Reform
• Our vision for improving health delivery is about better,
smarter, healthier.
• If we find better ways to deliver care, pay providers,
and distribute information, we can receive better
care, spend our dollars more wisely, and have healthier
people and communities, and a healthier economy.
• Continue to work across sectors for the goals we
share: better care, smarter spending, and healthier
people.
3
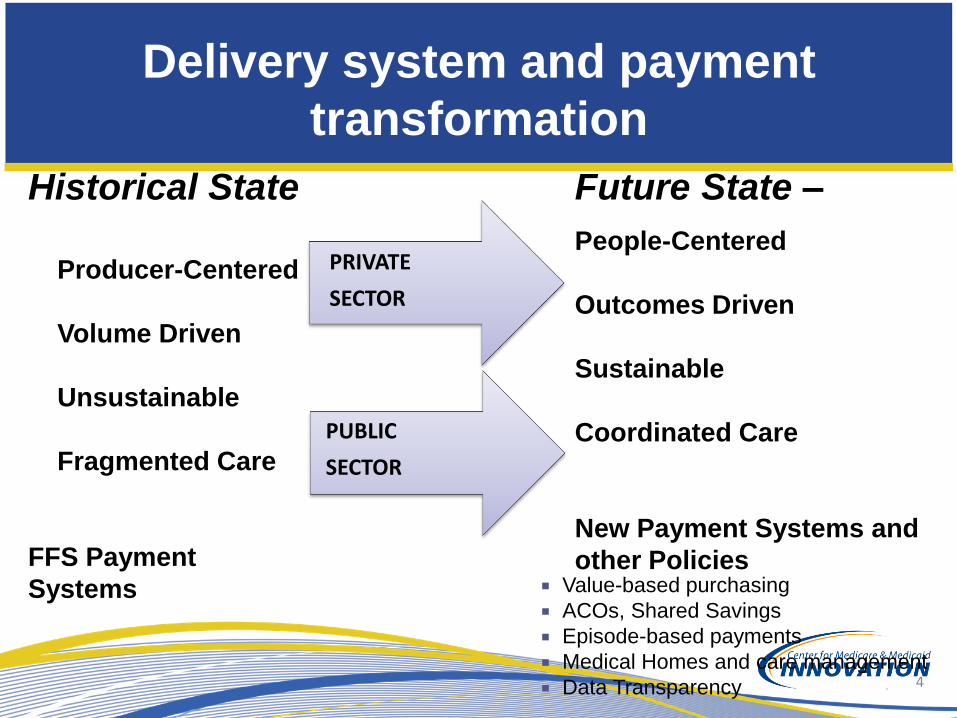
Value-based purchasing
ACOs, Shared Savings
Episode-based payments
Medical Homes and care management
Data Transparency
Future State –
People-Centered
Outcomes Driven
Sustainable
Coordinated Care
New Payment Systems and
other Policies
PUBLIC
SECTOR
PRIVATE
SECTOR
Historical State
Producer-Centered
Volume Driven
Unsustainable
Fragmented Care
FFS Payment
Systems
Delivery system and payment
transformation
4
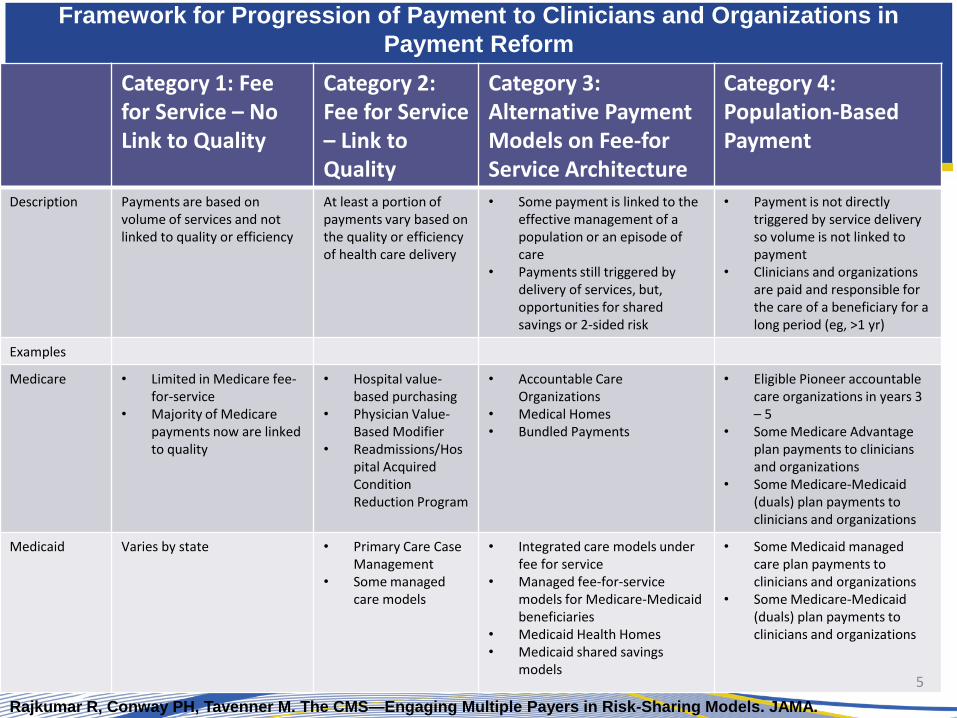
Framework for Progression of Payment to Clinicians and Organizations in
Payment Reform
Category 1: Fee for Service – No Link to Quality
Category 2: Fee for Service – Link to Quality
Category 3: Alternative Payment Models on Fee-for Service Architecture
Category 4: Population-Based Payment
Description Payments are based on volume of services and not linked to quality or efficiency
At least a portion of payments vary based on the quality or efficiency of health care delivery
• Some payment is linked to the effective management of a population or an episode of care
• Payments still triggered by delivery of services, but, opportunities for shared savings or 2-sided risk
• Payment is not directly triggered by service delivery so volume is not linked to payment
• Clinicians and organizations are paid and responsible for the care of a beneficiary for a long period (eg, >1 yr)
Examples
Medicare • Limited in Medicare fee-for-service
• Majority of Medicare payments now are linked to quality
• Hospital value-based purchasing
• Physician Value-Based Modifier
• Readmissions/Hospital Acquired Condition Reduction Program
• Accountable Care Organizations
• Medical Homes • Bundled Payments
• Eligible Pioneer accountable care organizations in years 3 – 5
• Some Medicare Advantage plan payments to clinicians and organizations
• Some Medicare-Medicaid (duals) plan payments to clinicians and organizations
Medicaid Varies by state • Primary Care Case Management
• Some managed care models
• Integrated care models under fee for service
• Managed fee-for-service models for Medicare-Medicaid beneficiaries
• Medicaid Health Homes • Medicaid shared savings
models
• Some Medicaid managed care plan payments to clinicians and organizations
• Some Medicare-Medicaid (duals) plan payments to clinicians and organizations
5
Rajkumar R, Conway PH, Tavenner M. The CMS—Engaging Multiple Payers in Risk-Sharing Models. JAMA.
Doi:10.1001/jama.2014.3703
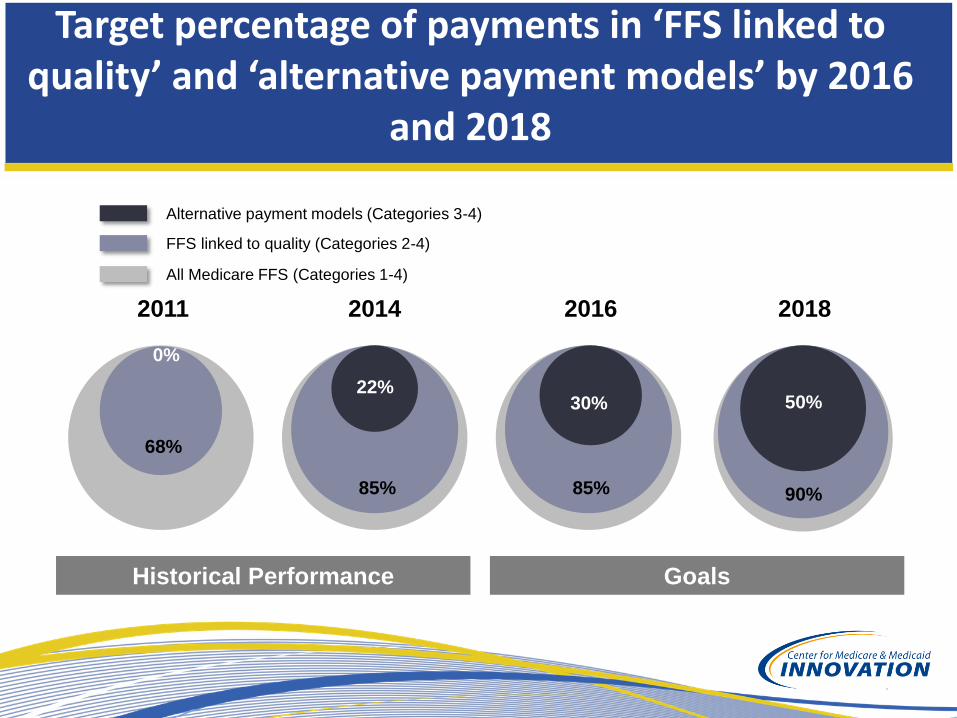
2016
30%
85%
2018
50%
90%
Target percentage of payments in ‘FFS linked to quality’ and ‘alternative payment models’ by 2016
and 2018
2014
22%
85%
2011
0%
68%
Goals Historical Performance
All Medicare FFS (Categories 1-4)
FFS linked to quality (Categories 2-4)
Alternative payment models (Categories 3-4)
Innovation Awards Summary
• Open solicitation to identify and test innovative service delivery and
payment models that:
– Improve health and healthcare
– Improve cost efficiency of CMS programs
– Rapidly train or deploy a new workforce
• Initial 107 awards, ranging from $1 to $30 million (Round 1), and
additional 39 awards ranging from $2 to $24 million (Round 2).
• CMS recognizes that many of the best policy innovations can
come from non-government developers
7
HCIA Goal
• GOAL: To identify and support a broad range of
innovative service delivery and payment models
that achieve better care, better health and lower
costs through improvement in communities across
the nation.
HCIA Implementation
HCIA awardees will:
• Improve care and lower costs for Medicare,
Medicaid and CHIP beneficiaries
• Reach diverse populations, including underserved
and remote communities
• Rapidly implement the proposed model
• Develop, train, and deploy workforce to support
the models
Innovation Awards Review Process:
Round 1
• 2,260 applications were scored by 190 panels. These
applications represent $30 billion in requested awards.
• Panels were composed of governmental and non-
governmental reviewers.
• Reviewers scored applications along five criteria:
– Design of project
– Organizational capacity and management plan
– Workforce goals
– Budget and sustainability plan
– Evaluation and reporting plan
10
Distribution by Funding Size Awarded
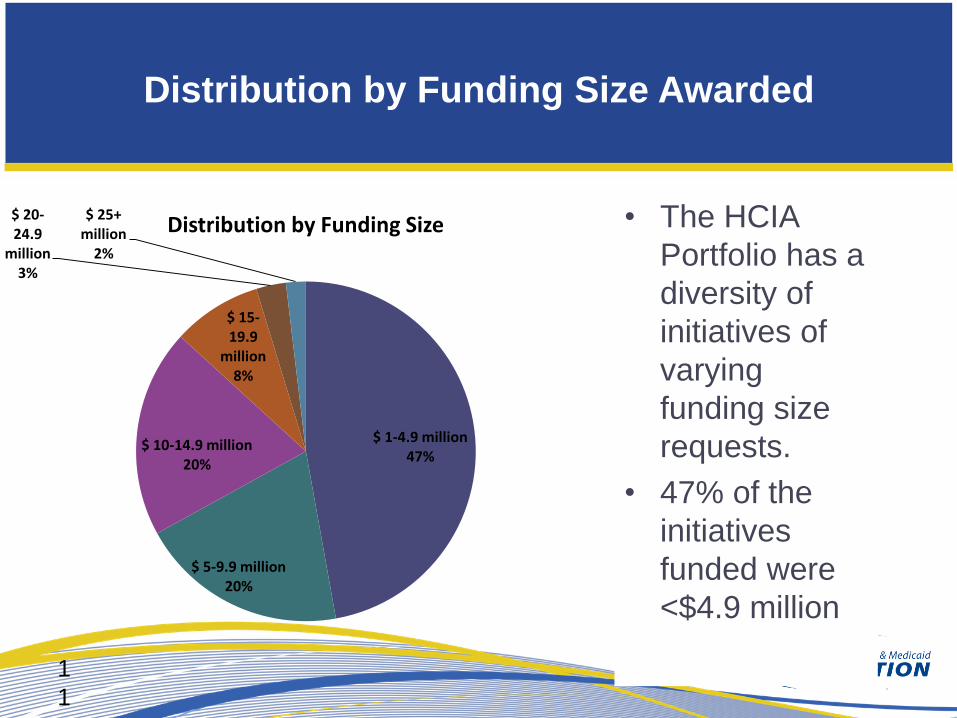
• The HCIA
Portfolio has a
diversity of
initiatives of
varying
funding size
requests.
• 47% of the
initiatives
funded were
<$4.9 million
1
1
$ 1-4.9 million 47%
$ 5-9.9 million 20%
$ 10-14.9 million 20%
$ 15-19.9
million 8%
$ 20-24.9
million 3%
$ 25+ million
2%
Distribution by Funding Size
Distribution by Community Type
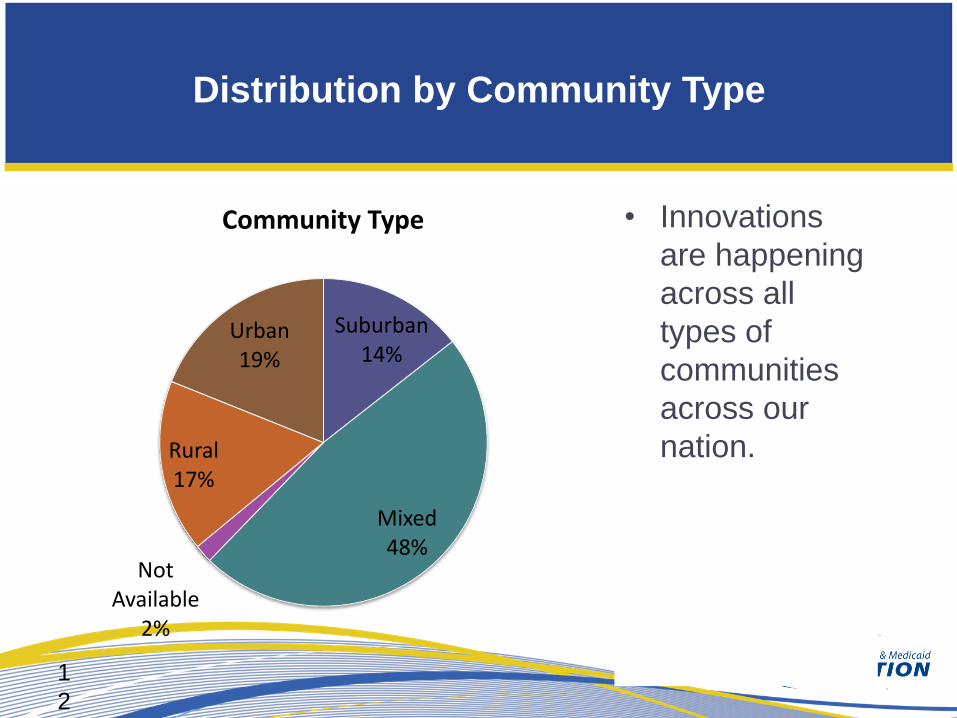
Suburban 14%
Mixed 48%
Not Available
2%
Rural 17%
Urban 19%
Community Type • Innovations
are happening
across all
types of
communities
across our
nation.
1
2
Distribution by Participant Age
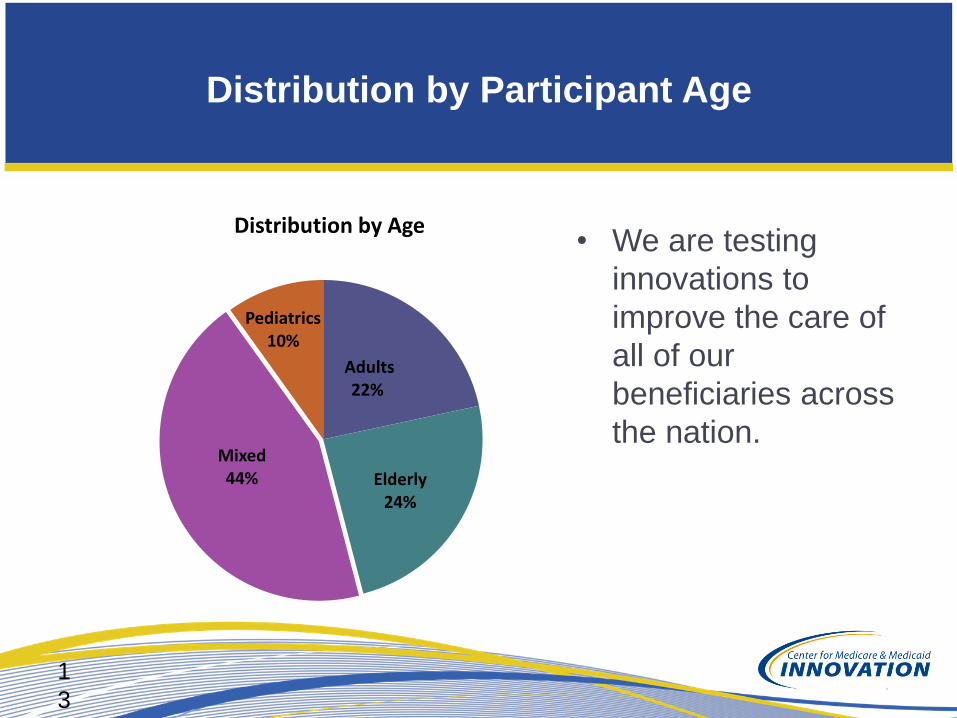
• We are testing
innovations to
improve the care of
all of our
beneficiaries across
the nation.
Adults 22%
Elderly 24%
Mixed 44%
Pediatrics 10%
Distribution by Age
1
3
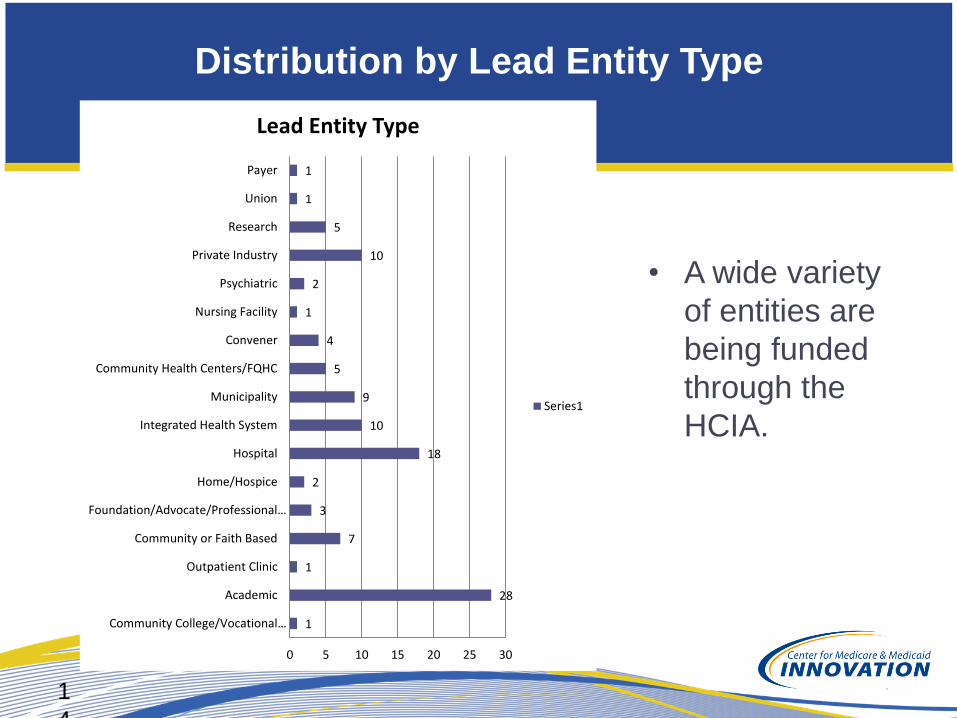
Distribution by Lead Entity Type
• A wide variety
of entities are
being funded
through the
HCIA.
1
4
1
28
1
7
3
2
18
10
9
5
4
1
2
10
5
1
1
0 5 10 15 20 25 30
Community College/Vocational…
Academic
Outpatient Clinic
Community or Faith Based
Foundation/Advocate/Professional…
Home/Hospice
Hospital
Integrated Health System
Municipality
Community Health Centers/FQHC
Convener
Nursing Facility
Psychiatric
Private Industry
Research
Union
Payer
Lead Entity Type
Series1

Distribution by Insurance Type
• All of our
beneficiaries
are
benefiting
from health
care
innovations
across the
country.
*”Mixed” describes initiatives with both public and private payers
Medicaid 27%
Medicare 14%
Mixed 49%
Duals 10%
Distribution by Primary Insurance Type
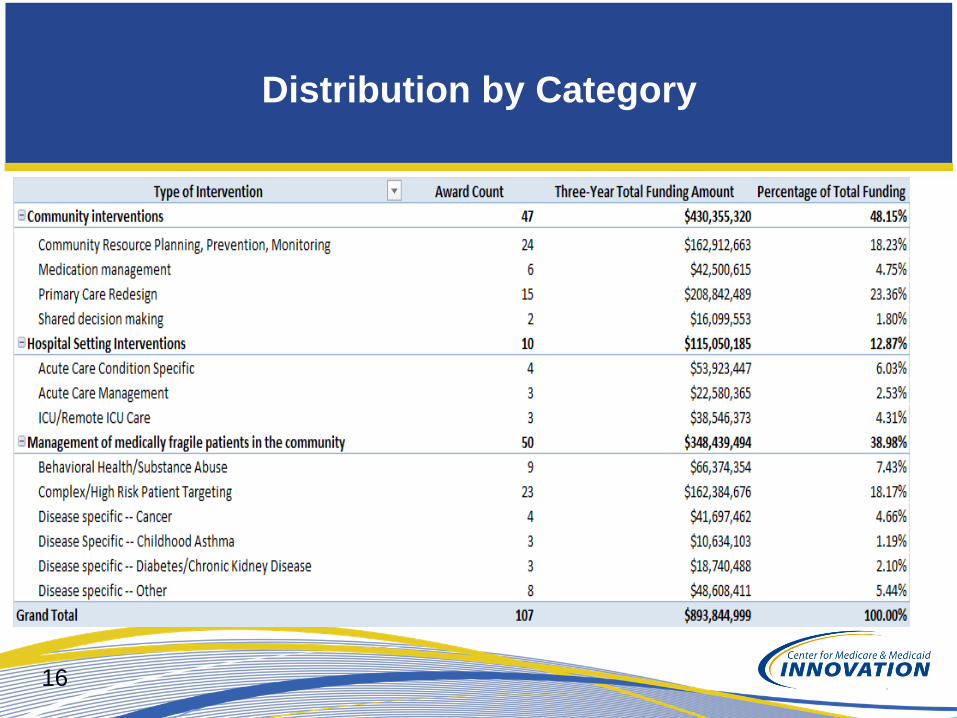
Distribution by Category
16
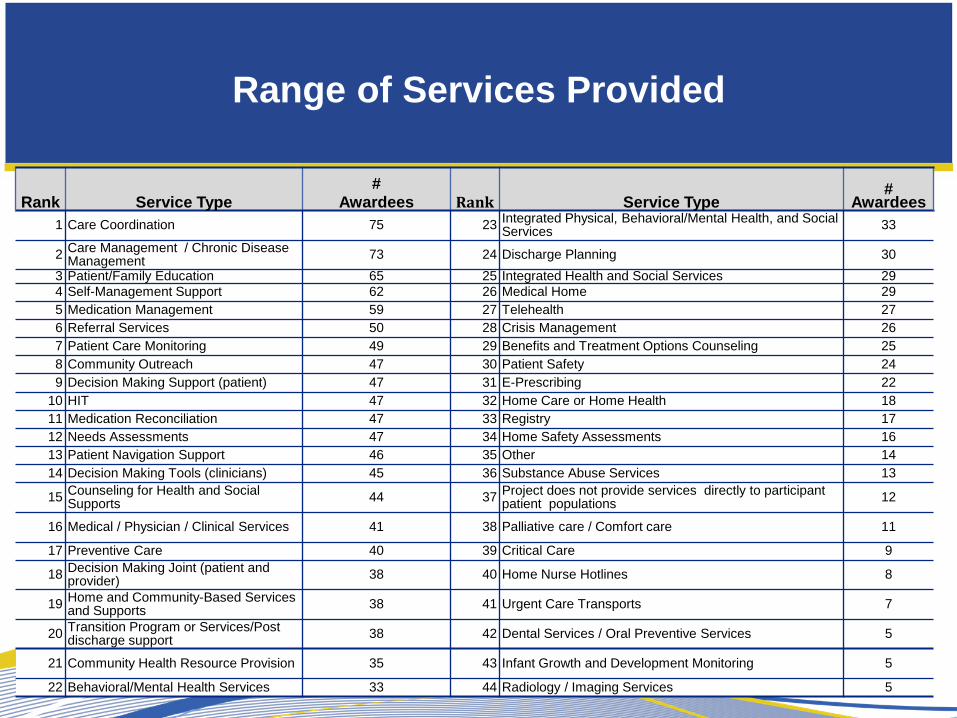
Range of Services Provided
Rank Service Type
# Awardees Rank Service Type
# Awardees
1 Care Coordination 75 23 Integrated Physical, Behavioral/Mental Health, and Social Services
33
2 Care Management / Chronic Disease Management
73 24 Discharge Planning 30
3 Patient/Family Education 65 25 Integrated Health and Social Services 29
4 Self-Management Support 62 26 Medical Home 29
5 Medication Management 59 27 Telehealth 27
6 Referral Services 50 28 Crisis Management 26
7 Patient Care Monitoring 49 29 Benefits and Treatment Options Counseling 25
8 Community Outreach 47 30 Patient Safety 24
9 Decision Making Support (patient) 47 31 E-Prescribing 22
10 HIT 47 32 Home Care or Home Health 18
11 Medication Reconciliation 47 33 Registry 17
12 Needs Assessments 47 34 Home Safety Assessments 16
13 Patient Navigation Support 46 35 Other 14
14 Decision Making Tools (clinicians) 45 36 Substance Abuse Services 13
15 Counseling for Health and Social Supports
44 37 Project does not provide services directly to participant patient populations
12
16 Medical / Physician / Clinical Services 41 38 Palliative care / Comfort care 11
17 Preventive Care 40 39 Critical Care 9
18 Decision Making Joint (patient and provider)
38 40 Home Nurse Hotlines 8
19 Home and Community-Based Services and Supports
38 41 Urgent Care Transports 7
20 Transition Program or Services/Post discharge support
38 42 Dental Services / Oral Preventive Services 5
21 Community Health Resource Provision 35 43 Infant Growth and Development Monitoring 5
22 Behavioral/Mental Health Services 33 44 Radiology / Imaging Services 5
HCIA Implementation
• Project start July 2012
• Most projects scheduled for implementation
first quarter, CY 2013.
• Ongoing self monitoring and rapid cycle
improvement at each site
• Programs will develop measures of success
and use those measures to identify operating
issues and make improvements
• Program close June 2015
Independent Evaluations
• All CMS Innovation Center projects receive
independent evaluations
• RAND Corporation is developing an overall
evaluation design
• Evaluations of each of the 107 awards are
expected using independent contractors
• Those projects that are most promising can be
expanded for further analysis of the model
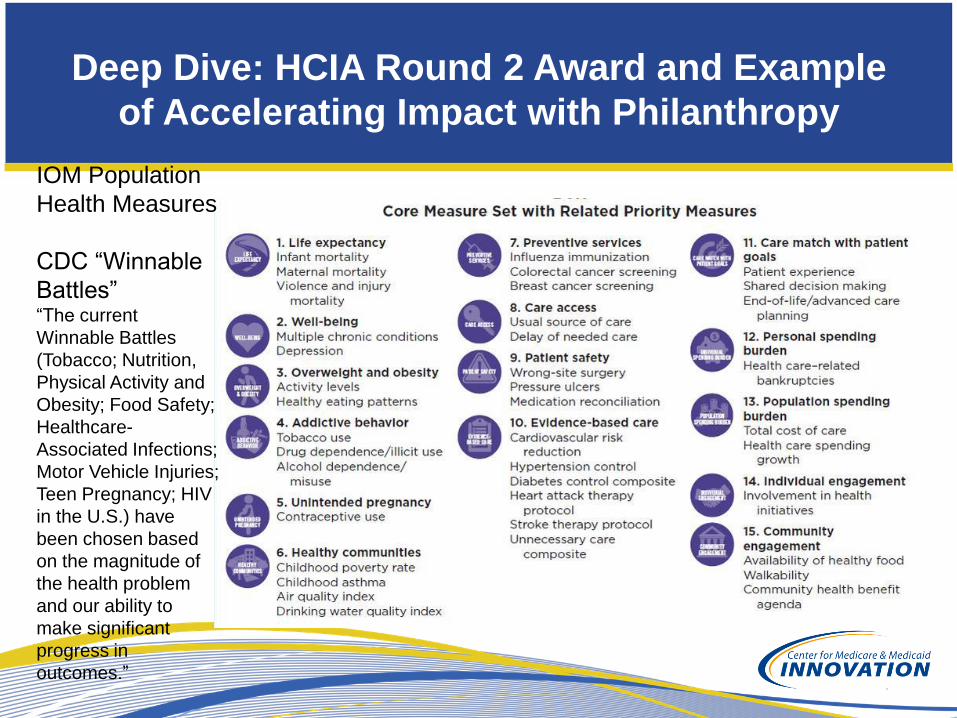
Deep Dive: HCIA Round 2 Award and Example
of Accelerating Impact with Philanthropy
IOM Population
Health Measures
CDC “Winnable
Battles” “The current
Winnable Battles
(Tobacco; Nutrition,
Physical Activity and
Obesity; Food Safety;
Healthcare-
Associated Infections;
Motor Vehicle Injuries;
Teen Pregnancy; HIV
in the U.S.) have
been chosen based
on the magnitude of
the health problem
and our ability to
make significant
progress in
outcomes.”
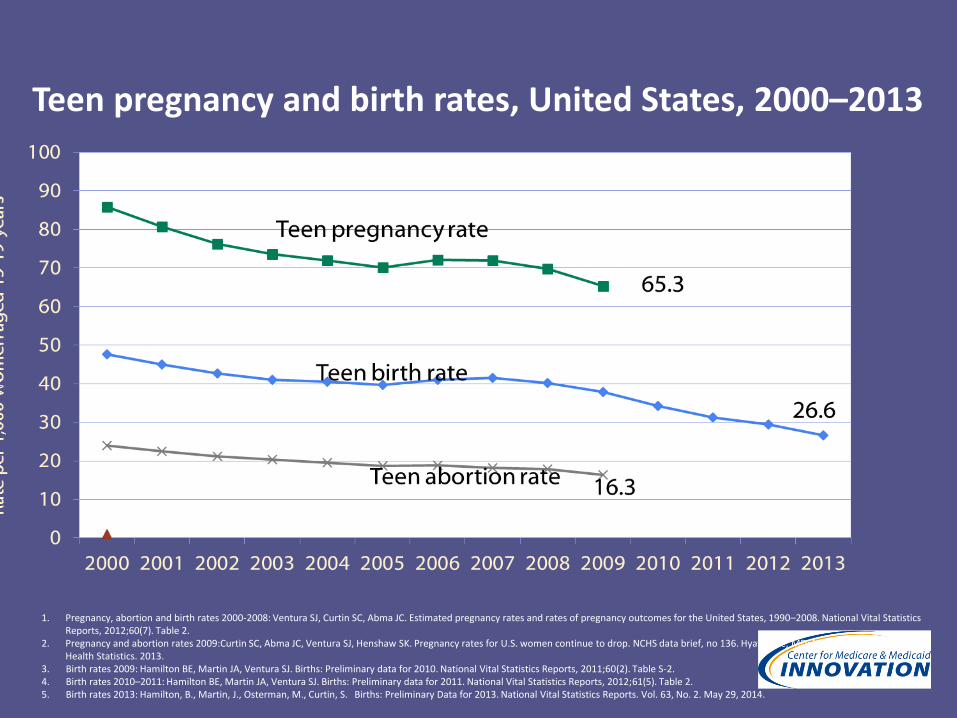
1. Pregnancy, abortion and birth rates 2000-2008: Ventura SJ, Curtin SC, Abma JC. Estimated pregnancy rates and rates of pregnancy outcomes for the United States, 1990–2008. National Vital Statistics Reports, 2012;60(7). Table 2.
2. Pregnancy and abortion rates 2009:Curtin SC, Abma JC, Ventura SJ, Henshaw SK. Pregnancy rates for U.S. women continue to drop. NCHS data brief, no 136. Hyattsville, MD: National Center for Health Statistics. 2013.
3. Birth rates 2009: Hamilton BE, Martin JA, Ventura SJ. Births: Preliminary data for 2010. National Vital Statistics Reports, 2011;60(2). Table S-2. 4. Birth rates 2010–2011: Hamilton BE, Martin JA, Ventura SJ. Births: Preliminary data for 2011. National Vital Statistics Reports, 2012;61(5). Table 2. 5. Birth rates 2013: Hamilton, B., Martin, J., Osterman, M., Curtin, S. Births: Preliminary Data for 2013. National Vital Statistics Reports. Vol. 63, No. 2. May 29, 2014.
Teen pregnancy and birth rates, United States, 2000–2013
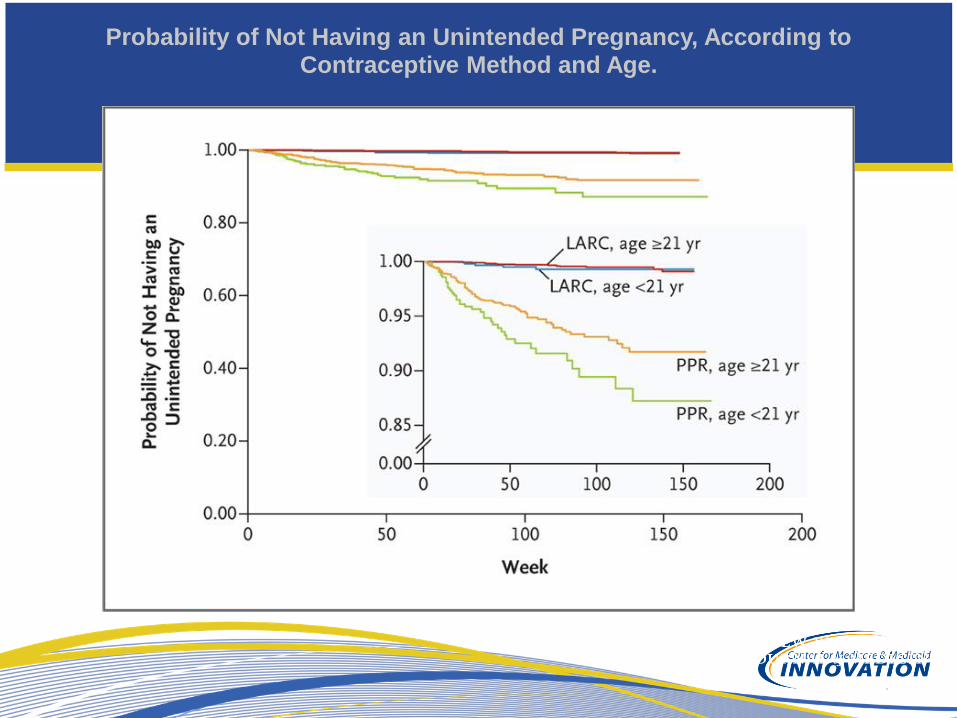
Probability of Not Having an Unintended Pregnancy, According to Contraceptive Method and Age.

And further impact on termination/abortion
rates
What are the Policy Issues for us?
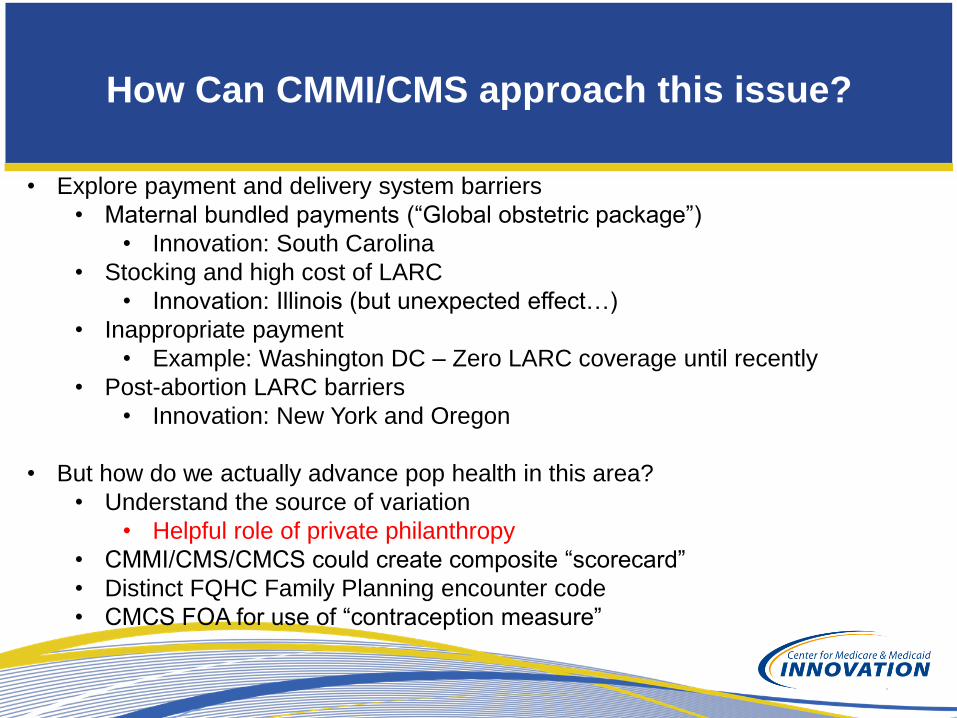
How Can CMMI/CMS approach this issue?
• Explore payment and delivery system barriers
• Maternal bundled payments (“Global obstetric package”)
• Innovation: South Carolina
• Stocking and high cost of LARC
• Innovation: Illinois (but unexpected effect…)
• Inappropriate payment
• Example: Washington DC – Zero LARC coverage until recently
• Post-abortion LARC barriers
• Innovation: New York and Oregon
• But how do we actually advance pop health in this area?
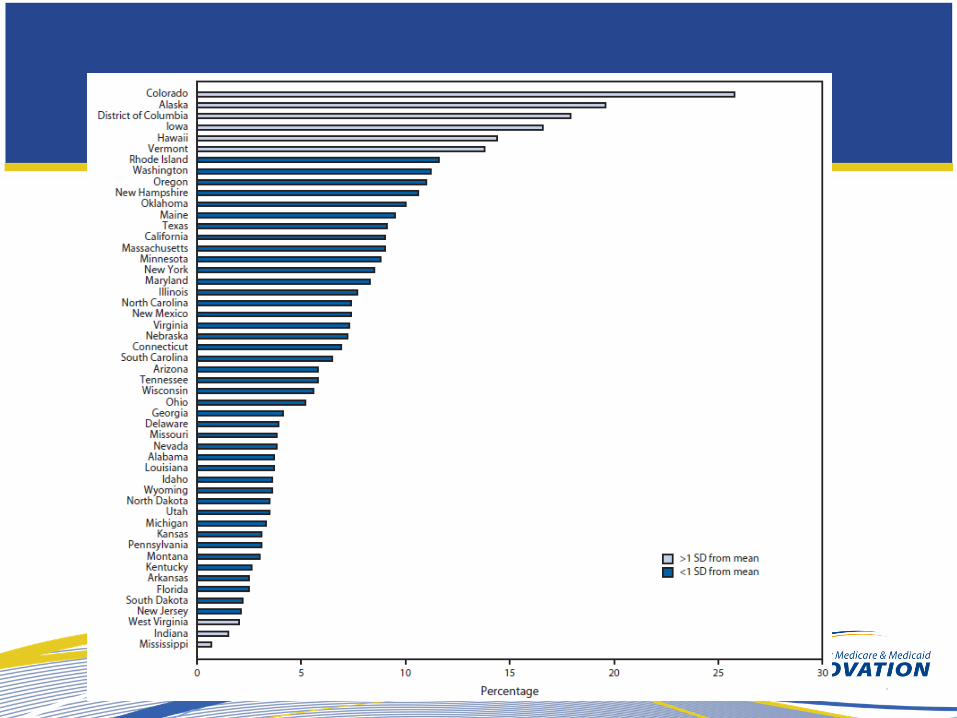
• Understand the source of variation
• Helpful role of private philanthropy
• CMMI/CMS/CMCS could create composite “scorecard”
• Distinct FQHC Family Planning encounter code
• CMCS FOA for use of “contraception measure”
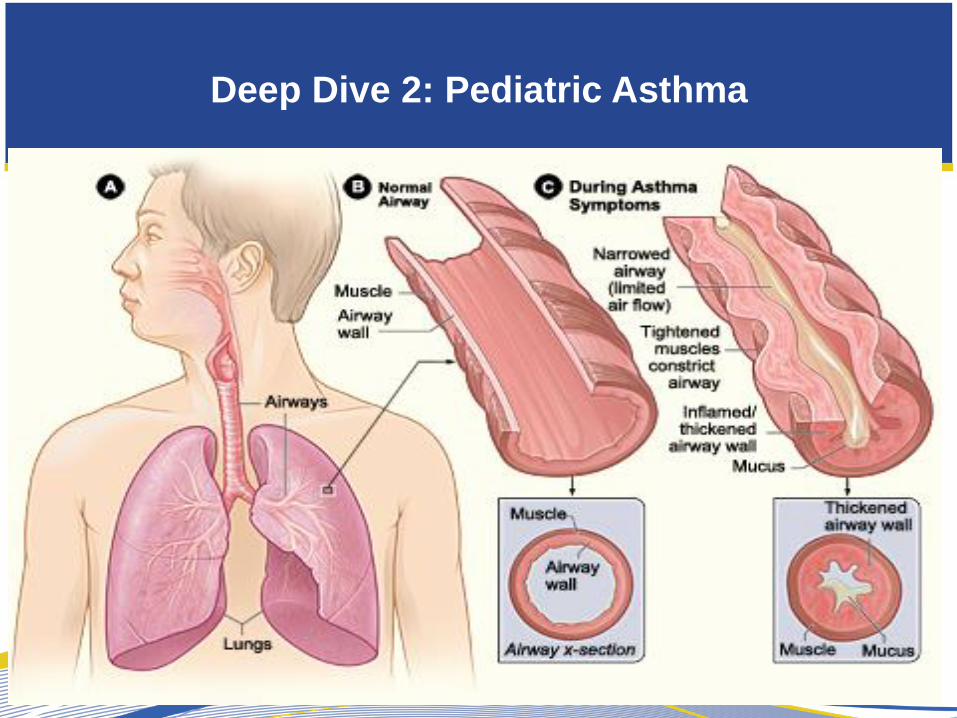
Deep Dive 2: Pediatric Asthma
26
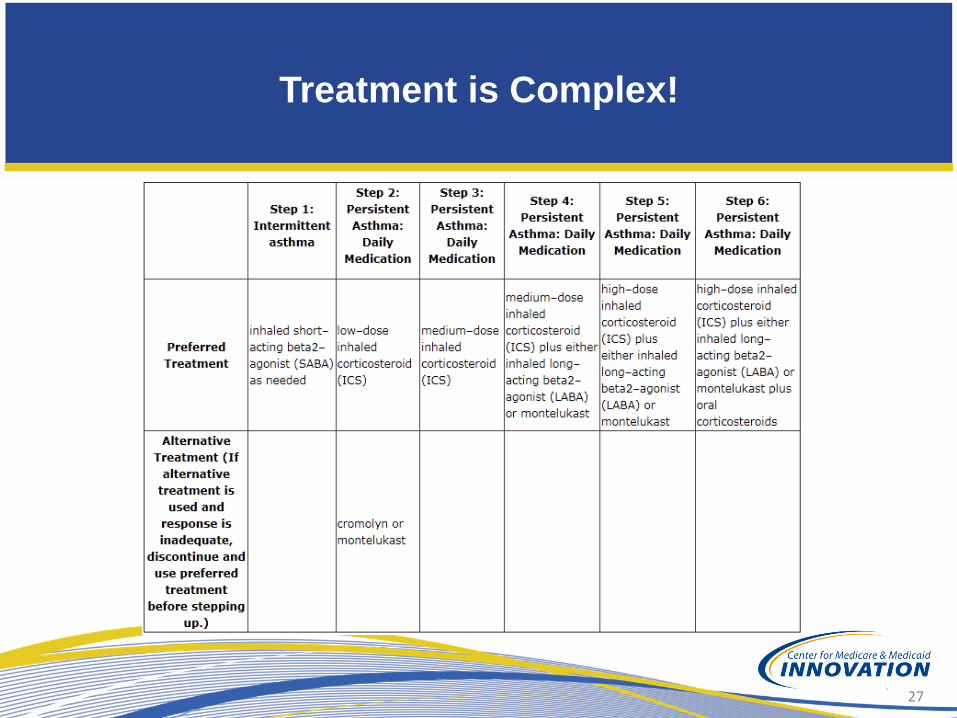
Treatment is Complex!
27
Simple Things…
28

How do we improve outcomes?
Knowledge Systems
Outcomes
Adapted from Batalden, Qual Saf Health Care, 2007
Payment
The Potential
30
0%
2%
4%
6%
8%
10%
12%
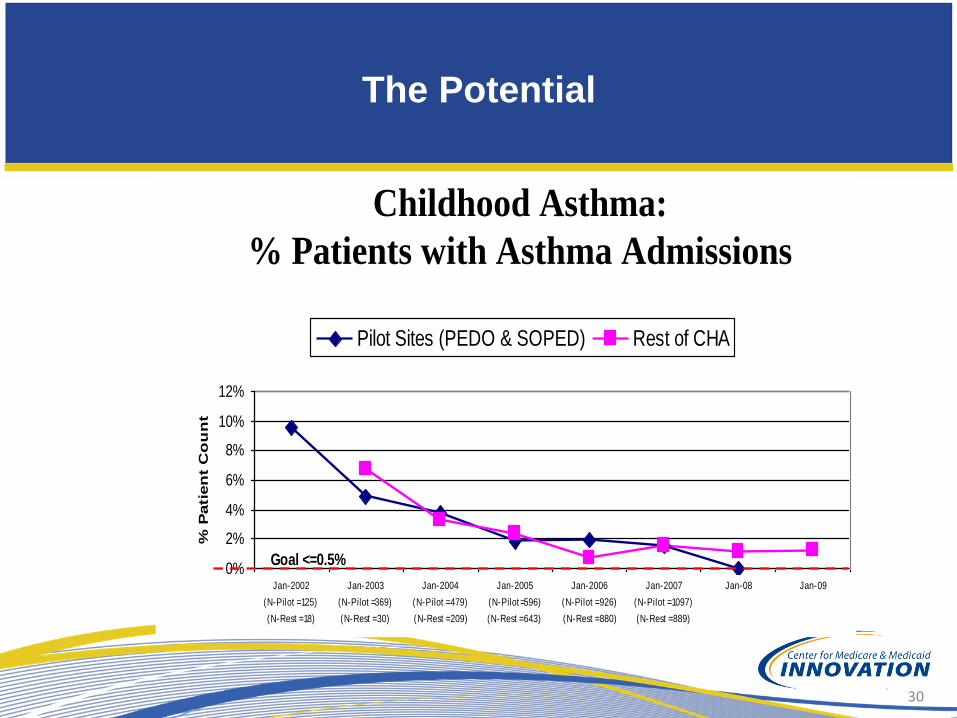
Jan-2002
(N-Pilot = 125)
(N-Rest = 18)
Jan-2003
(N-Pilot =369)
(N-Rest = 30)
Jan-2004
(N-Pilot = 479)
(N-Rest = 209)
Jan-2005
(N-Pilot =596)
(N-Rest = 643)
Jan-2006
(N-Pilot = 926)
(N-Rest = 880)
Jan-2007
(N-Pilot = 1097)
(N-Rest = 889)
Jan-08 Jan-09
% P
ati
en
t C
ou
nt
Pilot Sites (PEDO & SOPED) Rest of CHA
Goal <=0.5%
Childhood Asthma:
% Patients with Asthma Admissions

Role for Private Philanthropy (1)
• Currently, CMMI/CMS has funded three
programs with focus on pediatric asthma care,
yet none have transitioned to clear, sustainable
models of reimbursement
• What is the role of philanthropy?
• Innovative funding structuring (GHHI)
• Direct funding of services (Community benefit
funding from health care organizations)
• Research and evaluation
• Sophisticated technical support
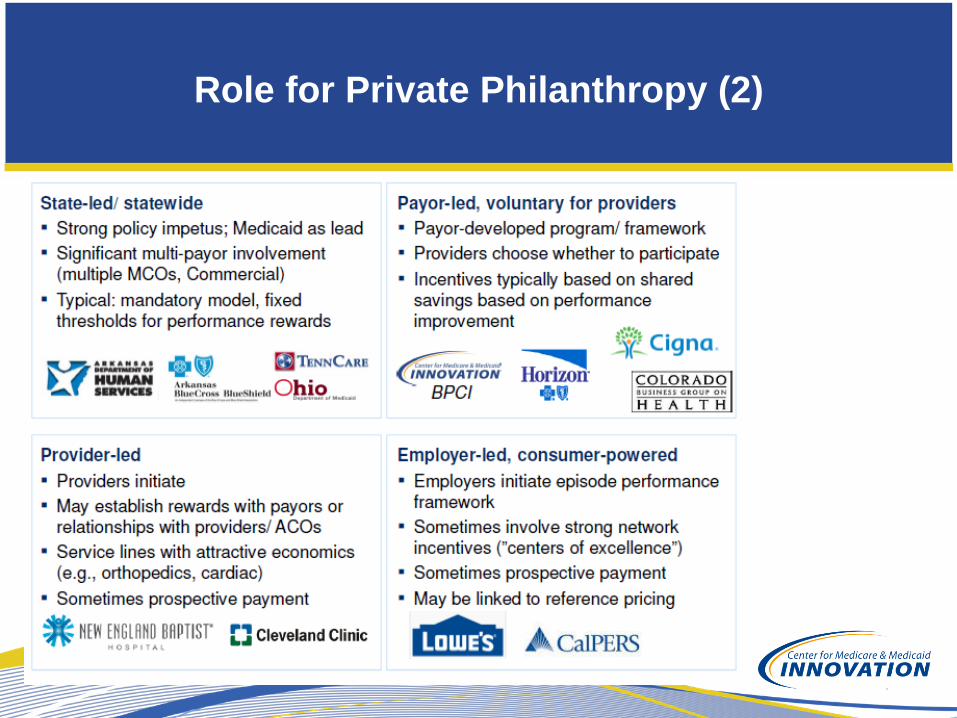
Role for Private Philanthropy (2)
Thank You


![[CMMI Portugal] Cmmi implementation using open source tools](https://img.pdfslide.net/doc/110x75/554dd53fb4c905d10e8b4bb3/cmmi-portugal-cmmi-implementation-using-open-source-tools.jpg)