Embed Size (px)
Citation preview
Genome Architecture
CMSC 702Spring 2014
Genome is organized
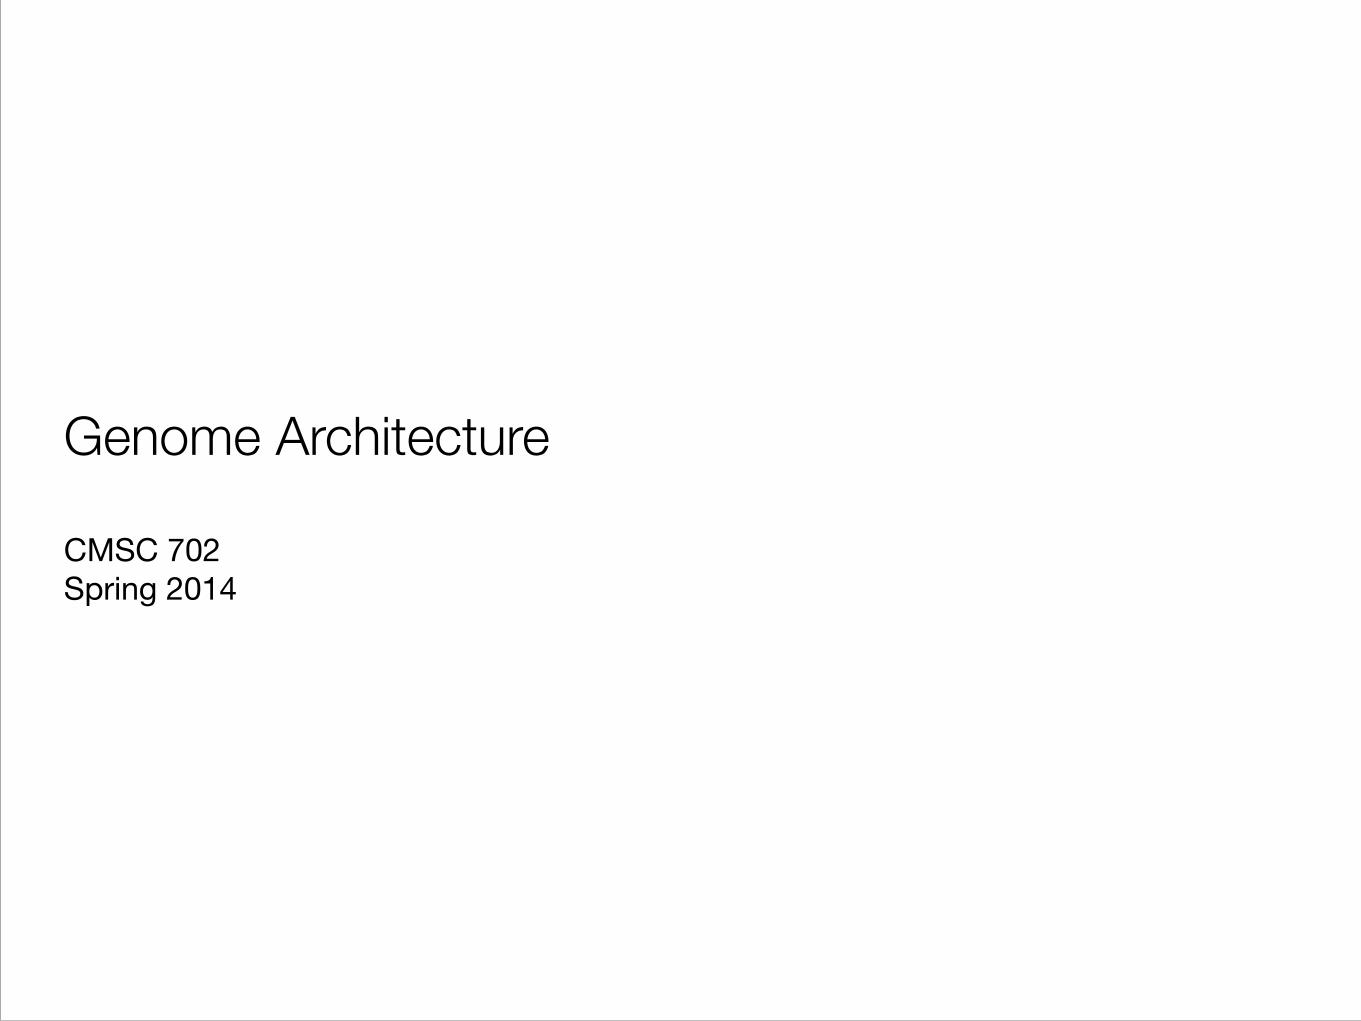
• Remember the basic unit of study is the gene
• These correspond to specific regions in chromosomes (genome)
• These regions are further organized
• exons/introns
• transcripts
• promoter regions
�2
And more…
• Repetitive regions
• (Alu, LINE, SINE elements)
• Telomeres, centromeres, …
• CpG Islands (more later)
�3
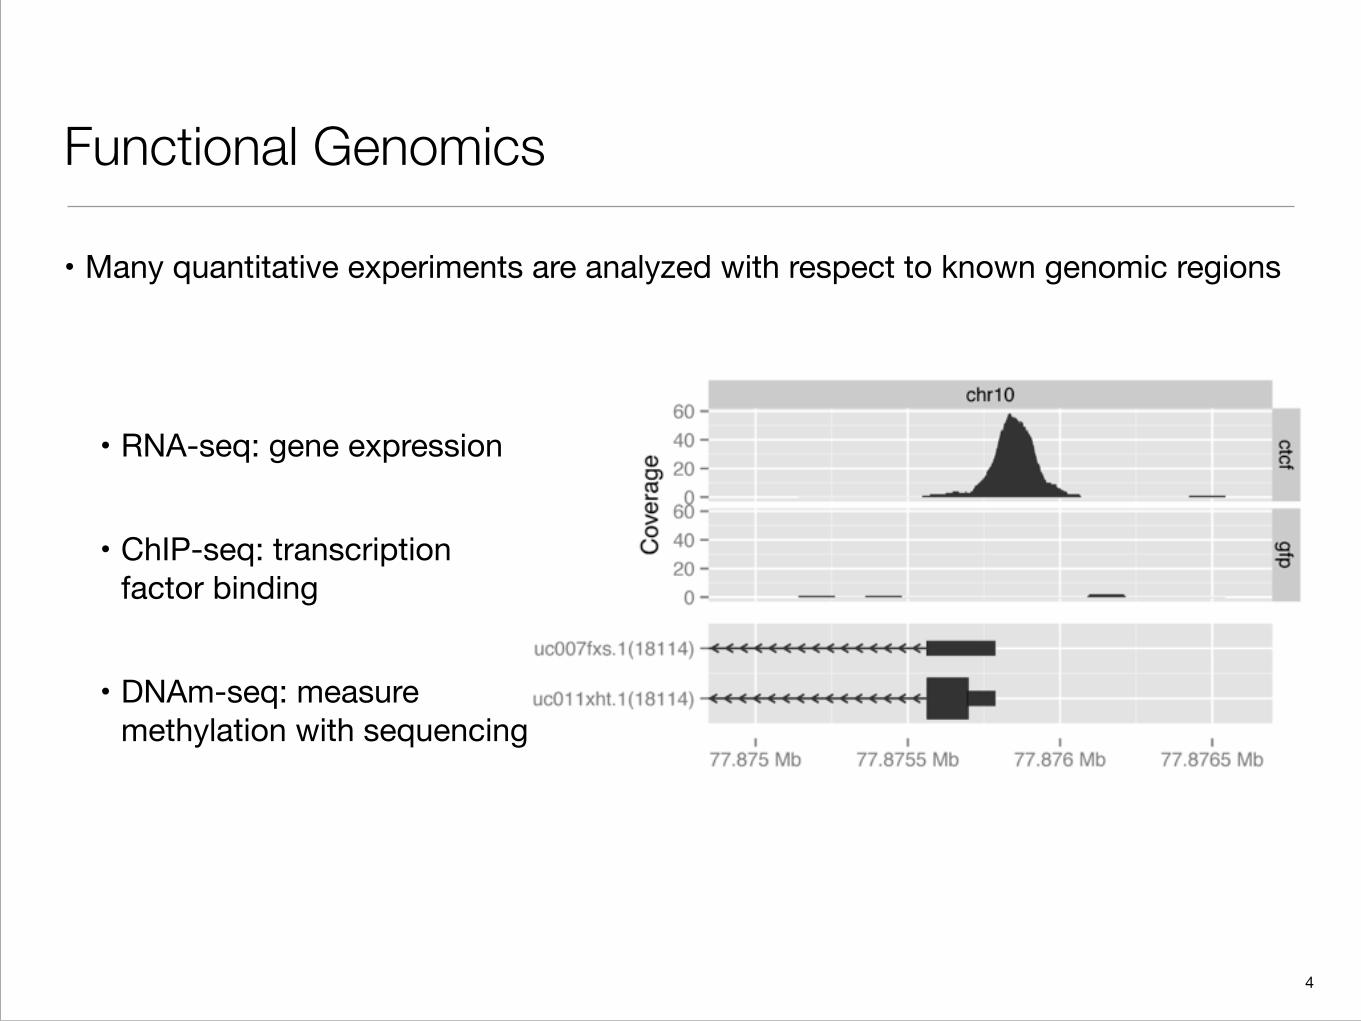
Functional Genomics
• Many quantitative experiments are analyzed with respect to known genomic regions
�4
• RNA-seq: gene expression
• ChIP-seq: transcription factor binding
• DNAm-seq: measure methylation with sequencing
Regions as intervals
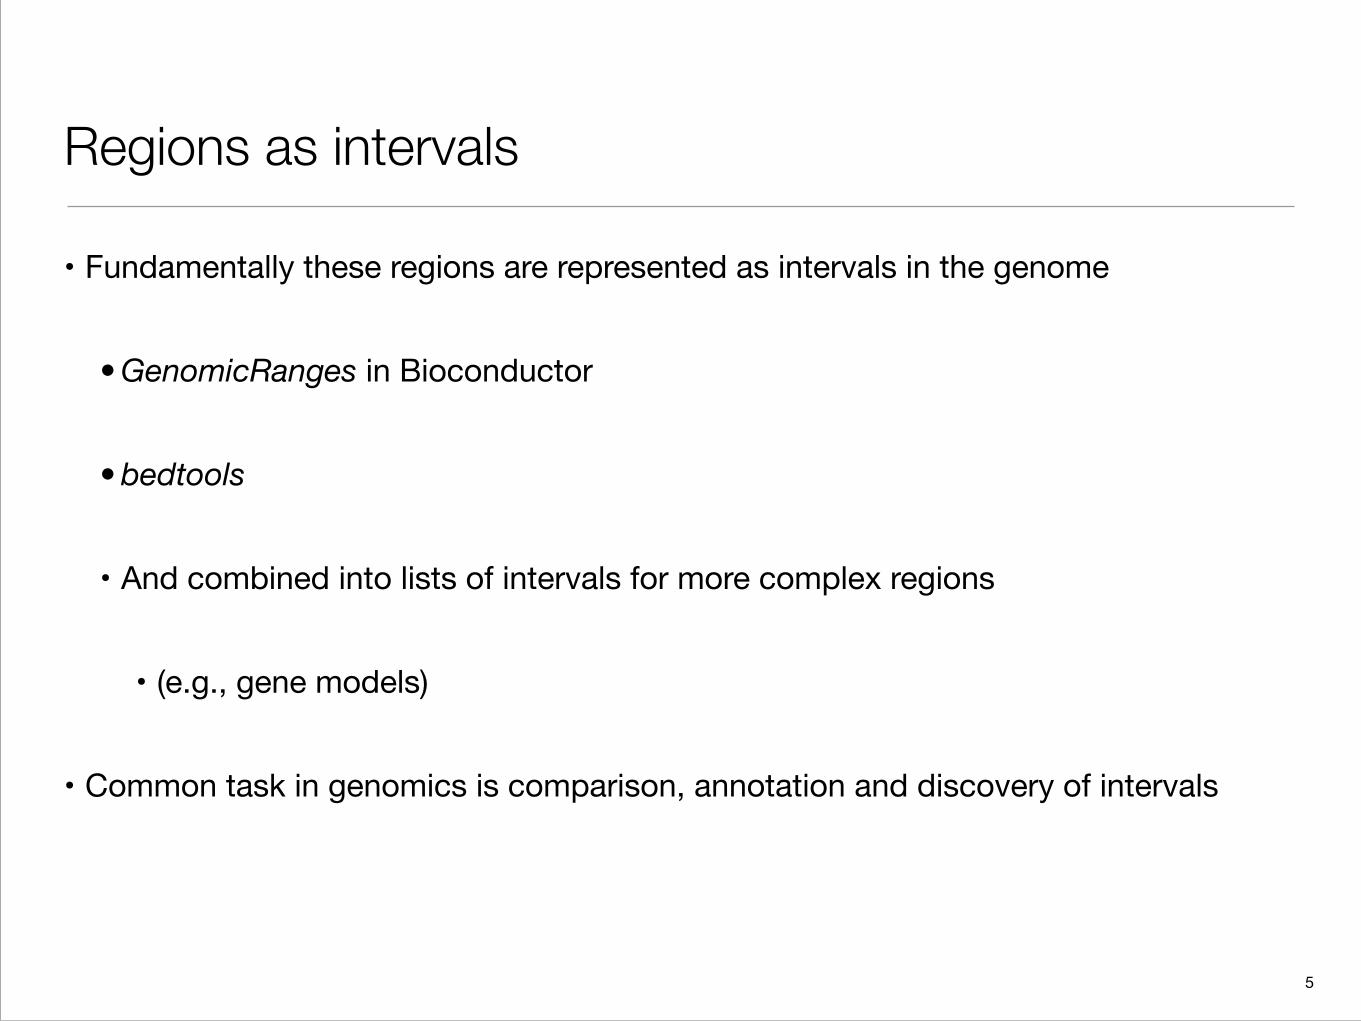
• Fundamentally these regions are represented as intervals in the genome
• GenomicRanges in Bioconductor
• bedtools
• And combined into lists of intervals for more complex regions
• (e.g., gene models)
• Common task in genomics is comparison, annotation and discovery of intervals
�5
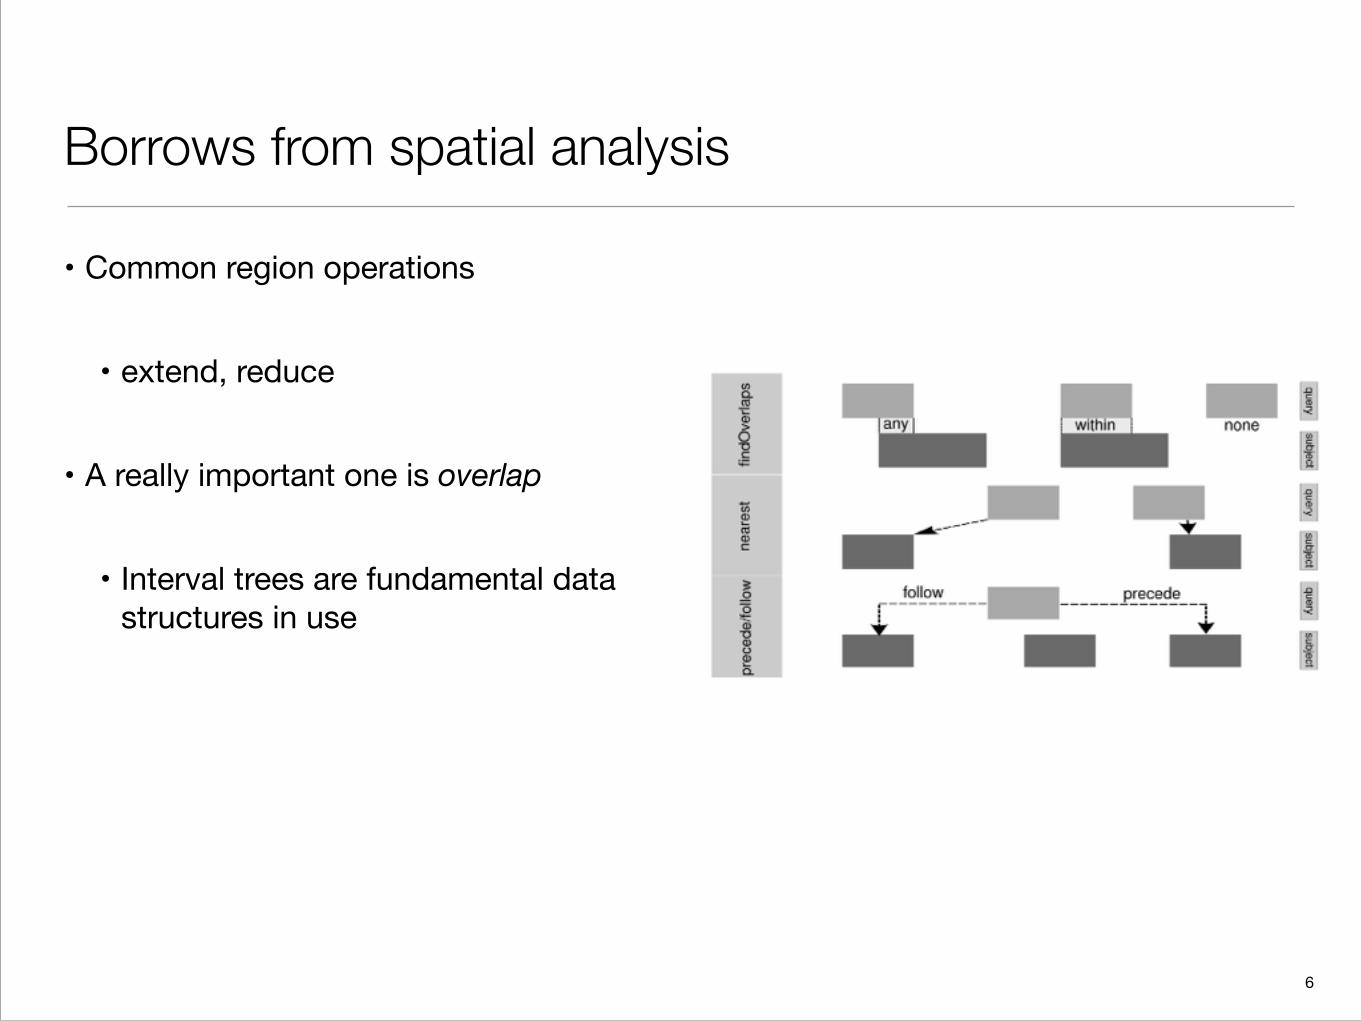
Borrows from spatial analysis
• Common region operations
• extend, reduce
• A really important one is overlap
• Interval trees are fundamental data structures in use
�6
R/Bioconductor
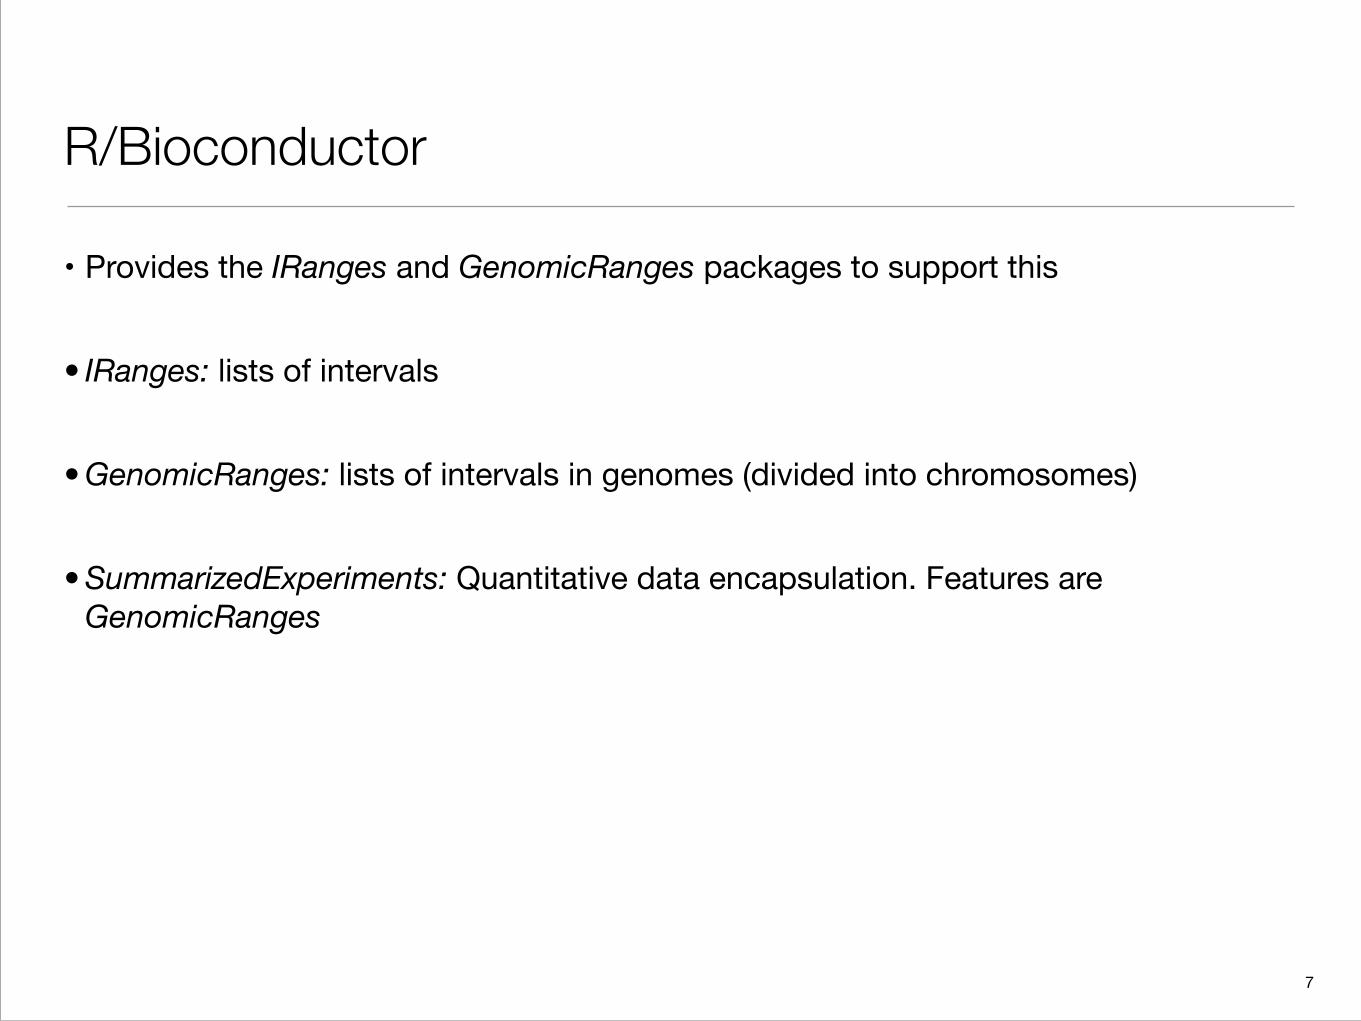
• Provides the IRanges and GenomicRanges packages to support this
• IRanges: lists of intervals
• GenomicRanges: lists of intervals in genomes (divided into chromosomes)
• SummarizedExperiments: Quantitative data encapsulation. Features are GenomicRanges
�7
The future
• Lots of new data and findings made
• Expression, Methylation, Conformation.
• In many tissues, many conditions.
• All of these are organized around regions
• The future: searching the genome for regions of interest:
• systems, stats/ML, algorithmics
�8
One Example: CpG Islands
How are regions defined?
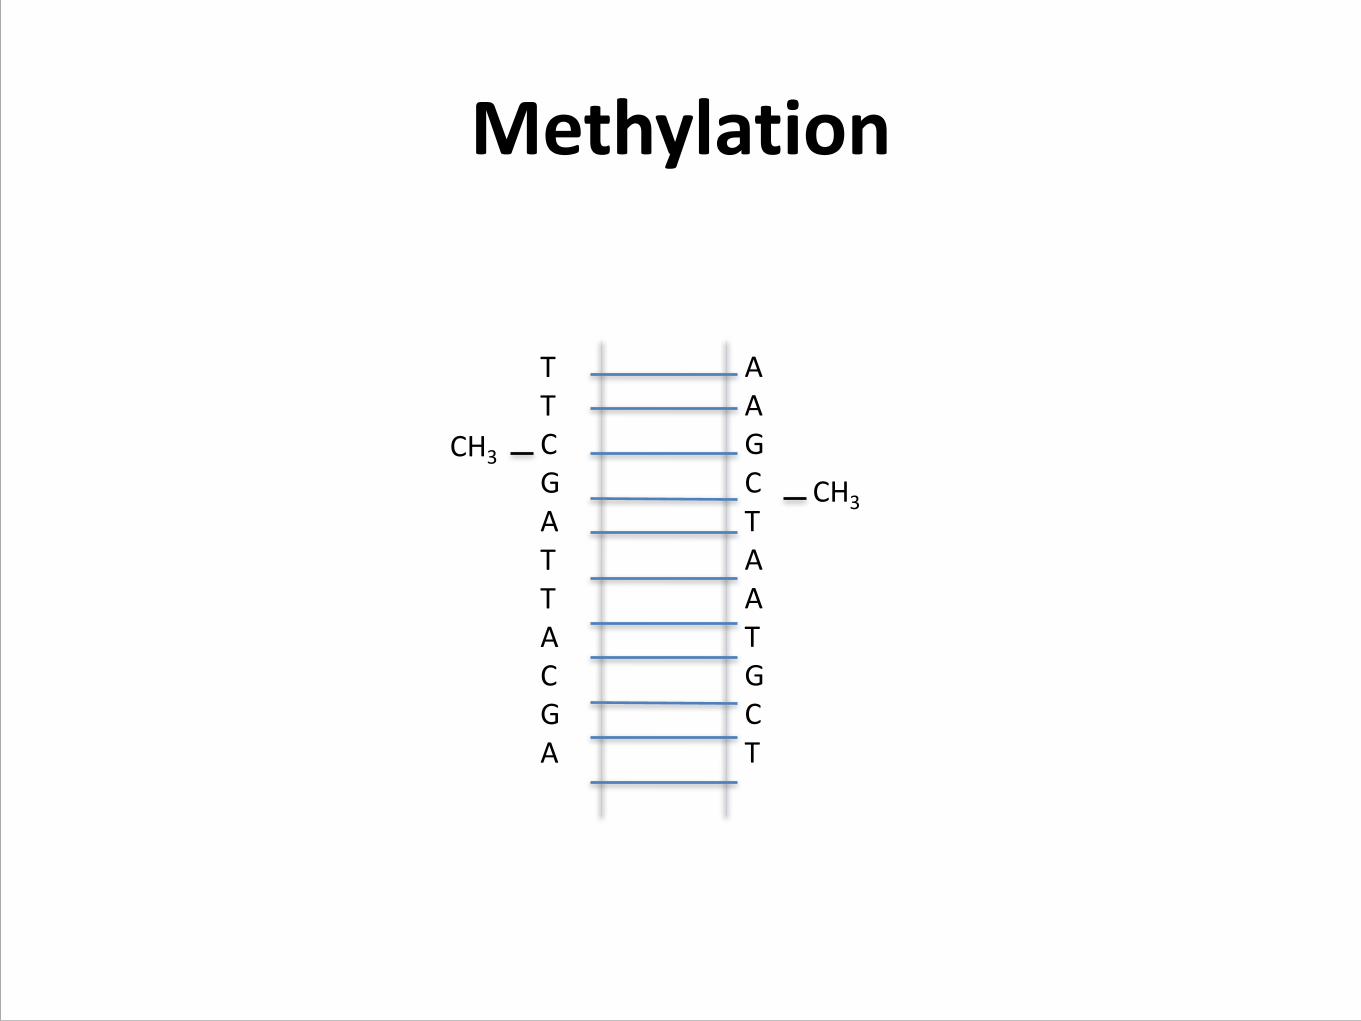
Methylation
T T C G A T T A C G A !
A A G C T A A T G C T !
CH3
CH3
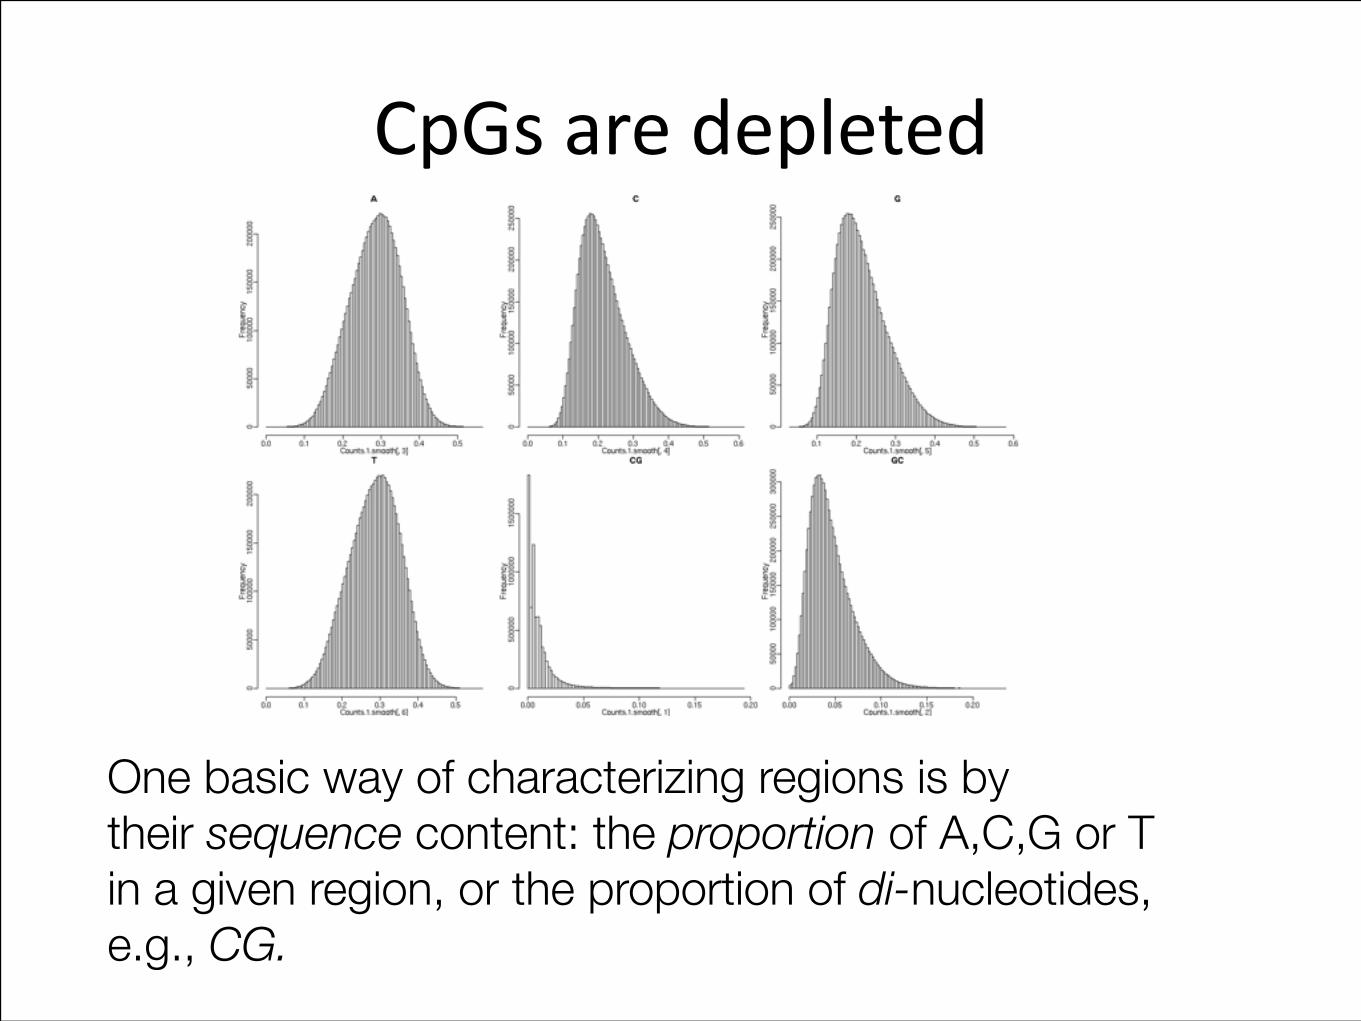
CpGs are depleted
One basic way of characterizing regions is by their sequence content: the proportion of A,C,G or T in a given region, or the proportion of di-nucleotides, e.g., CG.
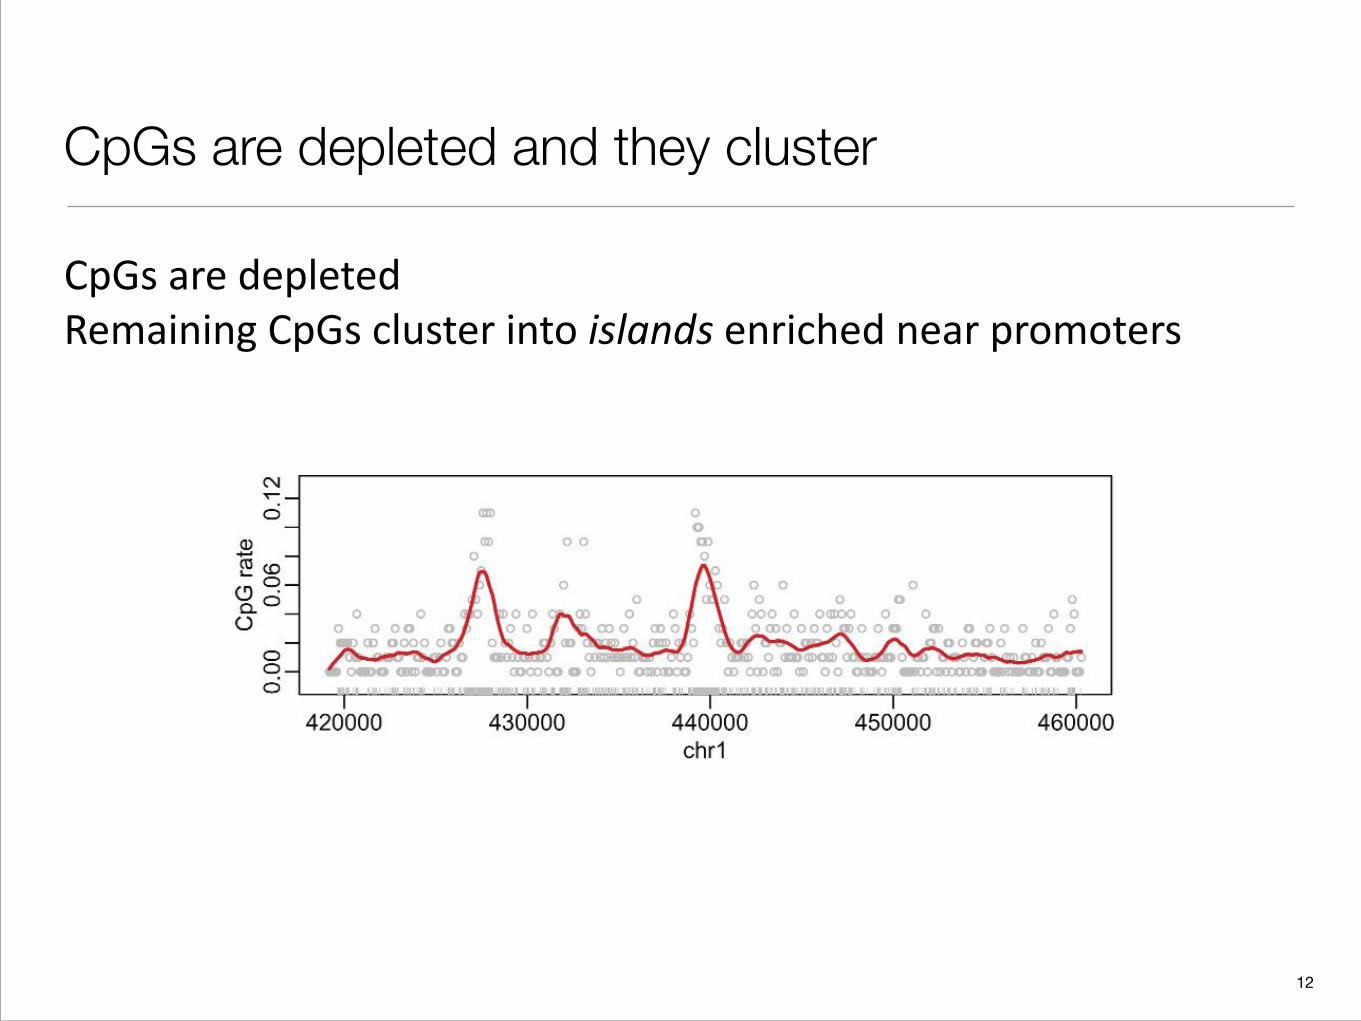
CpGs are depleted and they cluster
CpGs are depleted Remaining CpGs cluster into islands enriched near promoters
�12
500 H. WU AND OTHERS
methylation is of particular interest because it is involved in gene regulation. It affects the transcriptionof genes in 2 ways. First, the methylation of DNA can impede the binding of transcriptional proteinsto the gene, thus blocking transcription. Second, methylated DNA may be bound by proteins that starta series of chemical events that result in the formation of compact DNA that renders it inactive. Notethat although 2 cell types in an organism have the same genome, their methylation pattern can be differ-ent (Figure 1(b)). The fact that DNA methylation is heritable makes it the most prominent mechanismused by differentiated cells to pass tissue-specific transcription patterns to daughter cells in cell division.Therefore, DNA methylation is regarded as the “fifth base” of the genome and is of great interest tobiologists.
The DNA of most vertebrates is depleted in CpG dinucleotides. The remaining CpGs tend to clusterin regions referred to as CpG islands (CGI) (Figure 2). Interest in CGI grew when it was demonstratedthat, in vertebrates, they are enriched in regions of the genome involved in gene transcription referred toas “promoters” (Bird, 1986). Furthermore, many investigators have observed altered DNA methylationof CGI in development and cancer (Feinberg, 2007). Irizarry and others (2008) recently demonstratedthat “CGI shores,” defined as regions within 2000 (bp) but not inside CGI, are useful predictors for ge-nomic locations that are differentially methylated across different tissues and between cancer and normalsamples.
Fig. 1. Cartoon illustrating how DNA methylation is inherited in cell division on how it could be involved in tissuedifferentiation. (a) The fact that the complement of a CpG is also a CpG facilitates the inheritance mechanism. Thecartoon illustrates how, during mitotic cell division, DNA methylation is inherited. (b) This cartoon illustrates how 2cells can have the same genomic sequence but a different methylation pattern.
Fig. 2. A genomic region of 40 000 bases from chromosome 1 is shown. The ticks on the x-axis represent CpGlocations. The points represent CpG rates in segments of length 256 bases The curve is the result of a kernel smootherof the points. Approximately 20% of the genome are Cs and 20% are Gs. Thus, we expect about 4% of dinucleotidesto be CpG. However, most points are well below rates 4% with 2 clusters well above 4%. The latter are CGI.
at Johns Hopkins U
niversity on September 8, 2010
biostatistics.oxfordjournals.orgD
ownloaded from
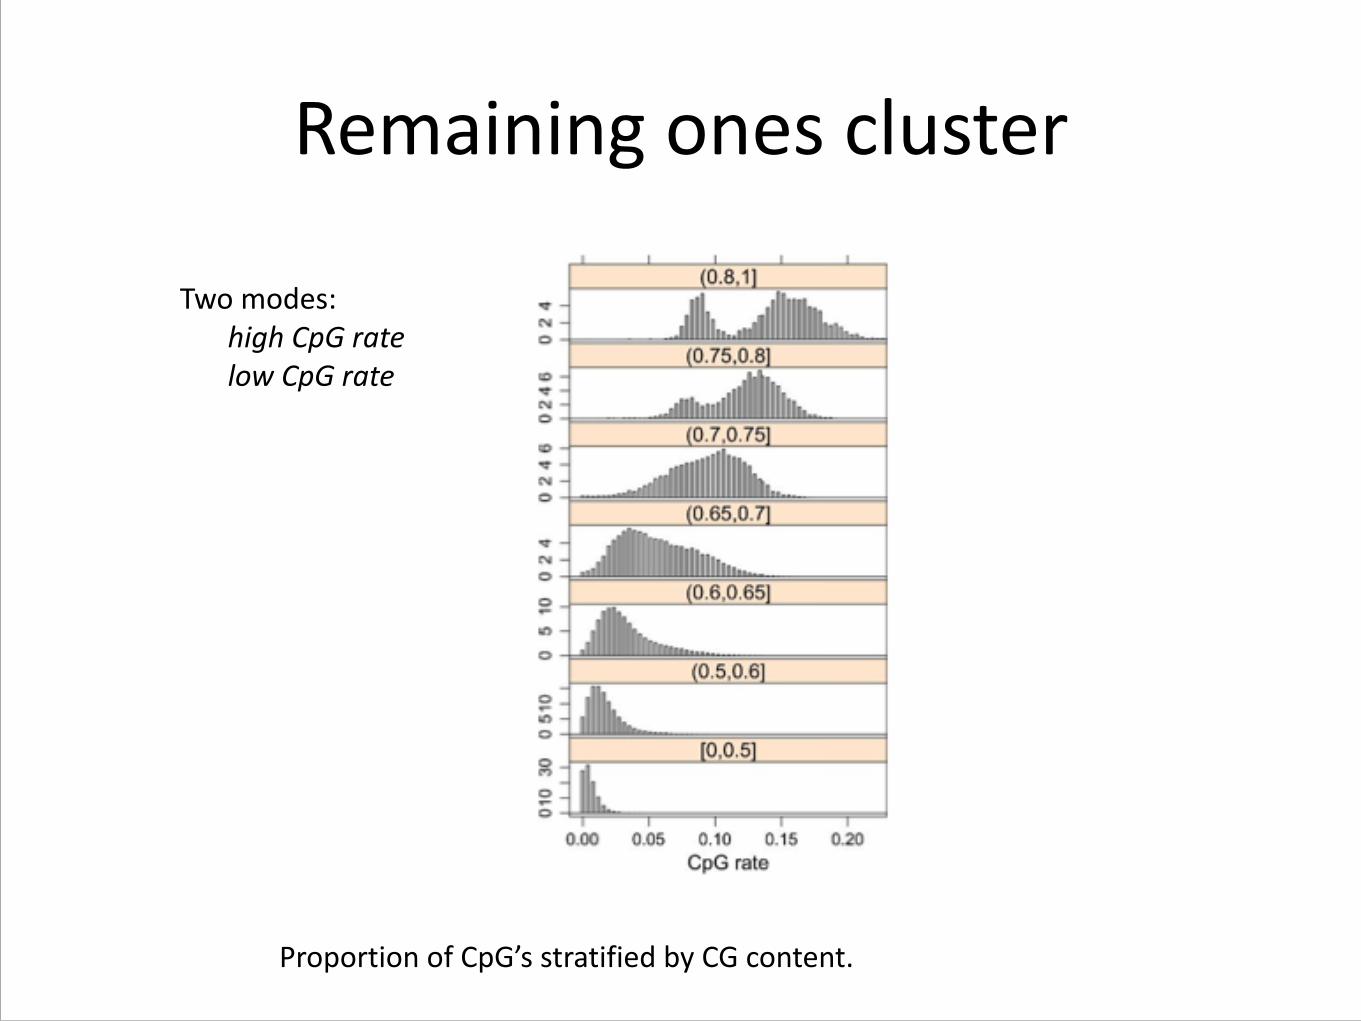
Remaining ones cluster
Proportion of CpG’s stratified by CG content.
Two modes: high CpG rate low CpG rate
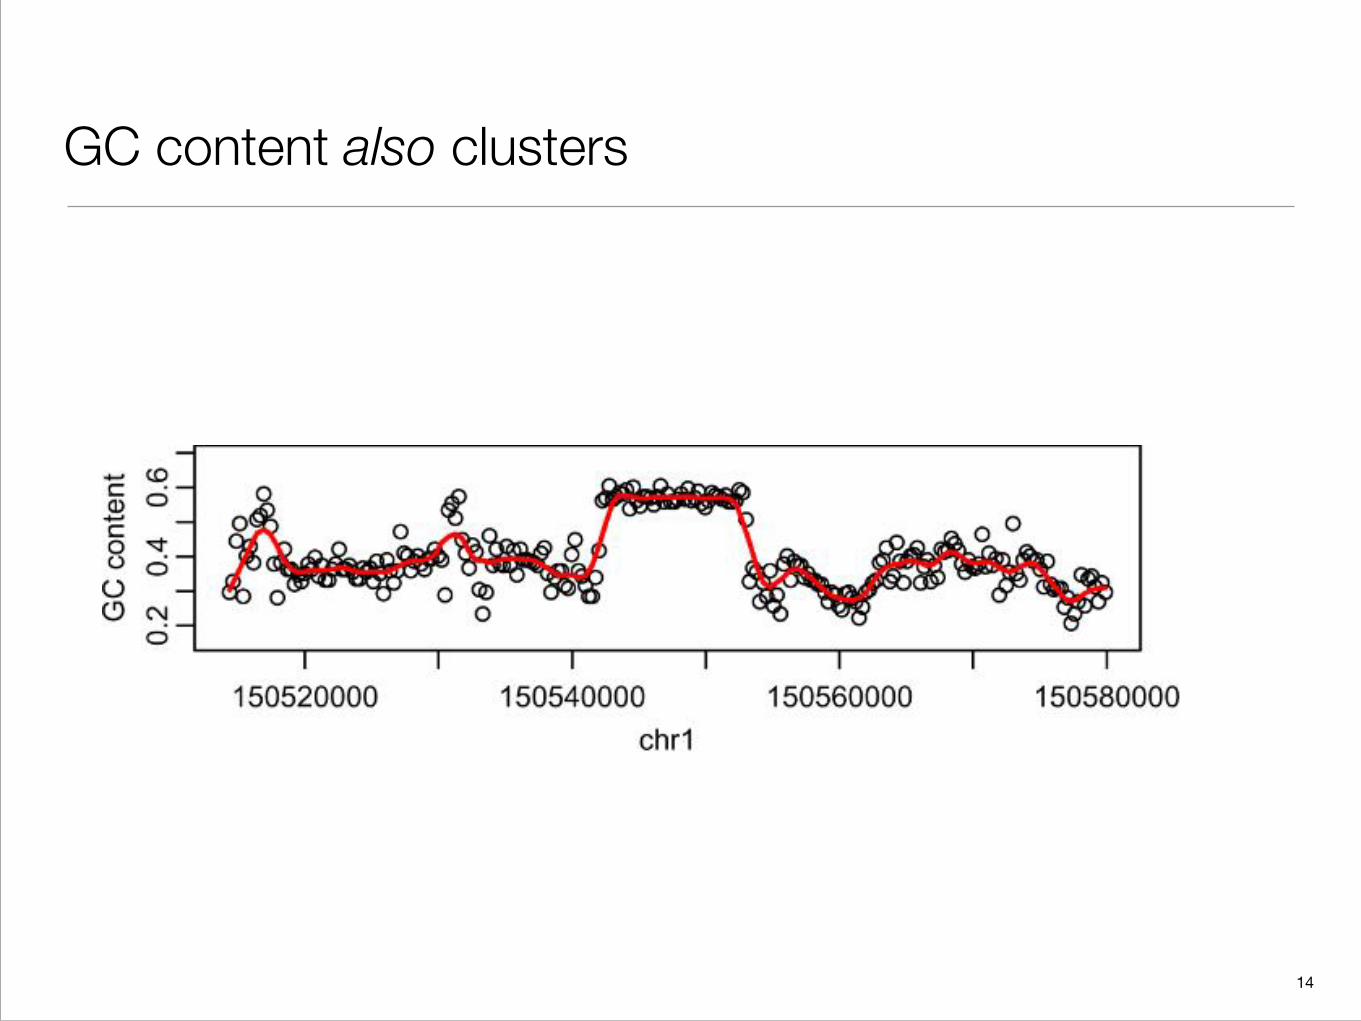
GC content also clusters
�14
Redefining CpG islands using HMMs 505
Fig. 5. GC content plots. A region with no Alu repeats was divided into nonoverlapping segments of length 256 bases.The points are the GC content of each segment. The curve is the result of a kernel smoother of the points.
for GC content as well. In Section 4, we describe the relevance of this characteristic in our approach todefining islands.
Figures 2 and 4 support the claims that CpGs are clustered and that O/E can be satisfactorily modeledby 2 states. Therefore, a 2-state HMM is a natural method to consider. However, modeling the emissionprobability at a single location is complicated because GC content, needed to compute O/E, varies widelyacross the genome, as seen in Figure 5. Another complication is that the distribution of CpG counts ata single location is somewhat complicated because outcomes from consecutive locations are not inde-pendent. For example, CG dinucleotide cannot start at consecutive bases. In Section 4, we described aprocedure, motivated by HMMs, that overcomes the described problems of existing approaches and thedifficulties of modeling sequence data directly. By modeling CpG counts in small bins instead of base-to-base transitions, the complexity of the emission model is greatly reduced. The models are thereforerelatively simple and can be fit without cutoff choices which facilitated the extension to species for whichCGI have never been reported.
4. MODEL
For any given genome, we assumed that each chromosome is divided into 3 states: Alu repetitive ele-ments, baseline, and CGI. Because the locations of the Alu-repetitive elements are well characterized,they are inherently not of interest for the current statistical problem and therefore such regions wereremoved. Hence, we characterize the problem as that of a semi-HMM, with a known state for Alu repet-itive elements. Our analysis then considers the 2-state chain conditional on being in a non-Alu repetitivestate.
We followed the basic statistical concepts first used by Churchill (1989), described by Durbin andothers (1998) and used by bioinformatic tools such as Multiple EM for Motif Elicitation (Bailey andothers, 2006), Motif Alignment & Search Tool (Bailey, 1998), and Basic Local Alignment Search Tool(Altschul and others, 1990). The foundation of these tools is the stochastic modeling of bases in thegenome. We denote B(t) as the base at genomic location t , pb(t) the probability that B(t) = b forb = A, T,G,C , and pCG(t) the probability of being CpG at location t . The depletion of CpG impliesthat the probability of a C at location t followed by a G is less likely than would be predicted by chanceunder independence: pCG(t) < pC (t) × pG(t + 1). We have argued that a useful model for detectionof CGI needs 2 states to describe changes in pC (t), pG(t), and pCG(t). However, we have specified3 parameters for each genomic location t , resulting in an overdetermined system. Placing parsimoniousmodeling assumptions on the chain of bases that imply in a 2-state stochastic process for the chain of CpGswould result in undue complexity. Instead, we describe and motivate simple assumptions that permittedthe derivation of a useful model from the general model described above.
We first divided the non-Alu regions into nonoverlapping segments of length L bp. For the resultsshown here, we used L = 16. This choice is justified in Section 4.2. We denoted NC (s), NG(s), andNCG(s) as the number of C , G, and CpG in segment s, and Y (s) the hidden state for segment s with 2
at Johns Hopkins U
niversity on September 8, 2010
biostatistics.oxfordjournals.orgD
ownloaded from
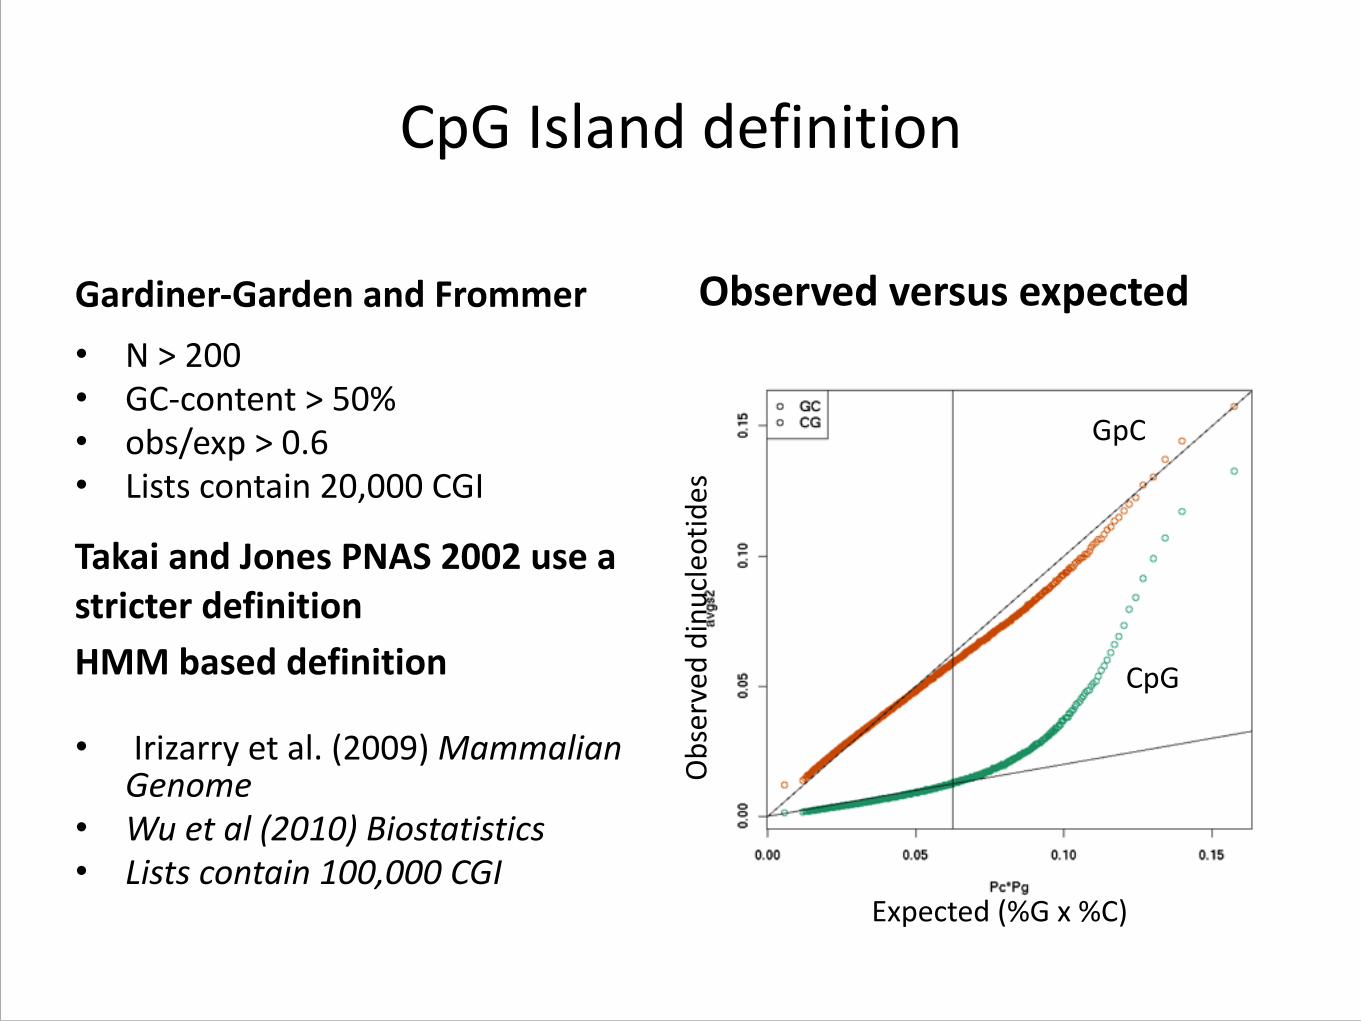
CpG Island definition
Gardiner-‐Garden and Frommer • N > 200 • GC-‐content > 50% • obs/exp > 0.6 • Lists contain 20,000 CGI
!!!!!
• Irizarry et al. (2009) Mammalian Genome
• Wu et al (2010) Biostatistics • Lists contain 100,000 CGI
Observed versus expected
Observed dinu
cleo
tides
Expected (%G x %C)
Takai and Jones PNAS 2002 use a stricter definition HMM based definition
GpC
CpG
Modeling via HMM
• See lecture notes
�16