Embed Size (px)
Citation preview

ModularityCMSC 858L

Module-detection for Function Prediction• Biological networks generally modular
(Hartwell+, 1999)
• We can try to find the modules within a network.
• Once we find modules, we can look at over-represented functions within a module, e.g.:
- If a majority of the proteins within a module have annotation A, predict annotation A for the other proteins in the module.
• ⇒ Graph clustering methods
- Min Multiway Cut, Graph Summarization, VI-Cut: examples we’ve already seen.
- Methods often borrowed from other “community detection” applications.
Modularity
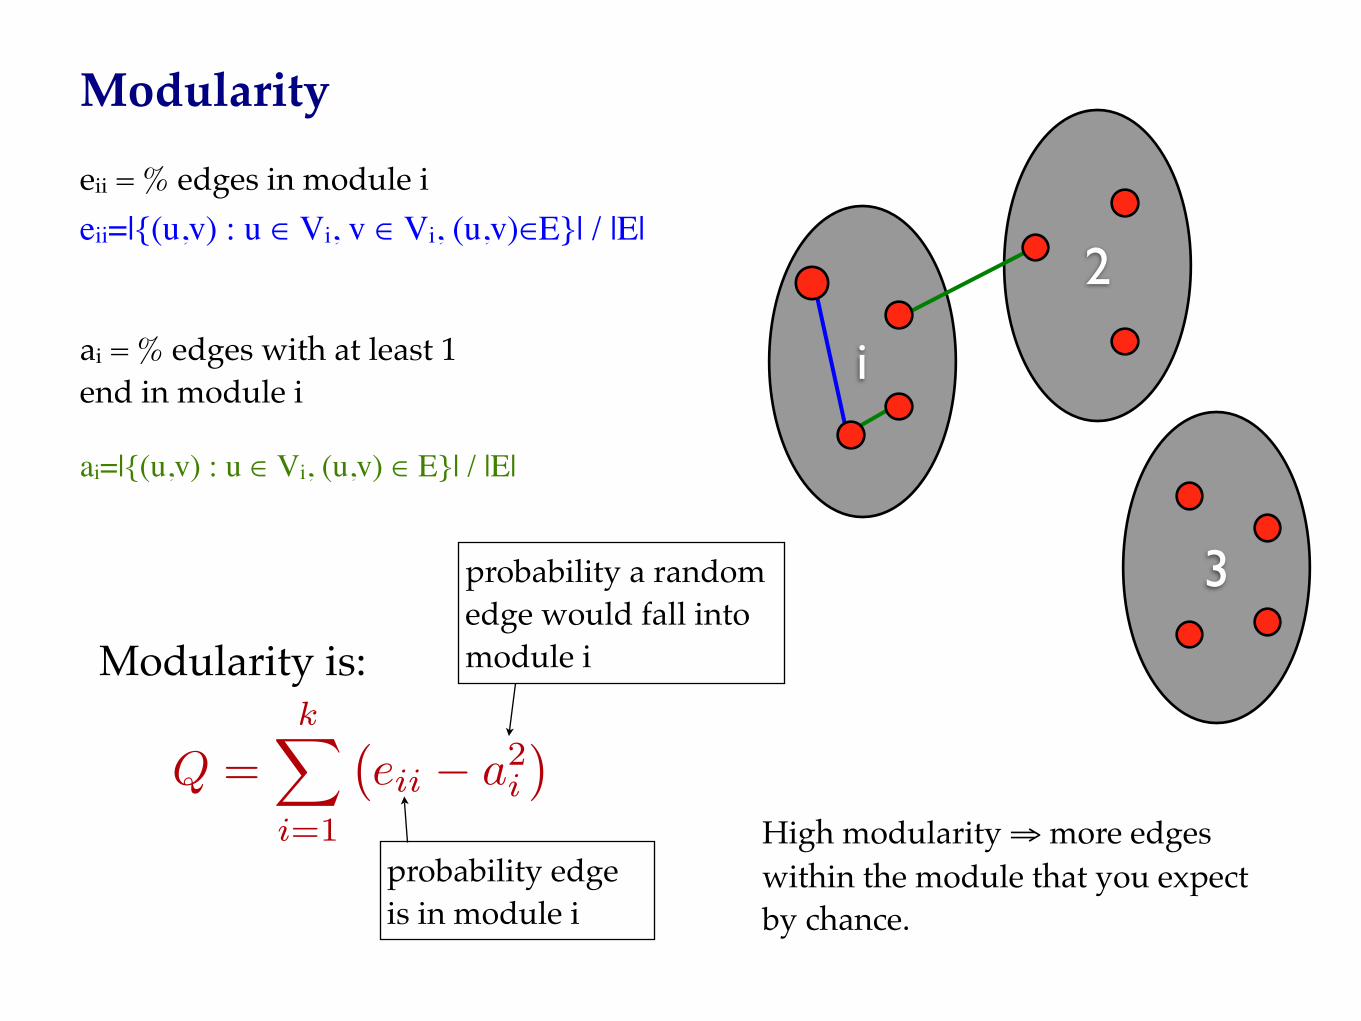
Modularity
Q =k�
i=1
�eii − a2
i
�Modularity is:
eii=|{(u,v) : u ∈ Vi, v ∈ Vi, (u,v)∈E}| / |E|
ai=|{(u,v) : u ∈ Vi, (u,v) ∈ E}| / |E|
ai = % edges with at least 1 end in module i
eii = % edges in module i
i
2
3
probability edge is in module i
probability a random edge would fall into module i
High modularity ⇒ more edges within the module that you expect by chance.

Examples
1
2
3
4
5
6
7
8
9
10
11
12 1314
15
16
17
18
19
20
21
22
23
24
2526
27
28
29
30
Communities assigned to a random graph
1
2
3
4
5
6
78
910
Communities Assigned to a small graph
Note: maximizing modularity will find it’s
own # of clusters

Modularity Algorithm #1
• Modularity is NP-hard to optimize (Brandes, 2007)
• Greedy Heuristic: (Newman, 2003)
- C = trivial clustering with each node in its own cluster
- Repeat:• Merge the two clusters that will increase the modularity
by the largest amount• Stop when all merges would reduce the modularity.

Karate Club (again)
Only 3 is in the “wrong” community.
Newman-Girvan, 2004

Maximizing Modularity via a Spectral Technique

Another View of Modularity
normalization
in same module
Q =1
4m
�
i,j
�Aij −
kikj
2m
�
adjacency matrix
probability a random edge would go between i and j
Consider the case of only 2 modules. Let si = 1 if node i is in module 1; -1 if node i is in module 2
Q =1
4m
�
i,j
�Aij −
kikj
2m
�(sisj + 1)
=1
4m
�
i,j
�Aij −
kikj
2m
�sisj
m = # edges in graphki = degree(i)

Goal: Maximize modularity
• Try to find ±1 vector s that maximizes the modularity.
• Start with the case above: only two groups.
• Then show how to extend to ≥ 2 groups.
• Will use some ideas from linear algebra.

Q =1
4m
�
i,j
�Aij −
kikj
2m
�sisj
=1
4msT Bs
“modularity” matrix
s is a {-1,1} membership
vector
s =�
i
aiui ai = uTi s
Let ui (i = 1,...,n) be the eigenvectors of matrix B with eigenvalue βi for vector ui. (Assume β1 ≥ β2 ≥ β3 ≥ β4 ≥ ... ≥ βn)
Write s as: where:

Q =1
4msT Bs
=
��
i
aiuTi
�B
�
j
ajuj
=
��
i
aiuTi B
�
�
j
ajuj
=�
i
�
j
aiajuTi Buj
s =�
i
aiui ai = uTi s
Note: 1. Buj = βi uj
2. When i ≠ j, uiTBuj = 0 because ui ⊥ uj
Q =�
i
(uTi s)2βi
drop the (1/4m)

To Maximize Q
• If we were allowed to choose any s we’d pick the one that is parallel to u1.
• But: si must be +1 or -1.This is a severe restriction.
• So: maximize u1⋅s, the projection of s along vector u1.
• To do this: choose si = 1 if u1 > 0, and si = -1 if u1 ≤ 0.
Q =�
i
(uTi s)2βi

Subsequent Splits
The modularity of module g as it stands now
The modularity if this module was split according to s
g
+1-1
=12
�
i,j∈g
Bijsisj +12
�
i,j∈g
Bij −�
i,j∈g
Bij
�
i,j∈g
Bij =�
i,j∈g
sisjδi,j
�
k∈g
Bik

Karate Club Results: Exactly Right
(Newman, 2006)

Greedy Improvement
• Given a partition of the network
• Repeat:
- Find the vertex that would yield the largest modularity increase if it were moved into a different community AND that has not yet been moved
- Move the vertex into that new community
• Return the best partitioning ever observed
largest increase might be negative
Similar to the Kernighan-Lin graph partitioning heuristic (details in a few slides)

Additional Results
Girvan-Newman(betweenness)
NewmanSpectral
Newman, 2006
GreedyHierarchical

Krebs Political Books
Edges = books frequently bought by the same readers on
Amazon.com
Nodes = political books; shape = conservative (squares) / liberal (circles) / “centrist” (triangles)

Complexes
All GS predictions are Pareto optimalMany unique predictions made by each algorithm
Biological Processes
“+” indicates parameters tuned to maximize precision

% Modules EnrichedA lower % of GS modules are enriched for some annotation, but not indicative of predictive performance.
“Easy” to get legitimate statistical signiBicant enrichment.

Summary: Modularity
• Modularity is widely used as a measure for how good a clustering is.
• Particularly popular in social network analysis, but used in other contexts as well (e.g. Brain networks).
• Has a “resolution” preference: for a given network, will tend to prefer clusters of a particular size.
• Often this means the clusters are too big.
• A good example of where a spectral clustering technique can work.