Embed Size (px)
Citation preview

Understanding the Quantitative Investment Attributes of a Business
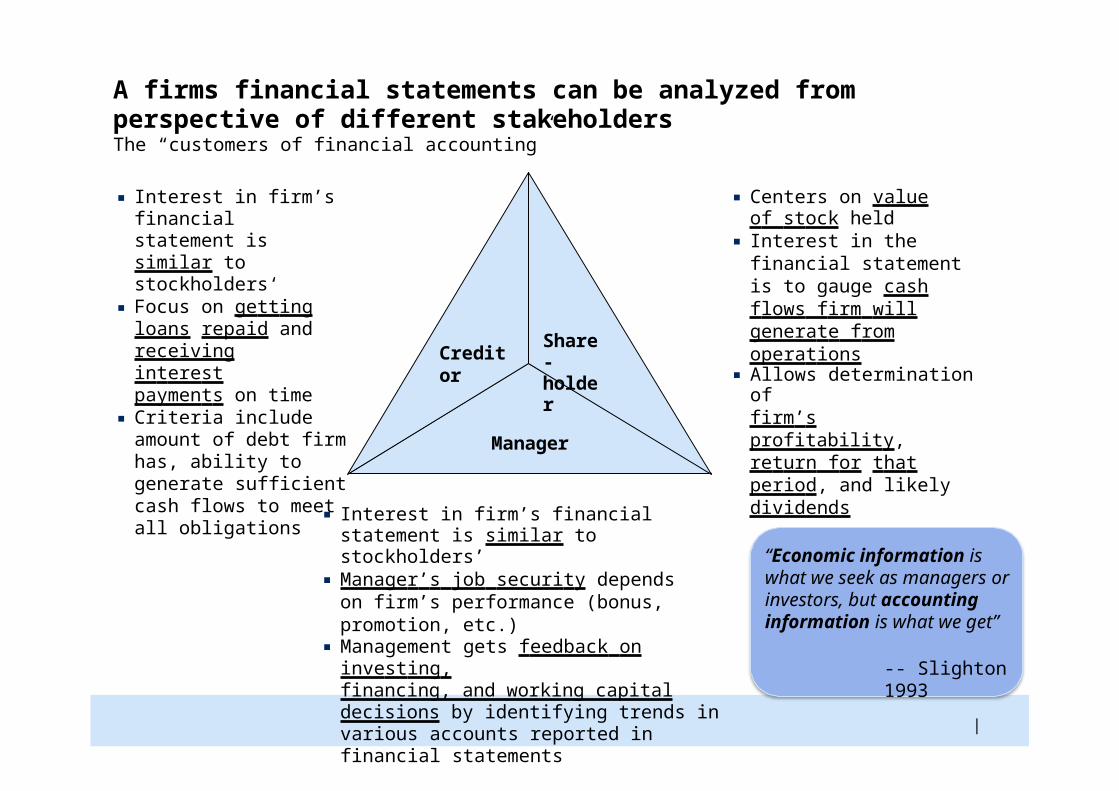
A firms financial statements can be analyzed from perspective of different stakeholdersThe “customers of financial accounting”
▪ Centers on value of stock held
▪ Interest in the financial statement is to gauge cash flows firm will generate from operations
▪ Allows determination offirm’s profitability, return for that period, and likely dividends
▪ Interest in firm’s financial statement is similar to stockholders’
▪ Manager’s job security depends on firm’s performance (bonus, promotion, etc.)
▪ Management gets feedback on investing,financing, and working capital decisions by identifying trends in various accounts reported in financial statements
▪ Interest in firm’s financial statement is similar to stockholders‘
▪ Focus on getting loans repaid and receiving interest payments on time
▪ Criteria include amount of debt firm has, ability to generate sufficient cash flows to meet all obligations
“Economic information is what we seek as managers or investors, but accounting information is what we get”
-- Slighton 1993
Creditor
|
Share- holder
Manager

Financial analysis relies on a set of tools and techniques, all of which have usefulness and limitations
Common size analysis
Regression-based analysis
Graph-based analysis
Ratio analysis
Financial analysis
|

ApplicationUsefulness
• Removes the effect of size
• Compare firm’s performance to direct competitors’ performance (cross sectional analysis)
• Comparison of a company’s results over time (trend or time-series analysis)
Common-Size Balance Sheet• Each asset and liability item on balance
sheet is standardized by dividing by total assets
• Accounts then represented as percentages of total assets
Vertical Common-Size Income Statement• Each income statement item standardized
by dividing it by dollar amount of net sales• Each income statement item now
indicated as percent of sales
Common-Size Analysis
|

Common-Size Analysis – Common size balance sheet
Process the data Analyze and interpret
|

Common-Size Analysis – Common size balance sheet
Analyze and interpretProcess the data
|
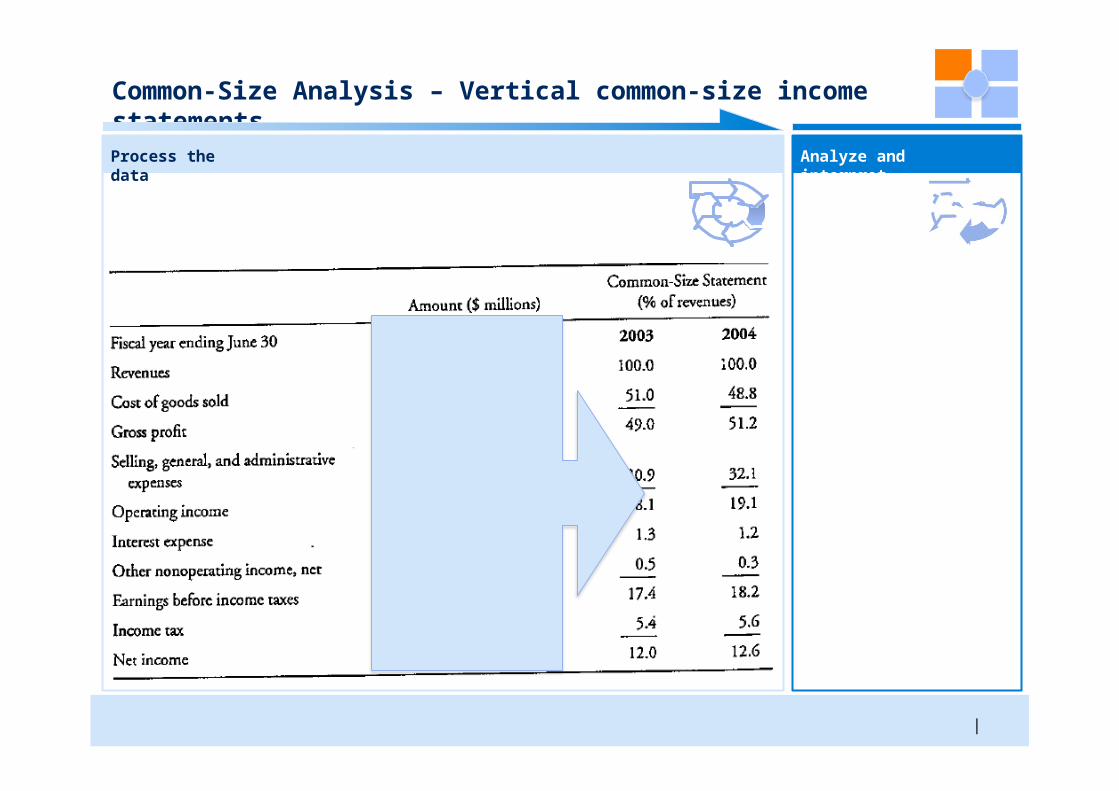
Common-Size Analysis – Vertical common-size income statements
Analyze and interpretProcess the data
|

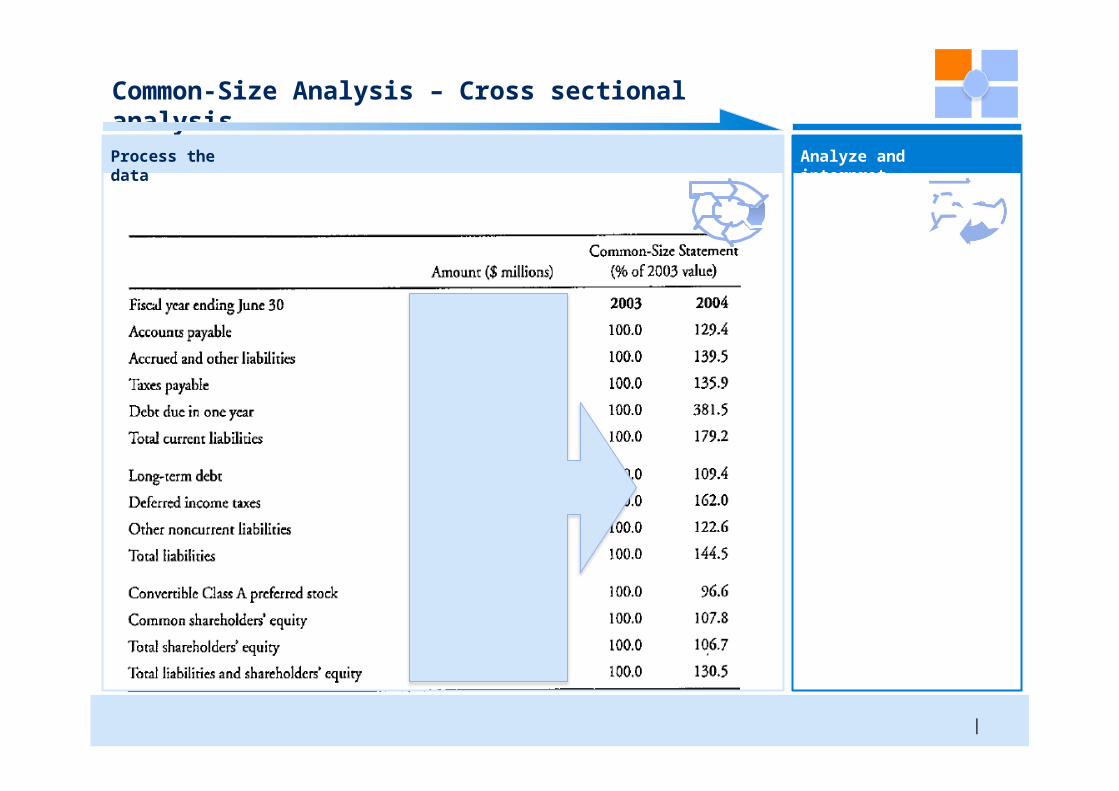
Common-Size Analysis – Cross sectional analysis
Analyze and interpretProcess the data
|
Common-Size Analysis – Cross sectional analysis
Analyze and interpretProcess the data
|

Common-Size Analysis – Cross sectional analysis
Analyze and interpretProcess the data
|

Common-Size Analysis – Trend analysisPartial balance sheet for a hypothetical company over 5 periods
Analyze and interpretProcess the data
|
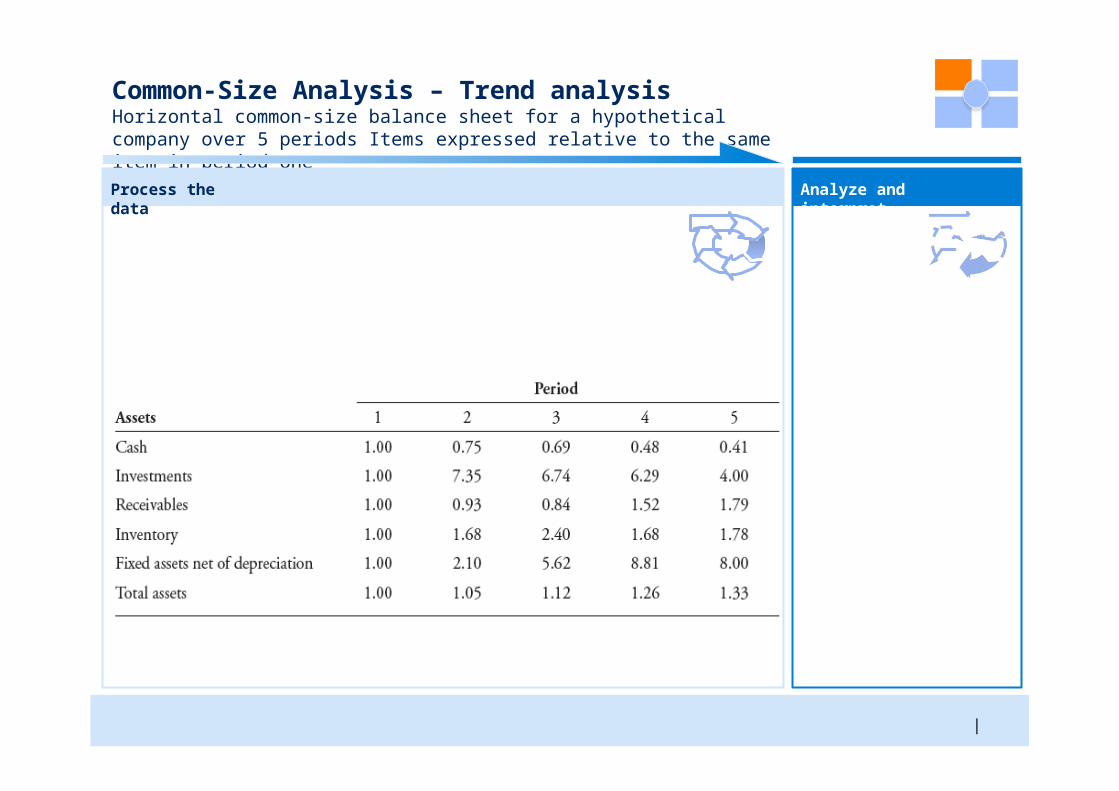
Common-Size Analysis – Trend analysisHorizontal common-size balance sheet for a hypothetical company over 5 periods Items expressed relative to the same item in period one
Analyze and interpretProcess the data
|

Use of Graphs & Charts
Analyze and interpretProcess the data
|

Regression Analysis
Analyze and interpretProcess the data
|

Each ratio category measures a different aspect of the company’s business, its ability to generate cash flows and the associated risks
Main ratios
Activity
Liquidity
3 Solvency
Profitability
Valuation
▪ Measure how efficiently a company performs day-to-day tasks, such as the collection of receivables and management of inventory.
▪ Measure the company’s ability to meet its short-term obligations
▪ Measure a company’s ability to meet long- term obligations. Subsets of these ratios are also known as “leverage” and “long- term debt” ratios.
▪ Measure the company’s ability to generate profits from its resources (assets)
▪ Measure the quantity of an asset or flow (e.g., earnings) associated with ownership of a specified claim (e.g., a share or ownership of the enterprise).
Discussed further on next page
A ratio is computed by dividing one balance sheet or income statement item by another
Variety of ratios can be computed to focus on specialized aspects of firm’s performance
1
2
4
5
|
Ratio Analysis

Ratios used in industry
• No universally accepted industry ratios
• Common purpose: indicators of important aspects of the economics of the industry
• Regulated industry (e.g. financial) have to comply to specific regulatory ratios
Description Application
|

Piotroski’s F-Score was developed as a simple financial statement analysis discriminating between winners and losers amongst value stocks
Complication
However, there is a wide variability in terms of the returns across these stocks:
▪ Stellar companies: Their performance turns around, the broader market becomes optimistic about the stock, and it really takes off
▪ Decaying companies: Their performance languish; they continue to perform poorly and could eventually de-list or enter bankruptcy.
Question
How to weed out the poor performers and identify the winners in advance?
Situation
|
Value stocks (high book-to- market value) have strong returns as a group

The Piotroski F-Score aims to identify the healthiest companies amongst a basket of value stocks by applying 9 accounting-based selection criteria
▪ Investing in the top performers mean return earned by a high book-to-market investor can be increased by at least 7.5% annually1
▪ Buying top stocks and shorting worst scores stocks would have resulted in 23% annualized gains, more than double the S&P 500 broad market index return
▪ Weak stocks, scoring two points or less, were five times more likely to either go bankrupt or delist due to financial problems.
▪ 1/6th of the return delta between strong and weak firms is earned over the four three-day periods surrounding subsequent earnings announcements – the market is slow to appreciate improved financial performance
1 Over a 20-year test period from 1976 through1996
Results
▪ Use relevant historical information to eliminate firms with poor future prospects from a generic value portfolio
▪ 9 variables from a company’s financial statements, with 1 point awarded for each test that a stock passes
Approach
|

A simple accounting-based fundamental analysis strategy can shift the distribution of investment returnsPortfolio construction approach
Screen based on current valuation
|
Screen based on fundamentals
Stock selection for portfolio construction
• Starts by selecting the top 20% Book- to-market (Lowest Price-to-Book) stocks
• Looks for companies that are profit-making, have improving margins, don't seem to employ any accounting tricks and have strengthening balance sheets
• Select only the companies that have a score of 7 or above

The approach suggests that a simple accounting-based fundamental analysis strategy can shift the distribution of investment returnsF-score calculation
F-Score
Profitability
Operating efficiency
Leverage, Liquidity & Source of Funds
Net income
Operating cash flow
Return on assets
Quality of earnings
Asset turnover
Gross margin
Long-term debt to assets
Current ratio
Shares outstanding
|
▪ Assesses the bottom ▪line
Score 1 if last year net income is positive.
▪ Provides a better
▪gauge of “true” earnings
▪ Measures of asset
▪profitability
Score 1 if last year cash flow is positive
Score 1 if last year ROA exceeds prior- year ROA.
▪ Warns of Accounting Tricks
▪ Score 1 if last year operating cash flow from operations exceeds net income before extraordinary items.
▪ Score 1 if full-year GM exceeds the prior-year GM
▪ Measures competitive position
▪ Measures productivity
▪ Score 1 if % increase in sales exceeds the % increase in total assets
▪ Is debt decreasing? ▪ Score 1 if the ratio of long-term debt to assets is down from the year-ago value.
▪ Measures increasing working capital
▪ Score 1 if CR has increased from the prior year
▪ Measures potential dilution
▪ Score 1 if the if the Firm did not issue new shares/equity in the preceding year/ number of shares outstanding is nogreater than the year-ago figure.

Portfolio of U.S. value stocks with a F-score of 9 tend to significantly outperform in simple back-testing
|