Embed Size (px)
Citation preview
1
CNS/ATM Enhancements to Reduce Aircraft Emissions
May 6, 1998
ASD-430/ACT-520SETA/CSSI
2
Outline
Review Study ObjectiveScope of AnalysisAssumptions ResultsSummary of Rio BriefingReport and DocumentationPhase II
3
Develop preliminary estimates of fuel savings and resulting emission reductions (NOx, CO, and HC) from CNS/ATM enhancements in the U.S.
Results should identify the upper bound of savings that could be achieved in the best case situation.
Results of analysis to be presented at the FAA briefing at the ICAO World-wide CNS/ATM Systems Implementation Conference in May.
Study Objective
4
Period of evaluation is 1996-2015 and will cover planned CNS/ATM improvements in:– US controlled Oceanic airspace– CONUS En route and terminal airspace– Surface operations
Use the Concept of Operations and preliminary NAS Architecture V3.0 to provide the time-frame for the implementation of the planned CNS/ATM capabilities
Scope of Analysis
5
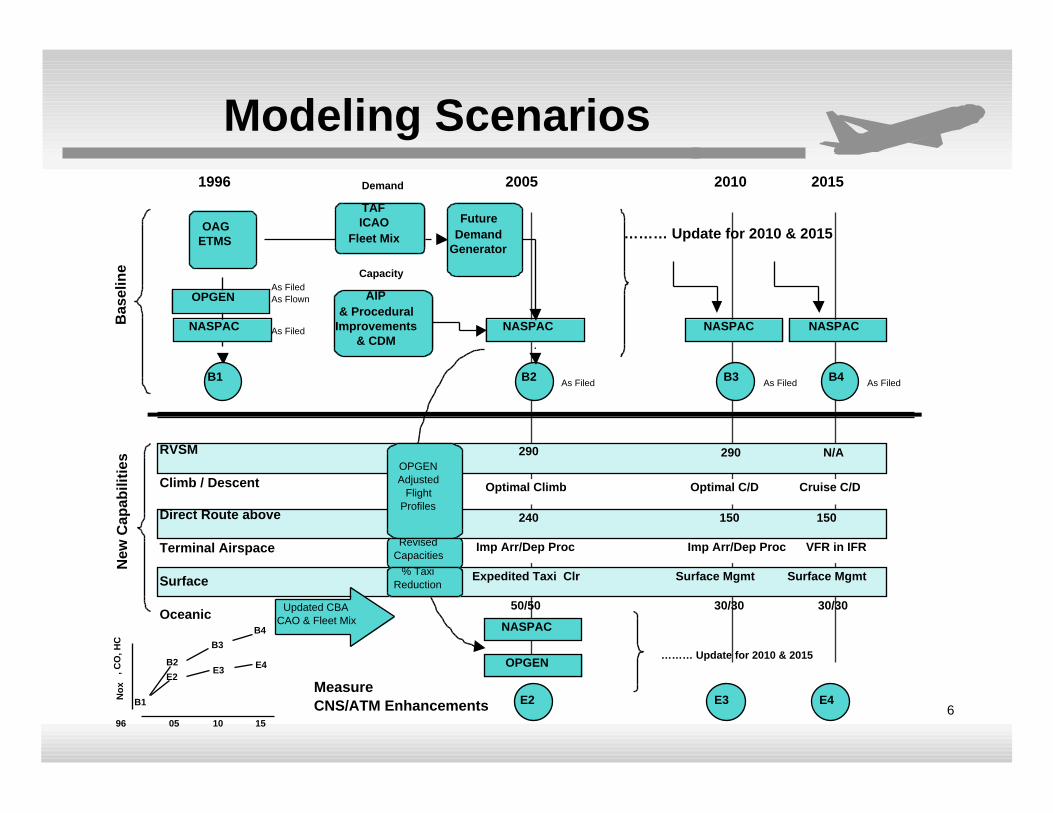
Baseline and Future NAS Scenarios
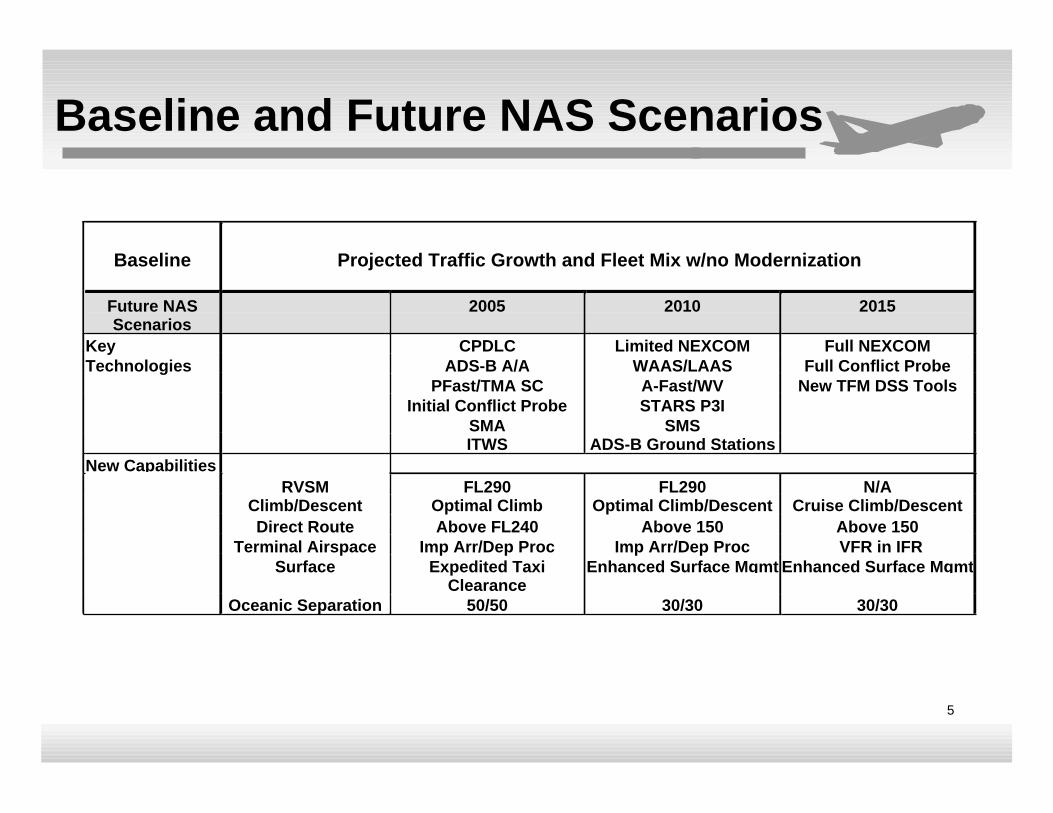
Baseline Projected Traffic Growth and Fleet Mix w/no Modernization
Future NASScenarios
2005 2010 2015
Key CPDLC Limited NEXCOM Full NEXCOMTechnologies ADS-B A/A WAAS/LAAS Full Conflict Probe
PFast/TMA SC A-Fast/WV New TFM DSS ToolsInitial Conflict Probe
SMASTARS P3I
SMSITWS ADS-B Ground Stations
New CapabilitiesRVSM FL290 FL290 N/A
Climb/Descent Optimal Climb Optimal Climb/Descent Cruise Climb/DescentDirect Route Above FL240 Above 150 Above 150
Terminal Airspace Imp Arr/Dep Proc Imp Arr/Dep Proc VFR in IFRSurface Expedited Taxi
ClearanceEnhanced Surface Mgmt Enhanced Surface Mgmt
Oceanic Separation 50/50 30/30 30/30
6
Modeling Scenarios
Imp Arr/Dep Proc Imp Arr/Dep Proc VFR in IFR
FutureDemand
Generator
OAGETMS
1996 2005 2010 2015
B1 B2 B3 B4
AIP & Procedural
Improvements& CDM
TAFICAO
Fleet Mix
NASPAC NASPAC
……… Update for 2010 & 2015
Demand
Capacity
MeasureCNS/ATM Enhancements E2 E3 E4
RVSM
Climb / Descent
Direct Route above
Terminal Airspace
Surface
Oceanic
290290
240 150 150
New
Cap
abili
ties
Optimal C/D Cruise C/DOptimal Climb
Surface Mgmt
30/30 30/3050/50
Expedited Taxi Clr Surface Mgmt
NASPACNASPAC
As FiledAs Flown
As Filed
Updated CBAICAO & Fleet Mix NASPAC
OPGEN
OPGEN
As Filed As Filed As Filed
Bas
elin
e
OPGENAdjusted
FlightProfiles
RevisedCapacities
……… Update for 2010 & 2015
% TaxiReduction
N/A
05 151096
No
x, C
O, H
C
B1
E3 E4E2
B2
B4
B3
7
Assumptions
Base year for US aviation fuel consumption is 1996.Fuel and emission calculations cover only IFR flight plan traffic.Current airspace structure will be modified as appropriate to accommodate CNS/ATM enhancements.Fuel-emission conversion algorithms provided by FAA/AEE, ICAO, and NASA/Boeing were used to calculate emissions for ground, climb/descent, and cruise phases of flight.
8
Sources of Data
Enhanced Traffic Management System & Official Airline Guide– Baseline traffic operations
ICAO– Pacific and N. Atlantic traffic forecasts– Oceanic & domestic fleet mix projections
FAA/APO, ATA, ICAO, & NASA– Traffic forecasts– Fleet mix projections
–
9
Sources of Data (cont.)
FAA/ASC– Planned runways– Airport capacity data
FAA/ASD– NAS Architecture V3.0 Draft plans and
schedule– Performance metrics, investment analyses,
and cost-benefit studiesAEE/NASA/Boeing– Aircraft performance data– Fuel-emission conversion algorithms
–
10
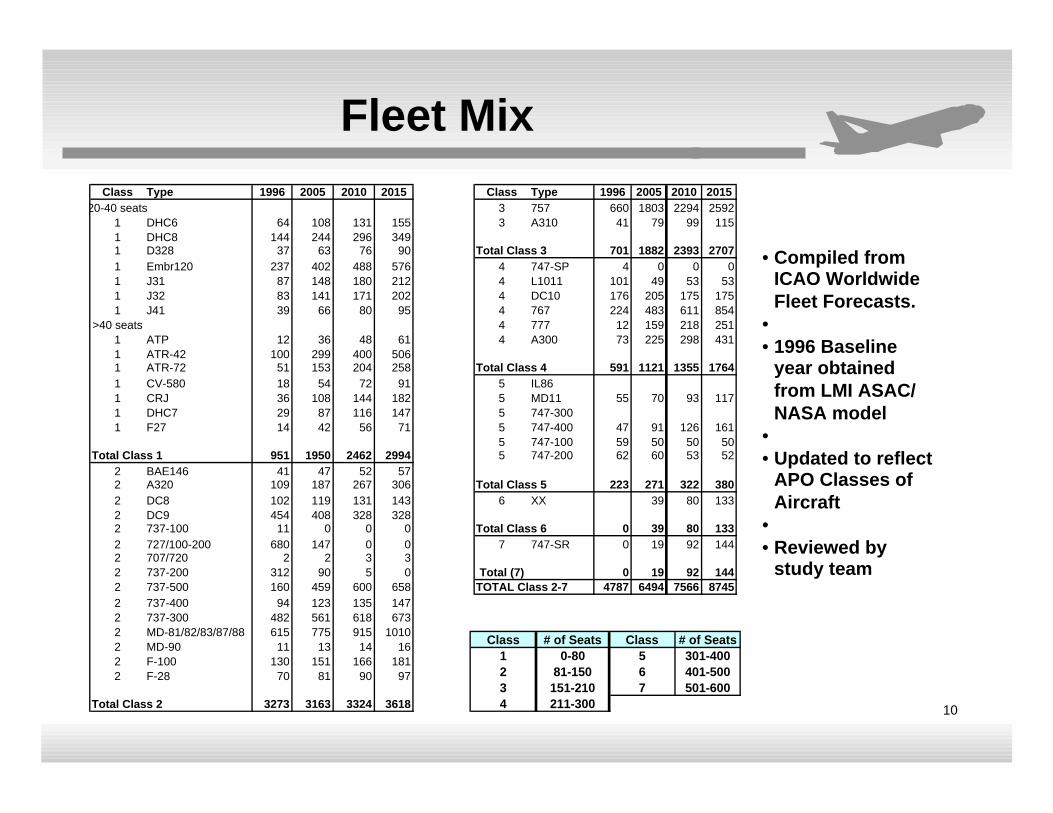
Fleet MixClass Type 1996 2005 2010 2015 Class Type 1996 2005 2010 2015
20-40 seats 3 757 660 1803 2294 25921 DHC6 64 108 131 155 3 A310 41 79 99 1151 DHC8 144 244 296 3491 D328 37 63 76 90 Total Class 3 701 1882 2393 27071 Embr120 237 402 488 576 4 747-SP 4 0 0 01 J31 87 148 180 212 4 L1011 101 49 53 531 J32 83 141 171 202 4 DC10 176 205 175 1751 J41 39 66 80 95 4 767 224 483 611 854
>40 seats 4 777 12 159 218 2511 ATP 12 36 48 61 4 A300 73 225 298 4311 ATR-42 100 299 400 5061 ATR-72 51 153 204 258 Total Class 4 591 1121 1355 17641 CV-580 18 54 72 91 5 IL861 CRJ 36 108 144 182 5 MD11 55 70 93 1171 DHC7 29 87 116 147 5 747-3001 F27 14 42 56 71 5 747-400 47 91 126 161
5 747-100 59 50 50 50Total Class 1 951 1950 2462 2994 5 747-200 62 60 53 52
2 BAE146 41 47 52 572 A320 109 187 267 306 Total Class 5 223 271 322 3802 DC8 102 119 131 143 6 XX 39 80 1332 DC9 454 408 328 3282 737-100 11 0 0 0 Total Class 6 0 39 80 1332 727/100-200 680 147 0 0 7 747-SR 0 19 92 1442 707/720 2 2 3 32 737-200 312 90 5 0 Total (7) 0 19 92 1442 737-500 160 459 600 658 TOTAL Class 2-7 4787 6494 7566 87452 737-400 94 123 135 1472 737-300 482 561 618 6732 MD-81/82/83/87/88 615 775 915 10102 MD-90 11 13 14 162 F-100 130 151 166 1812 F-28 70 81 90 97
Total Class 2 3273 3163 3324 3618
Class # of Seats Class # of Seats1 0-80 5 301-4002 81-150 6 401-5003 151-210 7 501-6004 211-300
• Compiled from ICAO Worldwide Fleet Forecasts.
•• 1996 Baseline
year obtained from LMI ASAC/NASA model
•• Updated to reflect
APO Classes of Aircraft
•• Reviewed by
study team
11
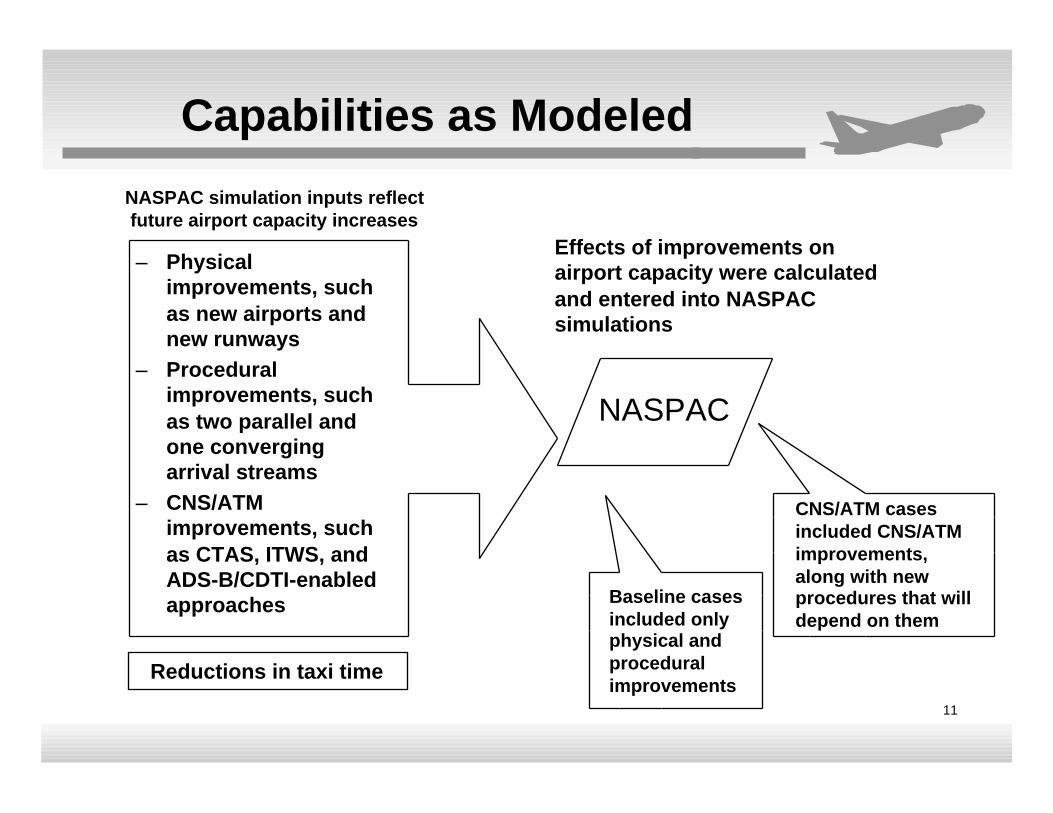
Capabilities as Modeled
– Physical improvements, such as new airports and new runways
– Procedural improvements, such as two parallel and one converging arrival streams
– CNS/ATM improvements, such as CTAS, ITWS, and ADS-B/CDTI-enabled approaches
NASPAC
Effects of improvements on airport capacity were calculated and entered into NASPAC simulations
NASPAC simulation inputs reflect future airport capacity increases
CNS/ATM cases included CNS/ATM improvements, along with new procedures that will depend on them
Baseline cases included only physical and procedural improvements
Reductions in taxi time
12
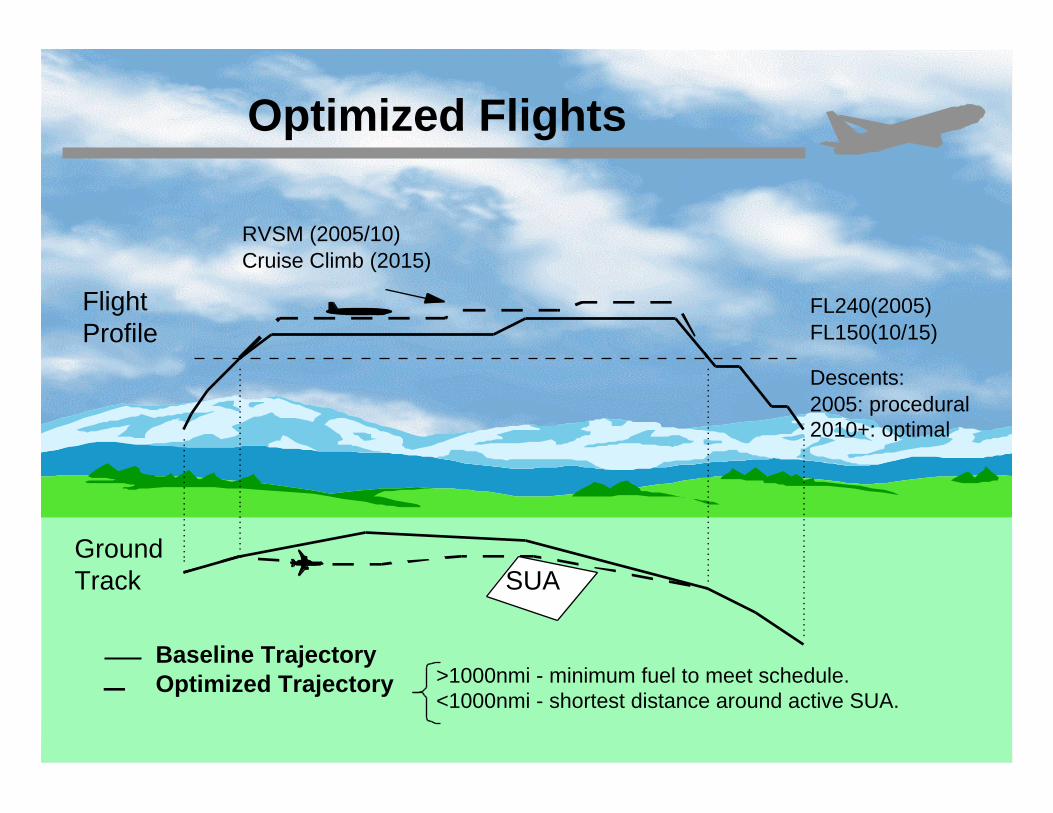
Optimized Flights
FL240(2005)FL150(10/15)
SUA
FlightProfile
GroundTrack
RVSM (2005/10)Cruise Climb (2015)
Descents:2005: procedural2010+: optimal
Baseline TrajectoryOptimized Trajectory >1000nmi - minimum fuel to meet schedule.
<1000nmi - shortest distance around active SUA.
13
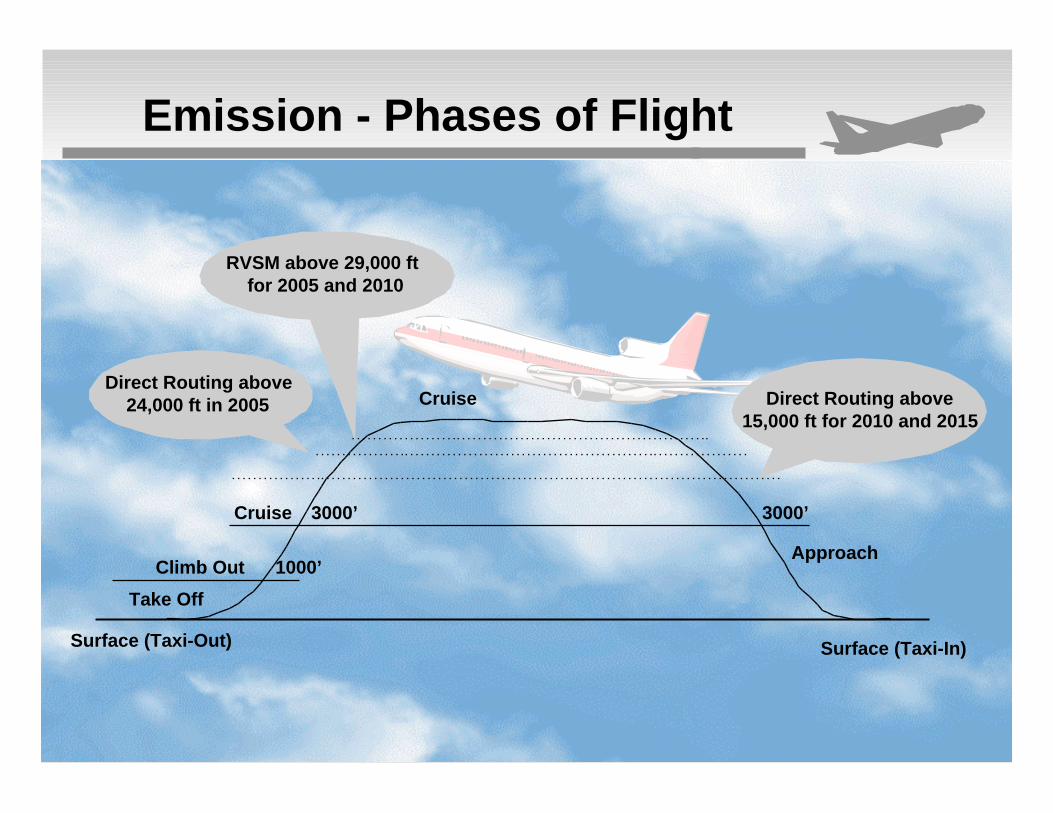
Emission - Phases of Flight
Surface (Taxi-In)
Take Off
Approach
Cruise
Climb Out
Surface (Taxi-Out)
3000’ 3000’
1000’
RVSM above 29,000 ft for 2005 and 2010
Cruise Direct Routing above15,000 ft for 2010 and 2015
Direct Routing above24,000 ft in 2005
14
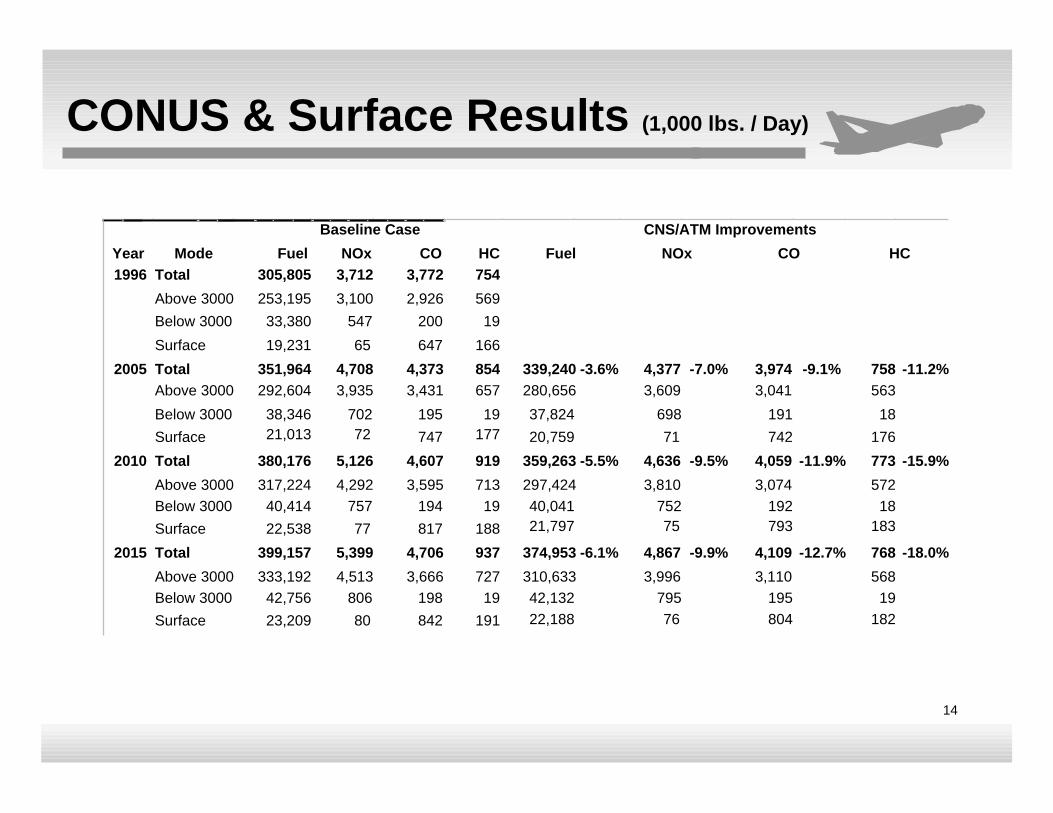
CONUS & Surface Results (1,000 lbs. / Day)
Baseline Case CNS/ATM Improvements
Year Mode Fuel NOx CO HC
1996 Total 305,805 3,712 3,772 754
Above 3000 253,195 3,100 2,926 569
Below 3000 33,380 547 200 19
Surface 19,231 65 647 166
2005 Total 351,964 4,708 4,373 854 339,240 -3.6% 4,377 -7.0% 3,974 -9.1% 758 -11.2%
Above 3000 292,604 3,935 3,431 657 280,656 3,609 3,041 563
Below 3000 38,346 702 195 19 37,824 698 191 18
Surface 21,013 72 747 177 20,759 71 742 176
2010 Total 380,176 5,126 4,607 919 359,263 -5.5% 4,636 -9.5% 4,059 -11.9% 773 -15.9%
Above 3000 317,224 4,292 3,595 713 297,424 3,810 3,074 572
Below 3000 40,414 757 194 19 40,041 752 192 18
Surface 22,538 77 817 188 21,797 75 793 183
2015 Total 399,157 5,399 4,706 937 374,953 -6.1% 4,867 -9.9% 4,109 -12.7% 768 -18.0%
Above 3000 333,192 4,513 3,666 727 310,633 3,996 3,110 568
Below 3000 42,756 806 198 19 42,132 795 195 19
Surface 23,209 80 842 191 22,188 76 804 182
Fuel NOx CO HC
15
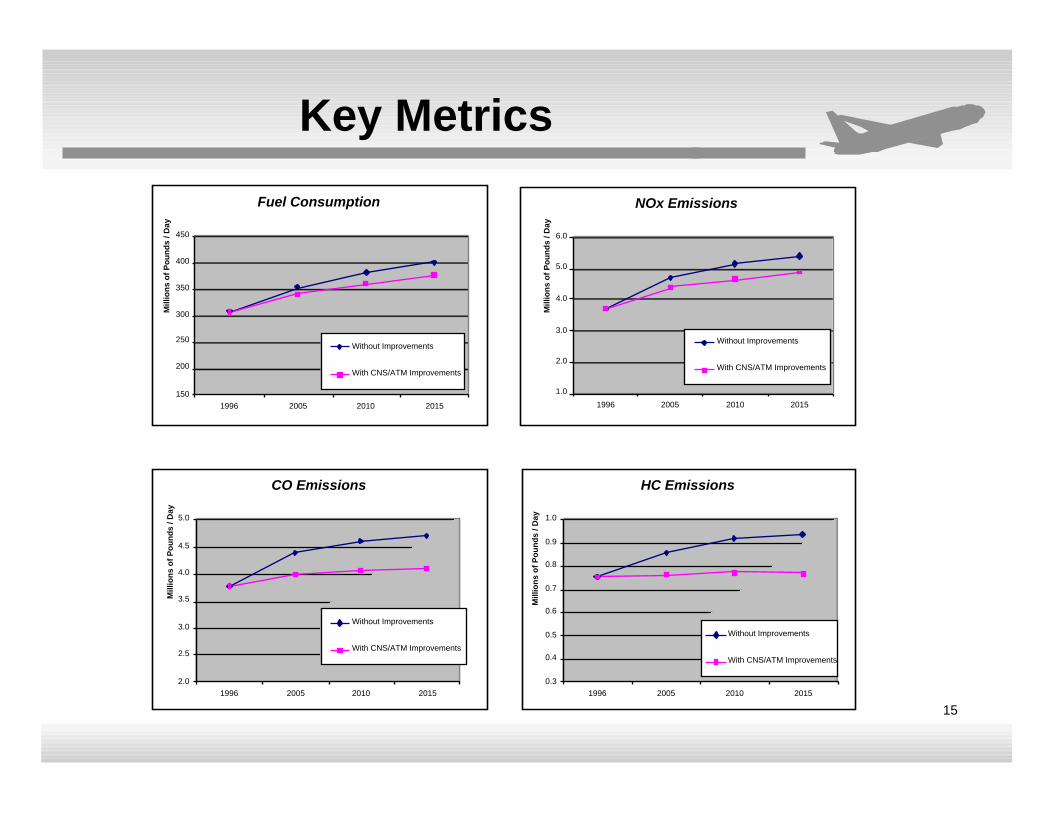
Key Metrics
Fuel Consumption
150
200
250
300
350
400
450
1996 2005 2010 2015
Mill
ion
s o
f P
ou
nd
s / D
ays
Without Improvements
With CNS/ATM Improvements
NOx Emissions
1.0
2.0
3.0
4.0
5.0
6.0
1996 2005 2010 2015
Mill
ion
s o
f P
ou
nd
s / D
ays
Without Improvements
With CNS/ATM Improvements
CO Emissions
2.0
2.5
3.0
3.5
4.0
4.5
5.0
1996 2005 2010 2015
Mill
ion
s o
f P
ou
nd
s / D
ays
Without Improvements
With CNS/ATM Improvements
HC Emissions
0.3
0.4
0.5
0.6
0.7
0.8
0.9
1.0
1996 2005 2010 2015
Mill
ion
s o
f P
ou
nd
s / D
ays
Without Improvements
With CNS/ATM Improvements
16
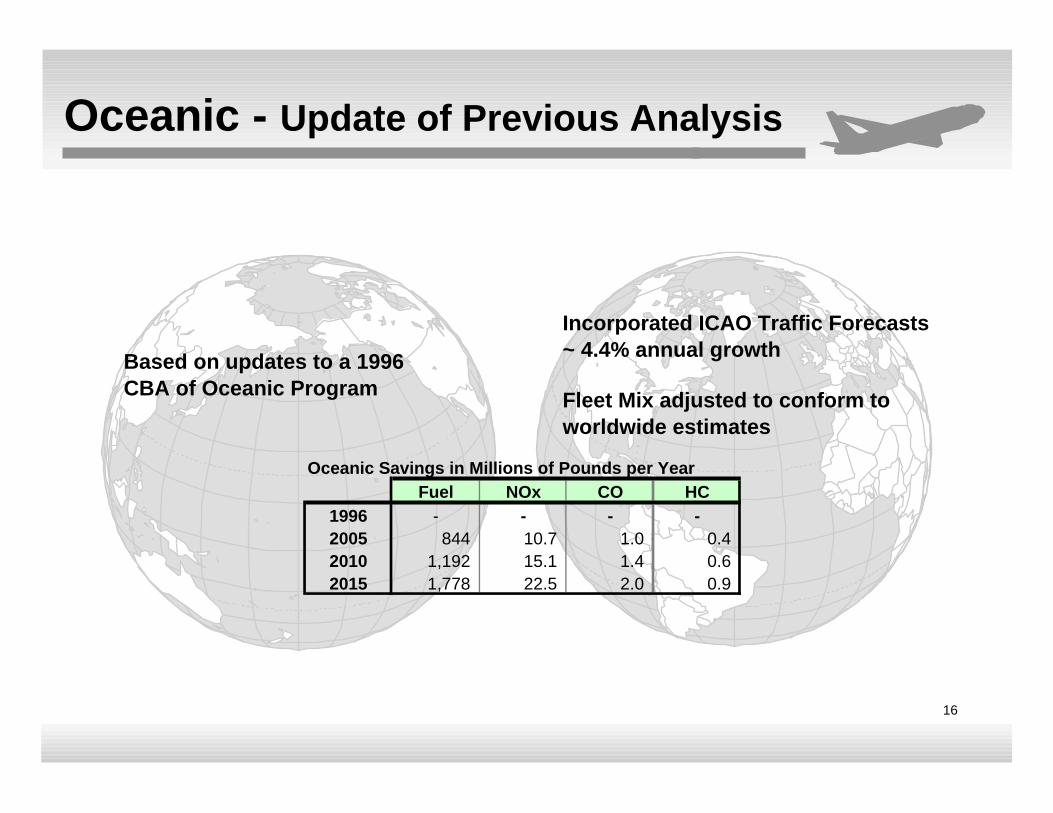
Oceanic - Update of Previous Analysis
Oceanic Savings in Millions of Pounds per Year
Fuel NOx CO HC
1996 - - - -2005 844 10.7 1.0 0.4 2010 1,192 15.1 1.4 0.6 2015 1,778 22.5 2.0 0.9
Based on updates to a 1996 CBA of Oceanic Program
Incorporated ICAO Traffic Forecasts ~ 4.4% annual growth
Fleet Mix adjusted to conform to worldwide estimates
17
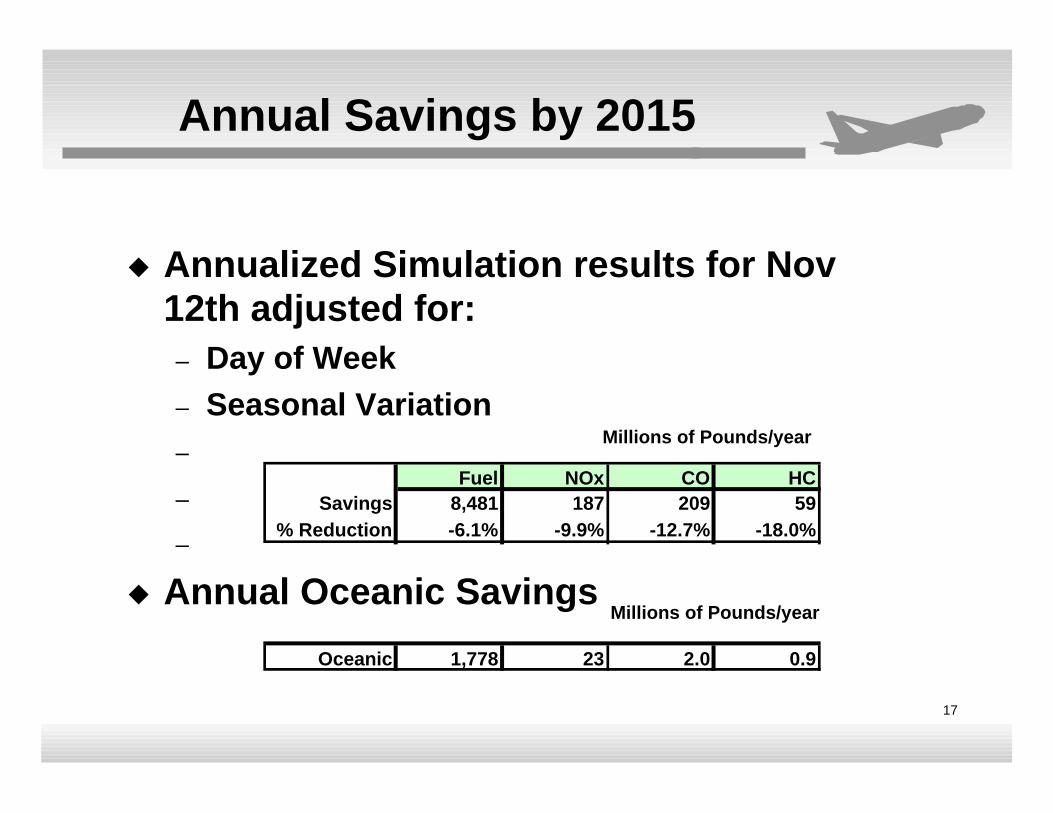
Annualized Simulation results for Nov 12th adjusted for:– Day of Week– Seasonal Variation –
–
–
Annual Oceanic Savings
Annual Savings by 2015
Millions of Pounds/year
Millions of Pounds/year
Fuel NOx CO HCSavings 8,481 187 209 59
% Reduction -6.1% -9.9% -12.7% -18.0%
Oceanic 1,778 23 2.0 0.9
18
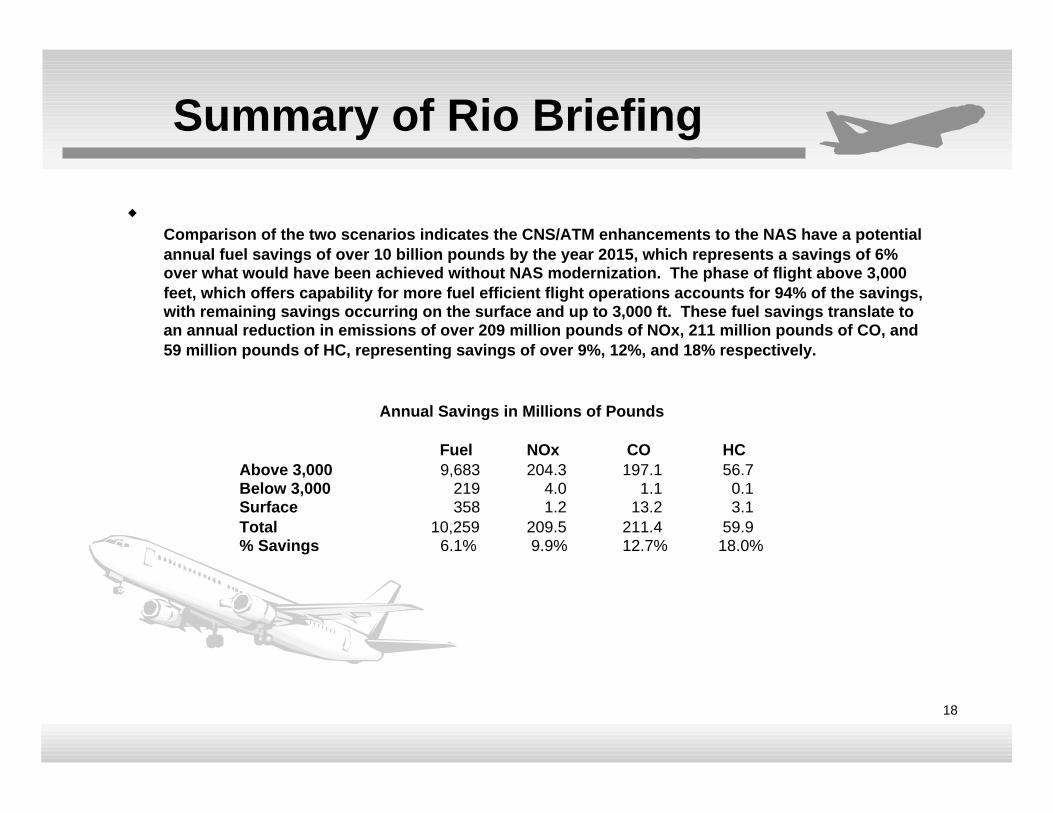
Summary of Rio Briefing
Comparison of the two scenarios indicates the CNS/ATM enhancements to the NAS have a potential annual fuel savings of over 10 billion pounds by the year 2015, which represents a savings of 6% over what would have been achieved without NAS modernization. The phase of flight above 3,000 feet, which offers capability for more fuel efficient flight operations accounts for 94% of the savings, with remaining savings occurring on the surface and up to 3,000 ft. These fuel savings translate to an annual reduction in emissions of over 209 million pounds of NOx, 211 million pounds of CO, and 59 million pounds of HC, representing savings of over 9%, 12%, and 18% respectively.
Annual Savings in Millions of Pounds
Fuel NOx CO HCAbove 3,000 9,683 204.3 197.1 56.7Below 3,000 219 4.0 1.1 0.1Surface 358 1.2 13.2 3.1Total 10,259 209.5 211.4 59.9% Savings 6.1% 9.9% 12.7% 18.0%
19
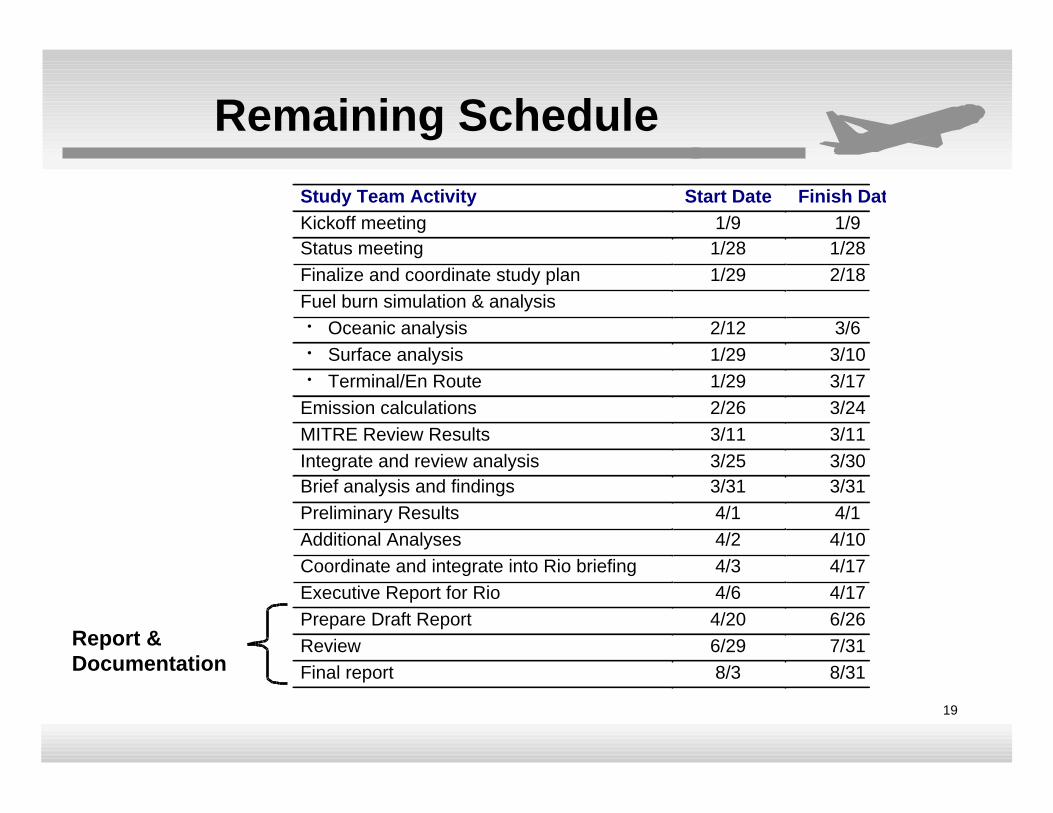
Remaining Schedule
Study Team Activity Start Date Finish Date
Kickoff meeting 1/9 1/9Status meeting 1/28 1/28
Finalize and coordinate study plan 1/29 2/18
Fuel burn simulation & analysis• Oceanic analysis 2/12 3/6• Surface analysis 1/29 3/10• Terminal/En Route 1/29 3/17
Emission calculations 2/26 3/24
MITRE Review Results 3/11 3/11
Integrate and review analysis 3/25 3/30Brief analysis and findings 3/31 3/31
Preliminary Results 4/1 4/1
Additional Analyses 4/2 4/10
Coordinate and integrate into Rio briefing 4/3 4/17
Executive Report for Rio 4/6 4/17
Prepare Draft Report 4/20 6/26
Review 6/29 7/31
Final report 8/3 8/31
Report & Documentation
20
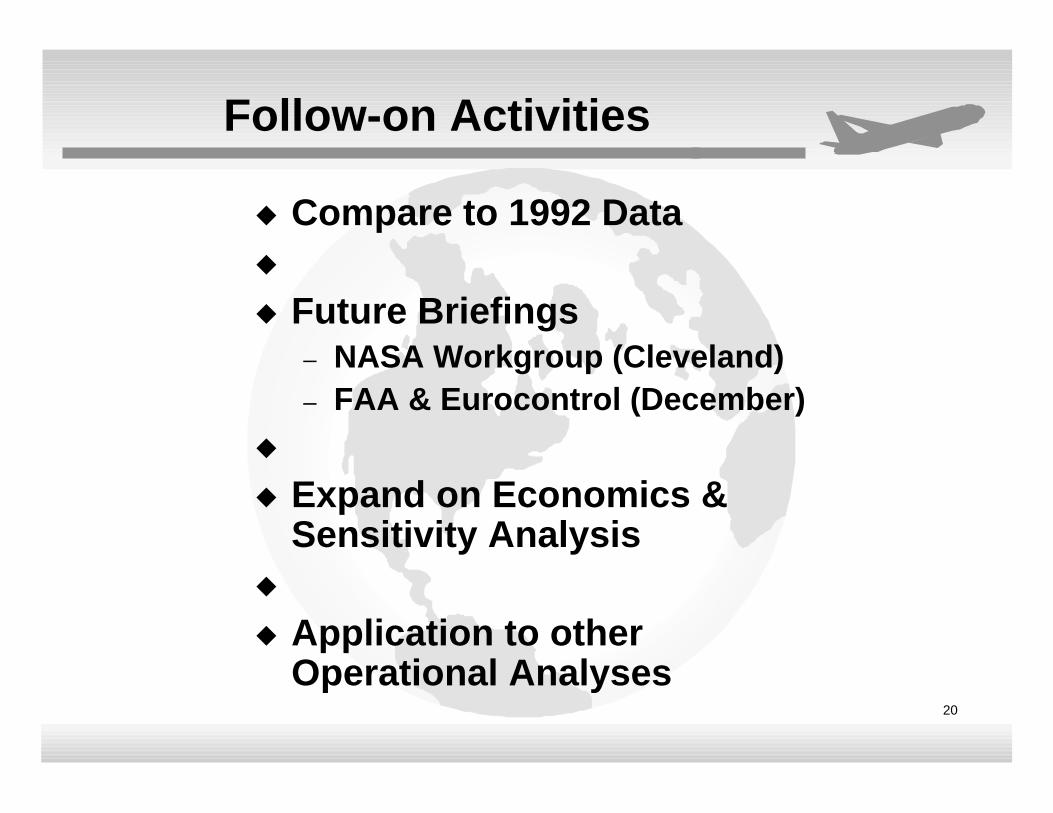
Follow-on Activities
Compare to 1992 Data
Future Briefings– NASA Workgroup (Cleveland)– FAA & Eurocontrol (December)
Expand on Economics & Sensitivity Analysis
Application to other Operational Analyses