Embed Size (px)
Citation preview

Ce
BC
a
ARRAA
KLMNXIO
1
l[tdcos[wgao
0d
Applied Catalysis B: Environmental 110 (2011) 195– 206
Contents lists available at SciVerse ScienceDirect
Applied Catalysis B: Environmental
jo ur n al homepage: www.elsev ier .com/ locate /apcatb
o-doping a metal (Cr, Fe, Co, Ni, Cu, Zn, Ce, and Zr) on Mn/TiO2 catalyst and itsffect on the selective reduction of NO with NH3 at low-temperatures
oningari Thirupathi, Panagiotis G. Smirniotis ∗
hemical Engineering Program, School of Energy, Environmental, Biological and Medicinal Engineering, University of Cincinnati, Cincinnati, OH 45221-0012, USA
r t i c l e i n f o
rticle history:eceived 14 June 2011eceived in revised form 21 August 2011ccepted 1 September 2011vailable online 8 September 2011
eywords:ow-temperature NH3-SCRanganese oxide (MnOx)OPS
n situ FTIRptimization for NO reduction
a b s t r a c t
A series of Mn–M′/TiO2 (M′ = Cr, Fe, Co, Ni, Cu, Zn, Ce, and Zr) catalysts were prepared using incipientwetness technique and investigated for the low-temperature selective catalytic reduction (SCR) of NOwith ammonia in the presence of excess oxygen. A combination of various physico-chemical techniqueswas used to investigate the influence of co-doped metals on the characteristics of Mn/TiO2 catalyst.The catalytic performance of these materials was compared with respect to the M′/Mn atomic ratio inorder to examine the correlation between physicochemical characteristics and reactivity of optimizedmaterials. XRD results suggest that metal oxide species exist in a highly dispersed state at a certainlevel called two-dimensional monolayer coverage. Our XPS results illustrated that the MnO2 phase isextremely dominant over the Mn2O3 phase (Mn4+/Mn3+ = 22.31, 96%) in the Mn–Ni(0.4)/TiO2 anatasecatalyst, whereas Mn2O3 phase is in competition with MnO2 in other catalysts (Mn4+/Mn3+ = 1.34–12.67).H2-TPR data results are in good accordance with XPS results that the absence of the high-temperature(736 K) peak indicates that the dominant phase is MnO2 in Mn–Ni(0.4)/TiO2 catalyst. This increase inreducibility of manganese and dominant MnO2 phase seems to be the reason for the superior activityand time on stream patterns of our best catalyst. BET and pore volume measurements revealed highsurface area and pore volume of the Mn–Ni/TiO2 catalyst. The in situ NH3-FTIR results suggest that the
manganese (Mn/TiO2) and manganese–nickel (Mn–Ni/TiO2) surface sites have only Lewis acidity, withno apparent Brönsted acidity. The catalytic performance of various Mn–M′/TiO2 (M′/Mn = 0, 0.2, 0.4, 0.6,0.8) catalysts was studied for the low-temperature SCR reaction at a range of temperatures (160–240 ◦C)under industrial conditions using GHSV = 50,000 h−1. The intrinsic activity of Mn–Ni/TiO2 catalyst withM′/Mn = 0.4 atomic ratio measured under differential reaction conditions, was found to be highly active,selective and broadening the temperature window for this reaction.. Introduction
Usually, transition metal oxides show good SCR activity in theow temperature range, such as V2O5/TiO2–SiO2–MoO3 [1], Cr/TiO22], Mn/TiO2 [3], FexTiOy [4], Co/TiO2, Ni/TiO2 [5], Cu/TiO2 [6]. Par-icularly, manganese-based catalysts have attracted much interestue to their unique redox properties which make them signifi-ant for a variety of applications. Thus, in recent years, manganesexides have been proposed as catalysts for several applicationsuch as the CO oxidation [7], selective reduction of nitrobenzene8], CH4 oxidation [9] and the selective catalytic reduction of NOith NH3 [3,5,10]. Among the low-temperature SCR catalysts, man-
anese oxide-based catalysts have been proven to be the mostctive catalysts [3,5,10,11]. However, the SCR activity, broadeningf temperature window and time on stream patterns of these cata-
∗ Corresponding author. Tel.: +1 513 556 1474; fax: +1 513 556 3473.E-mail address: [email protected] (P.G. Smirniotis).
926-3373/$ – see front matter. Published by Elsevier B.V.oi:10.1016/j.apcatb.2011.09.001
Published by Elsevier B.V.
lysts still need to be improved. Doping cations (metals) can enhanceNO conversion and N2 selectivity of the manganese oxide-basedcatalysts in low-temperature NH3-SCR [12].
In this paper, selected elements including Cr, Fe, Co, Ni, Cu, Zn,Zr, and Ce were co-doped into the Mn/TiO2 catalyst. For each ele-ment we varied the M′/Mn atomic ratio of the co-dopant (M′) usedin the range of 0–0.8 in order to optimize the content of co-dopantand to investigate the effect on SCR activity with respect to varioustemperatures (160–240 ◦C). Among all co-dopants used, Ni showedan impressive promoting effect for the Mn/TiO2 catalyst. Basedon these results, we further investigated the influence of M′ (co-dopant) addition on the M′–Mn/TiO2 catalyst structure, crystallinephase transformation, reduction profile, acidity and catalytic activ-ity using various physicochemical characterization techniques.
The specific surface manganese oxide phases and the high sur-
face concentration of manganese are decisive important for the SCRperformance of the metal oxide catalysts at low-temperatures [13].Thus, the existence of surface manganese phase and surface atomicconcentrations of each metal were investigated by the optimal
1 talysi
cvmfaprrSdcopt
2
2
cTaCswia1t7arrgPomaoMt
2
PldswpI
2
aM0faa0m
96 B. Thirupathi, P.G. Smirniotis / Applied Ca
ombination of Gaussian bands by the Mn 2p and Ni 2p decon-oluted XPS spectra. The reduction of NO takes place via a redoxechanism in which the rate determining step is oxygen removal
rom the metal oxide. Thus, the reducibility of metal oxide speciesppears to be one of the most crucial parameters that affect catalyticerformance for the selective reduction of NO. The SCR activity cor-elates with the onset of reduction in temperature-programmededuction (TPR) experiments, indicating a correlation between theCR process and active surface oxygen. Hence, H2-TPR was con-ucted to evaluate the variation of redox properties during theo-doping process. The in situ FTIR of NH3 adsorption were carriedut to reveal the evolution of total acidity and specific acidic sitesresent over the surface of the catalyst, which are fundamental forhe SCR reaction.
. Experimental
.1. Catalysts preparation
A series of Mn–M′/TiO2 (M′ = Cr, Fe, Co, Ni, Cu, Zn, Ce, and Zr)atalysts were prepared by adopting a wet-impregnation method.iO2 anatase (Hombikat UV 100 from Sachtleben Chemie) was useds support material to prepare these catalysts. Nitrates (Mn, Cr, Fe,o, Ni, Cu, Zn, Ce), and oxy nitrates (Zr) were used as the precur-ors of manganese and co-metal oxides. The manganese loadingsere selected as 5 wt.% and the co-metal loadings were varied rang-
ng from 0 to 4 wt.% in each type. For this purpose, the requiredmounts of precursors were added to a 100 mL beaker containing.0 g of support in 50 mL deionized water. The excess water washen slowly evaporated on a water bath with continuous stirring at0 ◦C. For comparison purposes, TiO2 anatase (Hombikat) supportlone was mixed in deionized water, and then water was evapo-ated using a water bath with continuous heating and stirring. Theesulting materials were oven dried at 120 ◦C for 12 h, and wereround and sieved (80–120 mesh) to obtain homogeneous powder.rior to the reaction studies, the powder was calcined in a tubularven at 400 ◦C for 2 h under continuous air flow (150 mL min−1). Theetal components of the catalysts are denoted as atomic ratios. The
mount of manganese was kept constant (5 wt.%) and the amountf second metal varied. All the ratios of the catalysts in this study are′/Mn = 0, 0.2, 0.4, 0.6, 0.8. For example, Mn–Ni(0.4)/TiO2 indicates
hat the atomic ratio of nickel/manganese is 0.4.
.2. X-ray diffraction
X-ray powder diffraction patterns have been recorded on ahillips Xpert diffractometer using nickel-filtered Cu K� (wave-ength 0.154056 nm) radiation source and a scintillation counteretector. An aluminium holder was used to support the catalystamples. The intensity data were collected over a 2� range of 10–80◦
ith a step size of 0.025◦ and a step time of 0.25 s. Crystallinehases were identified by comparison with the reference data from
nternational Center for Diffraction Data (ICDD) files.
.3. BET surface area and pore volume measurements
The BET surface area measurements were made by N2dsorption/desorption at liquid nitrogen temperature (77 K) usingicromeretics Gemini surface area apparatus. Prior to the analysis,
.08–0.1 g of catalysts were evacuated under helium atmosphereor 2 h at 200 ◦C in the degassing port of the instrument. The
dsorption isotherms of nitrogen were collected at 77 K usingpproximately six values or relative pressure ranging from 0.05 to.99 and by taking 0.162 nm2 as the molecular area of the nitrogenolecule.s B: Environmental 110 (2011) 195– 206
2.4. Temperature programmed reduction (H2-TPR)
Hydrogen-TPR of various catalyst samples was performed usingan automated catalyst characterization system (MicromeriticsModel AutoChem 2910). Prior to the analysis approximately 50 mgof the catalysts were pre-treated at 200 ◦C for 2 h in ultra high purehelium (30 mL min−1) stream after preheating, samples were testedby increasing the temperature from 50 to 800 ◦C. The temperaturewas then kept constant at 800 ◦C until the signal of hydrogen con-sumption returned to the initial values. The TPR runs were carriedout with a linear heating rate (10 ◦C min−1) in a flow of 4% H2 inargon with a flow rate of 20 mL min−1. The hydrogen consumptionwas measured quantitatively by a thermal conductivity detector. Amixture of isopropanol and liquid nitrogen was used in the trapperto collect the formed water during the TPR experiment.
2.5. In situ FT-IR spectroscopy
FT-IR spectra were recorded using a Bio-Rad (FTS-40). The scanswere collected at a scan speed of 5 kHz, resolution of 2.0, and anaperture opening of 2.0 cm−1. Sixteen scans were averaged for eachnormalized spectrum. Circular self-supporting thin wafers (8 mmdiameter) consisting of 12 mg of material were used for the study.The wafers were placed in a high-temperature cell with CaF2 win-dows and purged in situ in the IR cell with prepurified grade helium(30 mL min−1, Wright Brothers) at 473 K for 2 h to remove anyadsorbed impurities. After that, the samples were cooled to 323 K,and a background spectrum was collected before any gas adsorp-tion. Afterward, NH3 (3.9 vol% in He) was introduced to the cellwith a flow of 30 mL min−1 for 1 h at 323 K to ensure completesaturation of the sample. Physisorbed ammonia was removed byflushing the wafer with helium for sufficient time (3 h) at 373 K.Subsequently, the FT-IR spectra were recorded by evacuation ofammonia at successive temperatures 323, 373, 423, 473, and 523 K.
2.6. X-ray photoelectron spectroscopy (XPS)
XPS was used to analyze the atomic surface concentration oneach catalyst. The spectra were recorded on a Pyris-VG thermo sci-entific X-ray photoelectron spectrometer using Al K� (1486.7 eV)as a radiation source at 300 W. The spectra were recorded in thefixed analyzer transmission mode with pass energies of 89.45 and35.75 eV for recording survey and high resolution spectra, respec-tively. The powdered catalysts were mounted onto the sampleholder and degassed overnight at room temperature at a pressureon the order of 10−7 Torr. Binding energies (BE) were measuredfor C 1s, O 1s, Ti 2p, Mn 2p, Cr 2p, Fe 2p, Co 2p, Ni 2p, Cu 2p, Zn2p, Zr 3d, and Ce 3d. A recorded Auger spectrum for Mn was veryweak. Sample charging effects were eliminated by correcting theobserved spectra with the C 1s binding energy (BE) value of 284.6 eV[14]. An estimated error of 0.1 eV can be considered for all the mea-surements. The Mn 2p peak was deconvoluted using the Gaussianfunction, and a nonlinear background was subtracted.
2.7. Catalytic experiments
The catalytic activity measurement for the reduction of NO byammonia (NH3-SCR) with excess oxygen was carried out at atmo-spheric pressure in a fixed bed continuous flow quartz reactor withi.d. 6 mm. 0.1 g amount of catalyst (80–120 mesh) was placed in thereactor in between two glass wool plugs. The typical reactant gascomposition was as follows: 400 ppm NO, 400 ppm NH3, 2 vol% O2
and He as balance. The premixed gases oxygen (4% in He, WrightBrothers), ammonia (3.99% in He, Wright Brothers), and nitric oxide(2.0% in He, Matheson) were used as received. The tubing of thereactor system was heat traced to prevent formation and deposi-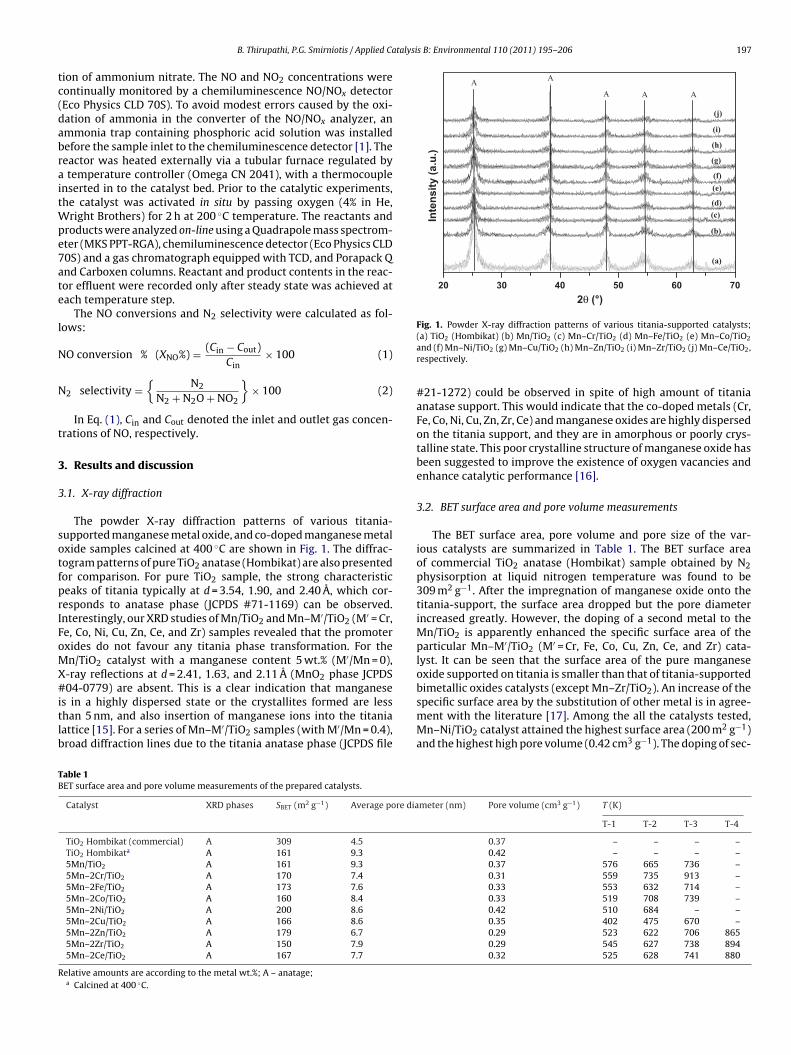
talysis B: Environmental 110 (2011) 195– 206 197
tc(dabraitWpe7ate
l
N
N
t
3
3
sotfprIFoMX#itlb
706050403020
Inte
nsity
(a.u
.)
2θ (°)
AAA
AA
(j)
(i)
(h)
(g)
(f)(e)
(d)(c)
(b)
(a)
Fig. 1. Powder X-ray diffraction patterns of various titania-supported catalysts;
TB
R
B. Thirupathi, P.G. Smirniotis / Applied Ca
ion of ammonium nitrate. The NO and NO2 concentrations wereontinually monitored by a chemiluminescence NO/NOx detectorEco Physics CLD 70S). To avoid modest errors caused by the oxi-ation of ammonia in the converter of the NO/NOx analyzer, anmmonia trap containing phosphoric acid solution was installedefore the sample inlet to the chemiluminescence detector [1]. Theeactor was heated externally via a tubular furnace regulated by
temperature controller (Omega CN 2041), with a thermocouplenserted in to the catalyst bed. Prior to the catalytic experiments,he catalyst was activated in situ by passing oxygen (4% in He,
right Brothers) for 2 h at 200 ◦C temperature. The reactants androducts were analyzed on-line using a Quadrapole mass spectrom-ter (MKS PPT-RGA), chemiluminescence detector (Eco Physics CLD0S) and a gas chromatograph equipped with TCD, and Porapack Qnd Carboxen columns. Reactant and product contents in the reac-or effluent were recorded only after steady state was achieved atach temperature step.
The NO conversions and N2 selectivity were calculated as fol-ows:
O conversion % (XNO%) = (Cin − Cout)Cin
× 100 (1)
2 selectivity ={
N2
N2 + N2O + NO2
}× 100 (2)
In Eq. (1), Cin and Cout denoted the inlet and outlet gas concen-rations of NO, respectively.
. Results and discussion
.1. X-ray diffraction
The powder X-ray diffraction patterns of various titania-upported manganese metal oxide, and co-doped manganese metalxide samples calcined at 400 ◦C are shown in Fig. 1. The diffrac-ogram patterns of pure TiO2 anatase (Hombikat) are also presentedor comparison. For pure TiO2 sample, the strong characteristiceaks of titania typically at d = 3.54, 1.90, and 2.40 A, which cor-esponds to anatase phase (JCPDS #71-1169) can be observed.nterestingly, our XRD studies of Mn/TiO2 and Mn–M′/TiO2 (M′ = Cr,e, Co, Ni, Cu, Zn, Ce, and Zr) samples revealed that the promoterxides do not favour any titania phase transformation. For then/TiO2 catalyst with a manganese content 5 wt.% (M′/Mn = 0),-ray reflections at d = 2.41, 1.63, and 2.11 A (MnO2 phase JCPDS04-0779) are absent. This is a clear indication that manganese
s in a highly dispersed state or the crystallites formed are lesshan 5 nm, and also insertion of manganese ions into the titaniaattice [15]. For a series of Mn–M′/TiO2 samples (with M′/Mn = 0.4),road diffraction lines due to the titania anatase phase (JCPDS file
able 1ET surface area and pore volume measurements of the prepared catalysts.
Catalyst XRD phases SBET (m2 g−1) Average pore dia
TiO2 Hombikat (commercial) A 309 4.5
TiO2 Hombikata A 161 9.3
5Mn/TiO2 A 161 9.3
5Mn–2Cr/TiO2 A 170 7.4
5Mn–2Fe/TiO2 A 173 7.6
5Mn–2Co/TiO2 A 160 8.4
5Mn–2Ni/TiO2 A 200 8.6
5Mn–2Cu/TiO2 A 166 8.6
5Mn–2Zn/TiO2 A 179 6.7
5Mn–2Zr/TiO2 A 150 7.9
5Mn–2Ce/TiO2 A 167 7.7
elative amounts are according to the metal wt.%; A – anatage;a Calcined at 400 ◦C.
(a) TiO2 (Hombikat) (b) Mn/TiO2 (c) Mn–Cr/TiO2 (d) Mn–Fe/TiO2 (e) Mn–Co/TiO2
and (f) Mn–Ni/TiO2 (g) Mn–Cu/TiO2 (h) Mn–Zn/TiO2 (i) Mn–Zr/TiO2 (j) Mn–Ce/TiO2,respectively.
#21-1272) could be observed in spite of high amount of titaniaanatase support. This would indicate that the co-doped metals (Cr,Fe, Co, Ni, Cu, Zn, Zr, Ce) and manganese oxides are highly dispersedon the titania support, and they are in amorphous or poorly crys-talline state. This poor crystalline structure of manganese oxide hasbeen suggested to improve the existence of oxygen vacancies andenhance catalytic performance [16].
3.2. BET surface area and pore volume measurements
The BET surface area, pore volume and pore size of the var-ious catalysts are summarized in Table 1. The BET surface areaof commercial TiO2 anatase (Hombikat) sample obtained by N2physisorption at liquid nitrogen temperature was found to be309 m2 g−1. After the impregnation of manganese oxide onto thetitania-support, the surface area dropped but the pore diameterincreased greatly. However, the doping of a second metal to theMn/TiO2 is apparently enhanced the specific surface area of theparticular Mn–M′/TiO2 (M′ = Cr, Fe, Co, Cu, Zn, Ce, and Zr) cata-lyst. It can be seen that the surface area of the pure manganeseoxide supported on titania is smaller than that of titania-supportedbimetallic oxides catalysts (except Mn–Zr/TiO2). An increase of the
specific surface area by the substitution of other metal is in agree-ment with the literature [17]. Among the all the catalysts tested,Mn–Ni/TiO2 catalyst attained the highest surface area (200 m2 g−1)and the highest high pore volume (0.42 cm3 g−1). The doping of sec-meter (nm) Pore volume (cm3 g−1) T (K)
T-1 T-2 T-3 T-4
0.37 – – – –0.42 – – – –0.37 576 665 736 –0.31 559 735 913 –0.33 553 632 714 –0.33 519 708 739 –0.42 510 684 – –0.35 402 475 670 –0.29 523 622 706 8650.29 545 627 738 8940.32 525 628 741 880

198 B. Thirupathi, P.G. Smirniotis / Applied Catalysi
400 600 800 100 0
(i)
(h)
(g)
(f)
(e)
(d)
(c)
(b)
(a)In
tens
ity (a
.u.)
Temperature(K)
Fig. 2. (a) H2-TPR patterns of (a) MnOx/TiO2 (b) Mn–Cr/TiO2, (c) Mn–Fe/TiO2, (d)Mat
obmiuan
3
(pwbTarpad(
ovotmTatrgtgpt
n–Co/TiO2, (e) Mn–Ni/TiO2, (f) Mn–Cu/TiO2, (g) Mn–Zn/TiO2, (h) Mn–Zr/TiO2,nd (i) Mn–Ce/TiO2; comparatively high shift of reduction peaks towards low-emperatures in MnOx–Ni/TiO2 catalysts.
nd metal can change the surface structure of the catalyst. It coulde concluded that in the catalysts with the addition of a secondetal, a lot of micropores could be conserved and the surface area
s larger than that of the Mn/TiO2. Among all the co-doped metalssed, the specific surface area and pore volume of the Mn/TiO2 cat-lyst are improved very much by doping the Mn/TiO2 catalyst withickel oxide.
.3. Temperature programmed reduction (H2-TPR)
For an adequate determination of effect of the second metalM′) on the reduction profile of the Mn/TiO2 catalyst, temperaturerogrammed reduction (H2-TPR) experiments were carried out inhich the amount of manganese was kept constant (5 wt.%) and
y regulating the second metal of the catalyst. The correspondingPR profiles are presented in Fig. 2. Three different reduction peaksre observed for the pure Mn/TiO2 catalyst. The low-temperatureeduction peaks at 576 K (T1), 665 K (T2), and 736 K (T3) can be inter-reted as a stepwise reduction of MnO2 to Mn2O3, Mn2O3 to Mn3O4nd Mn3O4 to MnO, respectively (Table 1). The Mn/TiO2 catalystoes not contribute much to the partial reduction of titania supportTi4+ to Ti4O7).
The reduction temperatures of all the titania-supported mixedxides are significantly decreased when compared to the pure indi-idual promoter oxides. The reduction profiles of bulk CrO3 consistf reduction peaks at 553, 735, and 858 K. The hydrogen reduc-ion of Cr6+ to Cr5+ Cr5+ to Cr3+ and Cr3+ to either Cr2+ or to the
etallic state occurs at about 553, 735, 858 K, respectively [18].he reduction profile peaks of our Mn–Cr/TiO2 catalyst appearedt 559, 735, and 913. The peak at 559 K could be due to the reduc-ion of both chromium and manganese species and later are for theeduction of Cr5+ to Cr3+ and Cr3+ to either Cr2+ or to Cr0. It is sug-ested that Cr reduction is dominant over the manganese species in
he Mn–Cr/TiO2 catalyst, which may be due to the coverage of man-anese species by the chromium ions. However, H2-consumptioneaks of manganese species are shifted to lower temperatures byhe addition of Cr2O3 to Mn/TiO2 catalyst.s B: Environmental 110 (2011) 195– 206
A low temperature reduction peak (T1) is observed at 576 K inMn/TiO2 catalyst. After substitution of the iron (Fe2O3) species,this (manganese reduction) peak is shifted to 553 K. In our previ-ous study, we have concluded that the reduction of iron species inFe2O3/TiO2 shows a reduction peak at 660 K [19], this (iron reduc-tion) peak is shifted to 632 K in Mn–Fe/TiO2 catalyst. On the otherhand, Mn–Co/TiO2 catalyst shows three distinct peaks at 519, 708,and 739 K. The low temperature peak at 519 K is corresponding tothe reduction of manganese species. The later peaks at 708, 739 Kare attributed to the Co3+ to Co2+ and Co2+ to Co0 transitions, respec-tively [20,21].
Subsequently, the addition of NiO to the Mn/TiO2 showed twodistinct peaks at 510 and 684 K. The low temperature reduc-tion peak (T1) of manganese species is significantly shifted from576 K to 510 K. Among all the catalysts (except copper promoted),Mn–Ni/TiO2 showed the highest shift of the manganese reduc-tion temperature and could be an indication of positive interactionbetween the titania support and the manganese–nickel oxidespecies [22,23]. This interaction may be an enhancement of the oxy-gen mobility. It means the oxygen mobility was greatly enhanceddue to the introduction of nickel oxide, which was beneficial to theSCR reaction. The hydrogen consumption peak at 684 K is attributedto the transition of Ni2+ to Ni0 [19].
The comparison with the H2-consumption curves obtained overthe corresponding single-oxide and in the mixed-oxide catalystshows that manganese oxides contained in the Mn–Ni/TiO2 sam-ple are reduced at much lower temperatures in the presence ofnickel oxide. The absence of the high-temperature (736 K) peakindicates that the dominant phase is MnO2. Thus, mixing man-ganese and nickel oxides results in stabilization of the former oxidein the form of MnO2, which is reduced at lower temperatures, com-pared to Mn2O3 [16]. This increase of reducibility and dominantphase of MnO2 seems to be the reason for the increased activity ofMn–Ni/TiO2 catalysts, compared to the corresponding single oxideand other mixed oxide catalysts.
The reduction profile of Cu/TiO2 is characterized by two reduc-tion peaks at 450 and 485 K [24]. In the present study, threedifferent peaks are observed in the TPR profile of the Mn–Cu/TiO2catalyst at 402, 475, and 670 K. The broad reduction peak centeredat 402 K can be attributed to the reduction of CuO particles beingin strong interaction with the titania support. The sharp reductionpeak centered at 475 K can be ascribed mainly to the reduction ofCuO particles having little or no interaction with the support. Thisassignment appears to be in agreement with literature data [24].A broad peak at 670 K can be due to the reduction of manganesespecies. The reduction of ZnO particles is difficult under TPR envi-ronment has been demonstrated earlier [25]. The reduction profileof Mn–Zn/TiO2 exhibited very slight H2 consumption at 865 K andcan be ascribed to an insignificant reduction of surface zinc oxide.This occurrence and catalytic activity of Mn–Zn/TiO2, both suggestthat zinc oxide is not promoting the Mn/TiO2 catalyst.
Mn–Zr/TiO2 reduction profile shows three sharp peaks at 545,627, and 738 K, all of these peaks correspond to the reduction ofthe surface manganese oxide reduction. One broad peak was alsoobserved at 894 K. It is known that zirconium oxide has two dif-ferent surface hydroxyl groups (bridged and terminal). We ascribethe characteristic broad TPR peak at 894 K to the reductions of thesetwo hydroxyl groups [26]. Addition of zirconia does not create anyvariation in the reduction pattern of Mn/TiO2 catalyst. There areonly marginal changes in Tmax positions of manganese species inMn–Zr/TiO2 catalyst for the studied temperature range. The TPRpatterns of Mn–Ce/TiO2 catalyst showed four peaks at 525, 628,
741 and 880 K owing to the surface manganese oxide species reduc-tion. The peak at 628 K is probably associated also with reductionof the surface oxygen of ceria [27,28]. The peak at 880 K is likelydue to the formation of nonstoichiometric cerium oxides [29]. The
B. Thirupathi, P.G. Smirniotis / Applied Catalysis B: Environmental 110 (2011) 195– 206 199
Table 2Binding energy, surface atomic ratio of M′/Mn, Mn/Ti, and Mn4+/Mn3+ for Mn–M′/TiO2 catalysts determined from deconvoluted XPS spectra.
Catalyst B.E. (eV) M′ (Mn4+/Mn3+)a M′/Mna‘ Mn/Tia
Ti 2p3/2 Ti 2p1/2 O 1s Mn 2p3/2 Mn 2p1/2
5Mn/TiO2 458.6 464.3 529.9 642.1 653.6 – – 02.02 – 0.13641.3 653.0
5Mn–2Cr/TiO2 458.6 464.4 530.2 642.1 653.6 2p3/2 2p1/2 02.20 1.57 0.10641.3 653.0 578.7 587.7
5Mn–2Fe/TiO2 458.9 464.4 530.5 642.1 653.6 2p3/2 2p1/2 12.67 0.39 0.11641.3 653.0 711.9 725.0
5Mn–2Co/TiO2 458.5 464.2 529.9 642.1 653.6 2p3/2 2p1/2 03.43 0.75 0.09641.3 653.0 780.9 797.7
5Mn–2Ni/TiO2 459.1 464.6 530.3 642.1 653.6 2p3/2 2p1/2 22.31 0.43 0.13641.3 653.0 856.3 874.6
5Mn–2Cu/TiO2 458.6 464.1 530.0 642.1 653.6 2p3/2 2p1/2 07.91 0.83 0.05641.3 653.0 934.0 953.7
5Mn–1Zn/TiO2 458.7 464.2 530.2 642.1 653.6 2p3/2 2p1/2 02.55 0.79 0.06641.3 653.0 1021.8 1044.6
5Mn–3Zr/TiO2 458.8 464.3 530.2 642.1 653.6 3d3/2 3d5/2 01.34 0.61 0.10641.3 653.0 182.2 184.6
5Mn–2Ce/TiO2 458.6 464.3 530.1 642.1 653.6 3d3/2 3d5/2 03.05 0.34 0.11641.3 653.0 884.3 901.9
M
ttcsimaM(srga8M
3
Macfaoopr
asoiso3oTMt
Ma
′ – co-doped metal.a Relative amounts are according to the metal atomic ratio.
itania-supported manganese catalyst does not contribute mucho the reduction of Ti4+ to Ti4O7, but in the case of Mn–M′/TiO2atalysts, one peak appeared at around 1000 K. This peak corre-ponds to the partial reduction of titania support. This is a clearndication to suggest that the substitution of second metal is pro-
oting the catalyst for the partial reduction of TiO2 to Ti4O7. Anverage intensity peaks are observed at 865, 894 and 880 K for then–Zn/TiO2, Mn–Zr/TiO2 and Mn–Ce/TiO2 catalysts, respectively
Fig. 2, Table 2). Which are due to the partial reduction of titaniaupport (Ti4+ to Ti4O7). Due to the differentiation in the intensityatio, corresponding peaks are not evident when we put all theraphs together. This is the reason why the features above 800 Kre not evident in Fig. 2 spectra. One can observe a clear peak at80 K in the Mn–Ce/TiO2, at 865 K in Mn–Zn/TiO2 and at 894 K inn–Zr/TiO2 in their individual H2-TPR spectra.
.4. Adsorption of ammonia – FT-IR spectroscopy
The adsorption and desorption characteristics of NH3 over then/TiO2 and Mn–M′/TiO2 (M′ = Cr, Fe, Co, Cu, Zn, Ce, and Zr) cat-
lysts have been extensively investigated to ensure the effect ofo-doping metal. A number of in situ-FTIR experiments were per-ormed to gain a better understanding of molecular behaviour ofmmonia and to acquire the information about surface speciesf the low-temperature SCR catalysts. The adsorption–desorptionf ammonia provided information about the nature of acid sitesresent, and its presence as a function of temperature (323–523 K)evealed the potential strength of the acid sites.
In line with results reported previously, the spectra of ammoniadsorbed on TiO2 anatase after evacuation at various temperatureshows only bands assigned to ammonia coordinatively adsorbedn Lewis sites [30,31]. In the higher frequency region, multiplic-ty of the bands makes it difficult to identify the particular acidicites [31]. The bands in the NH stretching region (via a Fermi res-nance interaction) split in part, and give rise to bands at 3142,190, 3230, 3259, 3294, 3352, and 3387 cm−1 (not shown). Whennly Mn is added to the support, an important phenomenon occurs.he 1167, 1301, 1467, 1599, and 1680 cm−1 peaks are observed forn/TiO2, all these peaks are corresponding to ammonia coordina-
ively adsorbed on Lewis sites.The in situ-FTIR spectra of ammonia adsorbed over the
n–Cr/TiO2 catalyst followed by evacuation at successive temper-tures are presented in Fig. 3a. Evidently, in addition to the bands
near 1601 and 1171 cm−1 (ıas NH3, ıs NH3 bound to Lewis acidsites, respectively) a broad absorption band at 1438 cm−1 due toıas NH4
+ vibrations with a shoulder near 1480 cm−1 and anotherband at 1678 cm−1 ascribed to ıs NH4
+ are also detected. Interest-ingly, evacuation at above 423 K causes the disappearance of theseıas NH4
+, ıs NH4+ absorptions.
The spectra recorded after adsorption of ammonia overthe Mn–Fe/TiO2 followed by outgassing at various tempera-tures (Fig. 3b) are characterized by a strong broad band at1128–1284 cm−1 with a maximum at 1164 cm−1 and an evidentshoulder component near 1223 cm−1. The 1128–1284 cm−1 band isattributed to ıs NH3 coordinated to Lewis acid sites [32]. In addition,two strong bands centered at 1552 and 1604 cm−1 observed areascribed to ıas NH3 coordinated to Lewis acid sites [33,34]. Finally,three weak peaks are found at 1304, 1360 and 1432 cm−1. The peakat 1304 cm−1 due to the ıs NH3 vibrations which are coordinatedto Lewis acid site, whereas later peaks are assigned to asymmetricand symmetric deformations of ammonium ion, respectively. Evac-uation at increasing temperatures originates a relevant sharpeningof the band. Although the catalytic reduction of NO results demon-strated that the Mn–Fe/TiO2 is improved than the Mn/TiO2 catalyst,the in situ NH3-FTIR spectra illustrated the Mn–Fe/TiO2 catalyst isa medium strength Lewis acid solid.
In situ contact of ammonia with Mn–Co/TiO2 catalyst at 323 Kand followed by degassing at different temperatures cause theformation of sharp and strong bands at 1158, 1212, 1544 and1596 cm−1 and also weak bands at 1290, 1344, 1426 cm−1 (Fig. 3c).Extremely strong peaks with a maximum at 1158, 1212 cm−1 areascribed to ıs NH3 bound to Lewis acid site. Strong bands at1544 cm−1 and 1596 cm−1 are intended for ıas NH3 bound to Lewisacid sites. Low intense bands at 1290, 1344, 1426 cm−1 are assignedto the ıas NH4
+ vibrations.The in situ-FTIR spectra of ammonia adsorbed over the
Mn–Ni/TiO2 catalyst followed by evacuation at successivelyincreasing temperatures are presented in Fig. 3d. We observed sim-ilar characteristic spectra as Mn/TiO2. In both cases the features ofcoordinative adsorbed species (1098, 1156 and 1228 cm−1, ıs NH3bound to Lewis acid sites) are observed. These results suggest thatthe manganese (Mn/TiO2) and manganese–nickel (Mn–Ni/TiO2)
surface sites are having Lewis acidity, with no apparent Brönstedacidity. Interestingly, an absorption peak at 1156 cm−1 (ıs NH3coordinated to Lewis acid sites) decrease down to disappear afterevacuation at 473–523 K range. Bands at 1540 and 1599 cm−1 are
200 B. Thirupathi, P.G. Smirniotis / Applied Catalysis B: Environmental 110 (2011) 195– 206
F 3 K ovw , (e) M
a1o
ctav1waadr[m(td
ftsitpTea1gTmt
a
ig. 3. In situ FT-IR spectra of coordinatively held ammonia species, adsorbed at 32hile evacuating; (a) Mn–Cr/TiO2 (b) Mn–Fe/TiO2, (c) Mn–Co/TiO2, (d) Mn–Ni/TiO2
ttributed to the �as NH3 coordinated to Lewis acid sites. Red shift in540 cm−1 band is observed, which could be due to the weakeningf Mn+–NH3 bond.
When ammonia was adsorbed at 323 K over the Mn–Cu/TiO2atalyst, different bands were observed while evacuation at theemperatures range 323–523 K (Fig. 3e). The four strong bandst 1164, 1304, 1556, and 1635 cm−1 are assigned to ammoniaibrations on Lewis-acid sites. The absorption peaks at 1304,398 cm−1 are being possibly associated to a species intermediateith respect to the formation of other species. Intensity of the peaks
t 1304 cm−1 and 1398 cm−1 was very low at low temperaturesnd increased after 373 K. These features suggest that ammonia isecomposed by heating before desorption, and indicate that theeaction of ammonia can occur over the surface of copper oxide34]. The band at 1635 cm−1 which is due to asymmetric defor-
ation of coordinated NH3 is blue shifted at high temperatures473–523 K) [34]. Evacuation at increasing temperatures causedhe intensity of the 1164 cm−1 peak to decrease and eventuallyisappear.
The in situ-FTIR spectra of the adsorbed ammonia over the sur-ace of Mn–Zn/TiO2 catalyst followed by evacuation with respecto the reaction temperatures are shown in Fig. 3f. An extremelytrong band at 1512 cm−1 is assigned to an amide species scissor-ng mode [35]. An additional strong band at 1364 cm−1 is assignedo ammonium ions [36]. Thus, ammonia is thought to undergo bothrotonation to ammonium ion and deprotonation to amide anion.his disproportionation progression is due to the direct protonxchange in ammonia. Intensity of the band at 1512 cm−1 increasedt high temperatures. On the other hand, Intensity of the bands at150, 1230, 1285, 1596 cm−1 decreased at high temperatures sug-esting that weak Lewis acidic sites are present in the Mn–Zn/TiO2.he splitting of the symmetric deformation mode at 1230 cm−1,
ost sensitive to the acidic strength of the surface sites, shows thatwo different adsorbing centers are active.The FTIR spectra of the adsorbed species arising from the inter-
ction of ammonia with the surface of Mn–Zr/TiO2 and evacuation
er the Mn–M′/TiO2 catalysts and successively increasing temperatures up to 523 K,n–Cu/TiO2, and (f) Mn–Zn/TiO2.
at various temperatures are very complex and reflect the complexchemistry of ammonia-catalyst (not shown). Ammonia adsorbedspecies on the titania-supported manganese–cerium oxide wereinvestigated by in situ-FTIR spectroscopy (not shown). Severalpeaks at 1123, 1156, 1209, 1334, 1460, 1517, and a weak peakat 1620 cm−1 could be observed. The bands at 1123, 1156, 1209,and 1620 cm−1 peaks were attributed to coordinatively adsorbedNH3 on Lewis sites. While, the band at 1517 cm−1 was assigned toan amide species scissoring mode, formed by hydrogen abstrac-tion from coordinated ammonia [37,38]. The band at 1460 cm−1 isattributed to the ıas NH4
+ vibrations of ammonium ions bound toBrönsted acid sites [38]. However, these bands are disappeared athigh temperatures suggesting that with the addition of ceria, veryweak Brønsted acid sites are formed over the surface of Mn/TiO2catalyst.
3.5. X-ray photoelectron spectroscopy
For the reference manganese phase compounds, commercialsamples of MnO2, Mn3O4, and MnO (Sigma–Aldrich) were used.In addition MnO2 and Mn2O3 were prepared using aqueous solu-tions of manganese nitrates [39], Mn3O4 was prepared by the slowreduction of MnO2 at 473 K in H2 [40]. Titania anatase supportedmanganese and co-doped manganese catalysts were investigatedby X-ray photoelectron spectroscopy to identify the chemical com-positions (atomic concentrations) of the surface layer and to ensurethe oxidation states of manganese oxides, and co-doped metalinteracting with titania support on each catalyst (Table 2). For all theprepared samples, two main peaks due to Mn 2p3/2 and Mn 2p1/2were observed from 639 eV to 658 eV. It has been established in theliterature and found in our studies that the 2p3/2 binding energy ofmetallic Mn (Mn0) and MnO2 (Mn4+) was 639.0 eV and 642.1 eV,
respectively [5,41,42]. Hence, it is highly difficult to distinguish theoxidation states of manganese species without peak deconvolu-tion since there is only less than 1 eV binding energy differencebetween each manganese phase. To better understand the surface
B. Thirupathi, P.G. Smirniotis / Applied Catalysis B: Environmental 110 (2011) 195– 206 201
(e)
(b)
660655650645640635
(a)
Binding Energy (eV)
(d)
(c)
Inte
nsity
(a.u
.)
(i)
(j)MnO (642.1 eV)
660655650645640635
(f)
Binding Energy (eV)
(g)
(h)
Inte
nsity
(a.u
.)
F e/TiO2
(
mlscSvs
arra(M
ig. 4. Deconvoluted Mn 2p (XPS) spectra of (a) MnOx/TiO2 (b) Mn–Cr/TiO2, (c) Mn–Fi) Mn–Ce/TiO2, and (j) spent Mn–Ni/TiO2 catalysts.
anganese oxide phases and their relative intensities, the over-apped Mn 2p peaks were deconvoluted into several sub-bands byearching for the optimal combination of Gaussian bands with theorrelation coefficients (r2) above 0.99 (PeakFit, Version 4.0.6, AISNoftware Inc.) without fixing the sub-band positions. The decon-oluted peaks are signed as specific phases of manganese in eachpectrum (Fig. 4).
All binding energy data presented in Table 2 have been adjustedgainst the C ls peak standardized at 284.6 eV [43]. With Al K�adiation, the Mn 2p peaks for pure manganese phases were also
ecorded to evaluate the specific surface manganese oxide phasesnd correlated with our catalysts to find out Mn4+/Mn3+ ratioTable 2). Two main peaks of pure MnO2 (Mn4+) sample due ton 2p3/2 and Mn 2p1/2 were observed at 642.1–653.6 eV, respec-
, (d) Mn–Co/TiO2, (e) Mn–Ni/TiO2, (f) Mn–Cu/TiO2, (g) Mn–Zn/TiO2, (h) Mn–Zr/TiO2,
tively. In case of pure Mn2O3 (Mn3+) sample, Mn 2p3/2 and Mn 2p1/2were pragmatic at 641.3–653.0 eV, respectively. Consequently, the2p3/2 binding energies at 642.1 and 641.3 eV are attributed to thepresence of surface Mn4+ and Mn3+ species in the catalyst.
SCR of NO over the pure manganese oxides at low-temperature was investigated by Kapteijn et al. [13] andfound that the NO conversions decreased in the order ofMnO2 > Mn5O8 > Mn2O3 > Mn3O4. In a similar manner, in ourpresent work it is worth noting that the MnO2 phase is extremelydominant over the Mn2O3 phase in nickel-codoped titania-
supported manganese catalysts (Mn4+/Mn3+ = 22.31, 96%), whereasMn2O3 phase is in competition with MnO2 in other catalysts(Mn4+/Mn3+ = 1.34–12.67) (Fig. 4). These results are in good accor-dance with the H2-TPR measurements, whereas only two peaks
2 talysi
(soMao
m(aocgoacd(bMed
3c
cf(cmboowvN
paCtomtomU(agac(sdToporc
wS
02 B. Thirupathi, P.G. Smirniotis / Applied Ca
MnO2 → Mn2O3 and NiO → Ni) were observed for the Mn–Ni/TiO2ample. Comparing to other metals co-doped Mn oxides supportedn TiO2 catalysts; it is evident that the Mn/Ti atomic ratio ofn–Ni/TiO2 is significantly high in contrast to other optimized cat-
lysts. This is due to the higher surface coverage by manganesexide and/or its higher dispersion on the TiO2 support.
In addition, high surface concentrations (M′/Mn) of co-dopedetals such as, Cr3+ (Cr2O3), Cu2+ (CuO), Zn2+ (ZnO), Co3+, Co2+
Co3O4), and Zr4+ (ZrO2) are observed for the corresponding cat-lysts (Table 2). In the same manner, very low concentrationf surface manganese species (Mn/Ti) is observed for the sameatalysts. Accordingly, it can be suggested that the surface man-anese species are predominantly covered by the co-doping metalxide species in these Mn–M′/TiO2 (M′ = Cr, Cu, Zn, Co, Zr) cat-lysts. This is one of the reasons for the low activity of theseatalysts. On the other hand, rational low concentrations of co-oped metal are observed for the Mn–Ce/TiO2 (Ce2O3), Mn–Fe/TiO2Fe2O3), and Mn–Ni/TiO2 (NiO) catalysts. It can be suggested fromoth the suggested from the both M′/Mn, and Mn/Ti values, onlyn–Ni(0.4)/TiO2 catalyst exhibits a high concentration and cov-
rage of surface manganese and a low concentration of highlyispersed co-doped metal.
.6. Catalytic performance of Mn/TiO2 and co-doped MnOx/TiO2atalysts
In each experiment, five samples of (M′) co-doped MnOx/TiO2atalysts were used to study the effect of co-cations loading as aunction of M′/Mn atomic ratio with respect to the temperature160–240 ◦C) in the SCR of NO by ammonia. Each sample had aonstant loading of manganese and different loading of secondetal. Prior to the catalytic performance tests, a reaction with Hom-
ikat TiO2 catalyst (calcined at 400 ◦C) was performed at 250 ◦C tobserve the catalytic activity of the TiO2 support and the efficiencyf SCR unit. As expected, the NO and NH3 conversions were zerohen only TiO2 anatase (Hombikat) was used as catalyst at rele-
ant conditions (not shown in figure). Pure MnOx/TiO2 shows 70%O conversion at 200 ◦C.
Initially, we evaluated the potential catalytic performance of therepared Mn–Cr/TiO2 (Cr/Mn atomic ratio = 0, 0.2, 0.4, 0.6, 0.8) cat-lysts to optimize the Cr content and to ensure the influence ofrn+ co-cations on NO conversion with respect to the tempera-ure (160–240 ◦C). The catalytic performance results for the SCRf NO with ammonia over titania-supported manganese as well asanganese–chromium catalysts are tested at GHSV 50,000 h−1 in
he presence of 2 vol% of oxygen (Fig. 5a ). From our results we canbserve that, the substitution of partial Mn with chromium ele-ents could indeed influence the SCR activity of Mn/TiO2 catalyst.nder identical operating conditions, among all the Mn–Cr/TiO2
Cr/Mn = 0, 0.2, 0.4, 0.6, 0.8) catalysts tested the Mn–Cr/TiO2 cat-lysts with Cr/Mn atomic ratio = 0.2, 0.4 have demonstrated aood performance giving 88 and 90% conversions, respectivelyt 180 ◦C. However, at temperatures higher than that, the NOonversions decreased rapidly to the 23% (Mn–Cr(0.2)/TiO2), andMn–Cr(0.4)/TiO2). In comparison with Mn/TiO2, the NO conver-ions increased with the Cr/Mn ratio equal to 0.2, 0.4 and thenecreased for higher loadings of chromium (Cr/Mn = 0.6 and 0.8).his is due to the existence of the bulk amount of chromiumxide in the sample which can block the manganese active poresresent over the surface of catalyst. These results suggest that theptimal content of chromium is reached with the Cr/Mn atomicatio equal to 0.4 at optimal temperature 180 ◦C for maximum NO
onversion.Fig. 5b shows the NO conversion as a function of Fe contentith respect to the temperature range (160–240 ◦C) in the NH3-
CR reaction over Mn–Fe/TiO2 catalysts. From these results, we
s B: Environmental 110 (2011) 195– 206
can observe the influence of Fen+ co-cations on the SCR activity ofMn/TiO2 catalyst. Near at 200 ◦C the substitution of the Fe contentto Mn (Fe/Mn) equal to 0.4 could obviously enhance the NO conver-sions (87%), while the NO conversions drop off to a certain extentat higher temperatures. Pure Mn/TiO2 and Mn–Fe/TiO2 showedvery narrow operation temperature windows in the low tempera-ture ranges. Both of the maximum NO conversions could not reach100% but the NH3-SCR activity and stability of the Mn/TiO2 catalystimproved greatly by the addition of optimal iron content (Fe/Mnatomic ratio = 0.4) for high NO conversion.
NH3-SCR performances of various cobalt co-doped Mn/TiO2 cat-alysts were measured as a function of temperature and the Co/Mnratio based on atomic percentage (Fig. 5c). For the catalyst with0.2 Co/Mn atomic ratio, NO conversion (62%) starts at 160 ◦C andreaches 78% at 200 ◦C. The onset NO conversion of NH3-SCR reac-tion at 200 ◦C, decreases down to 57%, 53% for the catalysts havingCo/Mn ratio 0.6 and 0.8, respectively. For those catalysts with highercobalt content, NO conversions were dropped to 40% (Co/Mn = 0.6)and 37% (Co/Mn = 0.8) at about 240 ◦C. Thus, the ratio of Co/Mn playsan important role in promotion of Mn/TiO2 catalyst for the low-temperature NH3-SCR reaction. Among these Mn–Co(x)/TiO2 (x = 0,0.2, 0.4, 0.6, 0.8) catalysts, with Co/Mn ratio 0.2 and 0.4 showedgood low-temperature NH3-SCR activity. Eventually, the additionof cobalt improved the SCR performance of the Mn/TiO2 catalyst butcould not broaden the temperature window and could not reach to100% NO conversions.
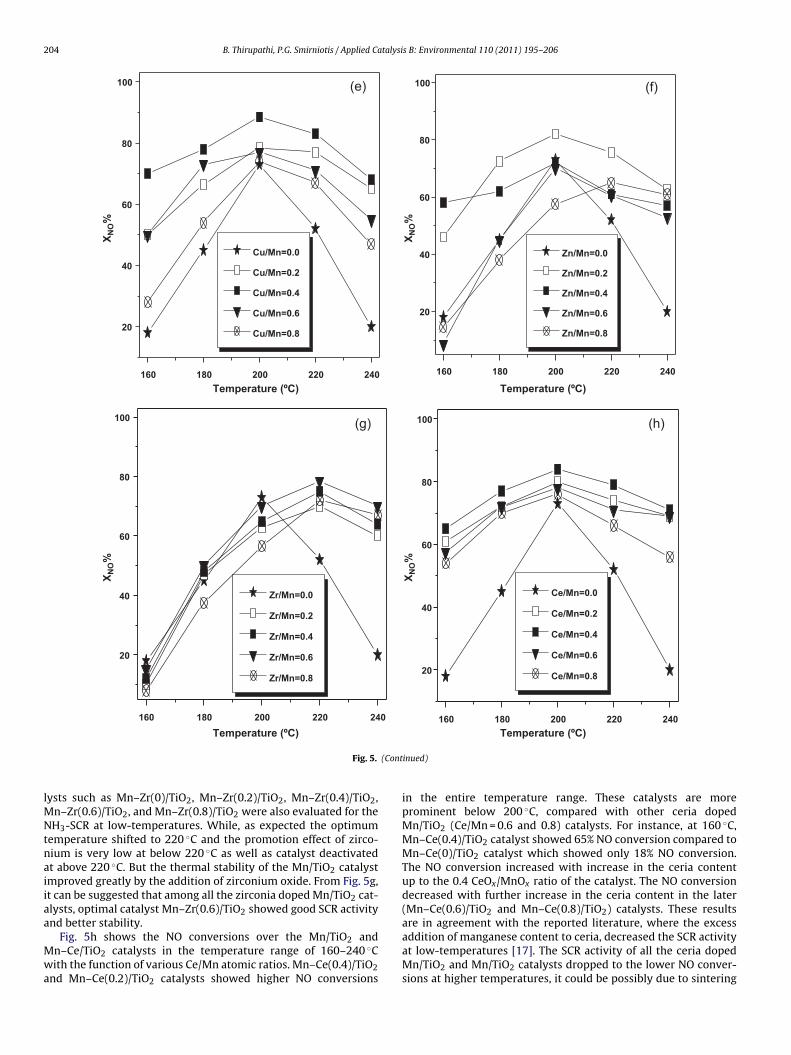
On the other hand, the nickel loading has a strong influence onthe conversion, since nickel loading with the Ni/Mn ratio = 0.4 cat-alyst exhibits a maximum conversion of 100% at 200 ◦C (Fig. 5d).This would indicate that an optimal dispersion of Mn–Ni specieson the support surface is attained with this amount of nickel in theMn–Ni/TiO2 catalyst to reach the high NO conversion. Moreover,from BET surface area analysis, it was determined that only nickelco-cations show the highest surface area and pore volume thus, inconsequence, enhanced SCR activity. The addition of nickel speciesto the Mn/TiO2 catalyst (Ni/Mn ratio = 0.4) broaden the temper-ature window and shows 100% NO conversion at the temperaturerange 200–250 ◦C. Doping of nickel co-cations greatly improved thethermal stability of the Mn/TiO2 catalyst, Mn–Ni(0.4)/TiO2 catalystshowed 76% NO conversion even at 300 ◦C (not shown). This resultwas expected since the H2-TPR curve for the 5Mn–2Ni/TiO2 cat-alyst showed the highest shift in reduction peaks towards lowertemperatures.
Further increase in the nickel content exceeding than 0.4 Ni/Mnatomic ratio, decreased the SCR activity of catalyst to 81% and 77%(for the ratio 0.6, 0.8 catalysts, respectively) at optimal tempera-ture 200 ◦C. This is due to the interaction between the TiO2 andmanganese–nickel oxide becomes weak and the number of par-ticipating surface manganese oxide sites decrease with the raise ofnickel loading. All the above results showed that nickel is effectivelypromoting the NH3-SCR activity at low-temperatures and broad-ening the temperature window (thermal stability) performance oftitania-supported manganese catalyst. Therefore, it has concludedthat the nickel oxide had interacted with manganese oxide and tita-nia as a result, preventing the sintering, and then higher catalyticactivity was obtained.
The co-doping of copper in titania-supported manganesecatalysts could enhance the SCR activity. To observe the influenceof copper co-cations and the effect of their atomic ratio withmanganese, various Mn–Cu/TiO2 catalysts with the function ofCu/Mn ratio = 0, 0.2, 0.4, 0.6, 0.8 are tested at the temperature range160–240 ◦C (Fig. 5e). The NH3-SCR activity of the Mn–Cu/TiO2
catalysts with 0.4 and 0.2 Cu/Mn ratios had an obvious increaseowing to the optimal high dispersion of copper–manganeseoxides on titania support, especially at optimal 200 ◦C. The SCRactivity and broadening of temperature window at the temper-
B. Thirupathi, P.G. Smirniotis / Applied Catalysis B: Environmental 110 (2011) 195– 206 203
160 180 200 220 240
20
40
60
80
100 (d)
Ni/Mn=0.0
Ni/Mn=0.2
Ni/Mn=0.4
Ni/Mn=0.6
Ni/Mn=0.8
160 180 200 220 240
20
40
60
80
100(a)
Cr/Mn=0.0
Cr/Mn=0.2
Cr/Mn=0.4
Cr/Mn=0.6
Cr/Mn=0.8
Temperature(ºC) Temperature(ºC)
Temperature(ºC) Temperature(ºC)
160 180 200 220 240
20
40
60
80
100(b)
Fe/Mn=0.0
Fe/Mn=0.2
Fe/Mn=0.4
Fe/Mn=0.6
Fe/Mn=0.8
160 180 200 220 240
20
40
60
80
100
(c)
X NO%
X NO%
X NO%
X NO%
Co/Mn=0.0
Co/Mn=0.2
Co/Mn=0.4
Co/Mn=0.6
Co/Mn=0.8
F tempN 140 m
aMC
rFvtacc
ig. 5. Influence of M′/Mn atomic ratio on NO conversion in the SCR reaction at aO = 400 ppm, NH3 = 400 ppm, O2 = 2 vol%, He carrier gas, catalyst = 0.1 g, total flow =
ture range 160–240 ◦C decreased in the following sequence:n–Cu(0.4)/TiO2 > Mn–Cu(0.2)/TiO2 ∼= Mn–Cu(0.6)/TiO2 > Mn–
u(0.8)/TiO2 � Mn–Cu(0)/TiO2.NO reduction by NH3 in the presence of excess oxygen was car-
ied out over zinc co-doped Mn/TiO2 catalysts at low-temperatures.ig. 5f shows the NO conversion as a function of temperature overarious Mn–Zn/TiO2 catalysts based on Zn/Mn atomic ratio during
he NH3-SCR reaction. Unlike the other promoters zinc cations haddifferent optimal ratio with manganese to achieve the high NOonversion in the SCR reaction. Among the all zinc doped Mn/TiO2atalysts, Mn–Zn/TiO2 catalyst with Zn/Mn = 0.2 showed improved
erature range (160–240 ◦C) over Mn–M′/TiO2 catalysts; GHSV = 50,000 h−1; feed:L min−1. XNO% = conversion of NO at 6 h on stream.
activity. By increasing the loading of zinc oxide (Zn/Mn = 0.4, 0.6,0.8) over the surface of titania, SCR activity dropped to lower thanMn/TiO2 catalyst. Since that the amount of surface zinc oxide islow and manganese oxide sites are active for the initial case, thesethe manganese oxide pores may be blocked by increasing of theamount of zinc oxide over the titania support in the later catalysts.These results are in agreement with literature, where the addition
of too much (a saturation point of 1.5 wt.%) zinc leads to a decreasein SCR activity of the catalyst [44,45].In order to compare the influence of co-cations and activitiesof titania supported various bimetallic oxides, different cata-
204 B. Thirupathi, P.G. Smirniotis / Applied Catalysis B: Environmental 110 (2011) 195– 206
160 180 200 220 240
20
40
60
80
100
Zn/Mn=0.0
Zn/Mn=0.2
Zn/Mn=0.4
Zn/Mn=0.6
Zn/Mn=0.8
(f)
160 180 200 220 240
20
40
60
80
100 (g)
Zr/Mn=0.0
Zr/Mn=0.2
Zr/Mn=0.4
Zr/Mn=0.6
Zr/Mn=0.8
Temperature (ºC) Temperature (ºC)
Temperature (ºC) Temperature (ºC)160 180 200 220 240
20
40
60
80
100 (e)
Cu/Mn=0.0
Cu/Mn=0.2
Cu/Mn=0.4
Cu/Mn=0.6
Cu/Mn=0.8
160 180 200 220 240
20
40
60
80
100 (h)
Ce/Mn=0.0
Ce/Mn=0.2
Ce/Mn=0.4
Ce/Mn=0.6
Ce/Mn=0.8
X NO
%
X NO
%
X NO
%
X NO
%
(Cont
lMNtnaiiaa
Mwa
Fig. 5.
ysts such as Mn–Zr(0)/TiO2, Mn–Zr(0.2)/TiO2, Mn–Zr(0.4)/TiO2,n–Zr(0.6)/TiO2, and Mn–Zr(0.8)/TiO2 were also evaluated for theH3-SCR at low-temperatures. While, as expected the optimum
emperature shifted to 220 ◦C and the promotion effect of zirco-ium is very low at below 220 ◦C as well as catalyst deactivatedt above 220 ◦C. But the thermal stability of the Mn/TiO2 catalystmproved greatly by the addition of zirconium oxide. From Fig. 5g,t can be suggested that among all the zirconia doped Mn/TiO2 cat-lysts, optimal catalyst Mn–Zr(0.6)/TiO2 showed good SCR activitynd better stability.
Fig. 5h shows the NO conversions over the Mn/TiO2 andn–Ce/TiO2 catalysts in the temperature range of 160–240 ◦Cith the function of various Ce/Mn atomic ratios. Mn–Ce(0.4)/TiO2
nd Mn–Ce(0.2)/TiO2 catalysts showed higher NO conversions
inued)
in the entire temperature range. These catalysts are moreprominent below 200 ◦C, compared with other ceria dopedMn/TiO2 (Ce/Mn = 0.6 and 0.8) catalysts. For instance, at 160 ◦C,Mn–Ce(0.4)/TiO2 catalyst showed 65% NO conversion compared toMn–Ce(0)/TiO2 catalyst which showed only 18% NO conversion.The NO conversion increased with increase in the ceria contentup to the 0.4 CeOx/MnOx ratio of the catalyst. The NO conversiondecreased with further increase in the ceria content in the later(Mn–Ce(0.6)/TiO2 and Mn–Ce(0.8)/TiO2) catalysts. These resultsare in agreement with the reported literature, where the excess
addition of manganese content to ceria, decreased the SCR activityat low-temperatures [17]. The SCR activity of all the ceria dopedMn/TiO2 and Mn/TiO2 catalysts dropped to the lower NO conver-sions at higher temperatures, it could be possibly due to sintering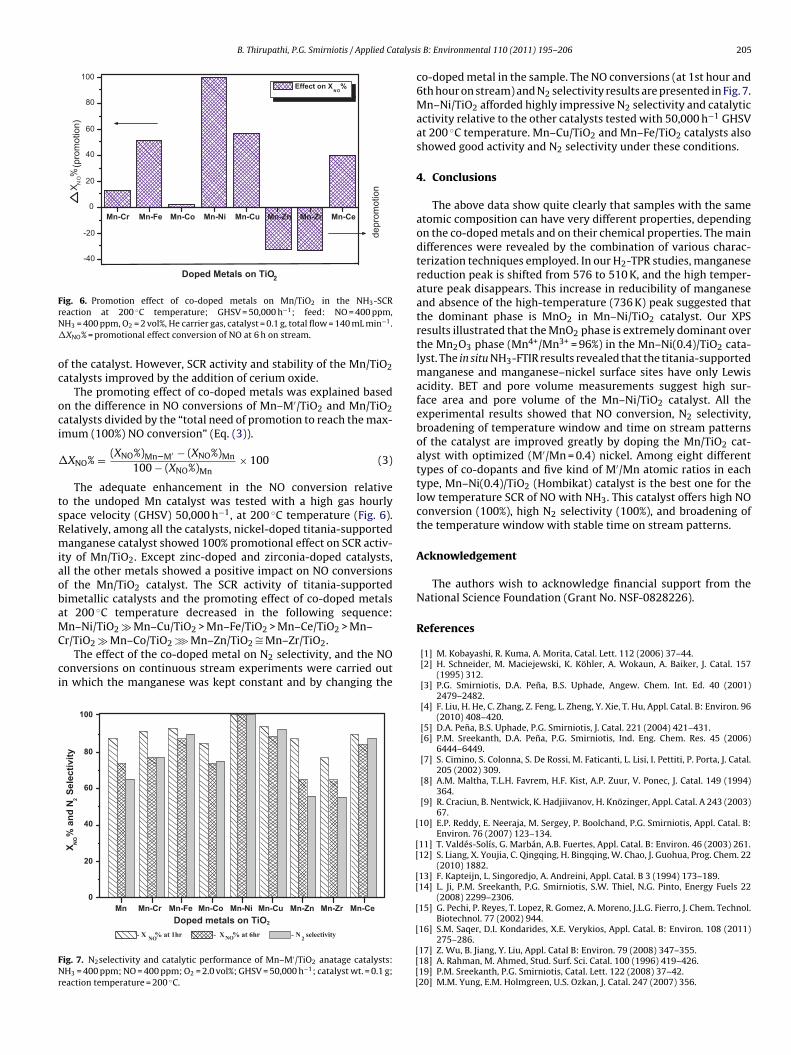
B. Thirupathi, P.G. Smirniotis / Applied Catalysi
Mn-CeMn-ZrMn-ZnMn-CuMn-NiMn-CoMn-FeMn-Cr
-40
-20
0
20
40
60
80
100(promotion)
depromotionX
%
Doped Metals on TiO2
Effect on X %
Fig. 6. Promotion effect of co-doped metals on Mn/TiO2 in the NH3-SCRrN�
oc
oci
�
tsRmiaobaMC
ci
FNr
eaction at 200 ◦C temperature; GHSV = 50,000 h−1; feed: NO = 400 ppm,H3 = 400 ppm, O2 = 2 vol%, He carrier gas, catalyst = 0.1 g, total flow = 140 mL min−1.XNO% = promotional effect conversion of NO at 6 h on stream.
f the catalyst. However, SCR activity and stability of the Mn/TiO2atalysts improved by the addition of cerium oxide.
The promoting effect of co-doped metals was explained basedn the difference in NO conversions of Mn–M′/TiO2 and Mn/TiO2atalysts divided by the “total need of promotion to reach the max-mum (100%) NO conversion” (Eq. (3)).
XNO% = (XNO%)Mn–M′ − (XNO%)Mn
100 − (XNO%)Mn× 100 (3)
The adequate enhancement in the NO conversion relativeo the undoped Mn catalyst was tested with a high gas hourlypace velocity (GHSV) 50,000 h−1, at 200 ◦C temperature (Fig. 6).elatively, among all the catalysts, nickel-doped titania-supportedanganese catalyst showed 100% promotional effect on SCR activ-
ty of Mn/TiO2. Except zinc-doped and zirconia-doped catalysts,ll the other metals showed a positive impact on NO conversionsf the Mn/TiO2 catalyst. The SCR activity of titania-supportedimetallic catalysts and the promoting effect of co-doped metalst 200 ◦C temperature decreased in the following sequence:n–Ni/TiO2 � Mn–Cu/TiO2 > Mn–Fe/TiO2 > Mn–Ce/TiO2 > Mn–
r/TiO2 � Mn–Co/TiO2 ≫ Mn–Zn/TiO2 ∼= Mn–Zr/TiO2.The effect of the co-doped metal on N2 selectivity, and the NO
onversions on continuous stream experiments were carried outn which the manganese was kept constant and by changing the
Mn-CeMn-ZrMn-ZnMn-CuMn-NiMn-CoMn-FeMn-CrMn0
20
40
60
80
100
- X NO % at 1hr - XNO% at 6hr - N 2 selectivity
X NO%
and
N2 S
elec
tivity
Doped metals on TiO2
ig. 7. N2selectivity and catalytic performance of Mn–M′/TiO2 anatage catalysts:H3 = 400 ppm; NO = 400 ppm; O2 = 2.0 vol%; GHSV = 50,000 h−1; catalyst wt. = 0.1 g;
eaction temperature = 200 ◦C.
[
[[
[[
[
[
[[[[
s B: Environmental 110 (2011) 195– 206 205
co-doped metal in the sample. The NO conversions (at 1st hour and6th hour on stream) and N2 selectivity results are presented in Fig. 7.Mn–Ni/TiO2 afforded highly impressive N2 selectivity and catalyticactivity relative to the other catalysts tested with 50,000 h−1 GHSVat 200 ◦C temperature. Mn–Cu/TiO2 and Mn–Fe/TiO2 catalysts alsoshowed good activity and N2 selectivity under these conditions.
4. Conclusions
The above data show quite clearly that samples with the sameatomic composition can have very different properties, dependingon the co-doped metals and on their chemical properties. The maindifferences were revealed by the combination of various charac-terization techniques employed. In our H2-TPR studies, manganesereduction peak is shifted from 576 to 510 K, and the high temper-ature peak disappears. This increase in reducibility of manganeseand absence of the high-temperature (736 K) peak suggested thatthe dominant phase is MnO2 in Mn–Ni/TiO2 catalyst. Our XPSresults illustrated that the MnO2 phase is extremely dominant overthe Mn2O3 phase (Mn4+/Mn3+ = 96%) in the Mn–Ni(0.4)/TiO2 cata-lyst. The in situ NH3-FTIR results revealed that the titania-supportedmanganese and manganese–nickel surface sites have only Lewisacidity. BET and pore volume measurements suggest high sur-face area and pore volume of the Mn–Ni/TiO2 catalyst. All theexperimental results showed that NO conversion, N2 selectivity,broadening of temperature window and time on stream patternsof the catalyst are improved greatly by doping the Mn/TiO2 cat-alyst with optimized (M′/Mn = 0.4) nickel. Among eight differenttypes of co-dopants and five kind of M′/Mn atomic ratios in eachtype, Mn–Ni(0.4)/TiO2 (Hombikat) catalyst is the best one for thelow temperature SCR of NO with NH3. This catalyst offers high NOconversion (100%), high N2 selectivity (100%), and broadening ofthe temperature window with stable time on stream patterns.
Acknowledgement
The authors wish to acknowledge financial support from theNational Science Foundation (Grant No. NSF-0828226).
References
[1] M. Kobayashi, R. Kuma, A. Morita, Catal. Lett. 112 (2006) 37–44.[2] H. Schneider, M. Maciejewski, K. Köhler, A. Wokaun, A. Baiker, J. Catal. 157
(1995) 312.[3] P.G. Smirniotis, D.A. Pena, B.S. Uphade, Angew. Chem. Int. Ed. 40 (2001)
2479–2482.[4] F. Liu, H. He, C. Zhang, Z. Feng, L. Zheng, Y. Xie, T. Hu, Appl. Catal. B: Environ. 96
(2010) 408–420.[5] D.A. Pena, B.S. Uphade, P.G. Smirniotis, J. Catal. 221 (2004) 421–431.[6] P.M. Sreekanth, D.A. Pena, P.G. Smirniotis, Ind. Eng. Chem. Res. 45 (2006)
6444–6449.[7] S. Cimino, S. Colonna, S. De Rossi, M. Faticanti, L. Lisi, I. Pettiti, P. Porta, J. Catal.
205 (2002) 309.[8] A.M. Maltha, T.L.H. Favrem, H.F. Kist, A.P. Zuur, V. Ponec, J. Catal. 149 (1994)
364.[9] R. Craciun, B. Nentwick, K. Hadjiivanov, H. Knözinger, Appl. Catal. A 243 (2003)
67.10] E.P. Reddy, E. Neeraja, M. Sergey, P. Boolchand, P.G. Smirniotis, Appl. Catal. B:
Environ. 76 (2007) 123–134.11] T. Valdés-Solís, G. Marbán, A.B. Fuertes, Appl. Catal. B: Environ. 46 (2003) 261.12] S. Liang, X. Youjia, C. Qingqing, H. Bingqing, W. Chao, J. Guohua, Prog. Chem. 22
(2010) 1882.13] F. Kapteijn, L. Singoredjo, A. Andreini, Appl. Catal. B 3 (1994) 173–189.14] L. Ji, P.M. Sreekanth, P.G. Smirniotis, S.W. Thiel, N.G. Pinto, Energy Fuels 22
(2008) 2299–2306.15] G. Pechi, P. Reyes, T. Lopez, R. Gomez, A. Moreno, J.L.G. Fierro, J. Chem. Technol.
Biotechnol. 77 (2002) 944.16] S.M. Saqer, D.I. Kondarides, X.E. Verykios, Appl. Catal. B: Environ. 108 (2011)
275–286.17] Z. Wu, B. Jiang, Y. Liu, Appl. Catal B: Environ. 79 (2008) 347–355.18] A. Rahman, M. Ahmed, Stud. Surf. Sci. Catal. 100 (1996) 419–426.19] P.M. Sreekanth, P.G. Smirniotis, Catal. Lett. 122 (2008) 37–42.20] M.M. Yung, E.M. Holmgreen, U.S. Ozkan, J. Catal. 247 (2007) 356.

2 talysi
[[[[
[
[
[[[[
[
[
[
[[[
[[[[
[
[[
06 B. Thirupathi, P.G. Smirniotis / Applied Ca
21] S.L. Sun, N. Tsubaki, K. Fujimoto, Appl. Catal. A: Gen. 202 (2000) 121.22] S. Bhatia, J. Beltramini, D.D. Do, Catal Today 7 (1990) 309.23] H.F.J. Van‘t Bilk, D.C. Koningsberger, R. Prins, J. Catal. 97 (1987) 210.24] F. Boccuzzi, A. Chiorino, G. Martra, M. Gargano, N. Ravasio, B. Carrozziniz, J.
Catal. 165 (1997) 129–139.25] R. Zhang, A. Villanueva, H. Alamdari, S. Kaliaguine, Catal. Commun. 9 (2008)
111–116.26] D.J. Koh, J.S. Chung, Y.G. Kim, J.S. Lee, I.-S. Nam, S.H. Moon, J. Catal. 138 (1992)
630–639.27] H.C. Yao, Y.F. Yu-Yao, J. Catal. 86 (1984) 254.28] J.Z. Shyu, W.H. Weber, H.S. Gandhi, J. Phys. Chem. 92 (1988) 4964–4970.29] T. Yamaguchi, N. Ikeda, H. Hattori, K. Tanabe, J. Catal. 67 (1981) 324.30] D.A. Pena, B.S. Uphade, E.P. Reddy, P.G. Smirniotis, J. Phys. Chem. B 108 (2004)
9927–9936.
31] G. Busca, L. Lietti, G. Ramis, G.F. Berti, Appl. Catal. B: Environ. 18 (1998)1–36.32] F. Kapteijin, L. Singoredjo, M.V. Driel, A. Andreini, J.A. Moulijin, G. Ramis, G.
Busca, J. Catal. 150 (1994) 105–116.33] H. Matralis, M. Ciardelli, M. Ruwet, P. Grange, J. Catal. 157 (1995) 523.
[
[
s B: Environmental 110 (2011) 195– 206
34] G. Ramis, L. Yi, G. Busca, Catal. Today 28 (1996) 373.35] H. Knözinger, Adv. Catal. 25 (1976) 184.36] G. Busca, H. Saussey, O. Saur, J.C. Lavalley, V. Lorenzelli, Appl. Catal. 14 (1985)
245.37] G. Qi, R.T. Yang, J. Phys. Chem. B 108 (2004) 15738–15747.38] R.Y. Liu, Z. Wu, H. Wang, T. Gu, Chemosphere 78 (2010) 1160–1166.39] F.C. Buciuman, F. Patcas, T. Hahn, Chem. Eng. Proc. 38 (1999) 563–569.40] F. Kapteijn, L. Singoredjo, M. Vandriel, A. Andreini, J.A. Moulijn, G. Ramis, G.
Busca, J. Catal. 150 (1994) 94.41] A. Machocki, T. Ioannides, B. Stasinska, W. Gac, G. Avgouropoulos, D. Delimaris,
W. Grzegorczyk, S. Pasieczna, J. Catal. 227 (2004) 282–296.42] S. Ponce, M.A. Pena, J.L.G. Fierro, Appl. Catal. B 24 (2000) 193–205.43] C.D. Wagner, W.M. Riggs, L.E. Davis, J.F. Moulder, Handbook of X-ray Photoelec-
tron Spectroscopy, Perkin-Elmer Corp., Physical Electronics Div., Eden Prairie,
MN, 1979.44] R. Khodayari, Doctorial Dissertation, Lund Institute of Technology, Lund,Sweden, 2001, ISBN:91-7874-122-X.
45] A.-C. Larsson, J. Einvall, A. Andersson, M. Sanati, Energy Fuels 20 (2006)1398–1405.


![CHEMISTRY 112 WORKSHEET - Texas A&M University 1... · Web view[Co(NH3)5Cl]Br2 pentaamminechlorocobalt(III) ... 4Cl2]Cl tetraaquadichlorochromium(III) chloride [Pt(NH3)2]Cl2 diammineplatinum](https://img.pdfslide.net/doc/110x75/5a9e9e6e7f8b9a0d158b9d29/docchemistry-112-worksheet-texas-am-1web-viewconh35clbr2-pentaamminechlorocobaltiii.jpg)

![Question 9 - prepareforchemistryprepareforchemistry.weebly.com/uploads/1/2/1/7/12175355/... · Web view... (ethane−1,2−diamine) chromium(III) chloride ... [Co(NH3)6]Cl3 (ii) [Co(NH3)5Cl]Cl2](https://img.pdfslide.net/doc/110x75/5a9e9e6e7f8b9a0d158b9d30/docquestion-9-prepareforchemistr-view-ethane12diamine-chromiumiii.jpg)
![Title The electrical conductivity of [Co(NH3)5NO2]SO4 in ... The electrical conductivity of [Co(NH3)5NO2]SO4 in aqueous solution under high pressure Author(s) Ueno, Masakatsu; Shimizu,](https://img.pdfslide.net/doc/110x75/5ab9de217f8b9ab62f8e624b/title-the-electrical-conductivity-of-conh35no2so4-in-the-electrical-conductivity.jpg)


![Co(III) · 57 3. [Co(NH3)4C 3] 3 [Co(NH3)5Cl]Cl2 4. [Co(NH3)4C 3] 3 [Co(NH3)5C 3] 3. Schlessinger, G. C. Inorg. Synth. 1960, 6, 173. Buckingham, D. A.; Clark, C. R. Inorg. Chem](https://img.pdfslide.net/doc/110x75/5f7f912729e2262737266598/coiii-57-3-conh34c-3-3-conh35clcl2-4-conh34c-3-3-conh35c-3-3.jpg)


![AHLCON PUBLIC SCHOOL - 12.doc · Web view... (III) chloride. 2) potassium tetrahydrozincate(II) 3) ... [CO (NH3)3Cl2] , [CO(NH3)5Cl]Cl2 , [CO(NH3)6]Cl3 , [CO(NH3)4Cl2]Cl. 19. Name](https://img.pdfslide.net/doc/110x75/5a9e9e6e7f8b9a0d158b9d3f/docahlcon-public-12docweb-view-iii-chloride-2-potassium-tetrahydrozincateii.jpg)


![[Co(NH3 6]Cl3](https://img.pdfslide.net/doc/110x75/62c22d2ed6734555b0515e2f/conh3-6cl3.jpg)

![[Co(NH3 6]Cl3 - Home - Chemistry](https://img.pdfslide.net/doc/110x75/6232bea36d113c542b444b8a/conh3-6cl3-home-chemistry.jpg)
