Embed Size (px)
Citation preview

Co-evolution of network structure and content
Lada Adamic
School of Information & Center for the Study of Complex Systems
University of Michigan

Outline
Co-evolution of network structure and content Can the structure of Twitter and virtual world interactions
reveal something about their content? http://arxiv.org/abs/1107.5543
Can the structure of a commodity futures trading network reveal something about information flowing into the market? http://papers.ssrn.com/sol3/papers.cfm?
abstract_id=1361184
3
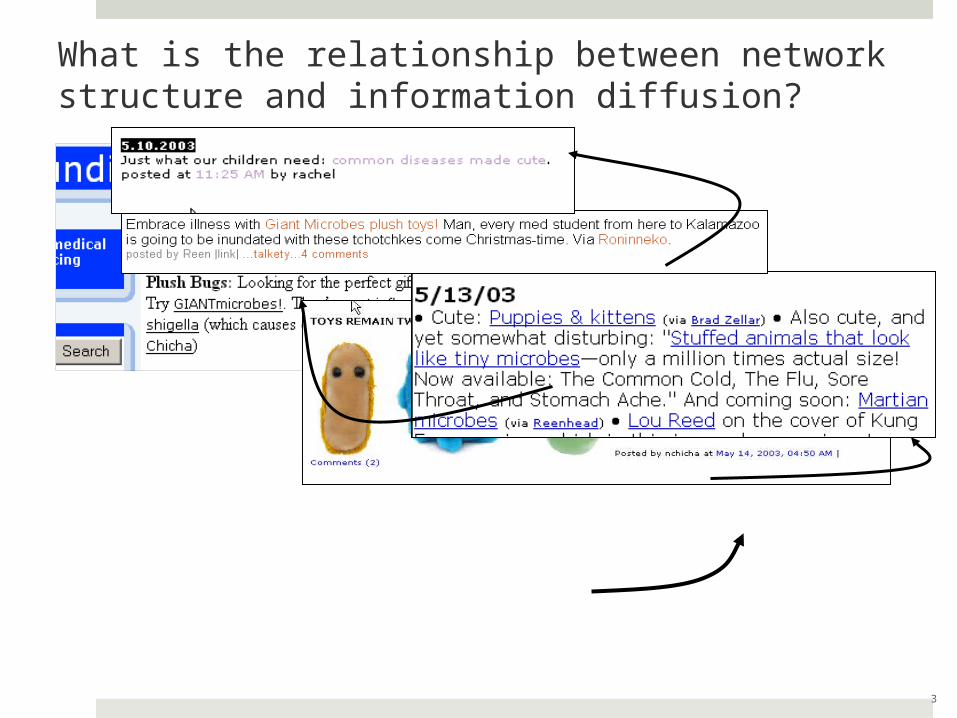
What is the relationship between network structure and information diffusion?

Is information flowing over the network?Or is information shaping the network?

Can the shape of the network reveal properties of information
Big news! Giant microbes!

Can the shape of the network reveal properties of information
Little news. How’s the weather?

Related work on time evolving graphs
Densification over time (Leskovec et al. 2005)
Community structure over time (Leicht et al. 2007, Mucha et al. 2010)
Change in structure (ability to “compress” network) signals events (Graphscope by Sun et al. 2007)
Disease propagation & timing (Moody 2002, Liljeros 2010)
Enron email (B. Aven, 2011)

What’s different here
We look at network dynamics at relatively short time scales and construct time series
A range of network metrics, instead of just community structure
Information novelty and diversity as opposed to tracking single events / pieces of information

Can the network reveal… If everyone is talking about the same thing, or if there is
just background chatter.
If what they are talking about is novel?
10
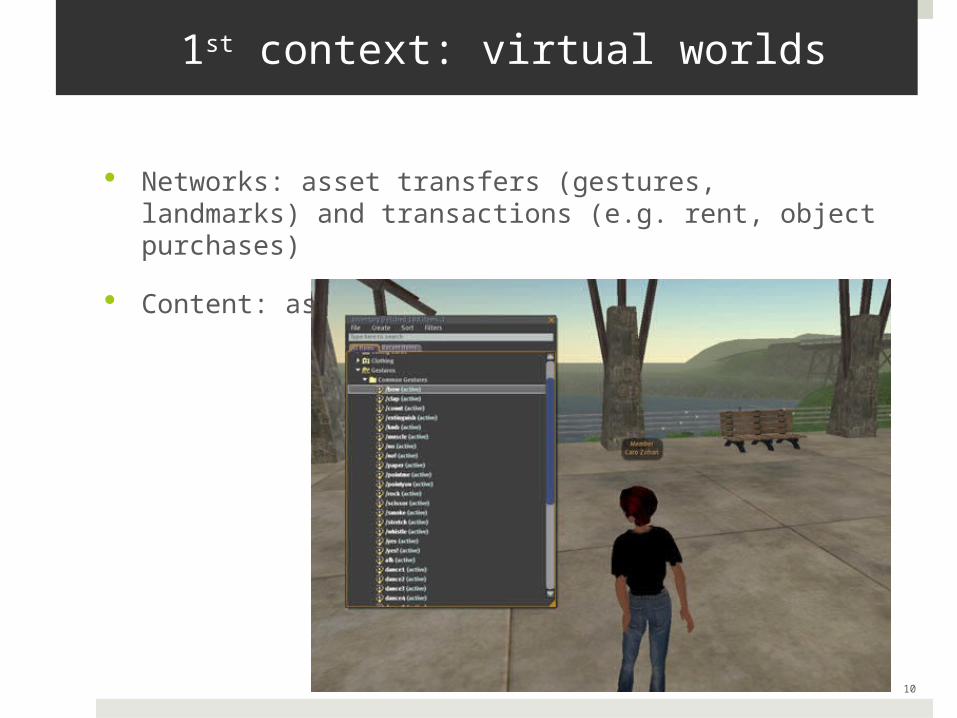
1st context: virtual worlds
Networks: asset transfers (gestures, landmarks) and transactions (e.g. rent, object purchases)
Content: assets being transferred

11
Study transfers in the context of 100 groups with highest numbers of transfers

Second context: Twitter Network microblogging : < 140 characters / tweet
Network links read from tweets Reply or mention: by putting the @ in
front of the username
Retweet: repeat something someone else wrote on twitter, preceded by the letters RT and @ in front of their username

Selecting Twitter communities to track
http://wefollow.com/twitter/researcher
For each “researcher” gather tweets of accounts they follow

Highly dynamic networks
Segmentation: Twitter: every 800
tweets median segment
duration 1.5 days SecondLife: every
50 asset transfers median segment
duration 8.4 days
% o
f edges
repeate
d
Segments elapsed

Conductance:capturing potential for information flow
A B A B
A B
low conductance
medium conductance
high conductance
Temporal conductance (summed over all pairs): High if pairs of nodes share edges, or many short,
indirect paths
Koren, North, Volinsky, KDD, 2006
16
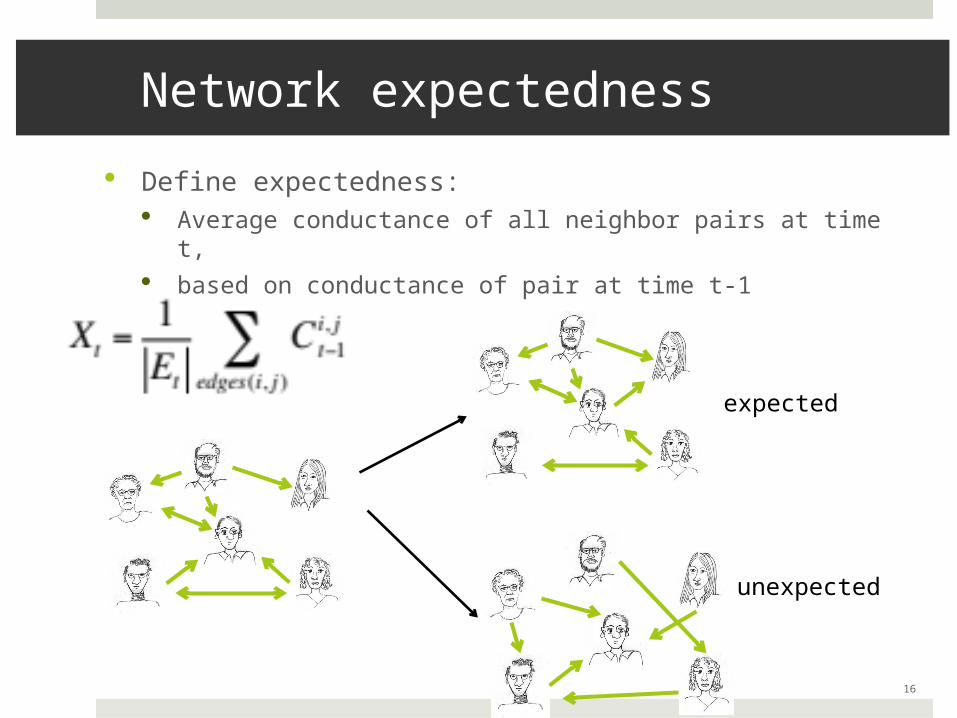
Network expectedness
Define expectedness: Average conductance of all neighbor pairs at time t, based on conductance of pair at time t-1
expected
unexpected
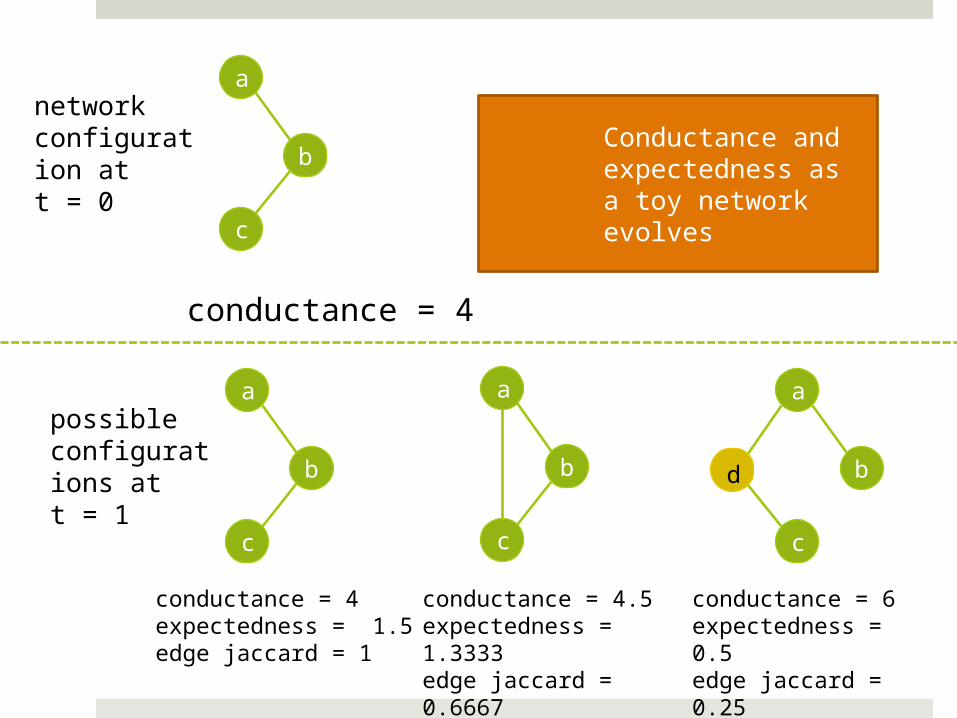
Conductance and expectedness as a toy network evolves
a
b
c
d
a
b
c
a
b
c
a
b
c
network configuration at t = 0
possible configurations at t = 1
conductance = 4
conductance = 4expectedness = 1.5edge jaccard = 1
conductance = 4.5expectedness = 1.3333edge jaccard = 0.6667
conductance = 6expectedness = 0.5edge jaccard = 0.25

SecondLife: network structure and content
overlapt,t+1
overlap t-1,t
D diversityt, (t+1)
standard network metrics are not indicative of information properties
conductance and expectedness are
D diversityt-1, t

Conductance & diversity of information
High conductance brings higher content diversity
Repeat network patterns bring less diversity and less novelty
but… similarity and novelty are positively correlated (r = 0.19)
Social and transaction network of top sellers in SL
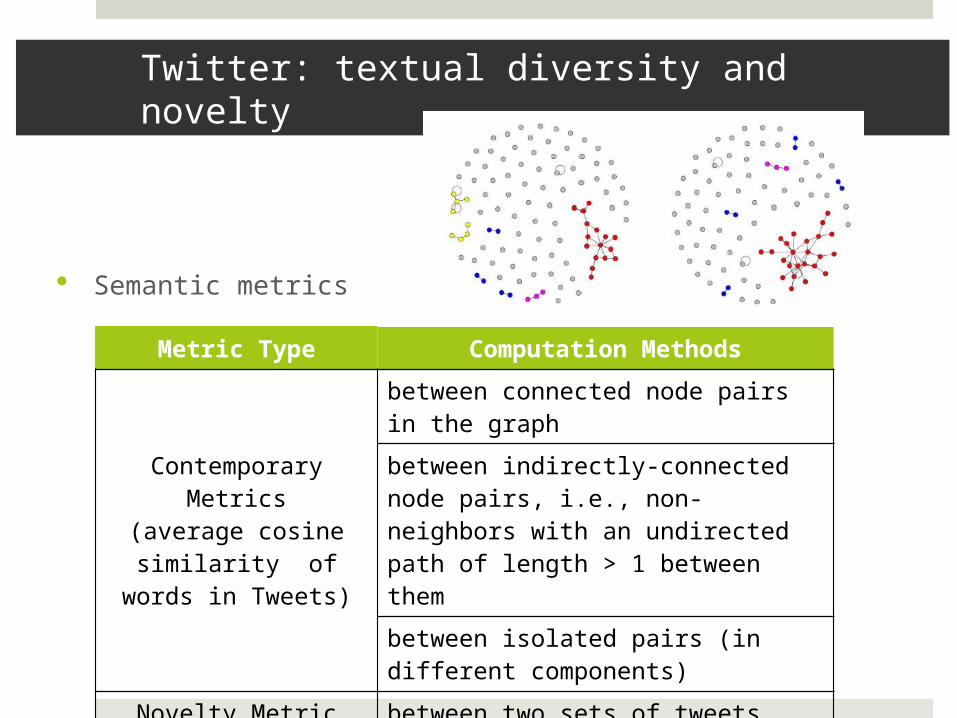
Twitter: textual diversity and novelty
Semantic metrics
Metric Type Computation Methods
Contemporary Metrics
(average cosine similarity of words in
Tweets)
between connected node pairs in the graph
between indirectly-connected node pairs, i.e., non-neighbors with an undirected path of length > 1 between them
between isolated pairs (in different components)
Novelty Metric(Language Model
distance)
between two sets of tweets associated with Twitter networks captured at different times
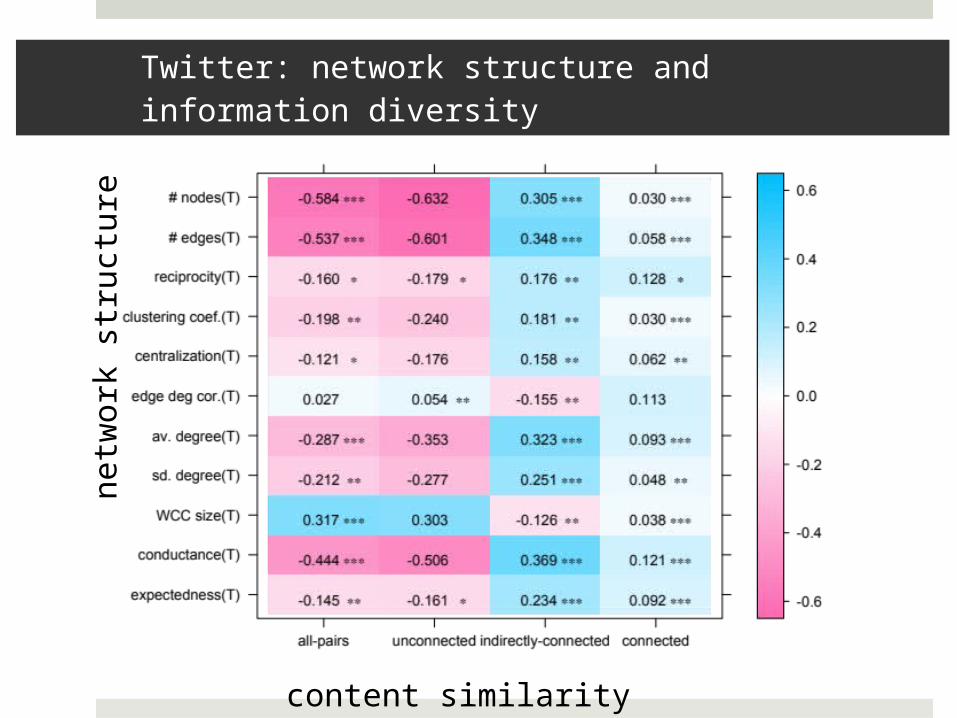
Twitter: network structure and information diversity
netw
ork
str
uct
ure
content similarity

Inferring Network Semantic Information
Question: Does the network structural information help to improve the prediction performance of the characteristics of information exchanged?
Kernel Regression Prediction
Model
Semantic variables
Topological variables
Semantic variables
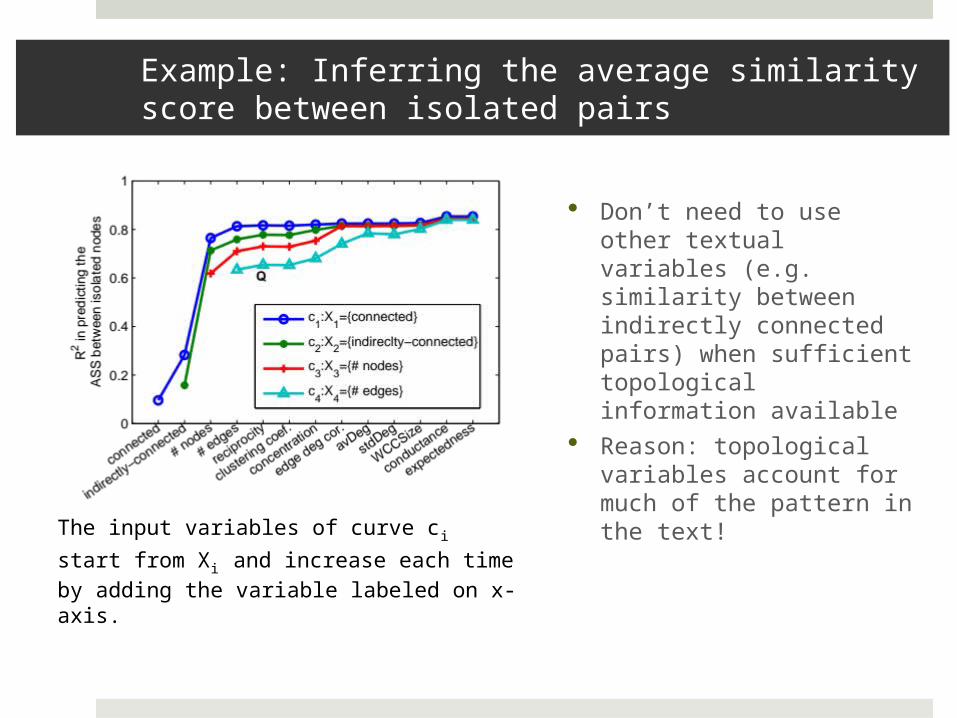
Example: Inferring the average similarity score between isolated pairs
Don’t need to use other textual variables (e.g. similarity between indirectly connected pairs) when sufficient topological information available
Reason: topological variables account for much of the pattern in the text!
The input variables of curve ci start from
Xi and increase each time by adding the variable labeled on x-axis.

Network structure and information novelty
Greater novelty in edges corresponds to greater novelty in content shared
For nodes that are interacting (citing or being cited): Higher
conductance and expectedness correlates with less information novelty

25
Information in trading networks
CFTC = Commodity futures trading commission
stated mission: protect market users and the public from fraud, manipulation, and abusive practices
futures contracts started out as contracts for agricultural products, but expanded to more exotic contracts, including index futures
http://papers.ssrn.com/sol3/papers.cfm?abstract_id=1361184
Collaboration with Celso Brunetti, Jeff Harris, and Andrei Kirilenko

Data
6.3 million transactions in Aug. 2008 in the Sept. E-mini S&P futures contract
price discovery for the index occurs mostly in this contract (Hasbrouck (2003))
data includes: date & time, executing broker, opposite broker, buy or sell, price, quantity
sample in transaction windows of 240 transactionsexecuting broker opposite broker
quantity: 10price: $171.25

27
matching algorithm
limit order book
buy 30 contracts at $171.25sell 10 contracts at $171.25
sell 20 contracts at $172.00
sell 5 contracts at $171.75 buy 20 contracts at $171.50
buy 50 contracts at $171.00
buy 30 contracts at $171.25
buy 20 contracts at $171.50
28
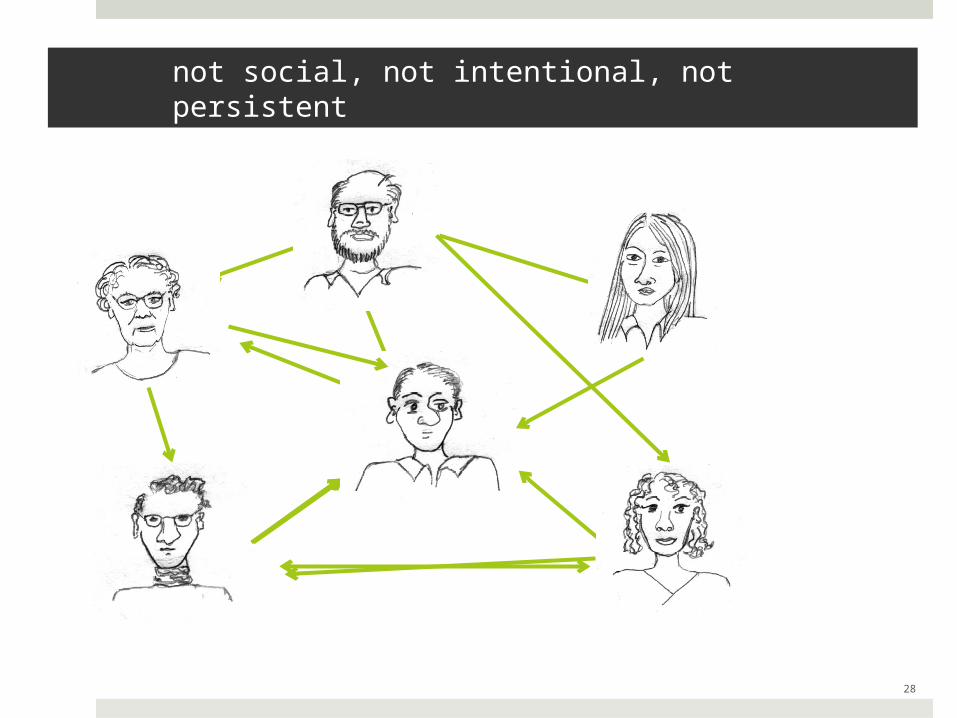
not social, not intentional, not persistent
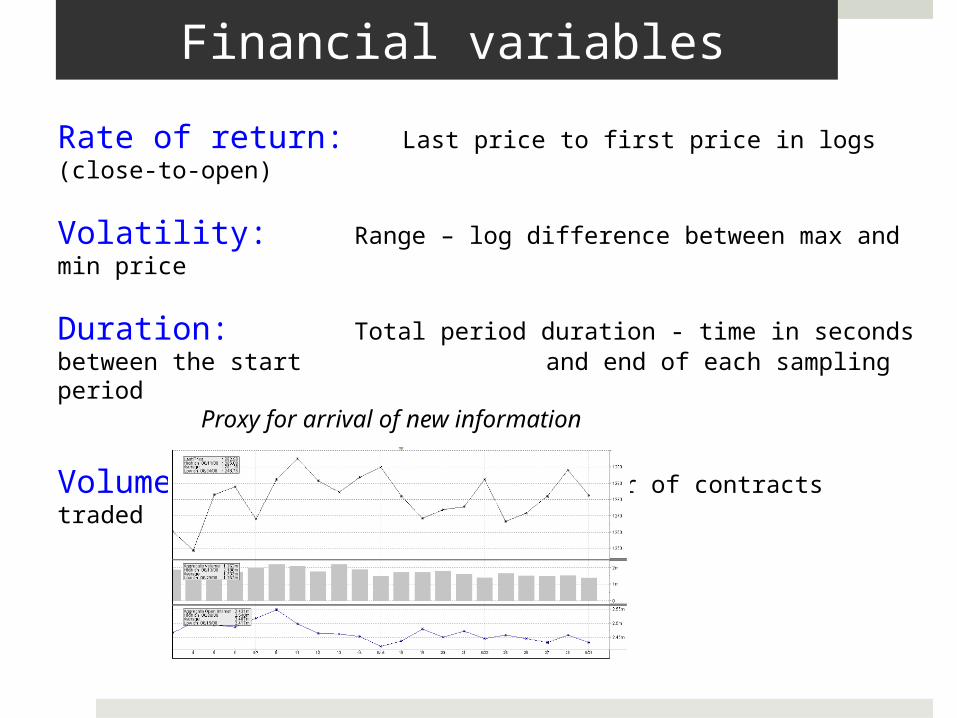
Financial variables
Rate of return: Last price to first price in logs (close-to-open)
Volatility: Range – log difference between max and min price
Duration: Total period duration - time in seconds between the start and end of each sampling period
Proxy for arrival of new information
Volume: Trading volume – number of contracts traded

30
What can we learn from network structure?e.g. centralization?
low in-centralization high in-centralization
low indegree
high indegreehigh outdegree
low outdegree

31
overview of network variables
# nodes, # edges
clustering coefficient, LSCC, reciprocity
CEN = giniin-degree – giniout-degree
INOUT = r(indegree of node, outdegree of same node)
AI (asymmetric information)

Correlations between network and financial variables
High Centralization: market dominance - a dominant trader buys from many small sellers – low duration, low volume
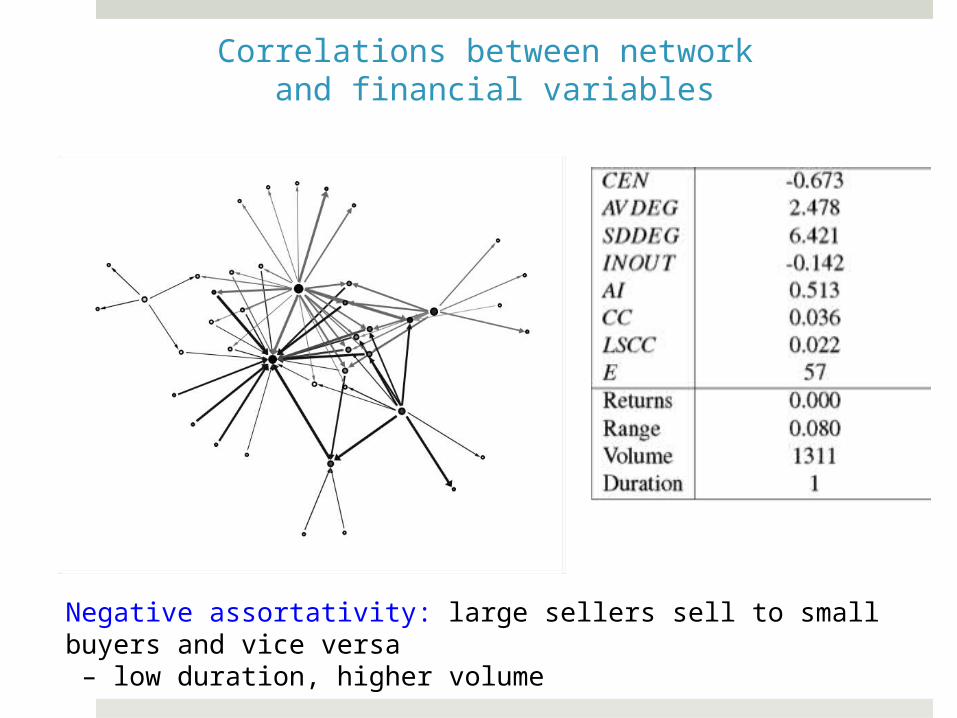
Negative assortativity: large sellers sell to small buyers and vice versa – low duration, higher volume
Correlations between network and financial variables
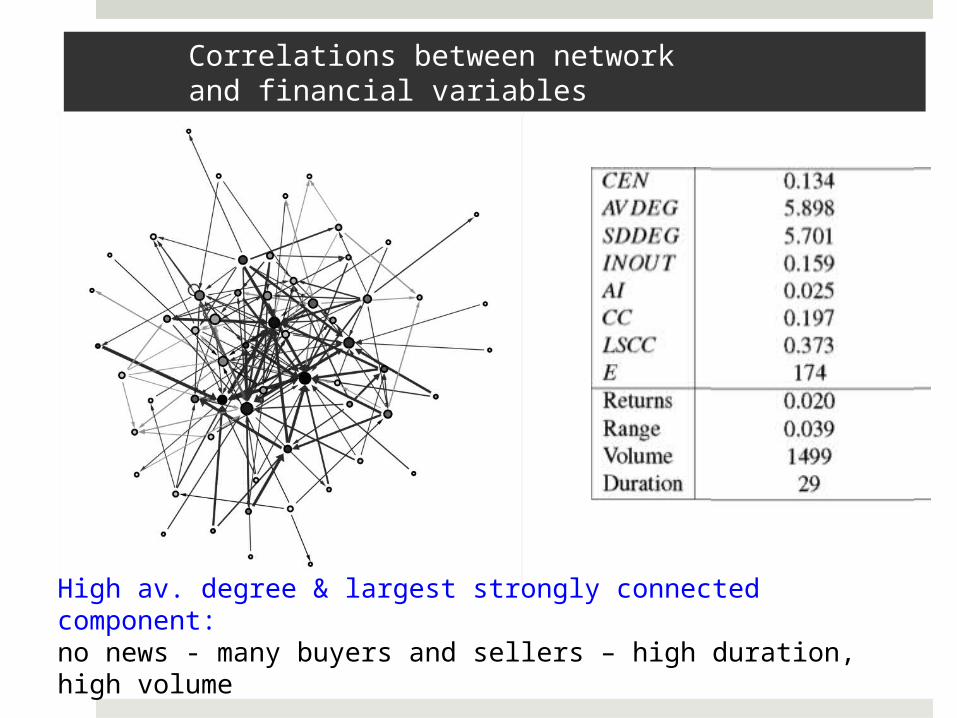
High av. degree & largest strongly connected component: no news - many buyers and sellers – high duration, high volume
Correlations between network and financial variables

Correlations between network and financial variables
Rate of return: positive correlation with centralization
Volatility & duration: correlated with standard deviation of degree, average deg. and the total number of edges (E).
Volume: Correlated with a few network variables, sign varies.

Conclusion Network structure alone is revealing of the diversity and
novelty information content being transmitted
Results depend on the scope and relative position of the activity in the network

Future work Sensitivity to inclusion of non-interactive or across-community
interactions
Applying novelty & conductance metrics to financial time series
Continuous formulation of novelty and other network metrics (because segmentation is problematic)
Roles of individual nodes
Thanks:
Edwin Teng Liuling Gong Avishay Livne
Information network academic research centerINARC

Questions?