Embed Size (px)
Citation preview

Co-expression analysis of RNA-seq data
Etienne Delannoy & Marie-Laure Martin-Magniette & Andrea Rau
Plant Science Institut of Paris-Saclay (IPS2)
Applied Mathematics and Informatics Unit (MIA-Paris)
Genetique Animale et Biologie Integrative (GABI)
ED& MLMM& AR Co-expression analysis of RNA-seq data INRA 1 / 42

Outline
1 Co-expression analysis introduction
2 Unsupervised clusteringCentroid-based clustering: K-means, HCAModel-based clusteringMixture models for RNA-seq data
3 Conclusion / discussion
ED& MLMM& AR Co-expression analysis of RNA-seq data INRA 2 / 42

Aims for this talk
What is the biological/statistical meaning of co-expression forRNA-seq?What methods exist for performing co-expression analysis?How to choose the number of clusters present in data?Advantages / disadvantages of different approaches: speed,stability, robustness, interpretability, model selection, ...
ED& MLMM& AR Co-expression analysis of RNA-seq data INRA 3 / 42

Design of a transcriptomics project
Biological question↓ ↑
Experimental design↓
Data acquisition↓
Data analysis:
Normalization, differential analysis, clustering, networks, ...↓ ↑
Validation
ED& MLMM& AR Co-expression analysis of RNA-seq data INRA 4 / 42

Gene co-expression1
1Google image search: “Coexpression”ED& MLMM& AR Co-expression analysis of RNA-seq data INRA 5 / 42

Gene co-expression is...
The simultaneous expression of two or more genes2
Groups of co-transcribed genes3
Similarity of expression4 (correlation, topological overlap, mutualinformation, ...)Groups of genes that have similar expression patterns5 over arange of different experiments
Related to shared regulatory inputs, functional pathways, andbiological process(es)6
2https://en.wiktionary.org/wiki/coexpression3http://bioinfow.dep.usal.es/coexpression4http://coxpresdb.jp/overview.shtml5Yeung et al. (2001)6Eisen et al. (1998)
ED& MLMM& AR Co-expression analysis of RNA-seq data INRA 6 / 42

From co-expression to gene function prediction
Transcriptomic data: main source of ’omic information available forliving organisms
Microarrays (∼1995 - )High-throughput sequencing: RNA-seq (∼2008 - )
Co-expression (clustering) analysisStudy patterns of relative gene expression (profiles) acrossseveral conditions⇒ Co-expression is a tool to study genes without known orpredicted function (orphan genes)Exploratory tool to identify expression trends from the data( 6= sample classification, identification of differential expression)
ED& MLMM& AR Co-expression analysis of RNA-seq data INRA 7 / 42

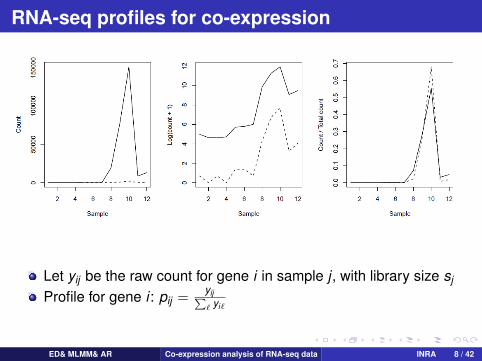
RNA-seq profiles for co-expression
Let yij be the raw count for gene i in sample j , with library size sj
Profile for gene i : pij =yij∑` yi`
Normalized profile for gene i : pij =yij/sj∑` yi`/sj
ED& MLMM& AR Co-expression analysis of RNA-seq data INRA 8 / 42

RNA-seq profiles for co-expression
Let yij be the raw count for gene i in sample j , with library size sj
Profile for gene i : pij =yij∑` yi`
Normalized profile for gene i : pij =yij/sj∑` yi`/sj
ED& MLMM& AR Co-expression analysis of RNA-seq data INRA 8 / 42
RNA-seq profiles for co-expression
Let yij be the raw count for gene i in sample j , with library size sj
Profile for gene i : pij =yij∑` yi`
Normalized profile for gene i : pij =yij/sj∑` yi`/sj
ED& MLMM& AR Co-expression analysis of RNA-seq data INRA 8 / 42

RNA-seq profiles for co-expression
Let yij be the raw count for gene i in sample j , with library size sj
Profile for gene i : pij =yij∑` yi`
Normalized profile for gene i : pij =yij/sj∑` yi`/sj
ED& MLMM& AR Co-expression analysis of RNA-seq data INRA 8 / 42

Unsupervised clustering
ObjectiveDefine homogeneous and well-separated groups of genes fromtranscriptomic data
What does it mean for a pair of genes to be close?Given this, how do we define groups?
Two broad classes of methods typically used:1 Centroid-based clustering (K-means and hierarchical clustering)2 Model-based clustering (mixture models)
ED& MLMM& AR Co-expression analysis of RNA-seq data INRA 9 / 42

Similarity measures
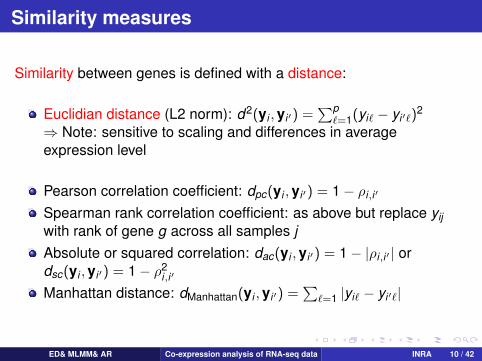
Similarity between genes is defined with a distance:
Euclidian distance (L2 norm): d2(yi ,yi ′) =∑p
`=1(yi` − yi ′`)2
⇒ Note: sensitive to scaling and differences in averageexpression level
Pearson correlation coefficient: dpc(yi ,yi ′) = 1− ρi,i ′
Spearman rank correlation coefficient: as above but replace yijwith rank of gene g across all samples jAbsolute or squared correlation: dac(yi ,yi ′) = 1− |ρi,i ′ | ordsc(yi ,yi ′) = 1− ρ2
i,i ′
Manhattan distance: dManhattan(yi ,yi ′) =∑
`=1 |yi` − yi ′`|
ED& MLMM& AR Co-expression analysis of RNA-seq data INRA 10 / 42
Similarity measures
Similarity between genes is defined with a distance:
Euclidian distance (L2 norm): d2(yi ,yi ′) =∑p
`=1(yi` − yi ′`)2
⇒ Note: sensitive to scaling and differences in averageexpression level
Pearson correlation coefficient: dpc(yi ,yi ′) = 1− ρi,i ′
Spearman rank correlation coefficient: as above but replace yijwith rank of gene g across all samples jAbsolute or squared correlation: dac(yi ,yi ′) = 1− |ρi,i ′ | ordsc(yi ,yi ′) = 1− ρ2
i,i ′
Manhattan distance: dManhattan(yi ,yi ′) =∑
`=1 |yi` − yi ′`|
ED& MLMM& AR Co-expression analysis of RNA-seq data INRA 10 / 42

Inertia measures
Homogeneity of a group is defined with an inertia criterion:Let yD be the centroid of the dataset and yCk the centroid of groupCk
Inertia =G∑
g=1
d2(yi ,yD)
=K∑
k=1
∑g∈Ck
d2(yi ,yCk ) +K∑
k=1
nkd2(yCk ,yD)
= within-group inertia + between-group inertia
ED& MLMM& AR Co-expression analysis of RNA-seq data INRA 11 / 42

In practice...
Objective: cluster G genes into K groups,maximizing the between-group inertia
Exhaustive search is impossibleTwo algorithms are often used
1 K-means2 Hierarchical clustering
ED& MLMM& AR Co-expression analysis of RNA-seq data INRA 12 / 42

K-means algorithm
Initialization K centroids are chosen ramdomly or by the user
Iterative algorithm1 Assignment Each gene is assigned to a group according to its
distance to the centroids.2 Calculation of the new centroids
Stopping criterion: when the maximal number of iterations is achivedOR when groups are stable
PropertiesRapid and easyResults depend strongly on initializationNumber of groups K is fixed a priori
ED& MLMM& AR Co-expression analysis of RNA-seq data INRA 13 / 42

K-means illustration
Animation: http://shabal.in/visuals/kmeans/1.html
ED& MLMM& AR Co-expression analysis of RNA-seq data INRA 14 / 42
K-means algorithm: Choice of K ?
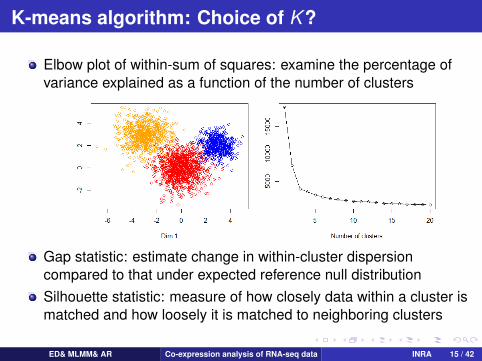
Elbow plot of within-sum of squares: examine the percentage ofvariance explained as a function of the number of clusters
Gap statistic: estimate change in within-cluster dispersioncompared to that under expected reference null distributionSilhouette statistic: measure of how closely data within a cluster ismatched and how loosely it is matched to neighboring clusters
ED& MLMM& AR Co-expression analysis of RNA-seq data INRA 15 / 42

Hierarchical clustering analysis (HCA)
Objective Construct embedded partitions of (G,G − 1, . . . ,1) groups,forming a tree-shaped data structure (dendrogram)Algorithm
Initialization G groups for G genesAt each step:
• Closest genes are clustered• Calculate distance between this new group and the
remaining genes
ED& MLMM& AR Co-expression analysis of RNA-seq data INRA 16 / 42

Distances between groups for HCA
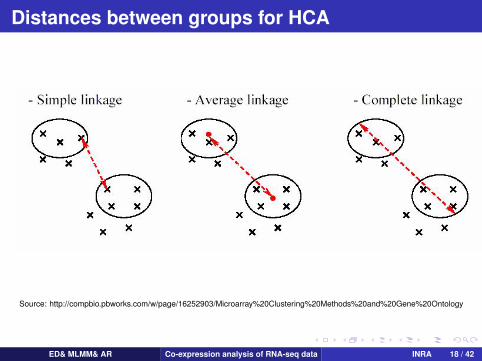
Distances between groupsSingle-linkage clustering:
D(Ck ,Ck ′) = miny∈Ck
miny ′∈Ck′
d2(y , y ′)
Complete-linkage clustering:
D(Ck ,Ck ′) = maxy∈Ck
maxy ′∈Ck′
d2(y , y ′)
Ward distance:
D(Ck ,Ck ′) = d2(yCk , yCk′)× nk nk ′
nk + nk ′
where nk is the number of genes in group Ck
ED& MLMM& AR Co-expression analysis of RNA-seq data INRA 17 / 42
Distances between groups for HCA
Source: http://compbio.pbworks.com/w/page/16252903/Microarray%20Clustering%20Methods%20and%20Gene%20Ontology
ED& MLMM& AR Co-expression analysis of RNA-seq data INRA 18 / 42

HCA: additional details
Properties:HCA is stable since there is no initialization stepK is chosen according to the treeResults strongly depend on the chosen distancesBranch lengths are proportional to the percentage of inertia loss⇒ a long branch indicates that the 2 groups are not homogeneous
ED& MLMM& AR Co-expression analysis of RNA-seq data INRA 19 / 42

Model-based clustering
Probabilistic clustering models : data are assumed to come fromdistinct subpopulations, each modeled separatelyRigourous framework for parameter estimation and modelselectionOutput: each gene assigned a probability of cluster membership
ED& MLMM& AR Co-expression analysis of RNA-seq data INRA 20 / 42

Key ingredients of a mixture model
Let y = (y1, . . . ,yn) denote the observations with yi ∈ RQ
We introduce a latent variable to indicate the group from whicheach observation arises:
Zi ∼M(n;π1, . . . , πK ),
P(Zi = k) = πk
Assume that yi are conditionally independent given Zi
Model the distribution of yi |Zi using a parametric distribution:
(yi |Zi = k) ∼ f (·; θk )
ED& MLMM& AR Co-expression analysis of RNA-seq data INRA 21 / 42

Questions around the mixtures
Model: what distribution to use for each component ? depends on the observed data.
Inference: how to estimate the parameters ? usually done with an EM-like algorithm (Dempster et al., 1977)
Model selection: how to choose the number of components ?
A collection of mixtures with a varying number of components isusually consideredA penalized criterion is used to select the best model from thecollection
ED& MLMM& AR Co-expression analysis of RNA-seq data INRA 22 / 42
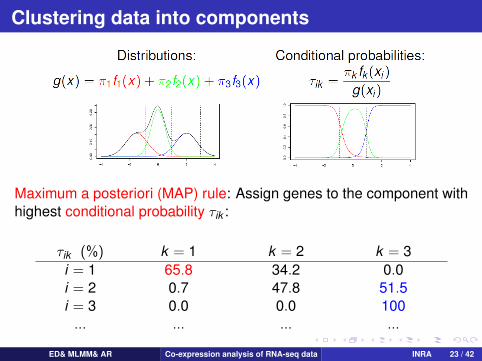
Clustering data into components
Maximum a posteriori (MAP) rule: Assign genes to the component withhighest conditional probability τik :
τik (%) k = 1 k = 2 k = 3i = 1 65.8 34.2 0.0i = 2 0.7 47.8 51.5i = 3 0.0 0.0 100... ... ... ...
ED& MLMM& AR Co-expression analysis of RNA-seq data INRA 23 / 42

Model selection for mixture modelsAsymptotic penalized criteria7
BIC aims to identify the best model K wrt the global fit of the datadistribution:
BIC(K ) = − log P(y|K , θK ) +νK
2log(n)
where νK is the # of free parameters and θK is the MLE of themodel with K clustersICL aims to identify the best model K wrt cluster separation:
ICL(K ) = BIC(K ) +
(−
n∑i=1
K∑k=1
τik log τik
)
Select K that minimizes BIC or ICL (but be careful about their sign!)
7Asymptotic: approaching a given value as the number of observations n → ∞ED& MLMM& AR Co-expression analysis of RNA-seq data INRA 24 / 42

Model selection for mixture models: BIC vs ICL
ED& MLMM& AR Co-expression analysis of RNA-seq data INRA 25 / 42

Model selection for mixture modelsNon-asymptotic penalized criteria
Recent work has been done in a non-asymptotic context using theslope heuristics (Birge & Massart, 2007):
SH(K ) = log P(y|K , θK ) + κpenshape(K )
In large dimensions, linear behavior of Dn 7→ −γn(sD)
Estimation of slope to calibrate κ in a data-driven manner(Data-Driven Slope Estimation = DDSE), capushe R package
-300
-250
-200
-150
-100
Contrast representation
penshape(m) (labels : Model names)
−γ n(sm)
The regression line is computed with 20 points
2 4 6 8 10 12 14 16 18 20 22 24 26 28 30 32 34 36 38 40 42 44 46 48 50 52 54 56 58 60
400
600
800
1000
1200
1400
Successive slope values
Number of points (penshape(m),− γn(sm)) for the regression
κ59 54 48 42 36 30 25 19 13 7 4
Selected models with respect to the successive slope values
Number of points (penshape(m),− γn(sn)) for the regression
Model
59 54 48 42 36 30 25 19 13 7 4
23
27
30323436
43
55
ED& MLMM& AR Co-expression analysis of RNA-seq data INRA 26 / 42

Finite mixture models for RNA-seq
Assume data y come from K distinct subpopulations, each modeledseparately:
f (y|K ,ΨK ) =n∏
i=1
K∑k=1
πk fk (yi ;θk )
π = (π1, . . . , πK )′ are the mixing proportions, where∑K
k=1 πk = 1fk are the densities of each of the components
For microarray data, we often assume yi |k ∼ MVN(µk ,Σk )
What about RNA-seq data?
ED& MLMM& AR Co-expression analysis of RNA-seq data INRA 27 / 42

Finite mixture models for RNA-seq data
f (y|K ,ΨK ) =n∏
i=1
K∑k=1
πk fk (yi |θk )
For RNA-seq data, we must choose the family & parameterization offk (·):
1 Directly model read counts (HTSCluster):
yi |Zi = k ∼J∏
j=1
Poisson(yij |µijk )
2 Apply appropriately chosen data transformation (coseq):
g(yi)|Zi = k ∼ MVN(µk ,Σk )
ED& MLMM& AR Co-expression analysis of RNA-seq data INRA 28 / 42

Poisson mixture models for RNA-seq (Rau et al.,2015)
yi |Zi = k ∼J∏
j=1
Poisson(yij |µijk )
Question: How to parameterize the mean µijk to obtain meaningfulclusters of co-expressed genes?
µijk = wiλjksj
wi : overall expression level of observation i (yi·)λk = (λjk ) : clustering parameters that define the profiles of genesin cluster k (variation around wi )sj : normalized library size for sample j , where
∑j sj = 1
ED& MLMM& AR Co-expression analysis of RNA-seq data INRA 29 / 42

Behavior of model selection in practice forRNA-seq
0 50 100 150 200
−2.
0e+
08−
1.0e
+08
Number of clusters
logL
ike
0 50 100 150 200−
2.0e
+08
−1.
0e+
08
Number of clusters
BIC
X
0 50 100 150 200
−2.
0e+
08−
1.0e
+08
Number of clusters
ICL
X
●
●
●
●
●
●
●●●●●
●●●●
●●●●
●●●●●●●
●●●●●●●●
●●●●●●●●●●●●●●●●
●●●●●●●●●● ● ● ● ● ● ● ● ●
−2.
0e+
08−
1.5e
+08
−1.
0e+
08−
5.0e
+07
Contrast representation
penshape(m) (labels : Model names)
−γ n
(sm)
* * *
*The regression line is computed with 17 pointsValidation points
1 4 7 10 13 16 19 22 25 28 31 34 37 40 43 46 49 52 55 58 65 70 75 80 85 90 95 100
110
120
130
ED& MLMM& AR Co-expression analysis of RNA-seq data INRA 30 / 42

Discussion of PMM for RNA-seq data
Advantages:1 Directly models counts (no data transformation necessary)2 Clusters interpreted in terms of profiles around mean expression3 Implemented in HTSCluster package on CRAN (v1.0.8)4 Promising results on real data...
Limitations:1 Slope heuristics requires a very large collection of models to be fit2 Restrictive assumption of conditional independence among
samples3 Cannot model per-cluster correlation structures4 Poisson distribution requires assuming that mean = variance
ED& MLMM& AR Co-expression analysis of RNA-seq data INRA 31 / 42
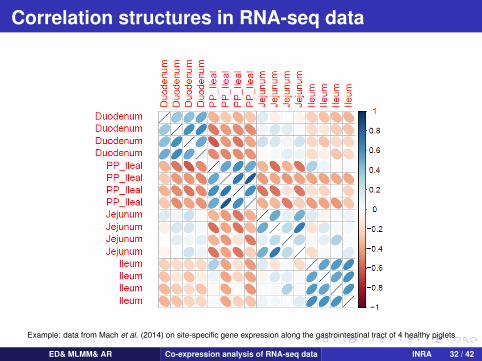
Correlation structures in RNA-seq data
Example: data from Mach et al. (2014) on site-specific gene expression along the gastrointestinal tract of 4 healthy piglets
ED& MLMM& AR Co-expression analysis of RNA-seq data INRA 32 / 42

Gaussian mixture models for RNA-seq
Idea: Transform RNA-seq data, then apply Gaussian mixture models
Several data transformations have been proposed for RNA-seq torender the data approximately homoskedastic:
log2(yij + c)
Variance stabilizing transformation (DESeq)Moderated log counts per million (edgeR)Regularized log-transformation (DESeq2)
... but recall that we wish to cluster the normalized profilespij =
yij/sj∑` yi`/sj
ED& MLMM& AR Co-expression analysis of RNA-seq data INRA 33 / 42

Remark: transformation needed for normalizedprofiles
Note that the normalized profiles are compositional data, i.e. thesum for each gene pi· = 1This implies that the vector pi is linearly dependent⇒ imposesconstraints on the covariance matrices Σk that are problematic forthe general GMM
As such, we consider a transformation on the normalized profilesto break the sum constraint:
pij = g(pij) = arcsin(√
pij)
And fit a GMM to the transformed normalized profiles:
f (p|K ,ΨK ) =n∏
i=1
K∑k=1
πkφ(pi |θk ,Σk )
ED& MLMM& AR Co-expression analysis of RNA-seq data INRA 34 / 42

Running the PMM or GMM for RNA-seq data withcoseq
> library(coseq)>> GMM <- coseq(counts, K=2:10, model="Normal",> transformation="arcsin")> summary(GMM)> plot(GMM)>> ## Note: indirectly calls HTSCluster for PMM> PMM <- coseq(counts, K=2:10, model="Poisson",> transformation="none")> summary(PMM)> plot(PMM)
ED& MLMM& AR Co-expression analysis of RNA-seq data INRA 35 / 42

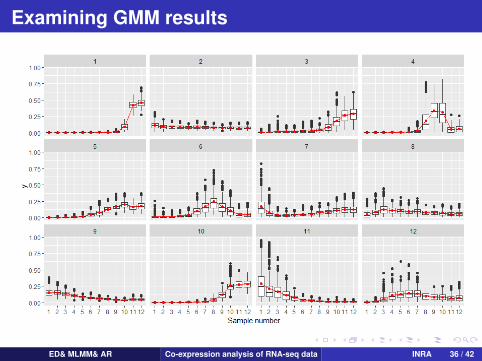
Examining GMM results
ED& MLMM& AR Co-expression analysis of RNA-seq data INRA 36 / 42
Examining GMM results
ED& MLMM& AR Co-expression analysis of RNA-seq data INRA 36 / 42

Examining GMM results
ED& MLMM& AR Co-expression analysis of RNA-seq data INRA 36 / 42
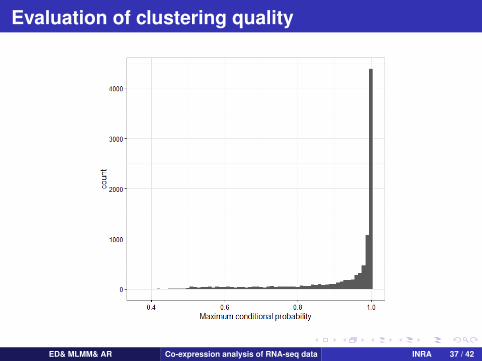
Evaluation of clustering quality
ED& MLMM& AR Co-expression analysis of RNA-seq data INRA 37 / 42

Evaluation of clustering quality
ED& MLMM& AR Co-expression analysis of RNA-seq data INRA 37 / 42

Evaluation of clustering quality
ED& MLMM& AR Co-expression analysis of RNA-seq data INRA 37 / 42
Conclusions: RNA-seq co-expression
Some practical questions to consider prior to co-expression analyses:
Should all genes be included?Screening via differential analysis or a filtering step (based onmean expression or coefficient of variation)... Usually a good idea, genes that contribute noise will affectresults!
What to do about replicates?Average, or model each one independently? Note that the PMM makes use of experimental condition labels,but the GMM does not...
ED& MLMM& AR Co-expression analysis of RNA-seq data INRA 38 / 42

A note about evaluating clustering approaches8
Clustering results can be evaluated based on internal criteria(e.g., statistical properties of clusters) or external criteria (e.g.,functional annotations)Preprocessing details (normalization, filtering, dealing withmissing values) can affect clustering outcomeMethods that give different results depending on the initializationshould be rerun multiple times to check for stabilityMost clustering methods will find clusters even when no actualstructure is present⇒ good idea to compare to results withrandomized data!
8D’haeseller, 2005ED& MLMM& AR Co-expression analysis of RNA-seq data INRA 39 / 42

A note about validating clustering approaches onreal data
Difficult to compare several clustering algorithms on a givendataset (and difficult to discern under which circumstances aparticular method should be preferred)
Adjusted Rand index: measure of similarity between two dataclusterings, adjusted for the chance grouping of elements ARI has expected value of 0 in the case of a random partition,and is bounded above by 1 in the case of perfect agreement
Difficult to evaluate how well a given clustering algorithm performson transcriptomic dataNo one-size-fits-all solution to clustering, and no consensus ofwhat a “good” clustering looks like⇒ use more than oneclustering algorithm!
ED& MLMM& AR Co-expression analysis of RNA-seq data INRA 40 / 42
Final thoughts9
9Jain & Dubes, 1988ED& MLMM& AR Co-expression analysis of RNA-seq data INRA 41 / 42

Acknowledgements & References
MixStatSeq ANR-JCJC grant
Thanks to Gilles Celeux (Inria Saclay - Ile-de-France), Cathy Maugis-Rabusseau(INSA / IMT Toulouse), Etienne Delannoy, Marie-Laure Martin-Magniette (SPS),and Panos Papastamoulis (University of Manchester)
Jain & Dubes (1988) Algorithms for Clustering Data. Prentice-Hall, Upper Saddle River, NJ.D’haeseller (2005) How does gene expression clustering work? Nature Biotechnology, 23(12):1499-501.Yeung et al. (2001) Model-based clustering and data transformations for gene expression data. Bioinformatics, 17(10):977-87.Eisen et al. (1998) Cluster analysis and display of genome-wide expression patterns. PNAS, 95(25):14863-8.Dempster et al. (1977) Maximum likelihood from incomplete data via the EM algorithm. JRSS B, 39(1):1-38.Birge & Massart (2007) Minimal penalties for Gaussian model selection. Probability Theory and Related Fields 138(1):33-73.
Rau al. (2015) Co-expression analysis of high-throughput transcriptome sequencing data with Poisson mixture models.Bioinformatics 31(9):1420-7.