Embed Size (px)
Citation preview
CO2 ABSORPTION INTO CONCENTRATED CARBONATE SOLUTIONS WITH PROMOTERS AT ELEVATED TEMPERATURES
BY
NICHOLAS P. DEVRIES
THESIS
Submitted in partial fulfillment of the requirements for the degree of Master of Science in Agricultural and Biological Engineering
in the Graduate College of the University of Illinois at Urbana-Champaign, 2014
Urbana, Illinois
Advisers: Associate Professor Xinlei Wang Dr. Yongqi Lu

ii
ABSTRACT
As atmospheric carbon dioxide (CO2) emissions continue to increase, it becomes
important to develop methods to capture CO2 from large emission sources such as power plants.
The Hot Carbonate Absorption Process with Crystallization Enabled High Pressure Stripping
(Hot-CAP), which employs a concentrated potassium carbonate/bicarbonate (PCB) aqueous
solution as a solvent and a potassium carbonate/bicarbonate slurry for CO2 stripping, is a novel
method to capture this CO2 more efficiently than conventional technologies. We focused on
addressing the issue associated with a slow rate of CO2 absorption into a potassium
carbonate/bicarbonate solution by using amine and amino acid promoters. We will conduct an
initial screening study using a lab scale stirred tank reactor. Promoters which showed the most
potential were tested on a bench scale, packed bed column to simulate real process conditions.
Five different primary/secondary amines and three amino acid salts were evaluated as
promoters for a concentrated 40 wt% potassium carbonate/bicarbonate solution using a batch
stirred tank reactor. Using amino acids, absorption rate was improved compared to the
unpromoted 40 wt% potassium carbonate/bicarbonate but was not sufficiently high for the
practical purpose. Amine promoters increased absorption rates into potassium
carbonate/bicarbonate solution at 70°C by 3.5 to 50 times, with piperazine (PZ) and
aminomethyl propanol (AMP) showing the highest promotion rate. Compared to the 5 M
monoethanolamine (MEA) solution at 50°C (typical absorption temperature in benchmark MEA
process), the absorption rates into the potassium carbonate/bicarbonate solution promoted with 1
M PZ and 1 M AMP at 70°C (typical absorption temperature in Hot-CAP) were higher or
comparable either at CO2 lean or rich conditions.
As determined by testing of CO2 absorption in a bench scale, packed bed column, use of
selected rate promoters increased the rate of CO2 removal into potassium carbonate/bicarbonate
solution. The 40 wt% potassium carbonate/bicarbonate solution promoted with 0.5 M PZ, DEA
or AMP tested at 70°C performed 1 to 3 times better than 5 M MEA at 50°C at their respective
lean loading levels and 3 to 5 times better at rich CO2 loading levels, when other conditions were
the same.

iii
ACKNOWLEDGMENTS
I would like to thank Dr. Yongqi Lu for his support and contributions to this work, and
for giving me the chance to work in his lab. I would also like to thank Manoranjan Sahu, Shihan
Zhang, David Ruhter and Qing Ye for their help in the lab, as well as Dr. Wang for giving me
this opportunity and Dr. Tumbleson and Dr. Singh for serving on my committee.
I am very appreciative of the financial support from the ISGS, ABE department, the
Department of Energy’s National Energy Technology Laboratory (DOE/NETL) under Award
No. DE-FE0004360, the Illinois Department of Commerce and Economic Opportunity (IDCEO)
through the Office of Coal Development (OCD), and the Illinois Clean Coal Institute (ICCI)
under Contract No. 11/US-6. These programs are instrumental in giving students the opportunity
to perform research while pursuing a graduate education, and I am very grateful for the support
I’ve received.
Finally, I would like to recognize my family and friends for their continued
encouragement throughout my academic career. Their emotional, financial, and professional
help has provided me with many great opportunities.
May 2014
Champaign, IL
iv
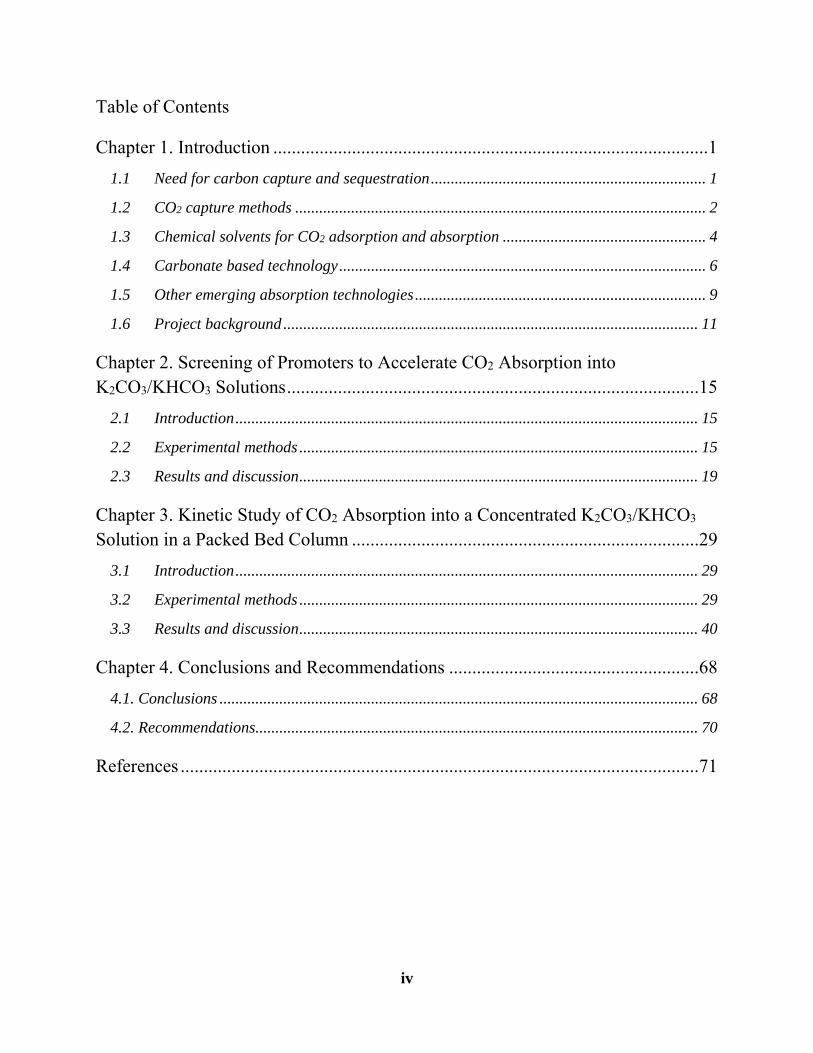
Table of Contents
Chapter 1. Introduction .............................................................................................. 1
1.1 Need for carbon capture and sequestration ..................................................................... 1
1.2 CO2 capture methods ....................................................................................................... 2
1.3 Chemical solvents for CO2 adsorption and absorption ................................................... 4
1.4 Carbonate based technology ............................................................................................ 6
1.5 Other emerging absorption technologies ......................................................................... 9
1.6 Project background ........................................................................................................ 11
Chapter 2. Screening of Promoters to Accelerate CO2 Absorption into K2CO3/KHCO3 Solutions ......................................................................................... 15
2.1 Introduction .................................................................................................................... 15
2.2 Experimental methods .................................................................................................... 15
2.3 Results and discussion .................................................................................................... 19
Chapter 3. Kinetic Study of CO2 Absorption into a Concentrated K2CO3/KHCO3 Solution in a Packed Bed Column ........................................................................... 29
3.1 Introduction .................................................................................................................... 29
3.2 Experimental methods .................................................................................................... 29
3.3 Results and discussion .................................................................................................... 40
Chapter 4. Conclusions and Recommendations ...................................................... 68
4.1. Conclusions ........................................................................................................................ 68
4.2. Recommendations ............................................................................................................... 70
References ................................................................................................................ 71
1
Chapter 1
Introduction
1.1 Need for carbon capture and sequestration
As global warming becomes an important issue, many countries are looking to limit their
emissions of greenhouse gases, with carbon dioxide (CO2) being the main focus. As a result of
this, CO2 capture and sequestration is considered an important option to mitigate CO2 emissions
in recent years. While many emerging technologies are being investigated, they are expensive
and not economically feasible. Eventually government regulations and economics will be the
driving force behind finding and implementing an efficient treatment for CO2 containing waste
gases.
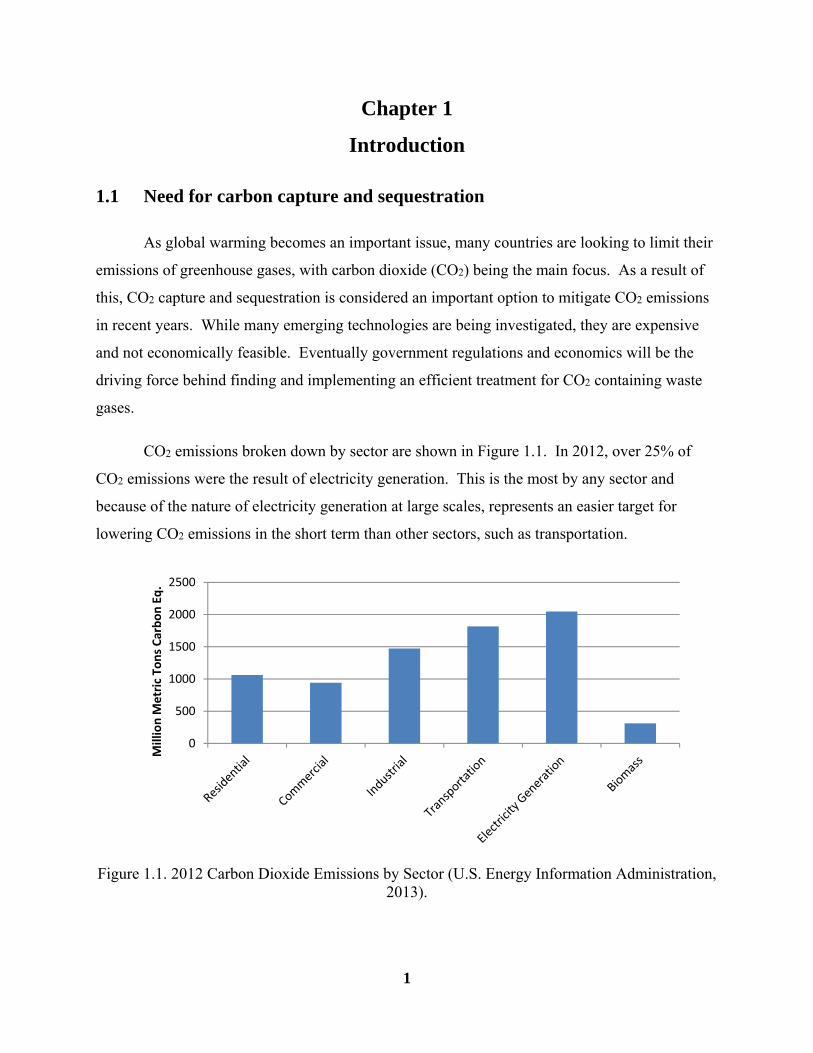
CO2 emissions broken down by sector are shown in Figure 1.1. In 2012, over 25% of
CO2 emissions were the result of electricity generation. This is the most by any sector and
because of the nature of electricity generation at large scales, represents an easier target for
lowering CO2 emissions in the short term than other sectors, such as transportation.
Figure 1.1. 2012 Carbon Dioxide Emissions by Sector (U.S. Energy Information Administration, 2013).
0
500
1000
1500
2000
2500
Million M
etric Tons Carbon Eq.
2
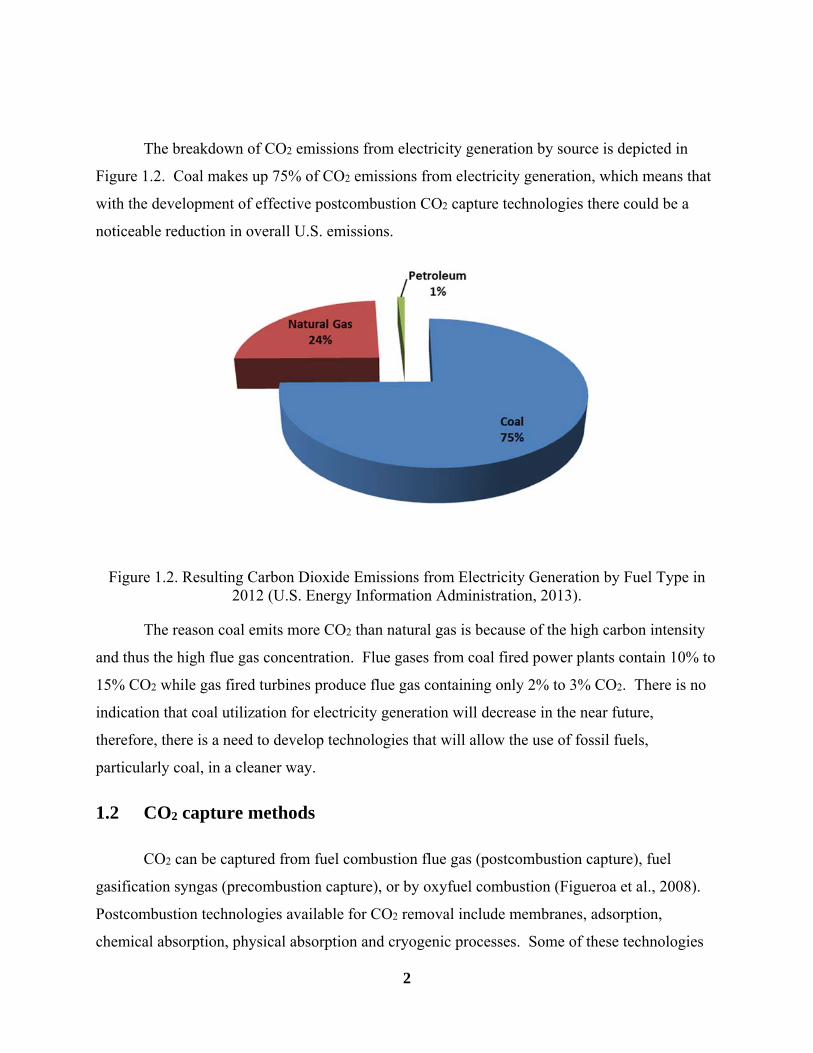
The breakdown of CO2 emissions from electricity generation by source is depicted in
Figure 1.2. Coal makes up 75% of CO2 emissions from electricity generation, which means that
with the development of effective postcombustion CO2 capture technologies there could be a
noticeable reduction in overall U.S. emissions.
Figure 1.2. Resulting Carbon Dioxide Emissions from Electricity Generation by Fuel Type in 2012 (U.S. Energy Information Administration, 2013).
The reason coal emits more CO2 than natural gas is because of the high carbon intensity
and thus the high flue gas concentration. Flue gases from coal fired power plants contain 10% to
15% CO2 while gas fired turbines produce flue gas containing only 2% to 3% CO2. There is no
indication that coal utilization for electricity generation will decrease in the near future,
therefore, there is a need to develop technologies that will allow the use of fossil fuels,
particularly coal, in a cleaner way.
1.2 CO2 capture methods
CO2 can be captured from fuel combustion flue gas (postcombustion capture), fuel
gasification syngas (precombustion capture), or by oxyfuel combustion (Figueroa et al., 2008).
Postcombustion technologies available for CO2 removal include membranes, adsorption,
chemical absorption, physical absorption and cryogenic processes. Some of these technologies
3
are well established and used commercially, while others are in need of additional process
improvements to be feasible.
1.2.1 Membranes
Selective membranes can be used to separate gases by exploiting differences in physical
or chemical interactions between gases and the membrane. Currently, membranes are used to
remove CO2 from natural gas streams which have a high pressure and a high concentration of
CO2. Advantages for the use of membranes in natural gas industry include no regeneration
energy, no moving parts and the membrane can be replaced depending on process conditions.
Some drawbacks for using membranes are their performance at high temperatures, where
selectivity and permeability still need to be improved for postcombustion CO2 capture
application (Kenarsari et al., 2013).
1.2.2 Adsorption
Adsorption involves the use of certain solids with a high surface area to separate CO2
from a gas mixture. These adsorbents are desorbed through a regeneration process. Examples of
solid adsorbents include zeolites, activated carbon, polymers and molecular sieves. In general, a
two bed system is used, where one bed is adsorbing CO2 while the other is being regenerated
using pressure, temperature or electrical swings. This technology has not proven to be cost
effective for a low value, high volume product like CO2 in power plant flue gas (Boot-Handford
et al., 2014).
1.2.3 Chemical absorption
Chemical absorption systems have been in use since the 1930’s for acid gas treating,
although until recently have not been looked at for large scale applications such as removing
CO2 from power plant flue gas. The system consists of an absorber and a desorber as well as a
cross exchanger. In this process, CO2 in the untreated flue gas will react counter currently with a
lean solvent solution in the absorption column. The CO2 rich solution is sent to the stripping
column where it is heated by steam from the reboiler and CO2 is stripped off from the hot
solution. The lean solvent is sent back to the absorption column while the product CO2 is sent on
for further dehydration and pressurization. The main energy penalties in this process occur from

4
the heat (steam) use needed to regenerate the solvent as well as the energy needed to further
compress the CO2 so it can be stored and transported (Boot-Handford et al., 2014).
1.2.4 Physical absorption
During physical absorption, the untreated flue gas is fed counter-currently with the
solvent in an absorption column. The CO2 is absorbed by the solvent, and then the rich solution
passes through a series of flash drums at varied pressures. The CO2 is released as a result of this
depressurization. The optimal temperature for physical absorption processes is 40°C and the
feed gas must be at high pressure with concentrated CO2. Based on these parameters physical
absorption is much more effective in pre-combustion processes such as extracting the CO2 from
natural gas or coal syngas.
1.2.5 Cryogenic processes
Using cryogenic technology to separate CO2 from other components is most feasible in
oxyfuel combustion and precombustion processes because of the high CO2 partial pressure
(pCO2). In this process compression, cooling, condensation and distillation steps are used to
produce liquid CO2. Applying this method to a postcombustion scenario, where a hot flue gas is
present with a relatively low CO2 partial pressure would result in a large energy penalty and a
low efficiency process.
While many of these acid gas removal processes show potential for CO2 absorption, the
use of chemical solvents are the most well developed and the most effective technique to remove
large quantities of CO2 at postcombustion conditions.
1.3 Chemical solvents for CO2 adsorption and absorption
Many chemical solvents have been studied to determine if they have the potential to
remove CO2 from flue gas at a commercial scale. This includes monoethanolamine (MEA),
diethanolamine (DEA), methyldiethanolamine (MDEA), diisopropanolamine (DIPA),
diglycolamine (DGA) and potassium carbonate (K2CO3). In general, most solvents are either
primary or secondary amines, with tertiary amines occasionally used. Besides being used in
single component solutions, many of these amines are combined into multicomponent mixtures
5
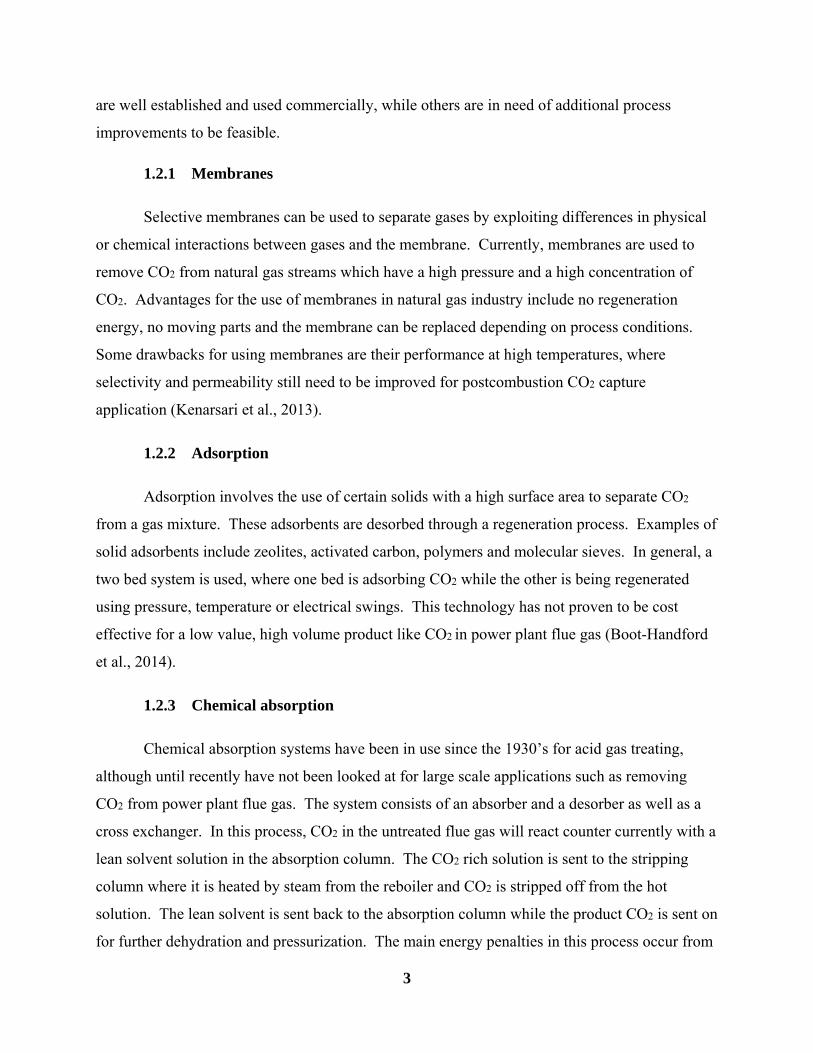
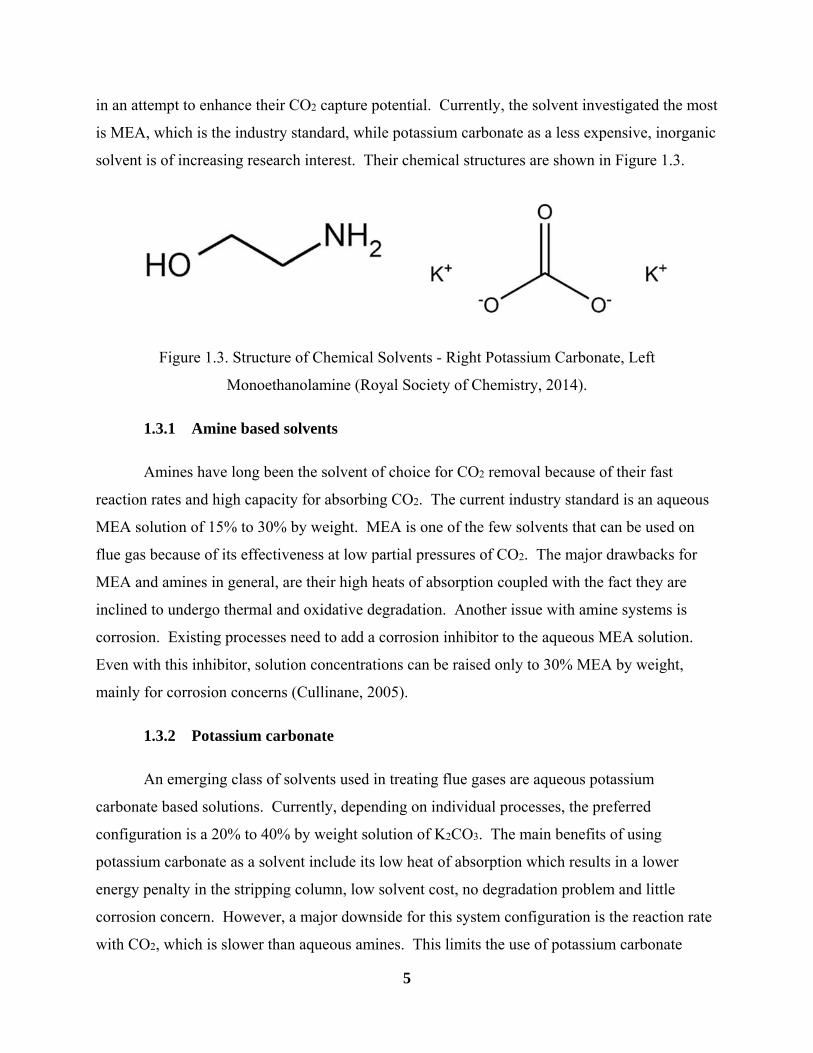
in an attempt to enhance their CO2 capture potential. Currently, the solvent investigated the most
is MEA, which is the industry standard, while potassium carbonate as a less expensive, inorganic
solvent is of increasing research interest. Their chemical structures are shown in Figure 1.3.
Figure 1.3. Structure of Chemical Solvents - Right Potassium Carbonate, Left
Monoethanolamine (Royal Society of Chemistry, 2014).
1.3.1 Amine based solvents
Amines have long been the solvent of choice for CO2 removal because of their fast
reaction rates and high capacity for absorbing CO2. The current industry standard is an aqueous
MEA solution of 15% to 30% by weight. MEA is one of the few solvents that can be used on
flue gas because of its effectiveness at low partial pressures of CO2. The major drawbacks for
MEA and amines in general, are their high heats of absorption coupled with the fact they are
inclined to undergo thermal and oxidative degradation. Another issue with amine systems is
corrosion. Existing processes need to add a corrosion inhibitor to the aqueous MEA solution.
Even with this inhibitor, solution concentrations can be raised only to 30% MEA by weight,
mainly for corrosion concerns (Cullinane, 2005).
1.3.2 Potassium carbonate
An emerging class of solvents used in treating flue gases are aqueous potassium
carbonate based solutions. Currently, depending on individual processes, the preferred
configuration is a 20% to 40% by weight solution of K2CO3. The main benefits of using
potassium carbonate as a solvent include its low heat of absorption which results in a lower
energy penalty in the stripping column, low solvent cost, no degradation problem and little
corrosion concern. However, a major downside for this system configuration is the reaction rate
with CO2, which is slower than aqueous amines. This limits the use of potassium carbonate

6
solutions in applications where a high percentage of the CO2 must be removed because the
height of the absorption column needed would be unrealistic (Kothandaraman et al., 2009).
1.3.3 Ideal solvent properties
In creating a CO2 capture system that will be cost effective enough to be feasible
economically, improvements to the current processes must occur. The most important of these
advances will be the development of more effective solvents. Important solvent properties
include fast CO2 absorption rate, high CO2 capacity, low regeneration energy requirements, low
degradation rates, low solvent costs and low corrosivity. Solvents with a fast reaction rate will
result in a smaller absorber, less packing and reduced pressure drop. The absorber could be
operated closer to equilibrium, which would result in a CO2 richer solution and thus a more
efficient stripper and lower regeneration costs. High capacity solvents result in a lower
circulation rate and a lower energy requirement for regeneration. A low corrosivity solvent can
be used with equipment made of carbon steel, instead of stainless steel, which will reduce capital
costs. There will be a tradeoff between solvent cost and benefits derived from its use, making
the utilization of an inexpensive bulk material important (Cullinane, 2002).
1.4 Carbonate based technology
Based on the ideal solvent properties laid out in the previous section, potassium carbonate
solutions are a good fit for large scale CO2 capture, except for their slow absorption rate of CO2.
If these reaction rates can be improved to levels of standard amine solvents, these carbonate
solutions can achieve efficiency improvements in other parts of the capture process.
1.4.1 Promoters studies
To achieve a chemical solvent with as many of the desired characteristics outlined in the
previous section as possible, it is likely there will need to be a mixture of at least two
components. While some experimental solutions have used mixtures of amines, many utilize a
potassium carbonate based solution with a small dosage of an amine. This is in an effort to
capture the fast reaction rate of the amine, while taking advantage of the lower heat of absorption
and thus more energy efficient regeneration potential of potassium carbonate. Using potassium
carbonate as the bulk solution, Tseng et al. (1988) investigated CO2 absorption into promoted
7
solutions using DEA. For carbonate conversions below 30%, the reaction rate was controlled by
the rate of formation of zwitterion intermediate, while at carbonate conversions above 30% the
rate was controlled by abstraction rate of proton from the zwitterion intermediate.
Cullinane (2005) experimented with the thermodynamics and kinetics of a different
promoter, piperazine (PZ), with a potassium carbonate bulk solution. Carbamate intermediates
were only minor components of the solution. Most of the absorption resulted in protonation of
PZ. Capacity of the 0 to 3.1 m (mol/kg water) concentrated potassium carbonate and 0.45 to 3.6
m PZ solutions were comparable or better than MEA over a range of different pCO2. Absorption
rates in the solutions were 2 to 3 times faster than 5 M MEA at a constant pCO2. The only
limitation found was the fact the solvent’s components were solids at room temperature. As a
result the absorption needs to be run at an elevated temperature, or the concentrations of the
potassium carbonate and PZ decreased.
Chen (2007) continued the work of Cullinane by expanding testing from lab scale to a
pilot plant. A 5 m concentrated potassium carbonate and 2.5 m PZ solution was found to be 2
times faster reacting than a 7 M MEA solution. However, in measuring the heat duty for
desorption of CO2 from the stripper, the energy required was higher than MEA. Even though
these indicators of performance were found to be equal or better than MEA, on this large scale
there were a lot of problems with the solubility of the solution. These resulted in periodic
interruptions in instrumentation from solids being present, as well as complete shutdown of the
plant on several occasions. Thee et al. (2009) studied CO2 capture by a potassium carbonate
solution promoted with MEA. Using a lab scale setup they found the addition of MEA
accelerated the apparent pseudo first order rate constant of unpromoted potassium carbonate, and
therefore, the overall absorption of CO2 into potassium carbonate solutions was improved.
1.4.2 Reaction mechanism of piperazine promoted potassium carbonate
Promoting the reaction rate of PCB with PZ has advantages over using traditional amine
promoters. These advantages include PZ being able to react with two moles of CO2 per mole of
amine, because PZ is a diamine. It also has a higher capacity for CO2 absorption than other
amines. Another positive attribute is the high pKa which is close in value to MEA; a high pKa
usually leads to a fast rate of absorption. Lastly, since there is a large amount of PCB in the

8
solution, it acts as a buffer and reduces the protonation of the amine, leaving more free amine to
react with CO2 (Cullinane, 2005).
The following system has been proposed for the mechanism of which CO2 absorbs into an
aqueous PCB/PZ system according to Hillard (2005):
2 ↔ (R1.1)
2 ↔ (R1.2)
↔ (R1.3)
↔ (R1.4)
↔ (R1.5)
↔ (R1.6)
↔ (R1.7)
The different structures of piperazine in this reaction are depicted in Fig. 1.4.
Figure 1.4. Structures of piperazine in the presence of CO2
1.4.3 Other processes under development
One carbonate process under development is by Shell, with special attention paid to the
precipitation aspect. After the absorption column, a crystallizer is used along with a
hydrocyclone to better concentrate the carbonate solution sent to the regenerator. An accelerator
is used to enhance mass transfer of CO2 to the liquid phase. This process has the potential for
low energy consumption, options for heat integration to dissolve solids and if a nonvolatile
9
accelerator is used, a water wash may not be required and there will be no amine emissions to the
atmosphere. A pilot plant investigation has been completed; there was a potential of a total
reboiler energy requirement of 2.2 to 2.5 MJ/kg CO2 (Moene et al., 2013).
An Australian group has been working on a process using precipitating potassium
carbonate. The benefits over traditional amines include low regeneration energy (2 to 2.5
GJ/tonne CO2), savings of over $20/tonne CO2 than competing amines, and low volatility and
environmental impact. They also are focusing on better heat integration throughout the process.
A pilot plant has been set up (Anderson et al., 2013).
Akermin is investigating a carbonate based technology which is catalyzed with enzymes
which increase the rate of CO2 hydration to bicarbonate. A key part of this technology is the
biocatalyst delivery system. The enzyme is formulated and suspended directly on the structured
packing material that is placed in the absorption column. Currently a carbonic anhydrase
enzyme developed by Novozymes is yielding the best results because its properties fit well with
the process conditions. Using this enzyme, the height of the absorption column can be reduced
by up to 90% when a 20 wt% K2CO3 is used over uncatalyzed K2CO3 (Black et al., 2012).
1.5 Other emerging absorption technologies
1.5.1 Advanced amines
Amine solvents have long been used for CO2 absorption; however, marked improvements
are being made in both the formulation of new solvents, and modifications to the process to
increase efficiency. One example is the use of an 8 M piperazine (PZ) solution, which has twice
the rate of CO2 absorption and 1.8 times the intrinsic working capacity of traditional 30 wt%
MEA. Since 2001 the reboiler heat duty for amine scrubbing has improved from 5.5 MJ/tonne
CO2 to as low as 2.6 MJ/tonne CO2 in 2012 (Boot-Handford et al., 2014). Many companies use
proprietary solvents as well as advanced heat integration techniques to further decrease their
parasitic energy loss.
1.5.2 Amino acid salts
Another class of solvents for CO2 capture application is amino acid salts. They are being
investigated because of their fast reaction kinetics, high achievable cyclic loadings, good stability

10
towards oxygen and favorable CO2 binding energy. One advantage of using theses salts is for
high CO2 loading, precipitation will occur. Either bicarbonate salt or the neutral amino acid can
precipitate out, resulting in increased absorption capacity. The majority of the testing done is on
the laboratory scale and performance has been dependent on individual amino acid salts tested.
1.5.3 Ionic Liquids
Ionic liquids (ILs) are a recent introduction to the CO2 capture conversation, as a
potential replacement for traditional amines. A major issue that has been associated with CO2
removal by amine circulation has been solvent degradation and the various problems it presents.
Degradation can cause solvent loss, corrosion, fouling and foaming. ILs have negligible vapor
pressure, tunable chemical properties, low regeneration energy and a wide liquid temperature
range. They function with limited water, which decreases energy requirements. Certain ILs
comprised of amine or carboxylate functional groups are preferential for CO2 capture under low
pressure, such as postcombustion capture. The main drawback to ILs is they are highly viscous,
expensive, tend to not be stable to water vapor and flue gas impurities and have low CO2
absorption capacity per unit of mass (Kenarsari et al., 2013).
1.5.4 CO2 binding organic liquids
This new class of solvent is a mixture of alcohols and organic bases which reversibly
react with CO2. In amine based CO2 capture, the efficiency is tied to the amount of water in the
process. Binding organic liquids (BOLs) can be used in the presence of water without adverse
effects, but do not require large amounts. CO2 BOLs have 2 to 3 times higher capacity than
aqueous alkanolamines. The difference in chemistry is the CO2 is bound as an alkylcarbonate
salt instead of a carbamate based salt. Early CO2 BOLs had potential, but the vapor pressure was
too high. Second generation BOLs are nonvolatile single component systems that react
reversibly with CO2. This resulted in a lower cost and decreased solvent regeneration energy;
the stripping of CO2 from these liquids consumes low energy. CO2 BOLs have potential, but
further investigation is needed to explore the potential of these solvents for real CO2 capture
applications (Kumar et al., 2014).

11
1.6 Project background
Currently, a Hot Carbonate Absorption Process with Crystallization Enabled High
Pressure Stripping (Hot-CAP) is under development at the University of Illinois at
Urbana-Champaign (Fig. 1.5). Flue gas CO2 is absorbed into a potassium carbonate/bicarbonate
(K2CO3/K2CO3 or PCB) solution at 70ºC and atmospheric pressure. After the CO2 rich PCB
solution exiting the absorption column is cooled, KHCO3 crystals are formed at 35ºC. Solid
crystals are filtered which produces a bicarbonate slurry that is fed to the stripper after it is
preheated by the hot regenerated lean solution coming from the stripper. The slurry has higher
CO2 loading than a traditional CO2 rich solution, thus enabling high pressure CO2 stripping (10
atm) at temperatures ranging from 140°C to 200ºC.
Figure 1.5. Simplified schematic diagram of Hot-CAP process.
The chemistry involved in the Hot-CAP employing an organic promoter/catalyst for CO2
absorption followed by regeneration of the promoter/catalyst from the CO2 rich solution,
together with crystallization of bicarbonate and CO2 stripping, is shown in Figure 1.6. During the
absorption process, CO2 absorbed by the organic promoter and the carbonate provides the
capacity for CO2 absorption (Fig. 1.6, Rx(A)). CO2 absorption rate into the combined solution is
dominated by the fast CO2 promoter reaction instead of the direct CO2 carbonate reaction.
Depending on specific organic promoters selected, the reaction products carbamate (R2NCOO-)
and/or bicarbonate ions (HCO3-) can be formed. For example, primary and secondary amines
result in more stable carbamate products; whereas, in case of sterically hindered amines (or
Lean Solution
Filter
Flue gas
Cleaned gas
Absorber
Rich Solution
High Pressure Stripper
Reboiler
Steam
High Pressure CO2
CO2 stream
Crystallization Tank
SO42-
Removal
Slurry pump
Slurry
12
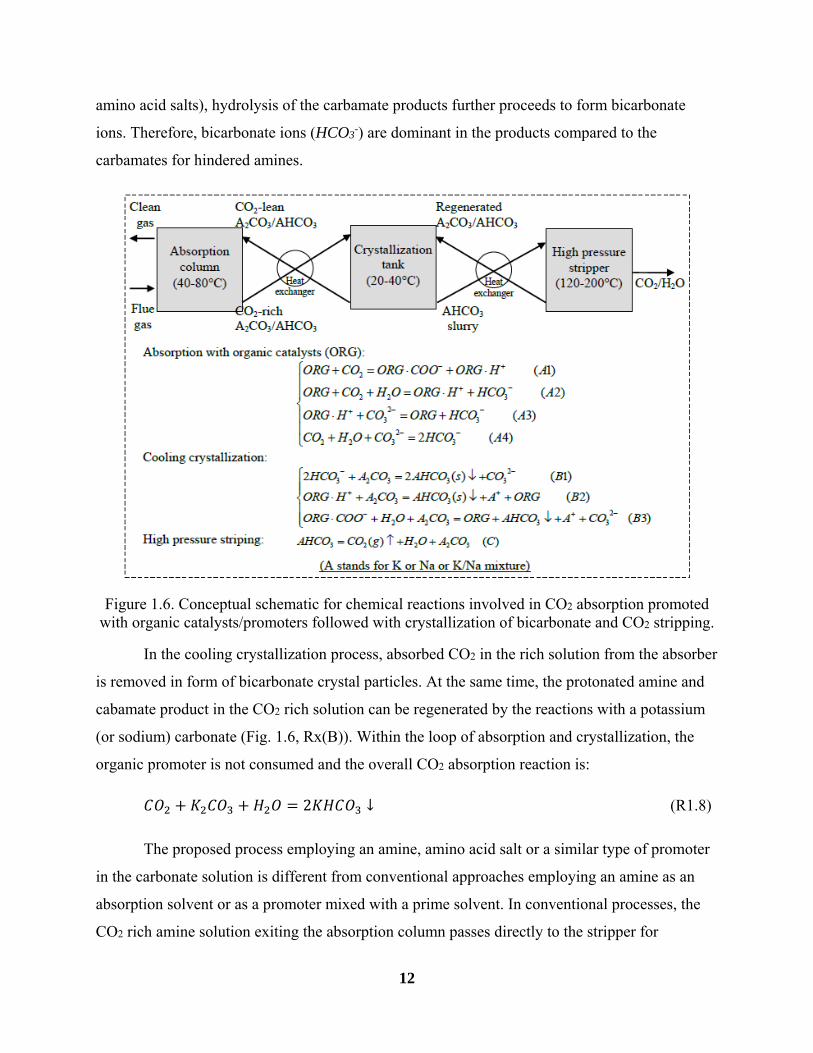
amino acid salts), hydrolysis of the carbamate products further proceeds to form bicarbonate
ions. Therefore, bicarbonate ions (HCO3-) are dominant in the products compared to the
carbamates for hindered amines.
Figure 1.6. Conceptual schematic for chemical reactions involved in CO2 absorption promoted with organic catalysts/promoters followed with crystallization of bicarbonate and CO2 stripping.
In the cooling crystallization process, absorbed CO2 in the rich solution from the absorber
is removed in form of bicarbonate crystal particles. At the same time, the protonated amine and
cabamate product in the CO2 rich solution can be regenerated by the reactions with a potassium
(or sodium) carbonate (Fig. 1.6, Rx(B)). Within the loop of absorption and crystallization, the
organic promoter is not consumed and the overall CO2 absorption reaction is:
2 ↓ (R1.8)
The proposed process employing an amine, amino acid salt or a similar type of promoter
in the carbonate solution is different from conventional approaches employing an amine as an
absorption solvent or as a promoter mixed with a prime solvent. In conventional processes, the
CO2 rich amine solution exiting the absorption column passes directly to the stripper for

13
regenerating the amine. In our process the organic solvent in the CO2 rich solution is used as a
promoter or CO2 carrier during the absorption and also can be regenerated during crystallization
of the bicarbonate product. The amine promoter is circulated within the loop of absorption and
crystallization without entering the stripping column. The bicarbonate salt (in the form of slurry
derived from bicarbonate crystal particles formed in the cooling crystallization process) rather
than the CO2 laden promoter carbonate/bicarbonate solution is present in the stripper for CO2
stripping and solvent regeneration (Fig. 1.6, Rx(C)).
The Hot-CAP process has advantages over the traditional MEA process and conventional
PCB processes. The benchmark MEA process is energy intensive due to a high heat of reaction,
low working capacity and low stripping pressure. In the Hot-CAP process, we remedy each of
these shortcomings of the MEA process to increase the energy efficiency of CO2 capture. Both
absorption and stripping take place at higher temperatures than the MEA process, while stripping
is performed at a an increased pressure (8 to 40 atm), resulting in reductions in stripping heat
associated with water vaporization in the stripper and CO2 compression work prior to
transportation. PCB is used at a concentration of 40 wt% while MEA uses only 30 wt% (5 M).
The Hot-CAP process also solves the problems of solvent degradation and corrosion, in addition
to eliminating a unit operation by not needing flue gas desulfurization (FGD) prior to CO2
absorption.
Experimental studies are being conducted to investigate kinetic and thermodynamic
performances of the major unit operations, (CO2 absorption, KHCO3 precipitation, CO2
stripping, combined SO2 removal and CO2 capture) under the typical conditions of the Hot-CAP
process. This work is focused on addressing the issue associated with a slow rate of CO2
absorption into a carbonate solution compared to that of an amine solution.
1.6.1 Objectives and importance of research
The main objective of this research was to find an appropriate promoter for a
concentrated carbonate solution that increased the rate of CO2 absorption to a level equal to or
above that of the benchmark MEA solvents. The new ideas included performing the absorption
at elevated temperatures (~70°C), using a highly concentrated PCB solution (~40 wt%), and
14
testing various combinations of PCB and promoters. The effect of precipitates on the absorption
also was investigated.
1.6.2 Scope of work
Our work focused on the development of rate promoters for a concentrated potassium
carbonate system to be used in the Hot-CAP process. Initial tests of many amine promoters and
amino acid salts were performed using a stirred tank reactor, to evaluate levels of promotion
compared to unpromoted PCB as well as benchmark MEA solvents. The amine promoters with
the highest absorption rates were tested more vigorously on a bench scale, packed bed column
simulating real process conditions. Effects of different variables were tested to measure their
impact on CO2 absorption rate. Other carbonate salt systems with promoters, including a sodium
carbonate-bicarbonate system (SCB) and a PCB/SCB mixture solution, were tested. Results of
the promoted carbonate bench scale tests were compared to a typical amine solvent to evaluate
their feasibility.
15
Chapter 2 Screening of Promoters to Accelerate CO2 Absorption into
K2CO3/KHCO3 Solutions
2.1 Introduction
Five primary and secondary amine promoters were investigated under conditions typical
of the Hot-CAP process. Rates of absorption into concentrated K2CO3/KHCO3 (PCB) solutions
promoted with these promoters at elevated temperatures were investigated and compared to
unpromoted PCB solutions and 5 M monoethanolamine (MEA) solvents. Amino acids were
tested at the same conditions, both as stand alone absorbents and rate promoters for PCB
solutions.
2.2 Experimental methods
2.2.1 Experimental Equipment
The experimental setup consisted of a stirred tank reactor (STR), a gas supply/control
unit and data acquisition instruments. The reactor was a Plexiglas vessel with a 4 inch I.D. and 7
inches in height. Four symmetrical baffles, each 0.5 inches wide, were attached inside the vessel
to prevent vortex formation in the liquid phase. A magnetic stirrer (VWR Scientific, Series 400
HPS) with a 2 inch Teflon stir bar provided mixing for the liquid phase at the desired speed. A
stirrer driven by an external motor (Caframo, model BCD2002) via a magnetic coupling (MMC
magnetics, FCM-1) provides mixing for the gas phase up to 3,000 rpm. Temperature control of
the reactor was achieved by water circulation through a stainless steel coil (0.6 cm I.D.) inside
the reactor. The water temperature was controlled by a thermostatic water bath (VWR Scientific,
model 1140A). The pressure of the gas stream into the reactor was controlled/ measured by a
pressure transducer (Alicat Scientific, PC- 30PSIA-D/5P). The temperature inside the reactor
was measured by a thermocouple (Omega, Type K, model KMQSS-125-G-6). A vacuum pump
(Dekker, RVL002H-01) was used to achieve the required initial vacuum level for the system.
The pressure and temperature readings were monitored and recorded by a computer through a
National Instrument Digital Data Acquisition Systems (NI USB 6009). A schematic diagram
and picture of the system are shown in Fig. 2.1.

16
Figure 2.1. Schematic and photograph of STR experimental system.
2.2.2 Experimental Procedure and Conditions
When conducting an experiment in the STR, the system operated under batch mode.
First, the system was evacuated by the vacuum pump. A gas stream of pure CO2 was introduced,
in a short burst, into the reactor to a desired pressure. The change in total gas pressure with
respect to time was recorded, from which the pCO2 was obtained by subtracting the water vapor
pressure. Since pure CO2 was used under vacuum conditions, the mass transfer resistance in the
gas phase was minimal and neglected during kinetic calculations.
Using this testing procedure, different parameters were investigated to determine their
effect on the rate of CO2 absorption into the PCB solution. First, baseline tests were performed
with a high concentration PCB (40 wt%, K2CO3 equivalent) at elevated temperatures (60° to
80°C) because these conditions were representative of the Hot-CAP absorption process. The
total PCB concentration was varied, as well as the CTB (carbonate to bicarbonate) conversion of
the solution to evaluate their effects on CO2 absorption. The full test matrix can be seen in Table
2.1.
After the baseline absorption removal rates of the unpromoted PCB solutions were
established, different amine rate promoters were added to determine their effect on CO2
absorption. Five primary and secondary amines, including diethanolamine (DEA), aminomethyl
propanol (AMP), piperazine (PZ), hexamethylene diamine (HDA) and hexylamine (HA), were
tested in varying dosages. The majority of the tests were performed using the lean PCB solution
(PCB40-20, 40 wt% PCB (K2CO3 equivalent), 20% CTB conversion) and selected promoters
were tested in the CO2 rich solution (PCB40-40) to determine if there was any change in
17
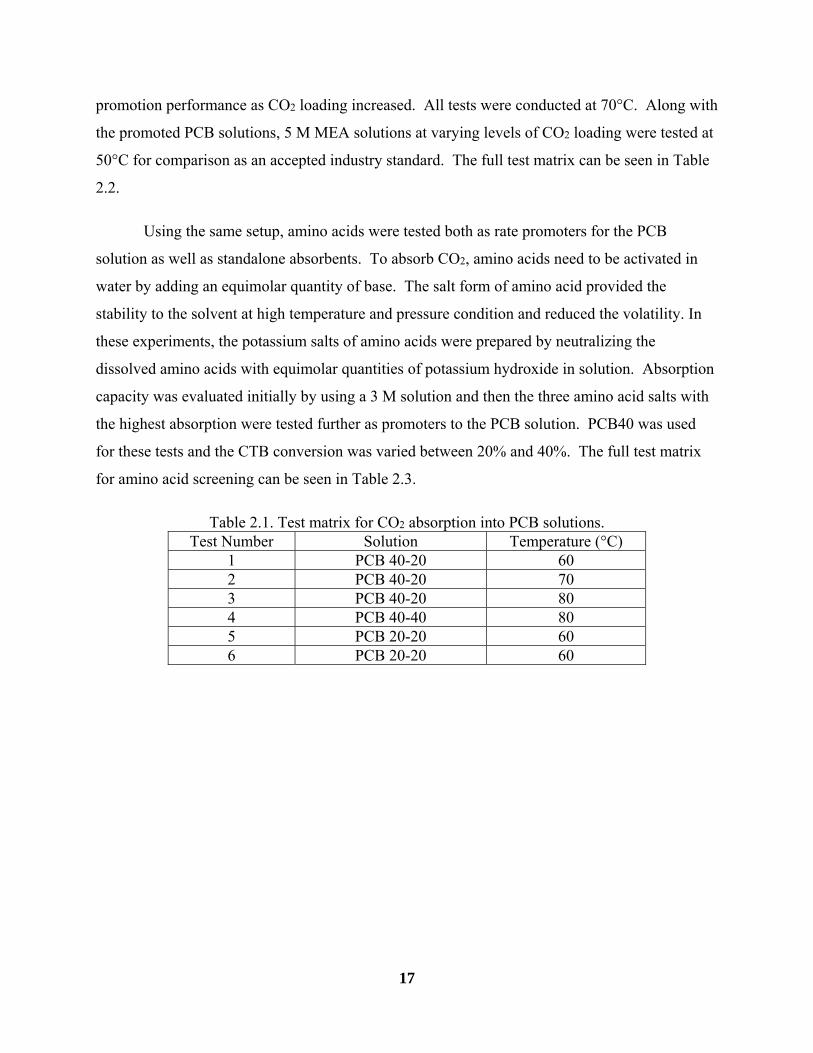
promotion performance as CO2 loading increased. All tests were conducted at 70°C. Along with
the promoted PCB solutions, 5 M MEA solutions at varying levels of CO2 loading were tested at
50°C for comparison as an accepted industry standard. The full test matrix can be seen in Table
2.2.
Using the same setup, amino acids were tested both as rate promoters for the PCB
solution as well as standalone absorbents. To absorb CO2, amino acids need to be activated in
water by adding an equimolar quantity of base. The salt form of amino acid provided the
stability to the solvent at high temperature and pressure condition and reduced the volatility. In
these experiments, the potassium salts of amino acids were prepared by neutralizing the
dissolved amino acids with equimolar quantities of potassium hydroxide in solution. Absorption
capacity was evaluated initially by using a 3 M solution and then the three amino acid salts with
the highest absorption were tested further as promoters to the PCB solution. PCB40 was used
for these tests and the CTB conversion was varied between 20% and 40%. The full test matrix
for amino acid screening can be seen in Table 2.3.
Table 2.1. Test matrix for CO2 absorption into PCB solutions. Test Number Solution Temperature (°C)
1 PCB 40-20 60 2 PCB 40-20 70 3 PCB 40-20 80 4 PCB 40-40 80 5 PCB 20-20 60 6 PCB 20-20 60

18
Table 2.2 Test matrix for CO2 absorption into promoted PCB and MEA solutions. Test Number Solution Temperature (°C)
1 PCB 40-20+ 0.6M DEA 70 2 PCB 40-20+ 1.2M DEA 70 3 PCB 40-20+ 0.5M AMP 70 4 PCB 40-20+ 1M AMP 70 5 PCB 40-20+ 0.5M PZ 70 6 PCB 40-20+ 1M PZ 70 7 PCB 40-20+ 0.5M HDA 70 8 PCB 40-20+ 1M HDA 70 9 PCB 40-20+ 1M HA 70 10 PCB 40-40+ 1M HDA 70 11 PCB 40-40+ 1M PZ 70 12 PCB 40-40+ 1M AMP 70 13 5M MEA, CO2 loading: 0 mol CO2/mol MEA 50 14 5M MEA, CO2 loading: 0.1 mol CO2/mol MEA 50 15 5M MEA, CO2 loading: 0.2 mol CO2/mol MEA 50
Table 2.3. Test matrix for CO2 absorption into K-Amino Acid salt solutions and amino acid salt-
promoted PCB solutions. Test Number Solution Temperature (°C)
1 3M K-Glycine 70 2 3M K-Sacrosine 70 3 3M K-Proline 70 4 3M K-Taurine 70 5 3M K-Alanine 70 6 PCB 40-20+1M K-Glycine 70 7 PCB 40-20+1M K-Sacrosine 70 8 PCB 40-20+1M K-Proline 70 9 PCB 40-40+1M K-Glycine 70 10 PCB 40-40+1M K-Sacrosine 70
2.2.3 Determination of CO2 Absorption Rate
When gas absorption takes place in a stirred cell reactor, Equation 2.1 can be derived
based on the conservation of mass, the ideal gas law, and Henry’s law. The mass transfer
resistance in the gas phase is minimal and can be neglected. The instantaneous rate of CO2
absorption into the liquid phase can be calculated from the change of CO2 partial pressure over
time (Kucka et al., 2003):

19
∗ ∗
(2.1)
where R is the absorption flux of CO2; VG is the volume of the gas phase; A is the gas liquid
interfacial area; Rgas is the universal gas constant; T is the temperature; Pi is the CO2 partial
pressure and t is time. This absorption rate is used to compare the performance of different
solutions.
2.3 Results and discussion
2.3.1 CO2 absorption into reference PCB solutions
2.3.1.1 Reaction mechanism for un-promoted PCB
CO2 is absorbed into the PCB solution based on the following overall reaction:
↔ 2 (R2.1)
The following elementary steps make up this overall reaction (Augugliaro & Rizzuti, 1987;
Cents et al., 2001; Cents et al., 2005; Ghosh et al., 2009; Pohorecki & Moniuk, 1988; Vázquez et
al., 1997):
↔ (R2.2)
↔ (R2.3)
↔ (R2.4)
↔ (R2.5)
Under certain conditions, the overall reaction can be modeled as pseudo first order with respect
to CO2. This rate is a linear function of the hydroxide ion concentration; therefore, R2.2 and
R2.4 are the most important rate determining steps (Alper & Deckwer, 1980; Cents et al., 2001;
Danckwerts, 1968; Vázquez et al., 1997).

20
2.3.1.2 Results of CO2 absorption into unpromoted PCB solutions
The effect of the temperature on the rate of CO2 absorption into the PCB40-20 solution is
shown in Fig. 2.2. Henry’s constant, which indicates CO2 solubility, and reaction kinetics both
strongly depend on the temperature. As the temperature increases, the CO2 solubility decreases,
while the rate constant of the absorption reaction increases. The net effect of the temperature on
the CO2 absorption rate depends on which property undergoes a greater change. Increasing the
reaction temperature from 60°C to 80°C improved the CO2 absorption rates, which indicated an
increase in temperature was beneficial for promoting the CO2 absorption rates into the 40 wt%
PCB solution.
Figure 2.2. Absorption of CO2 into PCB40-20 solution at varying temperatures.
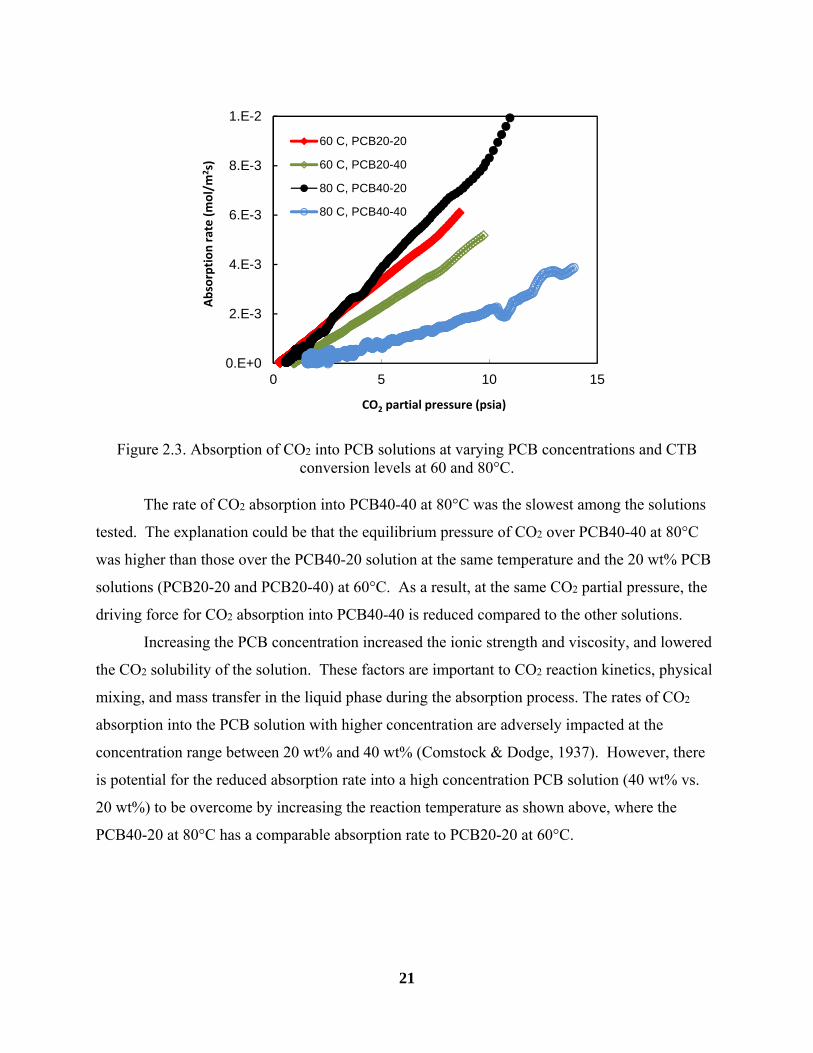
The absorption of CO2 into PCB40-20 and PCB40-40 at 80°C, and PCB20-20 and
PCB20-40 at 60°C is depicted in Fig. 2.3. The higher the CTB conversion level, the lower the
CO2 absorption rate for the PCB solution with the same concentration and temperature. This
tendency was greater for the 40 wt% PCB solution tested at 80°C.
0.E+0
2.E-3
4.E-3
6.E-3
8.E-3
1.E-2
0 5 10 15
Absorption rate (mol/m
2s)
CO2 partial pressure (psia)1
60 C, PCB40-20
70 C, PCB40-20
80 C, PCB40-20
21
Figure 2.3. Absorption of CO2 into PCB solutions at varying PCB concentrations and CTB conversion levels at 60 and 80°C.
The rate of CO2 absorption into PCB40-40 at 80°C was the slowest among the solutions
tested. The explanation could be that the equilibrium pressure of CO2 over PCB40-40 at 80°C
was higher than those over the PCB40-20 solution at the same temperature and the 20 wt% PCB
solutions (PCB20-20 and PCB20-40) at 60°C. As a result, at the same CO2 partial pressure, the
driving force for CO2 absorption into PCB40-40 is reduced compared to the other solutions.
Increasing the PCB concentration increased the ionic strength and viscosity, and lowered
the CO2 solubility of the solution. These factors are important to CO2 reaction kinetics, physical
mixing, and mass transfer in the liquid phase during the absorption process. The rates of CO2
absorption into the PCB solution with higher concentration are adversely impacted at the
concentration range between 20 wt% and 40 wt% (Comstock & Dodge, 1937). However, there
is potential for the reduced absorption rate into a high concentration PCB solution (40 wt% vs.
20 wt%) to be overcome by increasing the reaction temperature as shown above, where the
PCB40-20 at 80°C has a comparable absorption rate to PCB20-20 at 60°C.
0.E+0
2.E-3
4.E-3
6.E-3
8.E-3
1.E-2
0 5 10 15
Absorption rate (mol/m
2s)
CO2 partial pressure (psia)1
60 C, PCB20-20
60 C, PCB20-40
80 C, PCB40-20
80 C, PCB40-40

22
2.3.2 Screening of amine promoters
2.3.2.1 Reaction mechanism for PCB promoted with amines
Addition of amines or similar types of promoters (such as amino acid salts) into the PCB
solution can enhance the absorption rate by a “shuttle mechanism” (Bosch et al., 1989). When a
primary or secondary amine promoter is added to the carbonate solution, the reactions consist of
a sequence of elementary steps as follows.
2 ←→ (R2.6)
←→ (R2.7)
←→ (R2.8)
←→ (R2.9)
←→ (R2.10)
Where B is a base, R2NH is an amine and R2NCOO- is a carbamate intermediate.
In the promoted absorption, fast CO2 absorption reactions occur with amines near the
interface (R2.6), followed by regeneration of reaction products (reverse R2.6, R2.7 and R2.8) by
the carbonate in the bulk of the solution. The slow reaction in the bulk carbonate solution (R2.9,
R2.10) serves as a sink for CO2. The regeneration of amine reaction products depends on the
activity of base component (B) to attract protons; in this case amine is the most important base.
In comparison, in the carbonate solution without a promoter, R2.9 and R2.10 are the most
important and R2.10 is slow under low alkaline conditions.
2.3.2.2 Results of amine promoter screening
Rates of CO2 absorption into unpromoted and promoted PCB40-20 solutions at a
temperature typical of Hot-CAP absorption (70C) are depicted in Fig. 2.4. In preliminary
studies, all five amine promoters, depending on the type and dosage of amines, enhanced the rate
of absorption to various extents. Absorption rates were promoted by 3.5 to 50 times compared to
the unpromoted PCB solution when the pCO2 was between 1 and 5 psia. Among the five
amines, at the same dosage (1 or 0.5 M), PZ and AMP had the highest potential rate of
promotion, followed by HDA.

23
Figure 2.4. Rates of CO2 absorption into promoted PCB40-20 at 70ºC.
When applied to an absorption column setup, the PCB solution travels down the height of
the column and the constant CO2 absorption causes an increase in CO2 loading. Depending on
the amount of CO2 absorbed, or the CO2 loading, the absorption rate will decrease down the
column because of a decrease in driving force. Thus, it is essential to measure the absorption
rate into the solution with different CO2 loading levels to study how absorption rate varies along
the absorption column. PCB40-20 was employed to simulate the CO2 lean solution at the top of
the absorption column and PC40-40 for the CO2 rich solution at the lower part of the column.
Over the duration of a test in the STR, the change in CTB of the solution was negligible. In
these experiments, 1 M PZ, AMP or HDA promoter was added to the PCB solutions. These
promoters were selected based on their potential for promoting the CO2 absorption rate. Results
of these tests are shown in Fig. 2.5.
0.0E+00
5.0E-03
1.0E-02
1.5E-02
2.0E-02
2.5E-02
3.0E-02
0 1 2 3 4 5
Absorption rate (mol/m
2.sec)
pCO2 (psia)
PC40-20
PC40-20+ 0.6M DEA
PC40-20+ 1.2M DEA
PC40-20+ 0.5M AMP
PC40-20+ 1M AMP
PC40-20+ 0.5M PZ
PC40-20+ 1M PZ
PC40-20+ 0.5M HDA
PC40-20+ 1M HDA
PC40-20+ 1M HA

24
Figure 2.5. CO2 absorption rates into promoted PCB40-20 and PCB40-40 solutions at 70ºC. The CO2 absorption rate into the PCB40-40 with the addition of 1 M AMP was 2 to 3
times lower than that of the PCB40-20 with the same promoter; however, for 1 M PZ and HDA
promoters in the PCB40-40 and PCB40-20 solutions, the difference between absorption rates
was 5 to 6 times lower under the same conditions. The decrease in absorption rate as the CTB
increased from 20% to 40% was expected because the driving force of CO2 absorption into
PCB40-40 was smaller.
2.3.2.3 Comparison between promoted PCB solution and MEA solution
In Fig. 2.6, CO2 absorption rates into PCB40-20 with additions of 1 or 1.2 M of amine
promoters were compared with those into 5 M MEA solutions. Fresh 5 M MEA solution and
solutions loaded with 0.1 or 0.2 mol CO2/mol MEA, were selected for the comparison.
Compared to the MEA solution with 0.2 mol/mol CO2 loading at 50ºC (a lean condition typical
of MEA processes), absorption rates into the PCB40-20 (a lean condition typical of Hot-CAP)
promoted with 1 M PZ, 1 M AMP or 1 M HDA at 70ºC were higher at CO2 partial pressures
greater than 2 psia and comparable at lower partial pressures.
0.0E+00
5.0E-03
1.0E-02
1.5E-02
2.0E-02
2.5E-02
3.0E-02
0 1 2 3 4 5
Absorption rate (mol/m
2sec)
pCO2 (psia)
PC40-40+1M AMP
PC40-40+1M PZ
PC40-40+1M HDA
PC40-20+1M AMP
PC40-20+1M PZ
PC40-20+1M HDA

25
Figure 2.6. CO2 absorption rates into promoted PCB40-20 solutions at 70ºC and 5 M MEA solutions at 50ºC.
Also shown in Fig. 2.6, the MEA solutions exhibited a similar trend with respect to the
impact of CO2 loading on the absorption rate. For example, compared to the fresh MEA,
absorption rates into the 5 M MEA loaded with 0.1 or 0.2 mol CO2/mol MEA decreased by 25%
and 60%, respectively. In a typical MEA process, the CO2 rich solution can contain more than
0.4 mol CO2/mol MEA. With the use of amine promoters, CO2 absorption rate into a PCB
solution can be enhanced to levels above or equal to that of 5 M MEA.
2.3.3 Screening of Amino Acid Salt Promoters
2.3.3.1 Absorption into amino acid salt solution
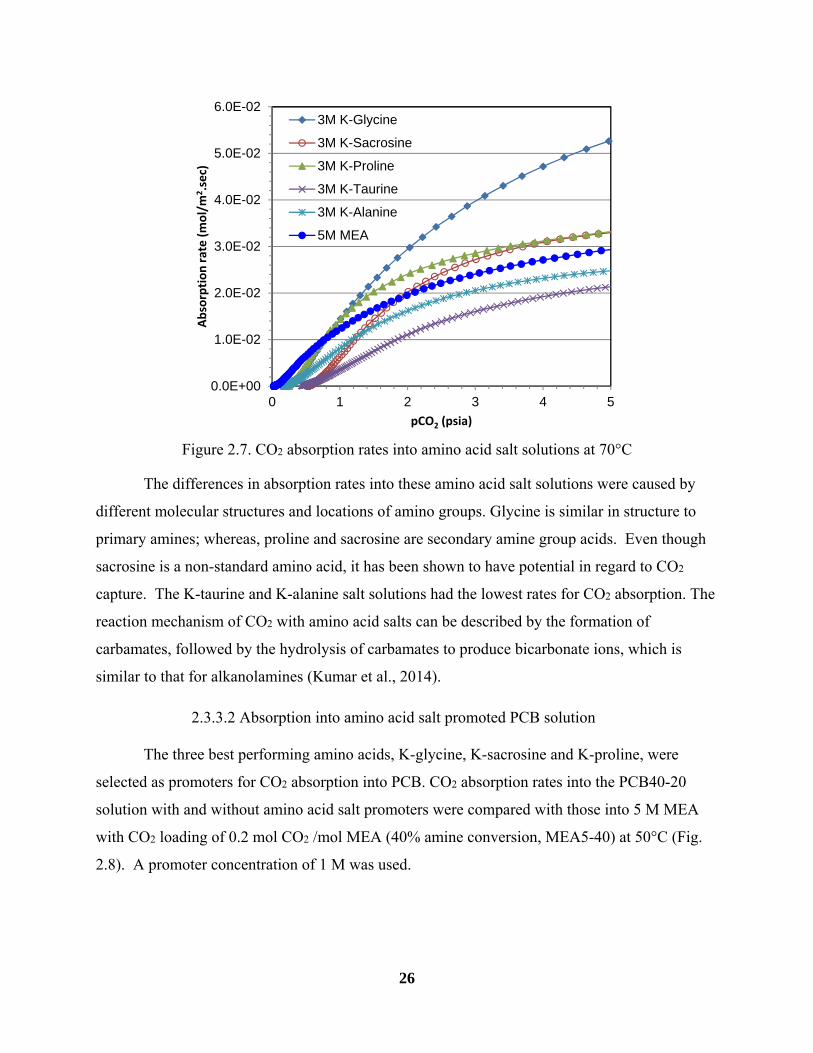
Absorption rates into five different 3 M amino acid salt solutions are shown in Fig. 2.7.
The K-Glycine solution had the highest absorption rate, followed by K-Sacrosine and K-Proline.
3 M K-Glycine, K-Sacrosine and K-Proline salt solutions at 70ºC exhibited absorption rates
higher than or comparable to those into the 5 M MEA solution at 50ºC.
0.0E+00
5.0E-03
1.0E-02
1.5E-02
2.0E-02
2.5E-02
3.0E-02
0 1 2 3 4 5
Absorption rate (mol/m
2.sec)
pCO2 (psia)
5M MEA5M MEA, CO2 loading:0.1mol/mol MEA5M MEA, CO2 loading:0.2mol/mol MEAPC40-20PC40-20+ 1.2M DEAPC40-20+ 1M AMPPC40-20+ 1M PZPC40-20+ 1M HDAPC40-20+ 1M HA
26
Figure 2.7. CO2 absorption rates into amino acid salt solutions at 70°C
The differences in absorption rates into these amino acid salt solutions were caused by
different molecular structures and locations of amino groups. Glycine is similar in structure to
primary amines; whereas, proline and sacrosine are secondary amine group acids. Even though
sacrosine is a non-standard amino acid, it has been shown to have potential in regard to CO2
capture. The K-taurine and K-alanine salt solutions had the lowest rates for CO2 absorption. The
reaction mechanism of CO2 with amino acid salts can be described by the formation of
carbamates, followed by the hydrolysis of carbamates to produce bicarbonate ions, which is
similar to that for alkanolamines (Kumar et al., 2014).
2.3.3.2 Absorption into amino acid salt promoted PCB solution
The three best performing amino acids, K-glycine, K-sacrosine and K-proline, were
selected as promoters for CO2 absorption into PCB. CO2 absorption rates into the PCB40-20
solution with and without amino acid salt promoters were compared with those into 5 M MEA
with CO2 loading of 0.2 mol CO2 /mol MEA (40% amine conversion, MEA5-40) at 50°C (Fig.
2.8). A promoter concentration of 1 M was used.
0.0E+00
1.0E-02
2.0E-02
3.0E-02
4.0E-02
5.0E-02
6.0E-02
0 1 2 3 4 5
Absorption rate (mol/m
2.sec)
pCO2 (psia)
3M K-Glycine
3M K-Sacrosine
3M K-Proline
3M K-Taurine
3M K-Alanine
5M MEA

27
Figure 2.8. Comparison of CO2 absorption rates into amino acid salt promoted PCB40-20 at
70°C and into MEA at 50°C.
The absorption rate into the MEA5-40 solution at 50°C was 10 to 35 times greater than
the rate into the baseline PCB40-20 without a promoter at 70°C for pCO2 between 1 and 5 psia.
Adding 1 M amino acid salt promoters improved the absorption rates in the PCB40-20. The
addition of K-glycine and K-sacrosine increased absorption rates by 3 to 11 times for the CO2
partial pressure range tested. However, these promoted rates were lower than those into the MEA
solution. The equilibrium vapor pressures over the amino acid salt solutions were higher than
those over the MEA, which could reduce the driving force for the CO2 absorption.
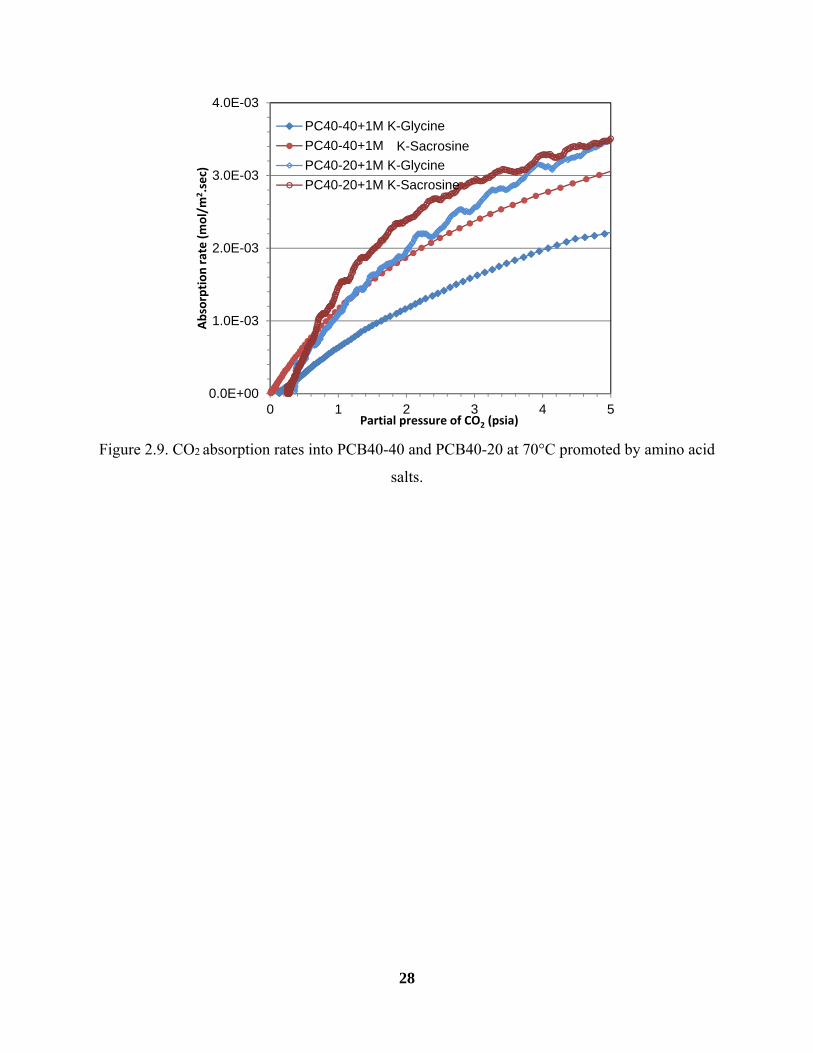
The rates of CO2 absorption promoted by K-glycine and K-sacrosine in the PCB
solutions with different CTB conversion levels are shown in Fig. 2.9. Absorption rates into the
promoted PCB40-40 were lower than those into the PCB40-20 by the same promoters. The
addition of 1 M K-sacrosine in the PCB40-20 and PCB40-40 was more effective for accelerating
the CO2 absorption compared to 1 M K-glycine in the same solutions. The differences in
absorption levels from PCB40-20+1 M K-glycine compared to PCB40-40+1 M K-glycine were
minimal considering the large change in CTB conversion. In the MEA solution when the
loading was increased by just 0.1 mol CO2/mol MEA, the absorption rate decreased (Fig. 2.6).
The rates into PCB40-40 promoted by K-glycine could be close to those into the 5M MEA with
a CO2 loading higher than 0.2 mol CO2/mol MEA.
0.0E+00
2.0E-03
4.0E-03
6.0E-03
8.0E-03
1.0E-02
1.2E-02
0 1 2 3 4 5
Absorption rate (mol/cm
2.sec)
pCO2 (psia)
PC40-20+ 1M K-Glycine
PC40-20+ 1M K-Sacrosine
PC40-20+ 1M K-Proline
PC40-20
3M MEA+0.2 mol/mol loading5
28
Figure 2.9. CO2 absorption rates into PCB40-40 and PCB40-20 at 70°C promoted by amino acid
salts.
0.0E+00
1.0E-03
2.0E-03
3.0E-03
4.0E-03
0 1 2 3 4 5
Absorption rate (mol/m
2.sec)
Partial pressure of CO2 (psia)
PC40-40+1M K-Glycine
PC40-40+1M K-Sacrocine
PC40-20+1M K-Glycine
PC40-20+1M K-Sacrosine
K-Sacrosine

29
Chapter 3 Kinetic Study of CO2 Absorption into a Concentrated
K2CO3/KHCO3 Solution in a Packed Bed Column
3.1 Introduction
After screening and selecting promoters with the greatest potential of boosting rates of
CO2 absorption in concentrated K2CO3/KHCO3 (PCB) solution, a bench scale, packed bed
column was fabricated to test the performance of CO2 absorption into the PCB solution with the
selected promoters.
3.2 Experimental methods
3.2.1 Packed bed column system
A bench scale, packed bed absorption column, designed and fabricated for the CO2
absorption study, was built of cast acrylic so flow through the column could be observed. The
acrylic material was tested by immersing it into a 40 wt% PCB solution for a month, after which
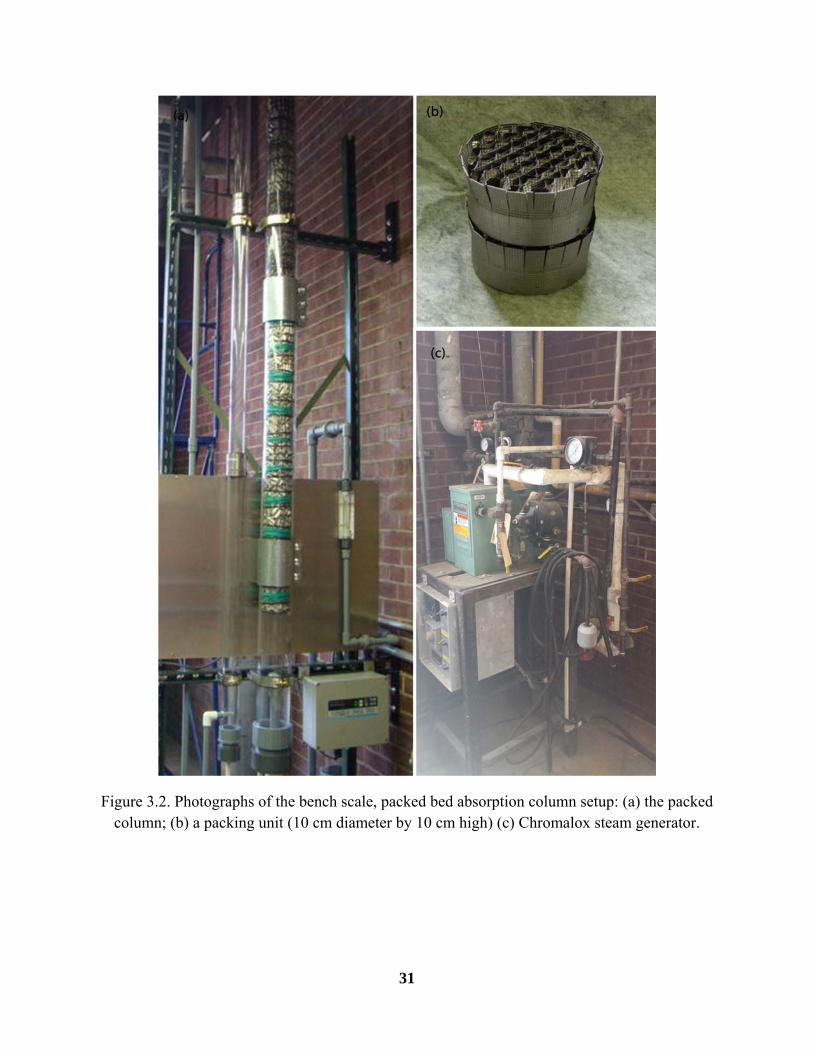
no signs of corrosion or degradation were seen. The column was constructed to be 3 m tall and
have a 10 cm I.D. and packed with a corrugated stainless steel packing material (Hai-Yan New
Century Petrochemical Device Co., Ltd, Model 500) of 2 m height. The structured packing had a
specific surface area of 800 m2/m3 (Table 3.1).
Table 3.1. Geometric specifications of the structured packing material.
Specification Height of packing element, mm 100
Diameter of packing element, mm 100 Specific surface area (a), m2/m3 800
Angle of inclined corrugation to the horizontal(θ), degree
45
Corrugation crimp height, mm 5 Side dimension of corrugation, mm 10
Void fraction (ε) 0.66
The gas stream was a simulated flue gas mixture consisting of air, CO2 and water vapor.
Air was supplied from an air compressor and CO2 from a compressed gas cylinder; flows were
30
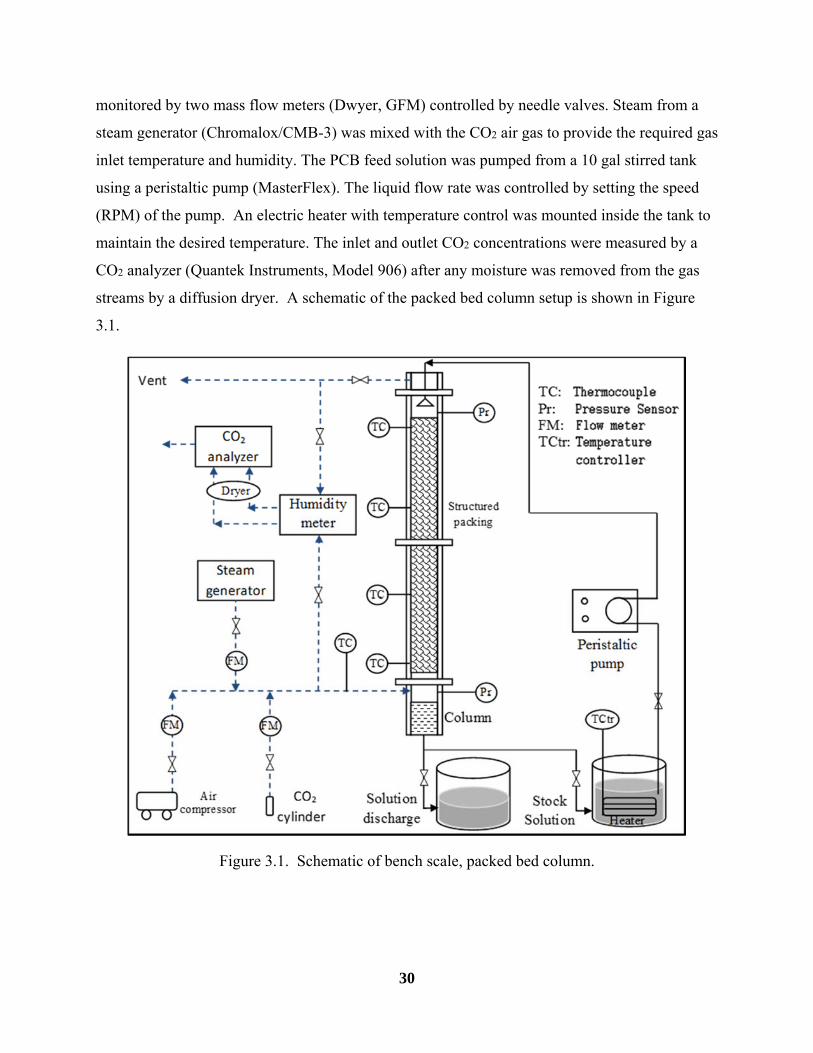
monitored by two mass flow meters (Dwyer, GFM) controlled by needle valves. Steam from a
steam generator (Chromalox/CMB-3) was mixed with the CO2 air gas to provide the required gas
inlet temperature and humidity. The PCB feed solution was pumped from a 10 gal stirred tank
using a peristaltic pump (MasterFlex). The liquid flow rate was controlled by setting the speed
(RPM) of the pump. An electric heater with temperature control was mounted inside the tank to
maintain the desired temperature. The inlet and outlet CO2 concentrations were measured by a
CO2 analyzer (Quantek Instruments, Model 906) after any moisture was removed from the gas
streams by a diffusion dryer. A schematic of the packed bed column setup is shown in Figure
3.1.
Figure 3.1. Schematic of bench scale, packed bed column.
31
Figure 3.2. Photographs of the bench scale, packed bed absorption column setup: (a) the packed column; (b) a packing unit (10 cm diameter by 10 cm high) (c) Chromalox steam generator.
32
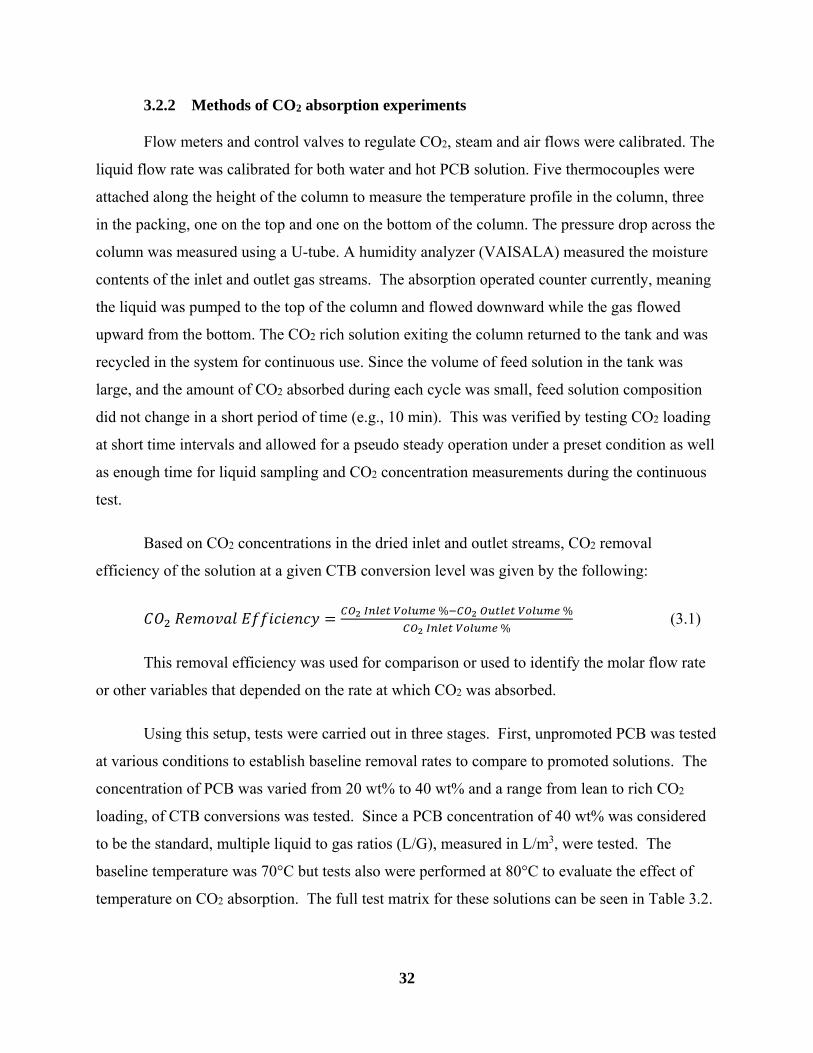
3.2.2 Methods of CO2 absorption experiments
Flow meters and control valves to regulate CO2, steam and air flows were calibrated. The
liquid flow rate was calibrated for both water and hot PCB solution. Five thermocouples were
attached along the height of the column to measure the temperature profile in the column, three
in the packing, one on the top and one on the bottom of the column. The pressure drop across the
column was measured using a U-tube. A humidity analyzer (VAISALA) measured the moisture
contents of the inlet and outlet gas streams. The absorption operated counter currently, meaning
the liquid was pumped to the top of the column and flowed downward while the gas flowed
upward from the bottom. The CO2 rich solution exiting the column returned to the tank and was
recycled in the system for continuous use. Since the volume of feed solution in the tank was
large, and the amount of CO2 absorbed during each cycle was small, feed solution composition
did not change in a short period of time (e.g., 10 min). This was verified by testing CO2 loading
at short time intervals and allowed for a pseudo steady operation under a preset condition as well
as enough time for liquid sampling and CO2 concentration measurements during the continuous
test.
Based on CO2 concentrations in the dried inlet and outlet streams, CO2 removal
efficiency of the solution at a given CTB conversion level was given by the following:
% %
% (3.1)
This removal efficiency was used for comparison or used to identify the molar flow rate
or other variables that depended on the rate at which CO2 was absorbed.
Using this setup, tests were carried out in three stages. First, unpromoted PCB was tested
at various conditions to establish baseline removal rates to compare to promoted solutions. The
concentration of PCB was varied from 20 wt% to 40 wt% and a range from lean to rich CO2
loading, of CTB conversions was tested. Since a PCB concentration of 40 wt% was considered
to be the standard, multiple liquid to gas ratios (L/G), measured in L/m3, were tested. The
baseline temperature was 70°C but tests also were performed at 80°C to evaluate the effect of
temperature on CO2 absorption. The full test matrix for these solutions can be seen in Table 3.2.

33
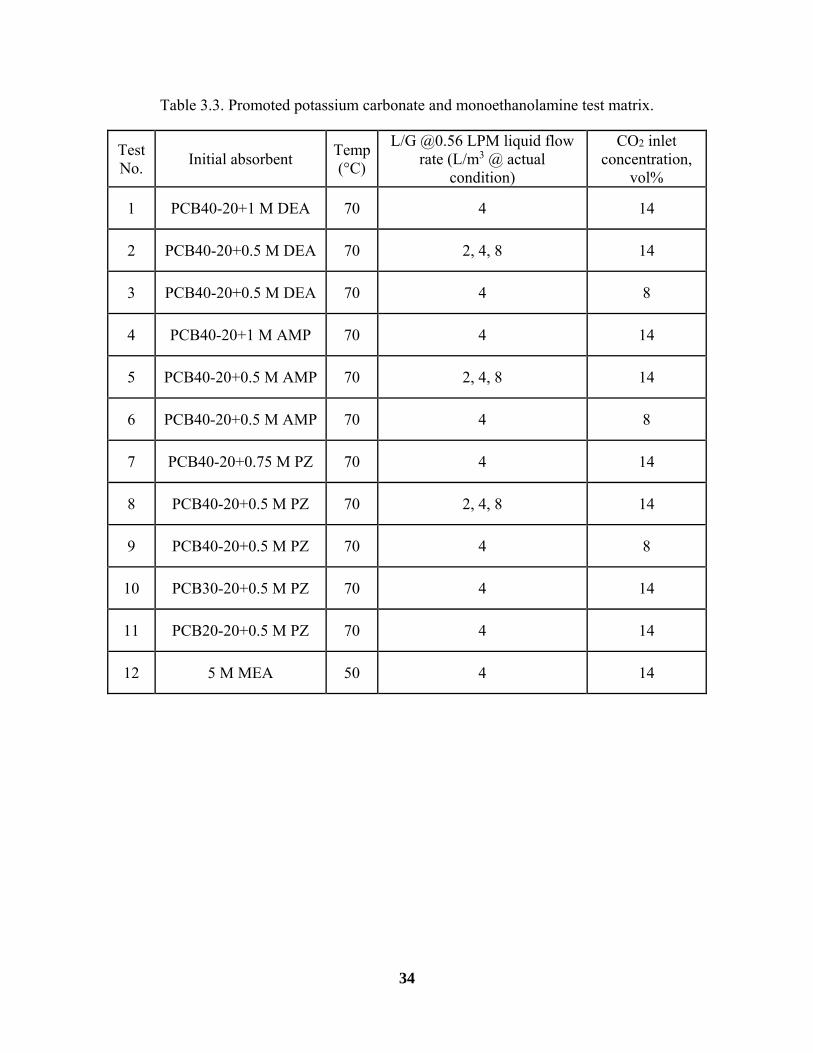
Once a baseline removal was established for PCB at the desired concentrations and CTB
conversions, testing was done to evaluate the effectiveness of various rate promoters. This
involved testing multiple amine promoters with differing dosages, as well as evaluating the effect
of L/G ratio and CO2 inlet concentration on CO2 removal effectiveness. The test matrix was set
so only one variable was changed at a time from the predetermined baseline conditions. These
tests were performed at 70°C. For a reference, 5 M MEA was tested, with the temperature set
point at 50°C. The full test matrix for these solutions can be seen in Table 3.3.
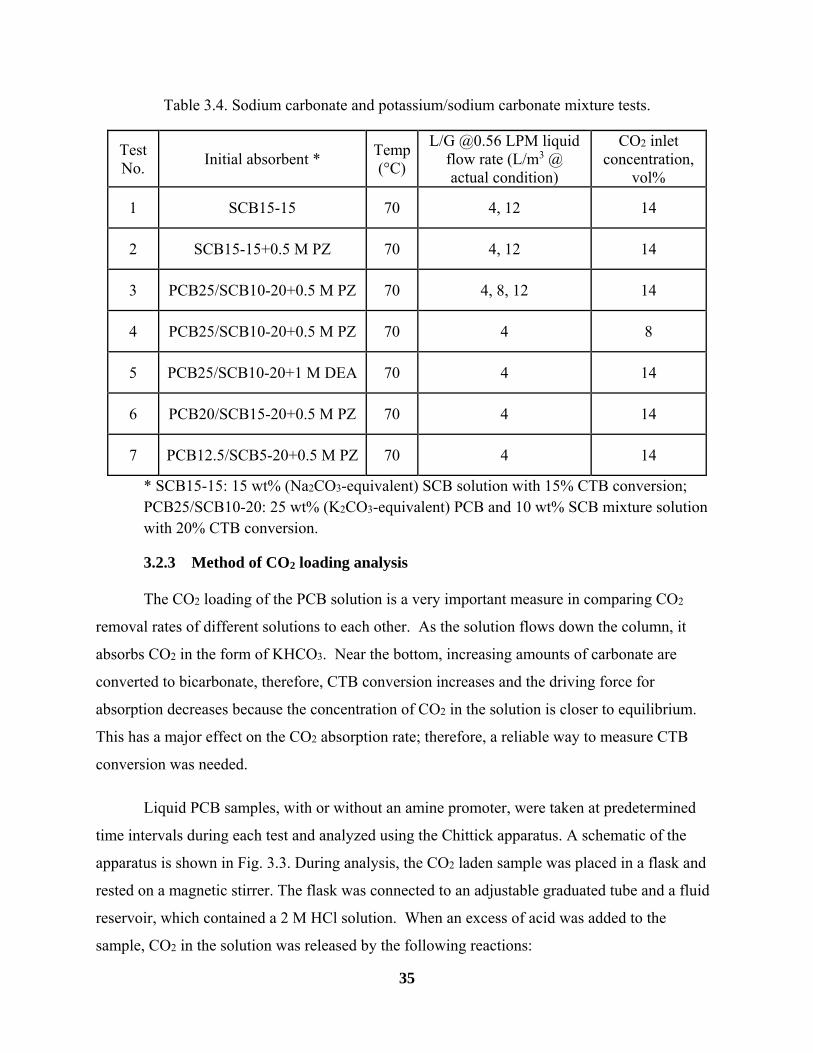
After these tests were completed, other solvents were investigated for their absorption
potential including sodium carbonate/bicarbonate solution (Na2CO3/NaHCO3, SCB) and
PCB/SCB mixture solutions. These solutions were investigated in a similar fashion to PCB
where only one variable at a time was changed to see the effect of different variables such as
promoters, L/G ratios, SCB and PCB/SCB concentrations and CO2 inlet concentrations. The full
test matrix can be seen in Table 3.4.
Table 3.2. Unpromoted potassium carbonate test matrix.
Test No.
Initial absorbent*
Temp (°C)
L/G @0.56 LPM liquid flow rate (L/m3 @ actual condition)
CO2 inlet concentration, vol%
1 PCB40-20 70 2, 4, 8, 12 14
2 PCB40-30 70 2, 4, 8, 12 14
3 PCB40-40 70 2, 4, 8, 12 14
4 PCB20-20 70 4 14
5 PCB20-30 70 4 14
6 PCB20-40 70 4 14
7 PCB30-20 70 4 14
8 PCB30-30 70 4 14
9 PCB30-40 70 4 14
* PCB40-20: 40 wt% (K2CO3-equivalent) PCB solution with 20% CTB conversion.
34
Table 3.3. Promoted potassium carbonate and monoethanolamine test matrix.
Test No.
Initial absorbent Temp (°C)
L/G @0.56 LPM liquid flow rate (L/m3 @ actual
condition)
CO2 inlet concentration,
vol%
1 PCB40-20+1 M DEA 70 4 14
2 PCB40-20+0.5 M DEA 70 2, 4, 8 14
3 PCB40-20+0.5 M DEA 70 4 8
4 PCB40-20+1 M AMP 70 4 14
5 PCB40-20+0.5 M AMP 70 2, 4, 8 14
6 PCB40-20+0.5 M AMP 70 4 8
7 PCB40-20+0.75 M PZ 70 4 14
8 PCB40-20+0.5 M PZ 70 2, 4, 8 14
9 PCB40-20+0.5 M PZ 70 4 8
10 PCB30-20+0.5 M PZ 70 4 14
11 PCB20-20+0.5 M PZ 70 4 14
12 5 M MEA 50 4 14
35
Table 3.4. Sodium carbonate and potassium/sodium carbonate mixture tests.
Test No.
Initial absorbent * Temp (°C)
L/G @0.56 LPM liquid flow rate (L/m3 @ actual condition)
CO2 inlet concentration,
vol%
1 SCB15-15 70 4, 12 14
2 SCB15-15+0.5 M PZ 70 4, 12 14
3 PCB25/SCB10-20+0.5 M PZ 70 4, 8, 12 14
4 PCB25/SCB10-20+0.5 M PZ 70 4 8
5 PCB25/SCB10-20+1 M DEA 70 4 14
6 PCB20/SCB15-20+0.5 M PZ 70 4 14
7 PCB12.5/SCB5-20+0.5 M PZ 70 4 14
* SCB15-15: 15 wt% (Na2CO3-equivalent) SCB solution with 15% CTB conversion; PCB25/SCB10-20: 25 wt% (K2CO3-equivalent) PCB and 10 wt% SCB mixture solution with 20% CTB conversion.
3.2.3 Method of CO2 loading analysis
The CO2 loading of the PCB solution is a very important measure in comparing CO2
removal rates of different solutions to each other. As the solution flows down the column, it
absorbs CO2 in the form of KHCO3. Near the bottom, increasing amounts of carbonate are
converted to bicarbonate, therefore, CTB conversion increases and the driving force for
absorption decreases because the concentration of CO2 in the solution is closer to equilibrium.
This has a major effect on the CO2 absorption rate; therefore, a reliable way to measure CTB
conversion was needed.
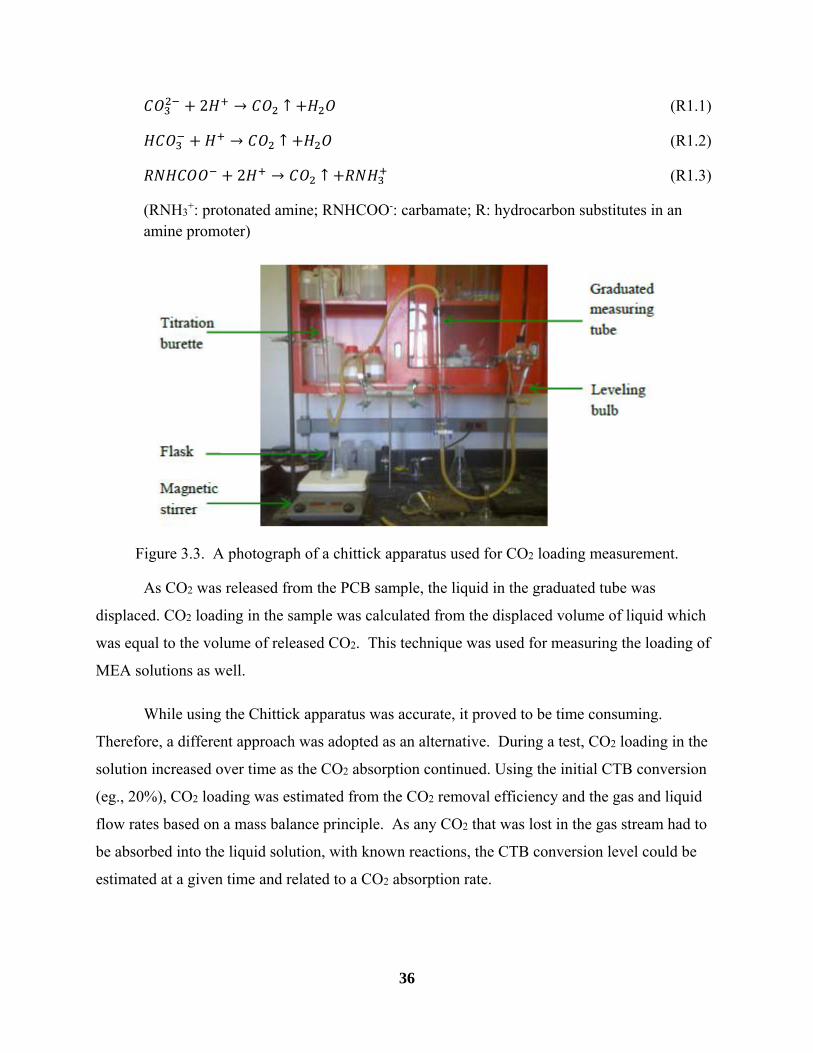
Liquid PCB samples, with or without an amine promoter, were taken at predetermined
time intervals during each test and analyzed using the Chittick apparatus. A schematic of the
apparatus is shown in Fig. 3.3. During analysis, the CO2 laden sample was placed in a flask and
rested on a magnetic stirrer. The flask was connected to an adjustable graduated tube and a fluid
reservoir, which contained a 2 M HCl solution. When an excess of acid was added to the
sample, CO2 in the solution was released by the following reactions:
36
2 → ↑ (R1.1)
→ ↑ (R1.2)
2 → ↑ (R1.3)
(RNH3+: protonated amine; RNHCOO-: carbamate; R: hydrocarbon substitutes in an
amine promoter)
Figure 3.3. A photograph of a chittick apparatus used for CO2 loading measurement.
As CO2 was released from the PCB sample, the liquid in the graduated tube was
displaced. CO2 loading in the sample was calculated from the displaced volume of liquid which
was equal to the volume of released CO2. This technique was used for measuring the loading of
MEA solutions as well.
While using the Chittick apparatus was accurate, it proved to be time consuming.
Therefore, a different approach was adopted as an alternative. During a test, CO2 loading in the
solution increased over time as the CO2 absorption continued. Using the initial CTB conversion
(eg., 20%), CO2 loading was estimated from the CO2 removal efficiency and the gas and liquid
flow rates based on a mass balance principle. As any CO2 that was lost in the gas stream had to
be absorbed into the liquid solution, with known reactions, the CTB conversion level could be
estimated at a given time and related to a CO2 absorption rate.

37
3.2.4 Method of mass transfer coefficient measurement
To determine the impact of mass transfer in the overall rate of CO2 absorption, it was
important to quantify the gas and liquid phase mass transfer coefficients of the bench scale
absorption column. These coefficients were related directly to the mass transfer resistance in the
column and were an important parameter in evaluating CO2 absorption performance. Literature
data are available for similar absorption columns, but because a small difference in the setup can
cause a great variance in these correlations, a study on measuring mass transfer in the current
column was essential (Kim & Deshusses, 2008; Onda et al., 1968; Rocha et al., 1996; Wang et
al., 2005).
To determine the liquid phase mass transfer coefficient of the packed bed column, the
physical absorption of oxygen from air into water was studied by measuring the amount of
oxygen dissolved into water throughout the column. The solubility of oxygen into water was
low, and used as a sparingly soluble gas in the absorption. In this scenario the overall mass
transfer is dominated by the liquid phase, making it possible to calculate the liquid side mass
transfer coefficient (Kim & Deshusses, 2008). This was done by introducing air from a cylinder
into the bottom of the absorption column. The air flow rate was measured by the same calibrated
mass flow meter used in the CO2 absorption tests. The water used in the experiment was DI
water swasparged with nitrogen to minimize initial dissolved oxygen. The N2 treated water was
pumped to the top of the column and flowed down through the column for O2 absorption. Unlike
the CO2 absorption tests, the spent water exiting the column was not recirculated in the system.
The flow rate of water was varied along with the flow of air to cover the full operating range of
the column. When the column reached steady state at each preset condition, as indicated by a
stable temperature profile along the column as well as a stable O2 concentration in the liquid
outlet, liquid samples were taken at the inlet and outlet. Samples were analyzed for dissolved
oxygen concentration using a dissolved oxygen (DO) meter (Hach, Model HQ30d).
As the main resistance to mass transfer during the absorption of oxygen into water was
localized in the liquid phase, the individual liquid mass transfer coefficient was approximated as
the overall liquid phase coefficient:
(3.2)
38
where KLae (s-1) is the overall liquid phase mas transfer coefficient, kLae (s-1) is the individual
liquid phase mass transfer coefficient and ae (m2/m3) is the effective surface area of the packing
material. The following equation can thus be derived to calculate the individual liquid mass
transfer coefficient based on the measurement of dissolved O2 in water during the absorption.
ln∗
,∗
, (3.3)
where C* (mg/L) is the physical solubility of oxygen at the interface, CL,in and CL,out (mg/L) are
the inlet and outlet concentrations of dissolved oxygen in the water, uL (m/s) is the specific liquid
flow rate and Z (m) is the height of the packing in the column. The value of C*, estimated based
on the Henry’s law, was approximated as a constant because the change of O2 concentration in
air (21 vol%) during the absorption was negligible.
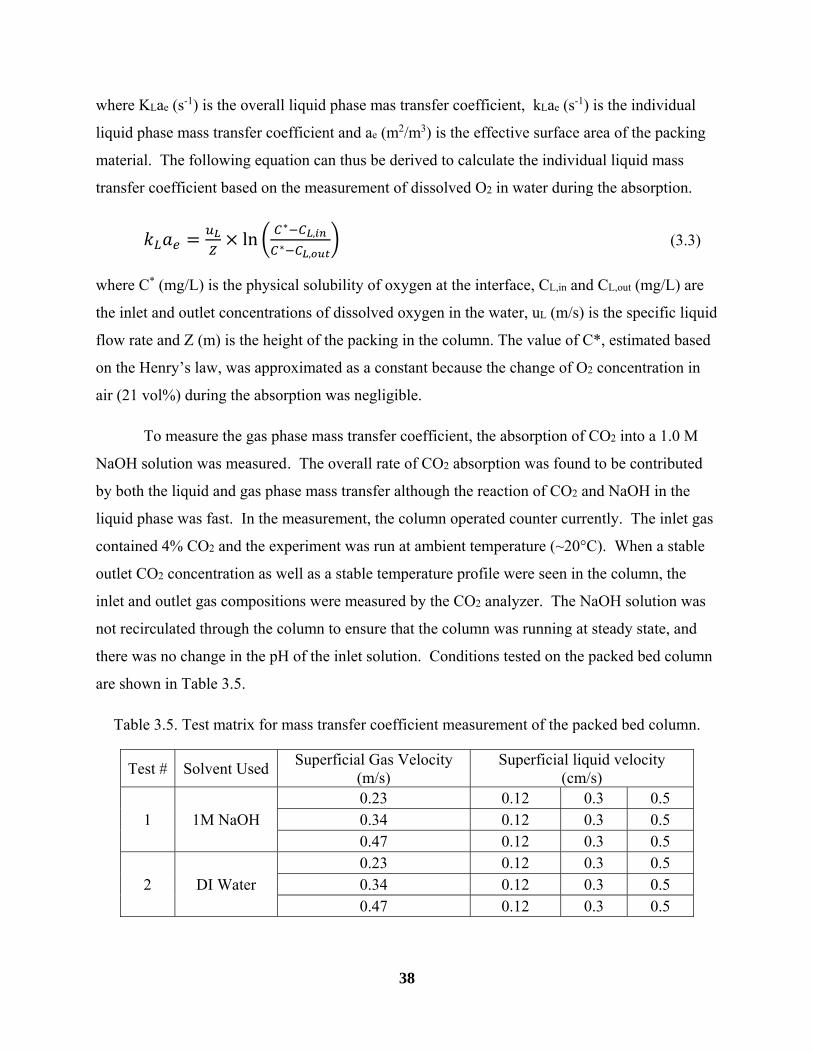
To measure the gas phase mass transfer coefficient, the absorption of CO2 into a 1.0 M
NaOH solution was measured . The overall rate of CO2 absorption was found to be contributed
by both the liquid and gas phase mass transfer although the reaction of CO2 and NaOH in the
liquid phase was fast. In the measurement, the column operated counter currently. The inlet gas
contained 4% CO2 and the experiment was run at ambient temperature (~20°C). When a stable
outlet CO2 concentration as well as a stable temperature profile were seen in the column, the
inlet and outlet gas compositions were measured by the CO2 analyzer. The NaOH solution was
not recirculated through the column to ensure that the column was running at steady state, and
there was no change in the pH of the inlet solution. Conditions tested on the packed bed column
are shown in Table 3.5.
Table 3.5. Test matrix for mass transfer coefficient measurement of the packed bed column.
Test # Solvent Used Superficial Gas Velocity
(m/s) Superficial liquid velocity
(cm/s)
1 1M NaOH 0.23 0.12 0.3 0.5 0.34 0.12 0.3 0.5 0.47 0.12 0.3 0.5
2 DI Water 0.23 0.12 0.3 0.5 0.34 0.12 0.3 0.5 0.47 0.12 0.3 0.5
39
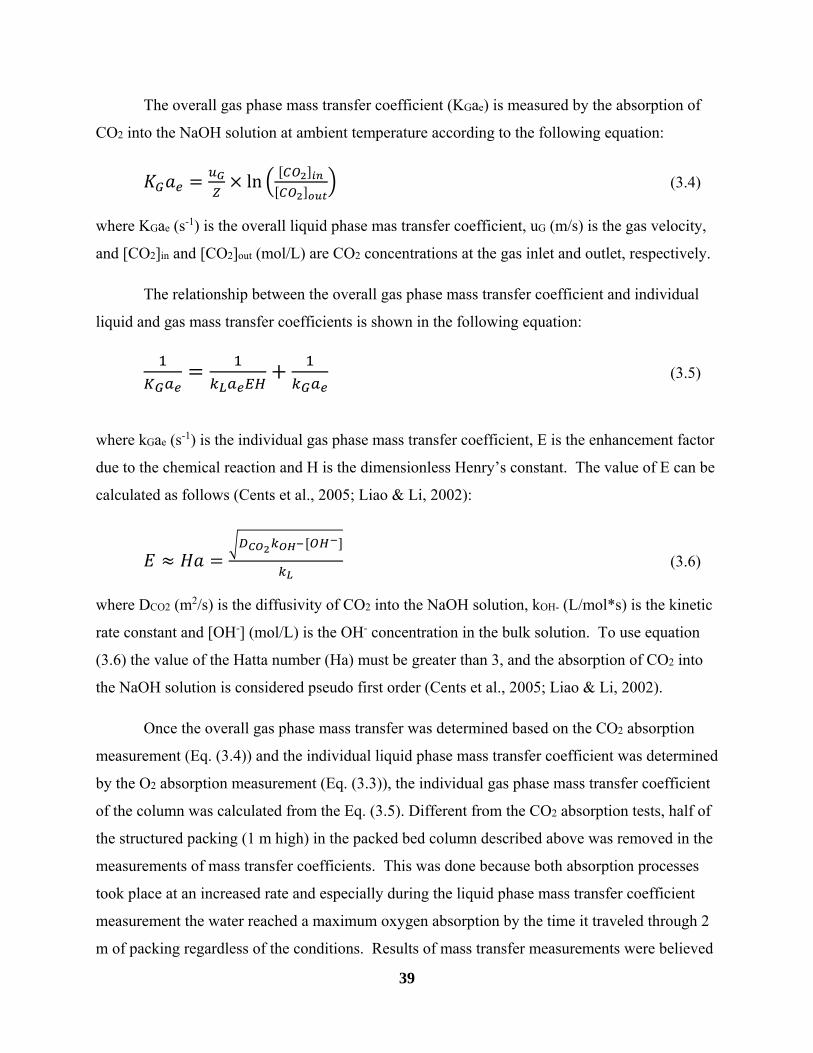
The overall gas phase mass transfer coefficient (KGae) is measured by the absorption of
CO2 into the NaOH solution at ambient temperature according to the following equation:
ln (3.4)
where KGae (s-1) is the overall liquid phase mas transfer coefficient, uG (m/s) is the gas velocity,
and [CO2]in and [CO2]out (mol/L) are CO2 concentrations at the gas inlet and outlet, respectively.
The relationship between the overall gas phase mass transfer coefficient and individual
liquid and gas mass transfer coefficients is shown in the following equation:
(3.5)
where kGae (s-1) is the individual gas phase mass transfer coefficient, E is the enhancement factor
due to the chemical reaction and H is the dimensionless Henry’s constant. The value of E can be
calculated as follows (Cents et al., 2005; Liao & Li, 2002):
(3.6)
where DCO2 (m2/s) is the diffusivity of CO2 into the NaOH solution, kOH- (L/mol*s) is the kinetic
rate constant and [OH-] (mol/L) is the OH- concentration in the bulk solution. To use equation
(3.6) the value of the Hatta number (Ha) must be greater than 3, and the absorption of CO2 into
the NaOH solution is considered pseudo first order (Cents et al., 2005; Liao & Li, 2002).
Once the overall gas phase mass transfer was determined based on the CO2 absorption
measurement (Eq. (3.4)) and the individual liquid phase mass transfer coefficient was determined
by the O2 absorption measurement (Eq. (3.3)), the individual gas phase mass transfer coefficient
of the column was calculated from the Eq. (3.5). Different from the CO2 absorption tests, half of
the structured packing (1 m high) in the packed bed column described above was removed in the
measurements of mass transfer coefficients. This was done because both absorption processes
took place at an increased rate and especially during the liquid phase mass transfer coefficient
measurement the water reached a maximum oxygen absorption by the time it traveled through 2
m of packing regardless of the conditions. Results of mass transfer measurements were believed

40
to be valid because either the absorption of oxygen into water or the absorption of CO2 into
NaOH was not completed through the 1 m packing.
These measurements were also done using the same methods on a 3 m tall, 5 cm I.D.
column packed with 1 m of stainless steel Pall rings that had a specific surface area of 500
m2/m3. This was done to validate the above methods since literature data with this packing were
more available. For example, the correlations proposed by Onda et al. (1968) have been accepted
for such columns (Kelly et al., 1984; Sanyal et al., 1988; Tontiwachwuthikul et al., 1992).
3.3 Results and discussion
3.3.1 Determination of mass transfer coefficients
3.3.1.1 Liquid phase mass transfer coefficient
The measured individual liquid phase mass transfer coefficients (kLae) for the random
Pall ring packings are shown in Figure 3.4. The experimental values are close to those predicted
by Onda’s correlation, for each condition tested (Onda et al., 1968). In both the predicted and
experimental values, the value of kLae was independent of changes in gas velocity. In
comparison, changes in liquid velocity did have an effect on mass transfer. As liquid flow rate
was increased, rate of liquid phase mass transfer also increased, which was most likely due to an
increase in the effective area for gas liquid absorption caused by greater wetting of the packing.
Since these results for the Pall ring packing were consistent with the literature data, the
measurement methods were considered to be validated (Kim & Deshusses, 2008; Piché et al.,
2001).

41
Figure 3.4. Liquid phase mass transfer coefficients in packed bed columns with random Pall ring
packing at varying gas flow rates.
The measured kLae values for the structured packing are shown in Figure 3.5. At the
same liquid flow rates, the kLae values for the structured packing were 30% higher than the
random packing. This was expected as the structured packing was designed to have better mass
transfer properties, such as a higher specific surface area, than the random packing.
Figure 3.5. Liquid phase mass transfer coefficients in packed bed column with structured
packing at varying gas flow rates.
0
0.005
0.01
0.015
0.02
0.15 0.2 0.25 0.3 0.35 0.4 0.45 0.5
k La e, s
‐1
Gas velocity, m/s
uL=0.12 cm/s, experimental value
uL=0.3 cm/s, experimental value
uL=0.5 cm/s, experimental value
uL=0.12 cm/s, predicted by Onda's correlation
uL=0.3 cm/s, predicted by Onda's correlation
uL=0.5 cm/s, predicted by Onda's correlation
0
0.005
0.01
0.015
0.02
0.15 0.25 0.35 0.45 0.55 0.65
k La e, s
‐1
Gas velocity, m/s
uL=0.12 cm/s, experimental value
uL=0.3 cm/s, experimental value
uL=0.5 cm/s, experimental value
42
3.3.1.2 Gas phase mass transfer coefficient
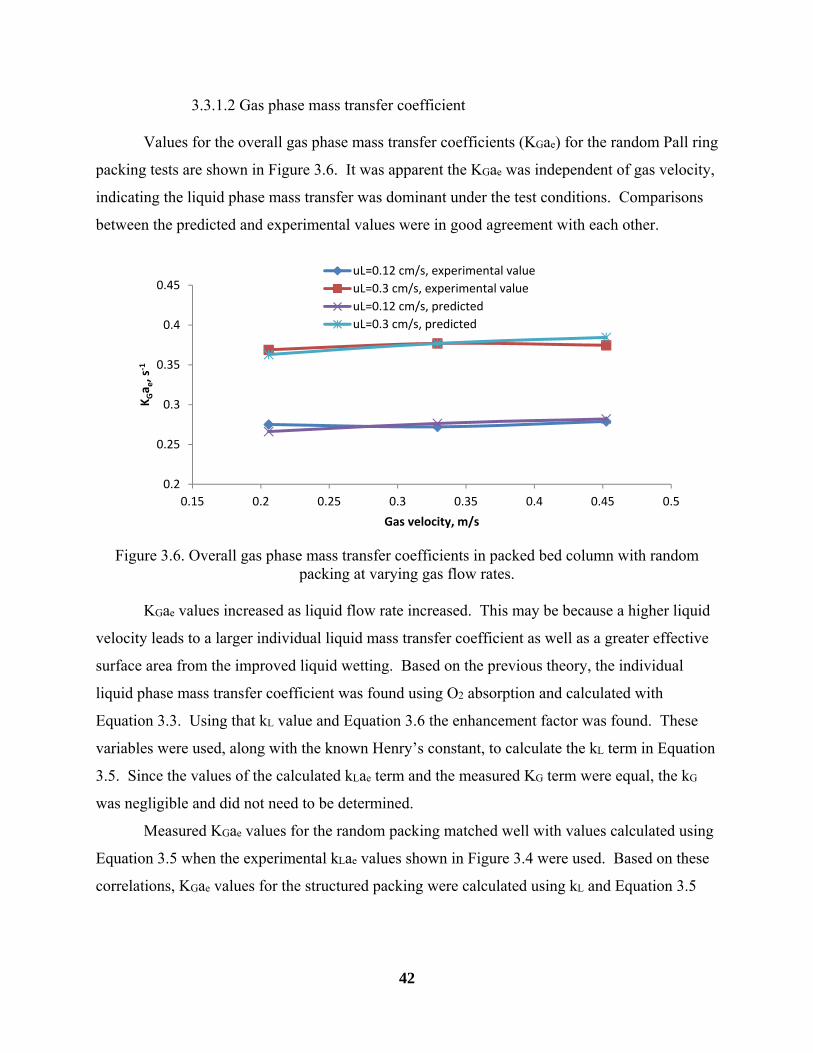
Values for the overall gas phase mass transfer coefficients (KGae) for the random Pall ring
packing tests are shown in Figure 3.6. It was apparent the KGae was independent of gas velocity,
indicating the liquid phase mass transfer was dominant under the test conditions. Comparisons
between the predicted and experimental values were in good agreement with each other.
Figure 3.6. Overall gas phase mass transfer coefficients in packed bed column with random
packing at varying gas flow rates.
KGae values increased as liquid flow rate increased. This may be because a higher liquid
velocity leads to a larger individual liquid mass transfer coefficient as well as a greater effective
surface area from the improved liquid wetting. Based on the previous theory, the individual
liquid phase mass transfer coefficient was found using O2 absorption and calculated with
Equation 3.3. Using that kL value and Equation 3.6 the enhancement factor was found. These
variables were used, along with the known Henry’s constant, to calculate the kL term in Equation
3.5. Since the values of the calculated kLae term and the measured KG term were equal, the kG
was negligible and did not need to be determined.
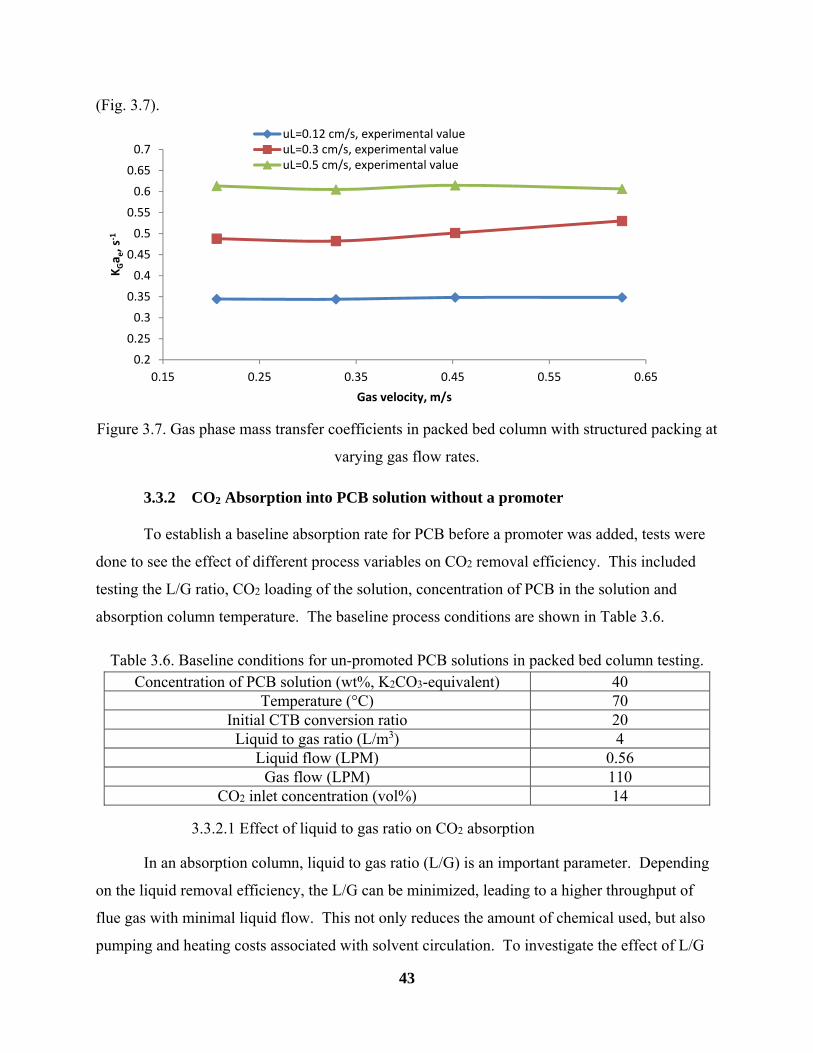
Measured KGae values for the random packing matched well with values calculated using
Equation 3.5 when the experimental kLae values shown in Figure 3.4 were used. Based on these
correlations, KGae values for the structured packing were calculated using kL and Equation 3.5
0.2
0.25
0.3
0.35
0.4
0.45
0.15 0.2 0.25 0.3 0.35 0.4 0.45 0.5
KGa e, s
‐1
Gas velocity, m/s
uL=0.12 cm/s, experimental value
uL=0.3 cm/s, experimental value
uL=0.12 cm/s, predicted
uL=0.3 cm/s, predicted
43
(Fig. 3.7).
Figure 3.7. Gas phase mass transfer coefficients in packed bed column with structured packing at
varying gas flow rates.
3.3.2 CO2 Absorption into PCB solution without a promoter
To establish a baseline absorption rate for PCB before a promoter was added, tests were
done to see the effect of different process variables on CO2 removal efficiency. This included
testing the L/G ratio, CO2 loading of the solution, concentration of PCB in the solution and
absorption column temperature. The baseline process conditions are shown in Table 3.6.
Table 3.6. Baseline conditions for un-promoted PCB solutions in packed bed column testing. Concentration of PCB solution (wt%, K2CO3-equivalent) 40
Temperature (°C) 70 Initial CTB conversion ratio 20
Liquid to gas ratio (L/m3) 4 Liquid flow (LPM) 0.56
Gas flow (LPM) 110 CO2 inlet concentration (vol%) 14
3.3.2.1 Effect of liquid to gas ratio on CO2 absorption
In an absorption column, liquid to gas ratio (L/G) is an important parameter. Depending
on the liquid removal efficiency, the L/G can be minimized, leading to a higher throughput of
flue gas with minimal liquid flow. This not only reduces the amount of chemical used, but also
pumping and heating costs associated with solvent circulation. To investigate the effect of L/G
0.2
0.25
0.3
0.35
0.4
0.45
0.5
0.55
0.6
0.65
0.7
0.15 0.25 0.35 0.45 0.55 0.65
KGa e, s
‐1
Gas velocity, m/s
uL=0.12 cm/s, experimental valueuL=0.3 cm/s, experimental valueuL=0.5 cm/s, experimental value
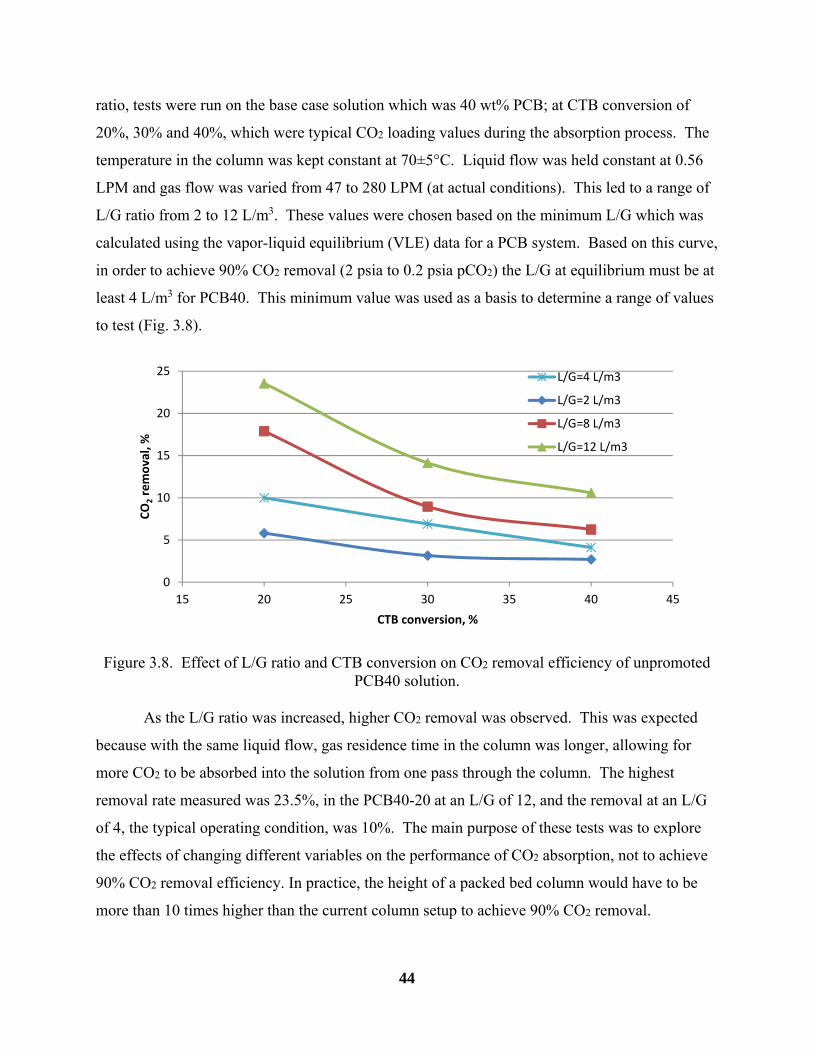
44
ratio, tests were run on the base case solution which was 40 wt% PCB; at CTB conversion of
20%, 30% and 40%, which were typical CO2 loading values during the absorption process. The
temperature in the column was kept constant at 70±5°C. Liquid flow was held constant at 0.56
LPM and gas flow was varied from 47 to 280 LPM (at actual conditions). This led to a range of
L/G ratio from 2 to 12 L/m3. These values were chosen based on the minimum L/G which was
calculated using the vapor-liquid equilibrium (VLE) data for a PCB system. Based on this curve,
in order to achieve 90% CO2 removal (2 psia to 0.2 psia pCO2) the L/G at equilibrium must be at
least 4 L/m3 for PCB40. This minimum value was used as a basis to determine a range of values
to test (Fig. 3.8).
Figure 3.8. Effect of L/G ratio and CTB conversion on CO2 removal efficiency of unpromoted PCB40 solution.
As the L/G ratio was increased, higher CO2 removal was observed. This was expected
because with the same liquid flow, gas residence time in the column was longer, allowing for
more CO2 to be absorbed into the solution from one pass through the column. The highest
removal rate measured was 23.5%, in the PCB40-20 at an L/G of 12, and the removal at an L/G
of 4, the typical operating condition, was 10%. The main purpose of these tests was to explore
the effects of changing different variables on the performance of CO2 absorption, not to achieve
90% CO2 removal efficiency. In practice, the height of a packed bed column would have to be
more than 10 times higher than the current column setup to achieve 90% CO2 removal.
0
5
10
15
20
25
15 20 25 30 35 40 45
CO
2removal, %
CTB conversion, %
L/G=4 L/m3
L/G=2 L/m3
L/G=8 L/m3
L/G=12 L/m3

45
3.3.2.2 Effect of CO2 loading on CO2 absorption
The effect of CO2 loading in the solution on the CO2 removal rate is important. In
practice, the lean solution (with low CO2 loading) would come in to the column from the top at a
CTB conversion level of 20%. The solution would flow through the column and exit at a rich
CTB conversion level of 40% to 45%. The counter current flow is important to maximize
driving force here. The lean solution at the top will be in contact with flue gas that has had CO2
removed out of it. The rich solution, which has a much higher CO2 content, is in contact with the
fresh flue gas containing a higher CO2 concentration (~14%). In the column setup for this
experiment, the change in CTB conversion from top to bottom in the solution could be minimal
as a high level of CO2 removal (eg., 90%) was not intended. To measure the removal efficiency
of lean and rich solutions and all points in between, the solution was recycled back through the
column while the CO2 inlet concentration stayed the same, and the CO2 loading of the inlet
solution and removal efficiencies were measured at predetermined intervals. This gave a
simulation of the complete working height of a full size absorption column.
The trend for each L/G is the same; as the CTB conversion (CO2 loading) increased, the
CO2 removal efficiency decreased (Fig. 3.8). This was due to the change in driving force as a
result of an increased CO2 concentration in the liquid. The inlet CO2 concentration was held
constant and, as the CTB conversion increased in the solution, it became closer to equilibrium
with the gas. This directly decreased the driving force for the absorption of CO2 into the
solution, causing the removal rate to decrease.
3.3.2.3 Effect of concentration of PCB solution on CO2 absorption
As a part of this novel process, the use of a highly concentrated PCB solution was
important. This would allow for the use of less liquid flow which leads to a reduced size of
equipment and large energy savings associated with less power use for pumping liquid and less
energy use in the solvent regeneration process. A PCB40 solution was adopted as a baseline. For
the comparison purpose, PCB solutions of lower concentrations were tested. However, since
these solutions contained less PCB, their CTB conversion changes through an absorption column
would have to be larger to have a comparable capacity to PCB40 (Fig. 3.9).
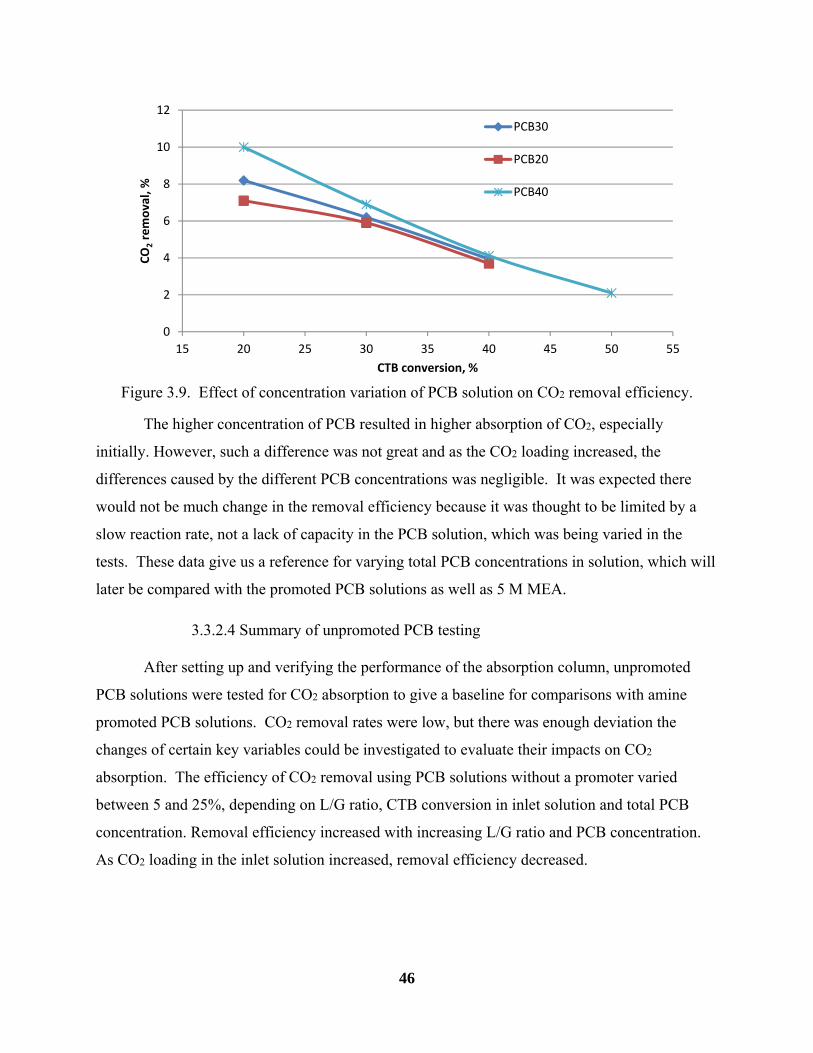
46
Figure 3.9. Effect of concentration variation of PCB solution on CO2 removal efficiency.
The higher concentration of PCB resulted in higher absorption of CO2, especially
initially. However, such a difference was not great and as the CO2 loading increased, the
differences caused by the different PCB concentrations was negligible. It was expected there
would not be much change in the removal efficiency because it was thought to be limited by a
slow reaction rate, not a lack of capacity in the PCB solution, which was being varied in the
tests. These data give us a reference for varying total PCB concentrations in solution, which will
later be compared with the promoted PCB solutions as well as 5 M MEA.
3.3.2.4 Summary of unpromoted PCB testing
After setting up and verifying the performance of the absorption column, unpromoted
PCB solutions were tested for CO2 absorption to give a baseline for comparisons with amine
promoted PCB solutions. CO2 removal rates were low, but there was enough deviation the
changes of certain key variables could be investigated to evaluate their impacts on CO2
absorption. The efficiency of CO2 removal using PCB solutions without a promoter varied
between 5 and 25%, depending on L/G ratio, CTB conversion in inlet solution and total PCB
concentration. Removal efficiency increased with increasing L/G ratio and PCB concentration.
As CO2 loading in the inlet solution increased, removal efficiency decreased.
0
2
4
6
8
10
12
15 20 25 30 35 40 45 50 55
CO
2removal, %
CTB conversion, %
PCB30
PCB20
PCB40
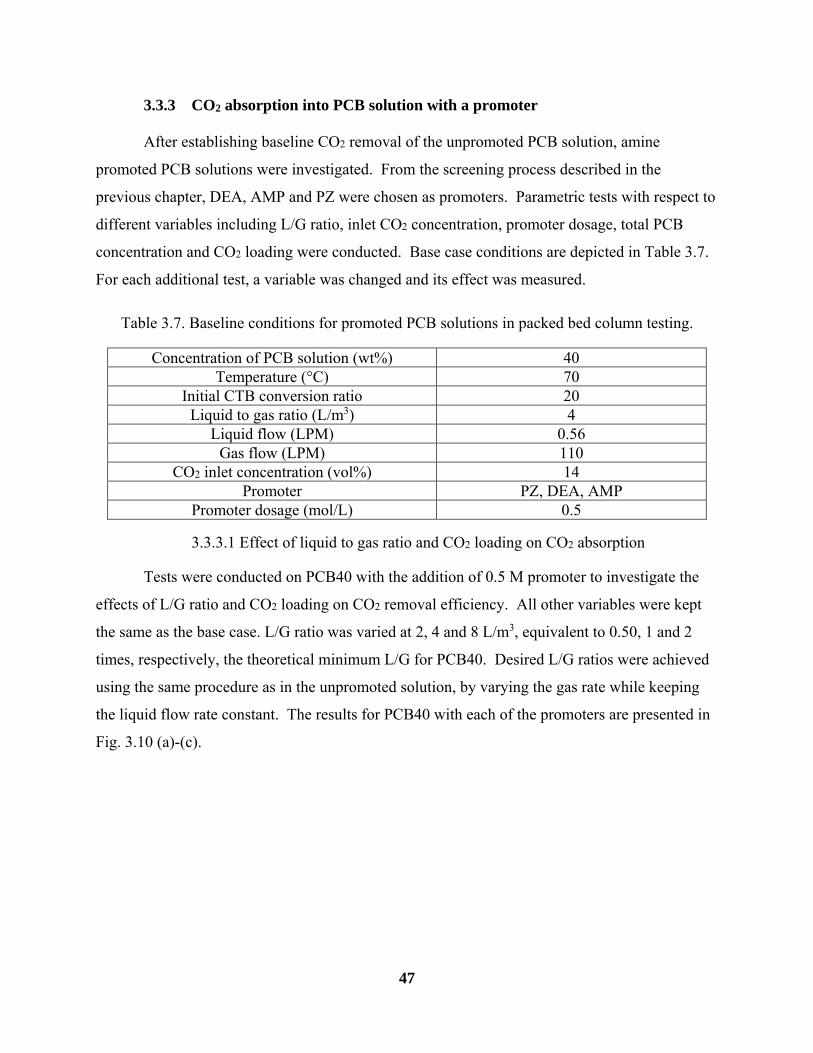
47
3.3.3 CO2 absorption into PCB solution with a promoter
After establishing baseline CO2 removal of the unpromoted PCB solution, amine
promoted PCB solutions were investigated. From the screening process described in the
previous chapter, DEA, AMP and PZ were chosen as promoters. Parametric tests with respect to
different variables including L/G ratio, inlet CO2 concentration, promoter dosage, total PCB
concentration and CO2 loading were conducted. Base case conditions are depicted in Table 3.7.
For each additional test, a variable was changed and its effect was measured.
Table 3.7. Baseline conditions for promoted PCB solutions in packed bed column testing.
Concentration of PCB solution (wt%) 40 Temperature (°C) 70
Initial CTB conversion ratio 20 Liquid to gas ratio (L/m3) 4
Liquid flow (LPM) 0.56 Gas flow (LPM) 110
CO2 inlet concentration (vol%) 14 Promoter PZ, DEA, AMP
Promoter dosage (mol/L) 0.5
3.3.3.1 Effect of liquid to gas ratio and CO2 loading on CO2 absorption
Tests were conducted on PCB40 with the addition of 0.5 M promoter to investigate the
effects of L/G ratio and CO2 loading on CO2 removal efficiency. All other variables were kept
the same as the base case. L/G ratio was varied at 2, 4 and 8 L/m3, equivalent to 0.50, 1 and 2
times, respectively, the theoretical minimum L/G for PCB40. Desired L/G ratios were achieved
using the same procedure as in the unpromoted solution, by varying the gas rate while keeping
the liquid flow rate constant. The results for PCB40 with each of the promoters are presented in
Fig. 3.10 (a)-(c).
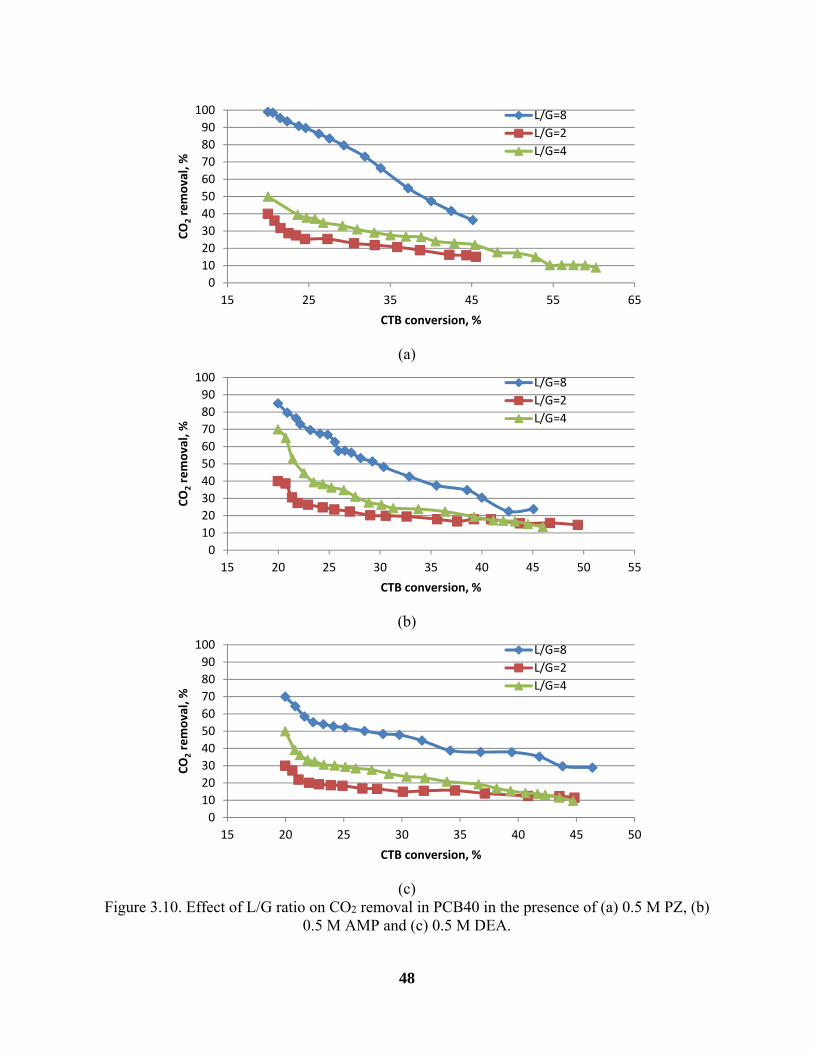
48
(a)
(b)
(c)
Figure 3.10. Effect of L/G ratio on CO2 removal in PCB40 in the presence of (a) 0.5 M PZ, (b) 0.5 M AMP and (c) 0.5 M DEA.
0
10
20
30
40
50
60
70
80
90
100
15 25 35 45 55 65
CO
2removal, %
CTB conversion, %
L/G=8
L/G=2
L/G=4
0
10
20
30
40
50
60
70
80
90
100
15 20 25 30 35 40 45 50 55
CO
2removal, %
CTB conversion, %
L/G=8
L/G=2
L/G=4
0
10
20
30
40
50
60
70
80
90
100
15 20 25 30 35 40 45 50
CO
2removal, %
CTB conversion, %
L/G=8
L/G=2
L/G=4

49
The trend for L/G ratio was the same as seen in the unpromoted PCB solution. In the
PCB40+0.5 M PZ solution, increasing L/G from 2 to 4 increased CO2 removal efficiency by
20% to 30%, depending on the CO2 loading. The performance at a higher L/G was increased
because of the enhanced gas liquid contact and an increased gas residence time. CO2 removal
efficiency decreased with increasing CO2 loading, mirroring the results in the unpromoted
solution. For PCB40+0.5 M DEA, CO2 removal efficiency decreased from 50% to 15% at an
L/G of 4 when the CTB conversion at the inlet increased from 20% to 40%. This was caused by
the reduced mass transfer driving force for CO2 absorption as the CO2 loading increased. All
three promoters had similar behavior; when the L/G was set to 8, removal rate was higher than
the L/G of 2 or 4. For DEA and AMP, the difference between the L/G of 2 and 4 decreased as
CO2 loading increased and, under the inlet CTB conversion above 40%, CO2 removal rates were
nearly the same. Addition of 0.5 M PZ promoted CO2 absorption into PCB40. For example at
an L/G of 8, removal efficiency was above 90% when the CTB conversion in the inlet solution
was in the 20% to 25% range.
3.3.3.2 Effect of inlet CO2 concentration on CO2 Absorption
Inlet CO2 concentration was varied from 14 vol% to 8 vol% to investigate its effect on
the CO2 removal efficiency. Results from the tests at the two CO2 inlet concentrations are shown
in Figure 3.11 (a)-(c), for each of the three promoters.
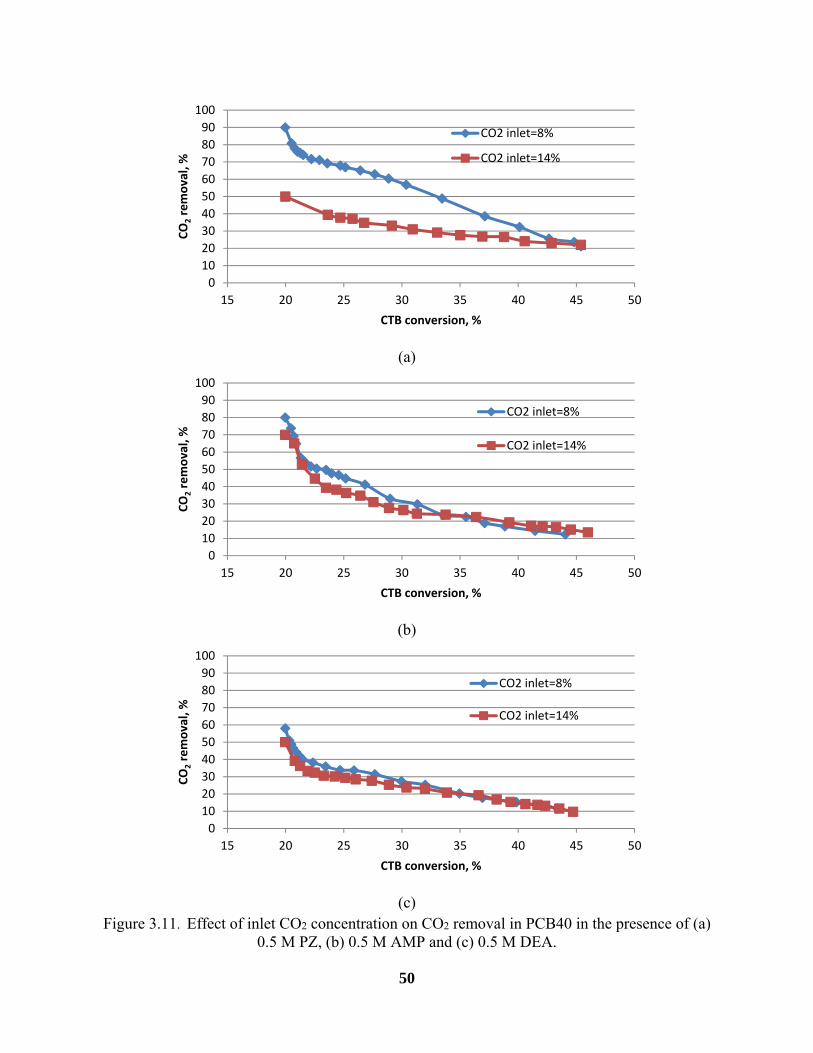
50
(a)
(b)
(c)
Figure 3.11. Effect of inlet CO2 concentration on CO2 removal in PCB40 in the presence of (a) 0.5 M PZ, (b) 0.5 M AMP and (c) 0.5 M DEA.
0
10
20
30
40
50
60
70
80
90
100
15 20 25 30 35 40 45 50
CO
2removal, %
CTB conversion, %
CO2 inlet=8%
CO2 inlet=14%
0
10
20
30
40
50
60
70
80
90
100
15 20 25 30 35 40 45 50
CO
2removal, %
CTB conversion, %
CO2 inlet=8%
CO2 inlet=14%
0
10
20
30
40
50
60
70
80
90
100
15 20 25 30 35 40 45 50
CO
2removal, %
CTB conversion, %
CO2 inlet=8%
CO2 inlet=14%
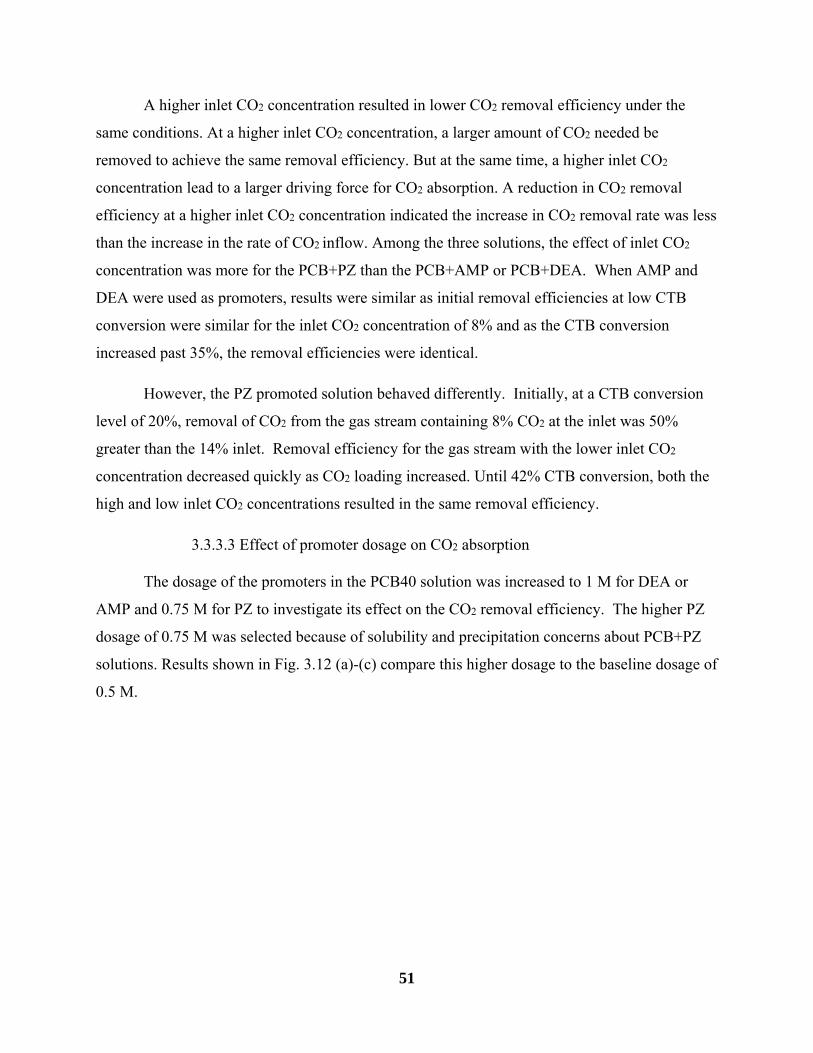
51
A higher inlet CO2 concentration resulted in lower CO2 removal efficiency under the
same conditions. At a higher inlet CO2 concentration, a larger amount of CO2 needed be
removed to achieve the same removal efficiency. But at the same time, a higher inlet CO2
concentration lead to a larger driving force for CO2 absorption. A reduction in CO2 removal
efficiency at a higher inlet CO2 concentration indicated the increase in CO2 removal rate was less
than the increase in the rate of CO2 inflow. Among the three solutions, the effect of inlet CO2
concentration was more for the PCB+PZ than the PCB+AMP or PCB+DEA. When AMP and
DEA were used as promoters, results were similar as initial removal efficiencies at low CTB
conversion were similar for the inlet CO2 concentration of 8% and as the CTB conversion
increased past 35%, the removal efficiencies were identical.
However, the PZ promoted solution behaved differently. Initially, at a CTB conversion
level of 20%, removal of CO2 from the gas stream containing 8% CO2 at the inlet was 50%
greater than the 14% inlet. Removal efficiency for the gas stream with the lower inlet CO2
concentration decreased quickly as CO2 loading increased. Until 42% CTB conversion, both the
high and low inlet CO2 concentrations resulted in the same removal efficiency.
3.3.3.3 Effect of promoter dosage on CO2 absorption
The dosage of the promoters in the PCB40 solution was increased to 1 M for DEA or
AMP and 0.75 M for PZ to investigate its effect on the CO2 removal efficiency. The higher PZ
dosage of 0.75 M was selected because of solubility and precipitation concerns about PCB+PZ
solutions. Results shown in Fig. 3.12 (a)-(c) compare this higher dosage to the baseline dosage of
0.5 M.

52
(a)
(b)
(c)
Figure 3.12. Effect of promoter dosage on CO2 removal in PCB40 in the presence of (a) 0.5 M PZ, (b) 0.5 M AMP and (c) 0.5 M DEA
0
20
40
60
80
100
15 25 35 45 55 65
CO
2removal, %
CTB conversion, %
PCB40+0.5M PZ PCB40+0.75M PZ
0
10
20
30
40
50
60
70
80
90
100
15 20 25 30 35 40 45 50
CO
2removal, %
CTB conversion, %
PCB40+0.5M AMP
PCB40+1M AMP
0
10
20
30
40
50
60
70
15 20 25 30 35 40 45 50
CO
2removal, %
CTB conversion, %
PCB40+0.5M DEA
PCB40+1M DEA

53
For all three promoters, CO2 removal efficiency increased with increasing promoter
dosage when the other test conditions remained the same. This increase in removal was due
mainly to faster CO2 absorption reactions in the presence of a larger amount of amine promoter
according to a “shuttle” mechanism (Hook, 1997). The PCB40 solution promoted with 0.75 M
PZ compared to 0.5 M PZ had the largest increase in removal efficiency. As a result of the
solubility issue with the PCB40+0.75 M PZ solution, there was precipitation in the column from
the beginning of the test; the longer the solution was circulated, the more precipitation
accumulated on the packing. Since some of the promoter or KHCO3 was immobilized in the
packing during this test, it was difficult to compare it to other tests because of the hydrodynamic
performance of the packing column. When the 1 M dosage of AMP was used, it improved the
removal rate by 18% at lean loading (20% CTB conversion) and by 48% at rich loading (45%
CTB conversion) over the 0.5 M dosage in PCB40. Similar behavior was seen with the addition
of 1 M DEA in PCB40; at lean loading the removal efficiency was 23% better and at rich loading
the efficiency was 50% better than the addition of 0.5 M dosage. CO2 removal efficiency can be
increased by increasing promoter dosage in the concentrated PCB solution (40 wt%).
3.3.3.4 Effect of PCB concentration on CO2 absorption
For the reasons described above, a concentrated PCB solution is preferred by the Hot-
CAP. The elevated temperature of the absorption process allows for the use of 40 wt% PCB
solution, which would not be possible at traditional absorption temperatures because of solubility
limitations. Even though this is a key part of the process, lower PCB concentrations were tested
to measure the effect it would have on CO2 removal rate. For lower concentrations of PCB, the
operating lean/rich range of CTB conversion would have to be higher to achieve the same
amount of CO2 removal. The results of tests varying PCB concentration are shown in Fig. 3.13.
All solutions used were promoted with 0.5 M PZ.

54
Figure 3.13. Effect of PCB concentration on CO2 removal, promoted with 0.5 M PZ at L/G=4.
These data highlight similar properties seen in previous tests. For example, the
differences in CO2 removal efficiency were large at lean loading; as CTB conversion increased,
removal rates at different PCB concentrations became comparable. The PCB20 had the highest
CO2 removal efficiency, followed by PCB30, and finally PCB40. According to the literature,
absorption rates of PCB solutions increase with increasing concentration at first and then pass
through a maximum. This is accounted for by the naturally increasing viscosity as the
concentration increases, as well as changes in pH in the solution (Comstock & Dodge, 1937).
These values are not comparable. Since a greater CTB conversion range would have to be used
in PCB20, CO2 removal rates equivalent to a 15% to 65% CTB conversion change could be
compared to those of PCB40 equivalent to a 20% to 45% CTB conversion change.
3.3.3.5 Comparison of different promoters on CO2 absorption
The effectiveness of different promoters for accelerating CO2 absorption into PCB40 was
compared on the basis of 0.5 M dosage of promoter. Test results for the comparison are
displayed in Fig. 3.14.
0
10
20
30
40
50
60
70
80
90
100
15 25 35 45 55 65
CO
2removal, %
CTB conversion, %
PCB40+0.5M PZ
PCB30+0.5M PZ
PCB20+0.5M PZ
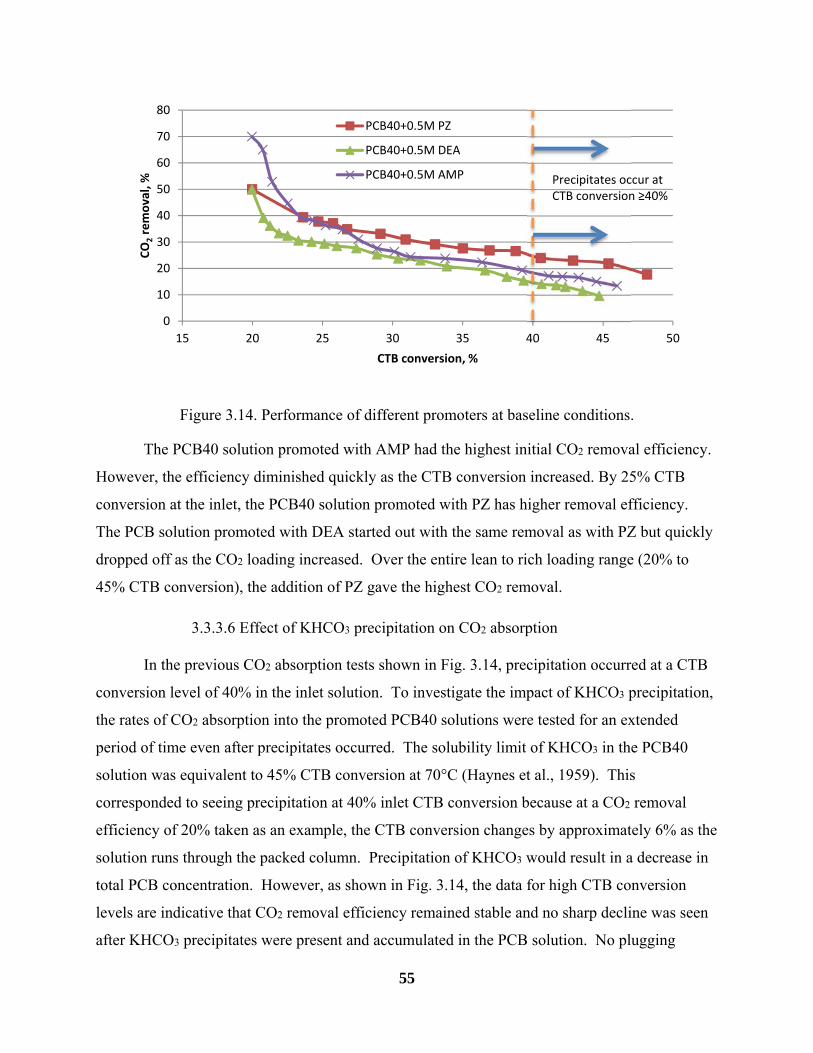
55
Figure 3.14. Performance of different promoters at baseline conditions.
The PCB40 solution promoted with AMP had the highest initial CO2 removal efficiency.
However, the efficiency diminished quickly as the CTB conversion increased. By 25% CTB
conversion at the inlet, the PCB40 solution promoted with PZ has higher removal efficiency.
The PCB solution promoted with DEA started out with the same removal as with PZ but quickly
dropped off as the CO2 loading increased. Over the entire lean to rich loading range (20% to
45% CTB conversion), the addition of PZ gave the highest CO2 removal.
3.3.3.6 Effect of KHCO3 precipitation on CO2 absorption
In the previous CO2 absorption tests shown in Fig. 3.14, precipitation occurred at a CTB
conversion level of 40% in the inlet solution. To investigate the impact of KHCO3 precipitation,
the rates of CO2 absorption into the promoted PCB40 solutions were tested for an extended
period of time even after precipitates occurred. The solubility limit of KHCO3 in the PCB40
solution was equivalent to 45% CTB conversion at 70°C (Haynes et al., 1959). This
corresponded to seeing precipitation at 40% inlet CTB conversion because at a CO2 removal
efficiency of 20% taken as an example, the CTB conversion changes by approximately 6% as the
solution runs through the packed column. Precipitation of KHCO3 would result in a decrease in
total PCB concentration. However, as shown in Fig. 3.14, the data for high CTB conversion
levels are indicative that CO2 removal efficiency remained stable and no sharp decline was seen
after KHCO3 precipitates were present and accumulated in the PCB solution. No plugging
0
10
20
30
40
50
60
70
80
15 20 25 30 35 40 45 50
CO
2removal, %
CTB conversion, %
PCB40+0.5M PZ
PCB40+0.5M DEA
PCB40+0.5M AMP Precipitates occur at CTB conversion ≥40%
56
associated with precipitation in the structured packing was observed during the tests. Similar
results for CO2 absorption in the presence of precipitates were seen in PCB40 promoted with PZ,
AMP and DEA. Therefore, it is possible for CO2 absorption to be operated in the presence of
KHCO3 precipitation without adversely affecting rate of absorption, provided the equipment can
handle the precipitates.
3.3.4 CO2 removal rates for unpromoted PCB, promoted PCB and benchmark 5 M MEA solutions.
Results of CO2 removal in unpromoted and promoted PCB solutions have been described
separately. Results of tests performed with unpromoted PCB40, PCB40 promoted with PZ, DEA
or AMP at the baseline dosage of 0.5 M and 5 M MEA solutions for their effectiveness of CO2
removal are shown in Fig. 3.15. Absorption temperature was 70°C for the PCB without or with a
promoter and 50°C for the MEA solution, which were typical of the Hot-CAP and MEA process,
respectively. Other variables were maintained at the baseline conditions. Since PCB and MEA
absorb CO2 through different chemical pathways, the method by which the CO2 loading is
reported is different. The Hot-CAP employs the PCB40 solution with the lean CO2 loading
equivalent to 15% to 20% CTB conversion and the rich CO2 loading equivalent to 40% to 45%
CTB conversion. In comparison, the MEA process operates at a CO2 loading of about 0.2 mol
CO2/mol MEA in the lean 5 M MEA solution and 0.40 to 0.45 mol CO2/mol MEA in the rich
solution. Therefore CO2 removal efficiencies at these corresponding lean and rich values can be
compared.

57
Figure 3.15. Comparison of CO2 removal efficiency in 5 M MEA and PCB40 solutions with and without promoters at baseline conditions.
There was an increase in CO2 removal rate for each of the promoters used over the
unpromoted PCB solution. At lean CO2 loading, CO2 absorption was increased by 5 to 7 times
with the promoters, and at rich loading (eg., CTB conversion of 45%); the rate was promoted 3
to 7 times. Both the promoted and unpromoted PCB solutions had similar trends over the CTB
conversion range tested; the higher the CO2 loading, the lower the absorption of CO2 from the
simulated flue gas into the solution. The promoters tested did increase the rate of CO2
absorption into the concentrated PCB solution, by on average 5 times, over its unpromoted
counterpart.
The promoted PCB solutions also outperformed the 5 M MEA solution, at a lean loading
of 0.2 mol CO2/mol MEA, the 5 M MEA solution had a removal efficiency of 25%, and at a rich
loading of 0.4 mol/mol, only 5% of CO2 was removed. At similar lean conditions with a CTB
conversion of 20%, PCB40+0.5 M AMP had the highest removal efficiency of the three
promoters at 70%, and at rich conditions with a CTB conversion of 40%, PCB40+0.5 M PZ had
the highest removal efficiency at 25%. Based on trends observed in these experiments, CO2
0.15 0.2 0.25 0.3 0.35 0.4 0.45 0.5
0
10
20
30
40
50
60
70
80
15 20 25 30 35 40 45 50 55
CO2 Loading (mol CO2/mol MEA)
CO
2removal, %
CTB conversion, %
PCB40+0.5M PZ
PCB40+0.5M DEA
PCB40+0.5M AMP
Un‐promoted PCB40
5M MEA

58
removal rates into the promoted lean and rich PCB solutions at 70°C were higher than their 5 M
MEA counterpart solutions at 50°C. At lean loading, removal rates of CO2 in the promoted PCB
were 1 to 3 times higher than the 5 M MEA, and at rich loading, rates in the promoted PCB40
solutions were 3 to 5 times higher than the 5 M MEA.
3.3.5 CO2 absorption into Na2CO3/NaHCO3 solution
A SCB solution can be used as an alternative solvent to a PCB solution in the Hot-CAP.
SCB has some advantages over PCB including the fact that sodium bicarbonate (NaHCO3) can
be precipitated more easily via cooling to form a NaHCO3 slurry for CO2 stripping because it has
lower solubility than KHCO3. In addition, NaHCO3 slurry can produce a higher stripping
pressure than KHCO3 slurry since the CO2 equilibrium pressure over SCB is higher than that
over PCB.
Similar absorption tests were performed with SCB solutions (Table 3.4). Because
solubility of NaHCO3 is lower than KHCO3, a SCB solution with a total concentration (Na2CO3
equivalent) of 15 wt% (SCB15) was used instead of 40 wt% for PCB. To meet the comparable
goal of CO2 removal with this lower concentration, a wider operating range of CTB conversion
was required for the SCB15 if similar conditions were used for both the SCB15 and PCB40
solvents. For the PCB40 solution, a lean solution of 20% and a rich solution of 40% to 45% CTB
conversion were typical of the process. To achieve the desired CO2 removal with the SCB15
solution, the lean solution at 15% CTB conversion and the rich solution at 55% to 60% CTB
conversion were preferred. The baseline process conditions for CO2 absorption into SCB are
shown in the following table.
Table 3.8. Baseline conditions for SCB solutions in packed bed column testing.
Concentration of total SCB (Na2CO3-quivalent, wt%) 15 Temperature (°C) 70
Initial CTB conversion ratio 15 Liquid to gas ratio (L/m3) 4
Liquid flow (LPM) 0.56 Gas flow (LPM) 110
CO2 inlet % 14 Promoter DEA, AMP, PZ
Promoter dosage (mol/L) 0.5

59
3.3.5.1 Effect of L/G ratio and CO2 loading on CO2 removal in unpromoted SCB solutions
To establish a baseline to compare the promoted SCB15 solution, unpromoted SCB15
was first tested at L/G ratios of 4 and 12 L/m3, which were equivalent to 0.55 and 1.65 times its
minimum L/G, respectively (Knuutila et al., 2010). The other process conditions are given in
Table 3.8. Results of the CO2 absorption at varying L/G ratios and CTB conversion levels are
shown in Fig. 3.16.
Figure 3.16. Effect of L/G ratio and CTB conversion on CO2 removal efficiency in unpromoted
SCB15 solutions.
Results of these tests were similar to the unpromoted PCB tests. The higher L/G ratio
resulted in a higher CO2 removal, especially at lean CTB conversion. This was due to the
increased gas residence time in the column as afore described for PCB. CO2 absorption rates of
the unpromoted SCB15 solution were low at lean CTB but decreased even more with increasing
CTB conversion. This was due to the reduced driving force as more CO2 was loaded into the
solution, causing a decrease in CO2 absorption performance.
3.3.5.2 Effect of L/G ratio and CO2 loading on CO2 removal in promoted SCB solutions
Only PZ promoter was tested to accelerate the absorption rates of SCB15 solutions. In
Fig. 3.17 is depicted the effect of L/G ratio on CO2 removal by SCB15 solutions promoted by 0.5
0
5
10
15
20
25
0 10 20 30 40 50 60
CO
2removal %
CTB conversion, %
L/G=12
L/G=4

60
M PZ. The L/G ratios of 4, 8, and 12 L/m3 were selected, which were equivalent to 0.55, 1.10
and 1.65 times the minimum L/G.
Figure 3.17. Effect of L/G ratio and CTB conversion on CO2 removal efficiency in promoted SCB15 solutions.
At the same CTB conversion at the inlet, the rate of CO2 absorption into the SCB15
increased with increasing L/G ratio. This tendency was the same as that for PCB solution and the
unpromoted SCB solution. For the SCB15+0.5 M PZ solution at the L/G of 4 L/m3, the solution
with 15% initial CTB conversion removed 50% of the CO2 while that with 60% initial CTB
conversion removed 15% of the CO2. When the L/G ratio was increased to 12 L/m3, the removal
efficiency increased, but a larger difference was seen at lower CTB conversion. At 15% initial
CTB conversion, the higher L/G of 12 resulted in 90% removal of the CO2 and at 60% initial
CTB conversion, it removed 20% of the CO2. The increase in removal efficiency was 1.8 times
in the lean SCB+PZ solution but only 1.3 times in the rich solution. As described earlier, higher
CO2 removal efficiencies at higher L/G ratios can be attributed to better gas liquid contact and
longer gas residence times.
3.3.5.3 Comparison of CO2 removal efficiencies in SCB15, PCB40, and 5 M MEA
In Figure 3.18, the results of the unpromoted SCB15 and SCB15 promoted with 0.5 M
PZ are compared with those of 5 M MEA, unpromoted PCB40 and PCB40 promoted with 0.5 M
0
10
20
30
40
50
60
70
80
90
100
0 10 20 30 40 50 60 70 80 90
CO
2removal %
CTB conversion, %
L/G=4
L/G=12
L/G=8

61
PZ as previously described. All these data were from tests conducted at the same conditions,
with an L/G ratio of 4 L/m3 and 70°C. The only differences in the tests were the compositions of
the solutions themselves and the CO2 loading ranges.
Figure 3.18. Comparison of CO2 removal rates in unpromoted SCB15, promoted SCB15, unpromoted PCB40, promoted PCB40 and 5 M MEA.
Unpromoted SCB15 had a higher removal rate than the unpromoted PCB40. This was to
be expected based on the previous discussion of the effect of PCB concentration on CO2 removal
efficiency, because SCB followed a similar trend of having a maximum removal efficiency of 10
wt% to 20 wt% (Comstock & Dodge, 1937).
The addition of 0.5 M PZ promoted the rate of CO2 absorption into the SCB15 solution:
the removal was amplified by 3.8 times for the lean solution (15% initial CTB conversion) and
3.5 times for a rich solution (50% CTB conversion) over the respective unpromoted solutions.
The addition of the PZ promoter into the SCB solution was as effective as into the PCB solution
to promote the CO2 absorption.
0.15 0.2 0.25 0.3 0.35 0.4 0.45 0.5
0
10
20
30
40
50
0 10 20 30 40 50 60 70 80 90
CO2 loading in MEA, mol CO2/mol MEA
CO
2removal, %
CTB conversion, %
PCB40+0.5MPZ
SCB15+0.5M PZ
Un‐promoted SCB15
Un‐promoted PCB40
5M MEA

62
At the same L/G ratio (4 L/m3), the SCB15 solution with the addition of 0.5 M PZ had a
CO2 removal efficiency at 70C higher than that of the 5 M MEA solution with the
corresponding CO2 loading range at 50C (Fig. 3.18). As described before, CO2 loading in a
typical MEA absorber changes from 0.20 (lean) to 0.45 (rich) mol/mol as the solution runs
through the column. For the SCB absorber, CTB conversion change from 15% at the top to 60%
at the bottom is desired based on VLE behavior of SCB15. Comparing the CO2 removal
efficiencies at these values, the SCB15 solution with 0.5 M PZ would have a better performance
for CO2 absorption than the 5 M MEA solution.
3.3.6 CO2 absorption into PCB/SCB solution mixtures
A mixture solution of PCB (25 wt%, K2CO3 equivalent) and SCB (10 wt%, Na2CO3
equivalent), symbolized as PCB25/SCB10, was tested. The composition of the solution was
selected based on a crystallization study previously conducted (Lu et al., 2012). They confirmed
that by cooling the CO2 rich PCB/SCB25-10 with CO2 loading equivalent to 40% CTB
conversion from 70 to 35 C, NaHCO3 crystal (in form of nahcolite) was a dominant phase in a
continuous mixed suspension, mixed product removal (MSMPR) reactor. Since using a mixture
would be advantageous for the crystallization operation due to its lower solubility compared to a
plain PCB solution while still maintaining a high solvent concentration compared to a plain SCB
solution, absorption performance of the mixture solution was tested to investigate if it was
comparable to the promoted PCB40 and other solutions tested. The baseline testing conditions
for the PCB/SCB mixture solution are given in Table 3.9.
Table 3.9. Baseline conditions for promoted PCB/SCB solutions in packed-bed column testing.
Concentration of K2CO3/KHCO3 (K2CO3- equivalent, wt%) 25 Concentration of K2CO3/KHCO3 (K2CO3- equivalent wt%) 10
Temperature (°C) 70 Initial CTB conversion ratio 20
Liquid to gas ratio (L/m3) 4 Liquid flow (LPM) 0.56
Gas flow (LPM) 110 CO2 inlet concentration (vol%) 14
Promoter PZ, DEA, AMP Promoter dosage (mol/L) 0.5

63
The L/G ratio of 4 L/m3 was chosen as the baseline for the SCB25/PCB10 solution for
comparison purposes, since the vapor liquid equilibrium (VLE) data for this solution was not
available. A dose of 0.5 M PZ was used as a baseline promoter for PCB/SCB solutions. The full
test matrix can be found in Table 3.4.
3.3.6.1 Effect of L/G ratio and CO2 loading on CO2 removal in promoted PCB/SCB mixture solutions
The effects of L/G ratio and CO2 loading on CO2 removal were investigated in the
PCB/SCB solutions in the same manner as performed previously in plain PCB or SCB solutions.
The same L/G ratios of 4, 8 and 12 L/m3 were chosen. The results are presented in Figure 3.19.
Figure 3.19. Effect of L/G ratio and CTB conversion on CO2 removal efficiency, PCB25/SCB10+0.5 M PZ.
At the same CTB conversion, CO2 absorption rate into the PCB/SCB solution increased
with increasing L/G ratio. This trend was seen in previously tested PCB or SCB solutions. At the
L/G of 4 L/m3, the PCB25/SCB10 solution with 20% initial CTB conversion removed 60% of
the CO2 while the solution with 45% initial CTB conversion removed 17% of the CO2. When the
L/G ratio was increased to 8 and 12 L/m3, removal efficiency increased, but a larger difference
was seen at lower levels of CTB conversion. When increasing from an L/G of 4 to 8 L/m3,
removal efficiency increased by 1.33 times in the lean solution and 1.18 times in the rich
0
10
20
30
40
50
60
70
80
90
100
15 25 35 45 55 65 75
CO
2removal, %
CTB conversion, %
L/G=4
L/G=8
L/G=12

64
solution. Reasons for higher efficiencies of CO2 removal at higher L/G ratios were the same as
those described for PCB or SCB.
3.3.6.2 Effect of inlet CO2 concentration on CO2 removal in promoted PCB/SCB mixture solutions
The inlet CO2 concentration was varied from 14% to 8% to examine if this had any effect
on removal efficiency. All other conditions remained the same and the experiment was
conducted at an L/G of 4 L/m3. Results are shown in Figure 3.20.
Figure 3.20. Effect of inlet CO2 concentration on CO2 removal, PCB25/SCB10+0.5M PZ
At a lower CO2 inlet concentration, CO2 removal efficiency of the lean
PCB25/SCB10+0.5 M PZ solution was increased. In comparison, at the rich conditions, removal
efficiency was almost identical. At a higher inlet CO2 concentration, a larger amount of CO2
needed to be removed to achieve the same removal efficiency while there was also a higher
driving force for CO2 absorption when inlet concentration was higher. These results can be
explained by the same logic used for PCB or SCB solutions.
3.3.6.3 Effect of different promoters and varying concentrations of PCB and SCB on CO2 removal in promoted PCB/SCB mixture solutions
As with plain PCB or SCB, it was important to see the impact of how different promoters
increased CO2 absorption rate into the PCB/SCB mixture solution. CO2 absorption into a
0
10
20
30
40
50
60
70
80
90
15 25 35 45 55 65 75
CO
2removal, %
CTB conversion, %
Inlet CO2=14%
Inlet CO2=8%
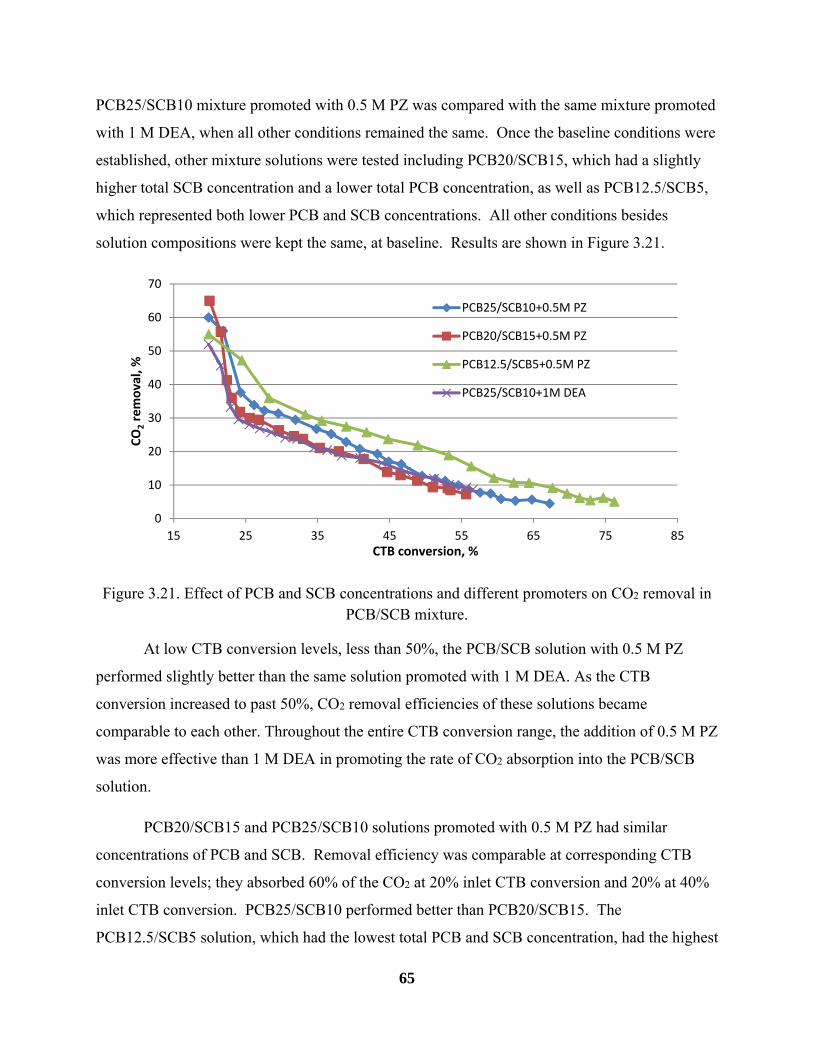
65
PCB25/SCB10 mixture promoted with 0.5 M PZ was compared with the same mixture promoted
with 1 M DEA, when all other conditions remained the same. Once the baseline conditions were
established, other mixture solutions were tested including PCB20/SCB15, which had a slightly
higher total SCB concentration and a lower total PCB concentration, as well as PCB12.5/SCB5,
which represented both lower PCB and SCB concentrations. All other conditions besides
solution compositions were kept the same, at baseline. Results are shown in Figure 3.21.
Figure 3.21. Effect of PCB and SCB concentrations and different promoters on CO2 removal in PCB/SCB mixture.
At low CTB conversion levels, less than 50%, the PCB/SCB solution with 0.5 M PZ
performed slightly better than the same solution promoted with 1 M DEA. As the CTB
conversion increased to past 50%, CO2 removal efficiencies of these solutions became
comparable to each other. Throughout the entire CTB conversion range, the addition of 0.5 M PZ
was more effective than 1 M DEA in promoting the rate of CO2 absorption into the PCB/SCB
solution.
PCB20/SCB15 and PCB25/SCB10 solutions promoted with 0.5 M PZ had similar
concentrations of PCB and SCB. Removal efficiency was comparable at corresponding CTB
conversion levels; they absorbed 60% of the CO2 at 20% inlet CTB conversion and 20% at 40%
inlet CTB conversion. PCB25/SCB10 performed better than PCB20/SCB15. The
PCB12.5/SCB5 solution, which had the lowest total PCB and SCB concentration, had the highest
0
10
20
30
40
50
60
70
15 25 35 45 55 65 75 85
CO2removal, %
CTB conversion, %
PCB25/SCB10+0.5M PZ
PCB20/SCB15+0.5M PZ
PCB12.5/SCB5+0.5M PZ
PCB25/SCB10+1M DEA
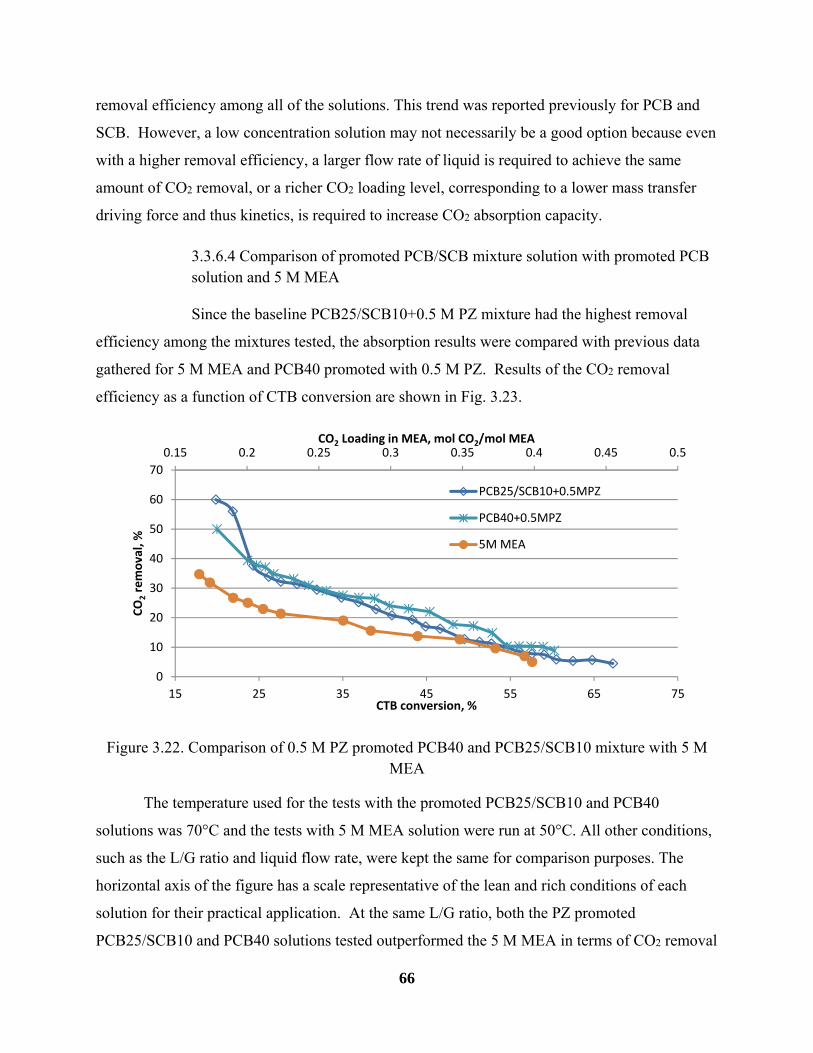
66
removal efficiency among all of the solutions. This trend was reported previously for PCB and
SCB. However, a low concentration solution may not necessarily be a good option because even
with a higher removal efficiency, a larger flow rate of liquid is required to achieve the same
amount of CO2 removal, or a richer CO2 loading level, corresponding to a lower mass transfer
driving force and thus kinetics, is required to increase CO2 absorption capacity.
3.3.6.4 Comparison of promoted PCB/SCB mixture solution with promoted PCB solution and 5 M MEA
Since the baseline PCB25/SCB10+0.5 M PZ mixture had the highest removal
efficiency among the mixtures tested, the absorption results were compared with previous data
gathered for 5 M MEA and PCB40 promoted with 0.5 M PZ. Results of the CO2 removal
efficiency as a function of CTB conversion are shown in Fig. 3.23.
Figure 3.22. Comparison of 0.5 M PZ promoted PCB40 and PCB25/SCB10 mixture with 5 M MEA
The temperature used for the tests with the promoted PCB25/SCB10 and PCB40
solutions was 70°C and the tests with 5 M MEA solution were run at 50°C. All other conditions,
such as the L/G ratio and liquid flow rate, were kept the same for comparison purposes. The
horizontal axis of the figure has a scale representative of the lean and rich conditions of each
solution for their practical application. At the same L/G ratio, both the PZ promoted
PCB25/SCB10 and PCB40 solutions tested outperformed the 5 M MEA in terms of CO2 removal
0.15 0.2 0.25 0.3 0.35 0.4 0.45 0.5
0
10
20
30
40
50
60
70
15 25 35 45 55 65 75
CO2 Loading in MEA, mol CO2/mol MEA
CO
2removal, %
CTB conversion, %
PCB25/SCB10+0.5MPZ
PCB40+0.5MPZ
5M MEA

67
efficiencies at either CO2 lean or rich conditions. The PCB25/SCB10 and PCB40 solutions with
20% inlet CTB conversion removed 60% and 50%, respectively, while 5 M MEA with 0.20
mol/mol CO2 loading absorbed 25% of the CO2. This continued as the CO2 loading increased in
each of the solutions.
68
Chapter 4
Conclusions and Recommendations
4.1. Conclusions
4.1.1 Screening of promoters to accelerate CO2 absorption into K2CO3/KHCO3
solutions
Five different primary and secondary amines were evaluated as promoters for a
concentrated 40 wt% potassium carbonate/bicarbonate (PCB) solution using a batch stirred tank
reactor. All amines improved the rate of CO2 absorption into the PCB solution. These amine
promoters increased the absorption rates into the PCB solution at 70°C by 3.5 to 50 times,
depending on the type and dosage of the promoters, carbonate to bicarbonate (CTB) conversion
and pCO2. Among the five promoters, the rates promoted with piperazine (PZ) and aminomethyl
propanol (AMP) were the highest. Compared to the monoethanolamine (MEA) solution loaded
with 0.2 mol CO2/mol MEA, a typical CO2 lean condition in the benchmark MEA process at
50°C, the absorption rates of the PCB40-20 promoted with 1 M PZ and 1 M AMP at 70°C were
greater than or equal to that of the MEA solutions. These same promoters increased absorption
rate into PCB solution at higher CO2 loading. Amine promoters are promising for accelerating
CO2 absorption into the PCB solution. The best performing promoters, PZ and AMP, and an
industrial benchmark promoter, diethanolamine (DEA), were selected for further investigation in
the bench scale packed bed column.
Amino acid salts also were screened as solvents for CO2 absorption. Five amino acid
salts, including K-glycine, K-sacrosine, K-proline, K-taurine, and K-alanine were tested. All of
the amino acid salt aqueous solutions showed high rates of CO2 absorption, especially 3 M K-
glycine, K-sacrosine and K-proline. These solutions tested at 70ºC exhibited rates higher than or
comparable to those of 5 M MEA at 50ºC. The three highest performing amino acid salts, K-
glycine, K-sacrosine and K-proline were evaluated as promoters for CO2 absorption into PCB40
solution at 70ºC. The rates into both PCB40-20 and PCB40-40 were accelerated by these
promoters. K-sacrosine and K-glycine improved the absorption rate more than K-proline. But,

69
compared to the rate of absorption into 5 M MEA with CO2 loading of 0.20 mol CO2/mol MEA,
rates into the PCB40-20 promoted by these amino acid salts were lower.
4.1.2 Kinetic study of CO2 absorption into a concentrated K2CO3/KHCO3
solution in a packed bed column
Testing of CO2 absorption in the bench scale, packed bed column revealed that the use of
rate promoters increased the rate of CO2 removal into PCB solution. The concentrated PCB40
solution promoted with 0.5 M PZ, DEA or AMP tested at 70°C performed 1 to 3 times better
than 5 M MEA at 50°C at their respective lean loading levels and 3 to 5 times better at rich CO2
loading levels, when all other conditions remained the same. In all PCB solutions tested, CO2
removal rate increased as L/G ratio increased, as CO2 loading decreased, or as inlet CO2
concentration decreased. The addition of PZ into the PCB solution was the most effective
among the tested promoters in accelerating the rate.
If desired, a sodium carbonate/bicarbonate (SCB) solution can be used as an alternative
solvent to a PCB solution in the Hot-CAP to take advantage of certain properties. A lower
concentration of SCB was tested compared to PCB because of its lower solubility. After testing
SCB15 with different promoters and at different L/G ratios, results followed the same trends as
the PCB solution. SCB15 promoted with 0.5 M PZ had the best performance out of the SCB
solutions tested, but the overall CO2 removal efficiency was slightly lower than the PCB40
promoted with 0.5 M PZ.
Another solvent that could be used for CO2 absorption in Hot-CAP is a PCB/SCB
mixture solution. This attempts to take advantage of the best attributes of each chemical. The
results from the tests with PCB/SCB mixtures reflected the same trends of parametric effects
seen in the tests with both the plain PCB and SCB solutions. The PCB25/SCB10 solution
promoted with 0.5 M PZ had the highest CO2 removal efficiency at 70°C, which was comparable
to the promoted PCB40 and higher than 5 M MEA at 50°C.
70
4.2. Recommendations
The work presented here should be continued by investigation of the mechanism and
intrinsic kinetics behind these amine promoted PCB reactions. This will help find more accurate
kinetic constants that can be used to develop a model of the absorption column for the equipment
design and scale up. Various chemical analysis tools can be used to identify intermediates and
products of the different amine promoted reactions. Knowing the chemistry taking place will
enable a better understanding of the process as a whole.
A further investigation into the effect of precipitation in the PCB solution on CO2
absorption rate is recommended. This is an interesting phenomenon from what has been
observed in the experiments thus far and is important to continue to pursue. In addition, more
tests can be conducted that integrate the different unit operations of the Hot-CAP together, for
example running the absorption and stripping column together in a full loop.
71
References
Alper, E., & Deckwer, W. (1980). Kinetics of absorption of CO2 into buffer solutions containing carbonic anhydrase. Chemical Engineering Science, 35(3), 549-557.
Anderson, C., Harkin, T., Ho, M., Mumford, K., Qader, A., Stevens, G., & Hooper, B. (2013). Developments in the CO2CRC UNO MK 3 process: A multi-component solvent process for large scale CO2 capture. Energy Procedia, 37(0), 225-232.
Black, S., Bucholz, T., Martinelli, R., Rambo, B., Reardon, J., & Hulvey, M. (2012). Enzyme catalyzed process for low cost CO2 separation and capture. Air and Waste Management Association Power Plant Air Pollutant Control "MEGA" Symposium 2012, 2 779-794.
Boot-Handford, M. E., Abanades, J. C., Anthony, E. J., Blunt, M. J., Brandani, S., Mac Dowell, N., Fennell, P. S. (2014). Carbon capture and storage update. Energy and Environmental Science: The Royal Society of Chemistry.
Bosch, H., Versteeg, G. F., & Van Swaaij, W. P. M. (1989). Gas-liquid mass transfer with parallel reversible reactions-II. absorption of CO2 into amine-promoted carbonate solutions. Chemical Engineering Science, 44(11), 2735-2743.
Cents, A. H. G., Brilman, D. W. F., & Versteeg, G. F. (2001). Gas absorption in an agitated gas-liquid-liquid system. Chemical Engineering Science, 56(3), 1075-1083.
Comstock, C., & Dodge, B. (1937). Rate of carbon dioxide absorption by carbonate solutions in a packed tower. Industrial & Engineering Chemistry, 29(5), 520-529.
Cullinane, J. T. (2002). Carbon dioxide absorption in aqueous mixtures of potassium carbonate and piperazine. The University of Texas at Austin, Austin.,
Cullinane, J. T. (2005). Thermodynamics and kinetics of aqueous piperazine with potassium carbonate for carbon dioxide absorption. The University of Texas at Austin, Austin.,
Danckwerts, P. V. (1968). Gas absorption with instantaneous reaction. Chemical Engineering Science, 23(9), 1045-1051.
Figueroa, J. D., Fout, T., Plasynski, S., McIlvried, H., & Srivastava, R. D. (2008). Advances in CO2 capture technology the U.S. department of energy's carbon sequestration program. International Journal of Greenhouse Gas Control, 2(1), 9-20.

72
Hilliard, M., 2005. Thermodynamics of aqueous piperazine/potassium carbonate/carbon dioxide characterized by the electrolyte NRTL model within Aspen Plus®. Master Thesis. University of Texas, Department of Chemical Engineering, Austin, USA.
Hook, R. J. (1997). An investigation of some sterically hindered amines as potential carbon dioxide scrubbing compounds. Industrial and Engineering Chemistry Research, 36(5), 1779-1790.
Kenarsari, S. D., Yang, D., Jiang, G., Zhang, S., Wang, J., Russell, A. G., Fan, M. (2013). Review of recent advances in carbon dioxide separation and capture. RSC Advances: The Royal Society of Chemistry.
Kothandaraman, A., Nord, L., Bolland, O., Herzog, H. J., & McRae, G. J. (2009). Comparison of solvents for post-combustion capture of CO2 by chemical absorption. Energy Procedia, , 1(1) 1373-1380.
Kumar, S., Cho, J. H., & Moon, I. (2014). Ionic liquid-amine blends and CO2BOLs: Prospective solvents for natural gas sweetening and CO2 capture technology-A review. International Journal of Greenhouse Gas Control, 20, 87-116.
Lu, Y., & et al. (2012). Bench-scale development of a hot carbonate absorption process with crystallization-enabled high pressure stripping for post-combustion CO2 capture, quarterly report 8.Illinois State Geological Survey.
Moene, R., Schoon, L., van Straelen, J., & Geuzebroek, F. (2013). Precipitating carbonate process for energy efficient post-combustion CO2 capture. Energy Procedia, 37(0), 1881-1887.
Onda, K., Takeuchi, H., & Okumoto, Y. (1968). Mass transfer coefficients between gas and liquid phases in packed columns. Journal of Chemical Engineering of Japan, , 56-62.
Royal Society of Chemistry. (2014). Retrieved 4/1, 2014, from http://www.chemspider.com/
U.S. Energy Information Administration. (2013). April 2013 monthly energy review.