Embed Size (px)
Citation preview
CO2 emissions on a quarterly
basis
Maarten van Rossum en Sjoerd Schenau
Content
• Background and reason for quarterly CO2
emissions
• Estimation methods for stationary sources
• Estimation methods for mobile sources
• Overal quality assesment
• Results
• Dissemination strategy and conclusions
Introduction
Goal: investigate if it is possible to calculate structural CO2
air emission accounts for the Netherlands on a quarterly
basis (t+45).
Faster (create awareness for policy makers and general
public)
Analyses (more datapoints, influence of weather)
Eurostat Grant: Study executed in 2010
Point of departure
• Environmental accounts concepts resident
principle
• Not Kyoto data on a quarterly basis
• On the basis of existing source statistics
• Testing how well quarterly emissions can
estimate the annual figure
Methodology for stationary emissions and mobile sources
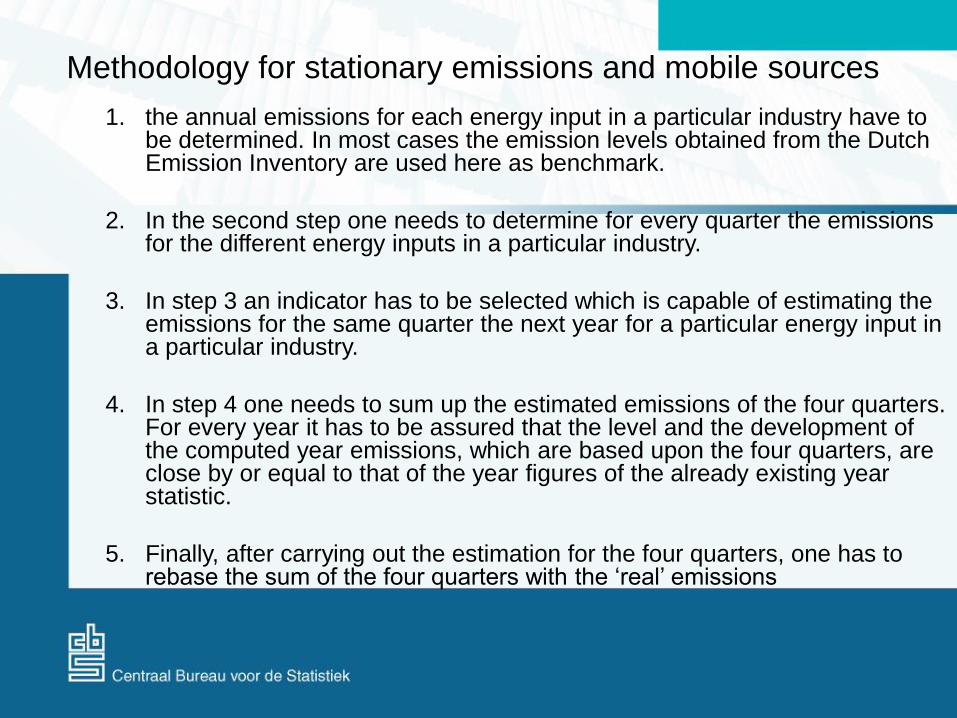
1. the annual emissions for each energy input in a particular industry have to be determined. In most cases the emission levels obtained from the Dutch Emission Inventory are used here as benchmark.
2. In the second step one needs to determine for every quarter the emissions for the different energy inputs in a particular industry.
3. In step 3 an indicator has to be selected which is capable of estimating the emissions for the same quarter the next year for a particular energy input in a particular industry.
4. In step 4 one needs to sum up the estimated emissions of the four quarters. For every year it has to be assured that the level and the development of the computed year emissions, which are based upon the four quarters, are close by or equal to that of the year figures of the already existing year statistic.
5. Finally, after carrying out the estimation for the four quarters, one has to rebase the sum of the four quarters with the ‘real’ emissions
Most important sources for
stationary sources
• Gas balance
• Oil products balances
• Coal balance
• Renewable energy statistics (biomass input,
incineration of waste)
• Sum of degrees below 18 degrees (agriculture)
Stationary sources: average absolute error in
development
• Quality level, due to lack of information or imperfect indicators, for some individual NACE classes not good enough aggregating
• On the macro scale we have complete information (3 months )for natural gas combustion. This information serves as a good macro indicator and quality check. Sum of individual NACE classes must equal macro indicator. This is not the case action: adapt data individual NACE classes
• The Netherlands uses a lot of natural gas, so we are lucky to have complete information on this energy carrier
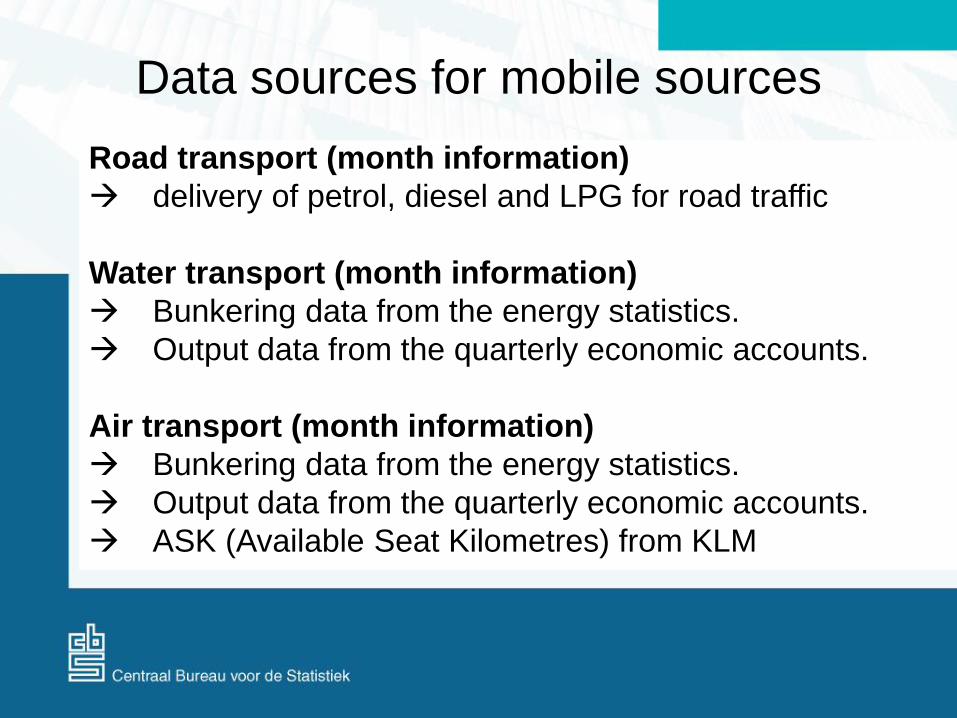
Data sources for mobile sources
Road transport (month information)
delivery of petrol, diesel and LPG for road traffic
Water transport (month information)
Bunkering data from the energy statistics.
Output data from the quarterly economic accounts.
Air transport (month information)
Bunkering data from the energy statistics.
Output data from the quarterly economic accounts.
ASK (Available Seat Kilometres) from KLM
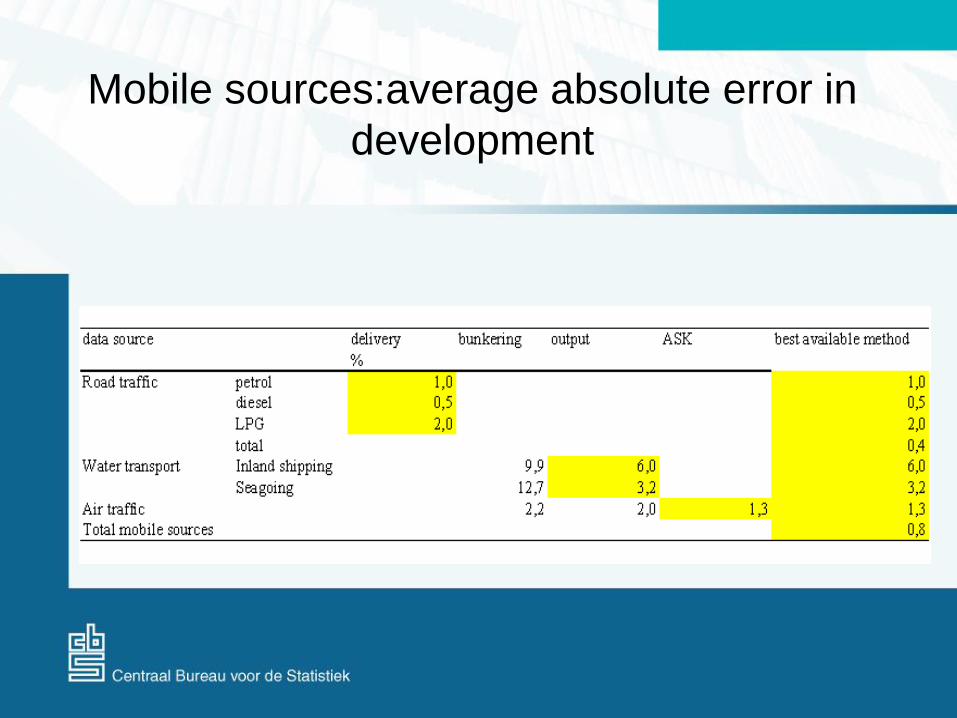
Mobile sources:average absolute error in
development
Overal quality assesment: macro level
• An essential test to assess the overall quality of the applied
methodology is to compare the sum of the estimated
emissions for the four quarters with both the level and the
development of the already existing annual statistic for CO2
emissions from the air emission accounts.
• This is very important because one needs to avoid major
adjustments in figures in publications. Also, this should avoid
difficulties in communicating CO2 emissions to the public.
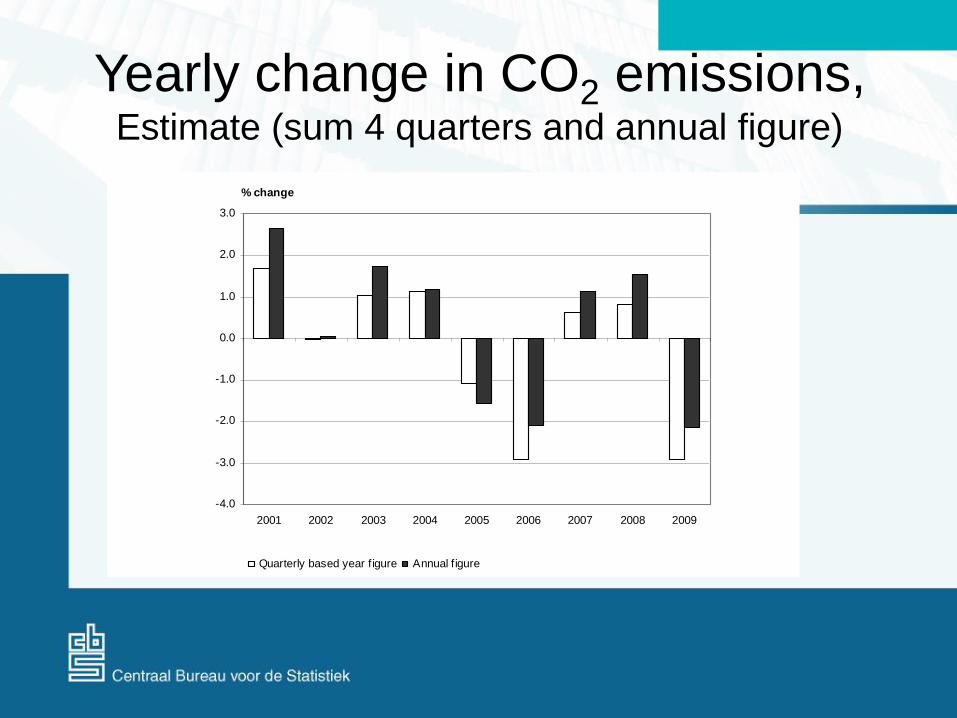
Yearly change in CO2 emissions,Estimate (sum 4 quarters and annual figure)
-4.0
-3.0
-2.0
-1.0
0.0
1.0
2.0
3.0
2001 2002 2003 2004 2005 2006 2007 2008 2009
% change
Quarterly based year f igure Annual f igure
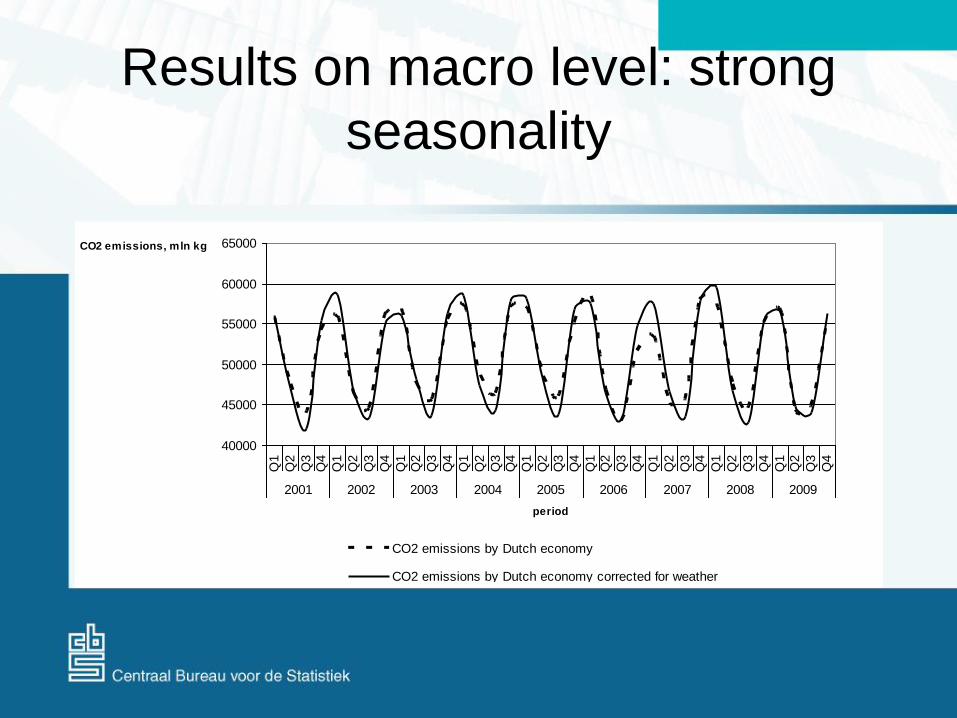
Results on macro level: strong
seasonality
40000
45000
50000
55000
60000
65000
Q1
Q2
Q3
Q4
Q1
Q2
Q3
Q4
Q1
Q2
Q3
Q4
Q1
Q2
Q3
Q4
Q1
Q2
Q3
Q4
Q1
Q2
Q3
Q4
Q1
Q2
Q3
Q4
Q1
Q2
Q3
Q4
Q1
Q2
Q3
Q4
2001 2002 2003 2004 2005 2006 2007 2008 2009
period
CO2 emissions, mln kg
CO2 emissions by Dutch economy
CO2 emissions by Dutch economy corrected for weather
influences
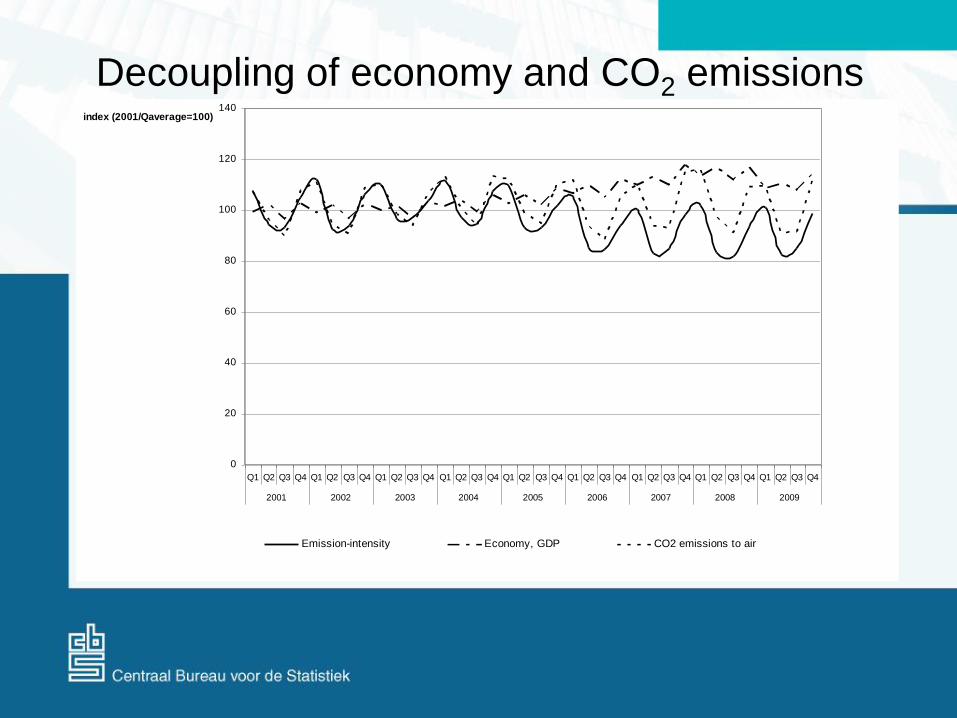
Decoupling of economy and CO2 emissions
0
20
40
60
80
100
120
140
Q1 Q2 Q3 Q4 Q1 Q2 Q3 Q4 Q1 Q2 Q3 Q4 Q1 Q2 Q3 Q4 Q1 Q2 Q3 Q4 Q1 Q2 Q3 Q4 Q1 Q2 Q3 Q4 Q1 Q2 Q3 Q4 Q1 Q2 Q3 Q4
2001 2002 2003 2004 2005 2006 2007 2008 2009
period
index (2001/Qaverage=100)
Emission-intensity Economy, GDP CO2 emissions to air
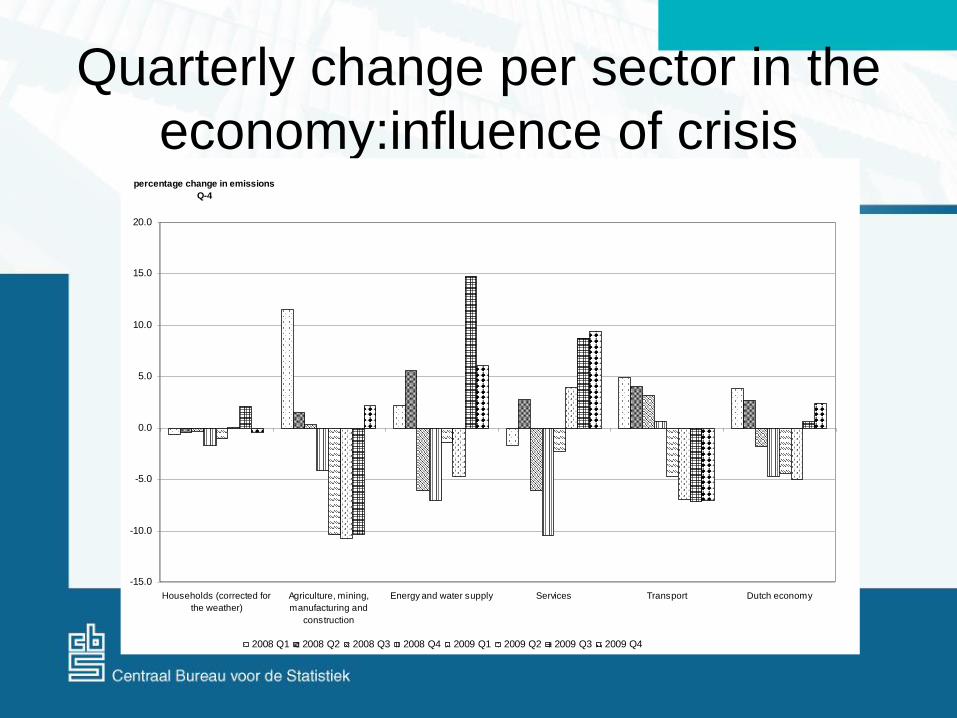
Quarterly change per sector in the
economy:influence of crisis
-15.0
-10.0
-5.0
0.0
5.0
10.0
15.0
20.0
Households (corrected for
the weather)
Agriculture, mining,
manufacturing and
construction
Energy and water supply Services Transport Dutch economy
percentage change in emissions
Q-4
2008 Q1 2008 Q2 2008 Q3 2008 Q4 2009 Q1 2009 Q2 2009 Q3 2009 Q4
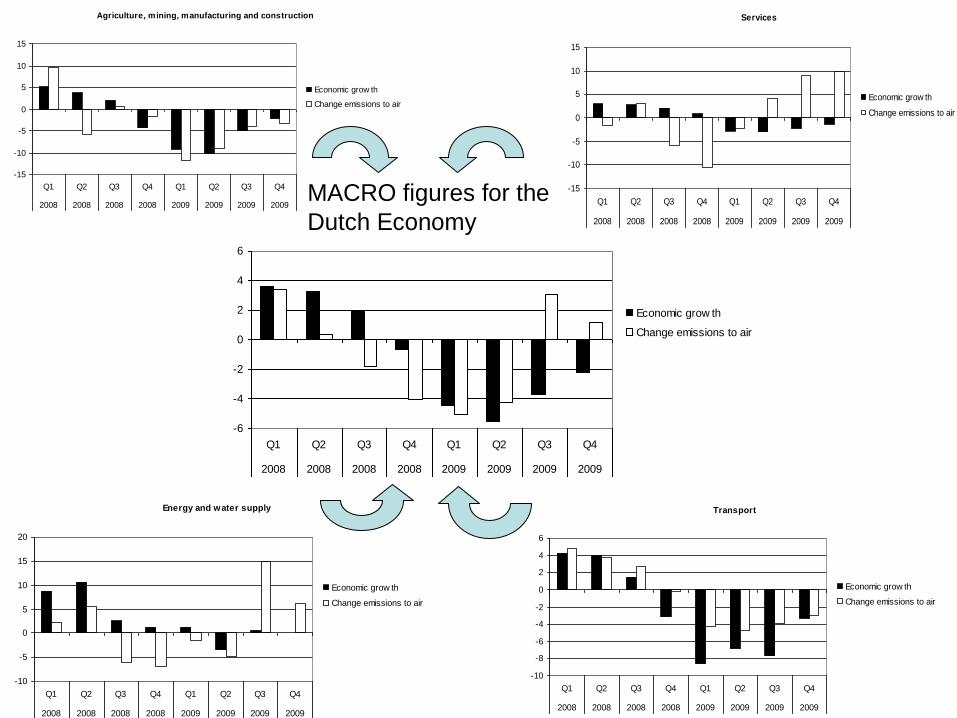
-6
-4
-2
0
2
4
6
Q1 Q2 Q3 Q4 Q1 Q2 Q3 Q4
2008 2008 2008 2008 2009 2009 2009 2009
Economic grow th
Change emissions to air
Agriculture, mining, manufacturing and construction
-15
-10
-5
0
5
10
15
Q1 Q2 Q3 Q4 Q1 Q2 Q3 Q4
2008 2008 2008 2008 2009 2009 2009 2009
Economic grow th
Change emissions to air
Services
-15
-10
-5
0
5
10
15
Q1 Q2 Q3 Q4 Q1 Q2 Q3 Q4
2008 2008 2008 2008 2009 2009 2009 2009
Economic grow th
Change emissions to air
Energy and water supply
-10
-5
0
5
10
15
20
Q1 Q2 Q3 Q4 Q1 Q2 Q3 Q4
2008 2008 2008 2008 2009 2009 2009 2009
Economic grow th
Change emissions to air
Transport
-10
-8
-6
-4
-2
0
2
4
6
Q1 Q2 Q3 Q4 Q1 Q2 Q3 Q4
2008 2008 2008 2008 2009 2009 2009 2009
Economic grow th
Change emissions to air
MACRO figures for the
Dutch Economy
Moment of publishing
• Aim is to publish the first results as soon as possible to
provide the most actual data to the public.
• On the other hand, constraints with regard to the
availability of data sources, the quality of the data
sources , the time needed to process the data
• Preference to publish quarterly CO2 emissions at the
same moment in time as the results of the quarterly
National accounts : t+45
Level of publishing
• Agriculture, mining, manufacturing and construction (NACE 1-37 and NACE 45)
• Energy and water companies (NACE 40-41)
• Transport sector (NACE 60-62)
• Other services (NACE 50-55; NACE 63-95)
• Waste disposal sites
• Households
• Total emissions
Not publishing the absolute emissions levels, but
only the actual changes with regard to the
previous year
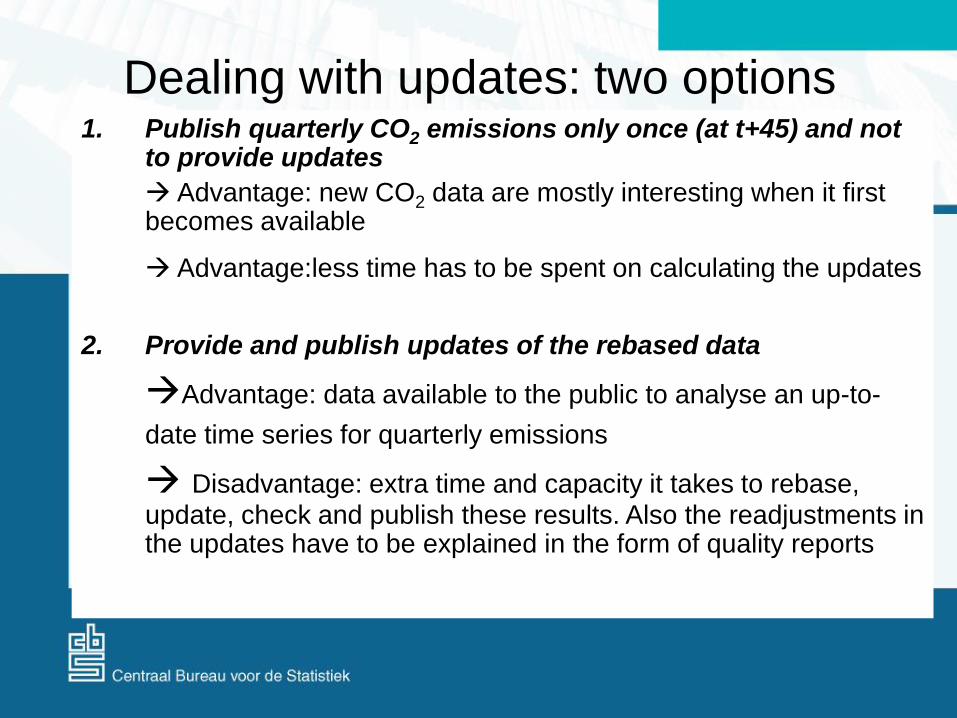
Dealing with updates: two options1. Publish quarterly CO2 emissions only once (at t+45) and not
to provide updates
Advantage: new CO2 data are mostly interesting when it first becomes available
Advantage:less time has to be spent on calculating the updates
2. Provide and publish updates of the rebased data
Advantage: data available to the public to analyse an up-to-
date time series for quarterly emissions
Disadvantage: extra time and capacity it takes to rebase, update, check and publish these results. Also the readjustments in the updates have to be explained in the form of quality reports
Choices made
• Publish moment: t+45
• Publish only mutations for 4 clusters of NACE
classes and households
• Publish only once figures on quarterly emissions
• Rebased figures are not published. Rebased
figures are only input for new calculations
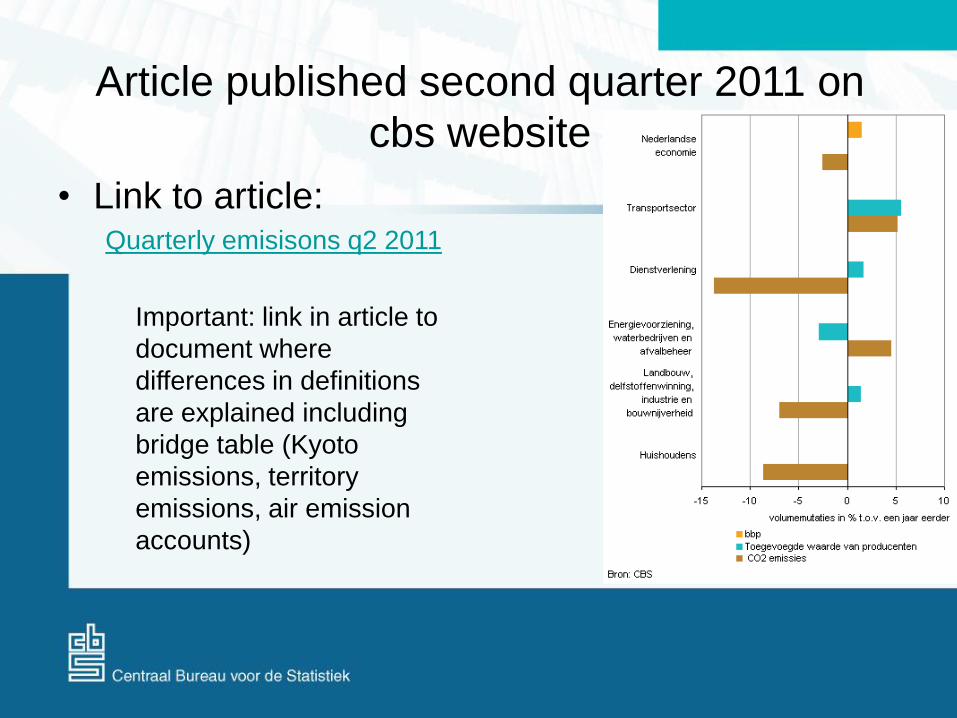
Article published second quarter 2011 on
cbs website
• Link to article:Quarterly emisisons q2 2011
Important: link in article to
document where
differences in definitions
are explained including
bridge table (Kyoto
emissions, territory
emissions, air emission
accounts)
Conclusions and recommendations
• CO2 emissions can be constructed on quarterly basis
• Actual publication of figures ‘challenging’ process
• Keep track of absolute error in estimations (sum of 4
quarters vs annual figure)
• Further improvement of methodology
• Further development of dissemination strategy