Embed Size (px)
Citation preview

COACHE Faculty Job Satisfaction Survey
PROVOST’S REPORT James Madison University
September 2012
The Collaborative on Academic Careers in Higher Education
at the Harvard Graduate School of Education

Acknowledgements: Many people and organizations are responsible for making the COACHE project possible. We would especially like to thank the following: The Ford Foundation The Atlantic Philanthropies Harvard Graduate School of Education All of our member institutions Reproduction: No part of this report or its appendices may be reproduced in any form without written permission from the Collaborative on Academic Careers in Higher Education (COACHE), such as that given in a participation agreement signed by representatives of participating institutions and COACHE. Any reproduction of the report material must include a credit line. Contact information: The Collaborative on Academic Careers in Higher Education (COACHE) Harvard Graduate School of Education 8 Story Street, 5th Floor Cambridge, MA 02138 Email: [email protected] URL: http://www.coache.org Voice: 617-495-5285 Fax: 617-496-9350 Copyright © 2012 by The President and Fellows of Harvard College. All Rights Reserved.

The Collaborative on Academic Careers in Higher Education at the Harvard Graduate School of Education
CONTENTS OF YOUR REPORT
Introduction
Preface 3
Guide to your report 5
Results
Response rates and selected peers 13
Your results at a glance 14
The COACHE dashboard 16
Benchmark dashboards
Nature of work in research, teaching, service 18
Facilities, personal/family policies, benefits and salary 20
Interdisciplinary work, collaboration, and mentoring 22
Tenure and promotion 26
Leadership and governance 30
Departmental collegiality, engagement, and quality 32
Appreciation and recognition 34
Retention and negotiations 36
Best and worst aspects 38
Thematic analysis of open-ended questions 40
Demographic characteristics 41
Appendices
Your COACHE results are in your hands… now what? 45
Background and definitions 51
Participating institutions 55


The Collaborative on Academic Careers in Higher Education at the Harvard Graduate School of Education
The Provost’s Report
INTRODUCTION


The Collaborative on Academic Careers in Higher Education at the Harvard Graduate School of Education
PREFACE
The core strength of an institution of higher education is its faculty. A preponderance of evidence supports the notion that college faculty are affected by their perception of the values and rewards in their workplace, and that supportive environments promote faculty satisfaction, which can lead to a greater commitment to and relationship with their home institution. With this understanding, the Collaborative on Academic Careers in Higher Education (COACHE) at the Harvard Graduate School of Education developed the Tenure-track Faculty Job Satisfaction Survey.
Since 2003, COACHE institutions have used data from this survey to leverage improvements in the workplace for pre-tenure faculty. Meanwhile, COACHE and its research partners have analyzed the data more broadly to understand the themes associated with faculty satisfaction and to contribute to the existing literature on faculty. Perhaps one of the most critical lessons learned in the first few years of COACHE’s development is the role that tenured faculty play as catalysts for the success of pre-tenure faculty. Tenured faculty serve as leaders for campus governance and policy decisions, as mentors to pre-tenure faculty, and as the arbiters of campus culture and climate. Simply put, tenured faculty shape nearly every facet of campus life. To understand them better, COACHE expanded its focus in 2010 to include the design and launch of the Tenured Faculty Job Satisfaction Survey.
After a successful pilot study with seven large research universities, the COACHE team merged the two surveys to create a unified instrument (with appropriate branches) attending to the full spectrum of tenure-stream faculty. In 2012-13, COACHE will add an optional survey module to assess the work satisfaction of full-time, non-tenure-track faculty.
This new instrument assesses faculty experiences in several areas deemed critical to their success:
• Nature of work in research, teaching, service • Resources in support of faculty work • Benefits, compensation, and work/life • Interdisciplinary work and collaboration • Mentoring • Tenure and promotion practices • Leadership and governance • Departmental collegiality, quality, engagement • Appreciation and recognition
The result is this diagnostic and comparative management tool for college and university leaders. Tailored to each participating institution, the COACHE Faculty Institutional Report pinpoints problem areas, whether within a particular policy, practice, or demographic. This benchmarking report identifies the overall performance of each campus compared to its peers, compares subgroups at your campus to subgroups at other campuses, and describes differences between groups on your campus. Thorough, yet accessible, this report is designed to assist campus leaders to confront concerns and celebrate achievements.
Membership in the Collaborative, however, does not conclude with delivery of this report. Academic leaders use COACHE results to focus attention, spot successes and weaknesses, and then take concrete steps to make policies and practices more effective and more prevalent. Our mission to make the academy a more attractive place to work is advanced only when supported by institutional action. To that end, COACHE is your partner and a resource for maximizing the ability of your data to initiate dialogue, recruit talented scholars, and further the work satisfaction of all faculty at your institution. For our advice on making the most of your participation, please review the supplementary material provided with this report. Then, contact us with any questions or new ideas that have emerged.
3

4

The Collaborative on Academic Careers in Higher Education at the Harvard Graduate School of Education
GUIDE TO YOUR REPORT Introduction
The quality of an academic institution depends heavily on its faculty. As teachers, scholars, participants in shared governance and the purveyors of institutional culture and history, faculty are at the heart of the best work being done in higher education today. Not surprisingly, supporting faculty in all the work they do is a central focus for successful academic leaders.
By enrolling as a member of the Collaborative on Academic Careers in Higher Education, you have already shown a commitment to improving the faculty workplace. In fact, just the act of asking your faculty to participate in the Faculty Job Satisfaction Survey helps communicate concern for and support of your faculty. Today, with the delivery of your institutional report, you take the next step towards improving the academic workplace on your campus.
This report contains the data necessary for you to understand where your institution thrives and where it struggles in the key components of faculty life. Considering faculty satisfaction within your campus as well as comparatively will provide you with a robust sense of where your campus supports faculty well and where there is work to be done.
Given hundreds of survey items disaggregated by race, gender, tenure status and rank for your institution and all others in COACHE, we have used the best of our abilities to synthesize, organize, and prioritize millions of data points in a thorough yet accessible format.
We encourage you to share this report with other senior administrators, faculty leadership, institutional researchers, and other constituents. In fact, your report portfolio includes communication models and milestones to consider in your dissemination strategy. We also recommend that you participate in
one of COACHE’s regularly-scheduled “Guided Tour to Your Report” and other webcasts.
Keeping your audiences in mind, we designed your report with components that can be distributed together or individually around campus. Your COACHE portfolio contains:
• the Provost’s Report, summarizing your results overall and according to key subgroups at your institution in comparison to peers and to the faculty labor market writ large;
• the COACHE Digital Report Portfolio, which includes an online reporting tool, tables of mean comparisons and frequency distributions, faculty responses to open-ended questions, and results for any custom items appended to the COACHE instrument.
• a de-identified unit record data file (for institutions who, when enrolling, selected this IRB-approved option)
• supplementary materials to assist you in engaging your campus community in making the most of your investment in this research.
This guide introduces you to each of these portfolio pieces and provides you with recommendations for maximizing the utility of your report.
Just as your work with the data has just begun, so has your work with COACHE. Your three-year membership means that we will continue to support your exploration of the data. We sincerely hope that you will take advantage of COACHE-sponsored opportunities to learn from the most promising practices of your colleagues and to share your plans for using COACHE data to improve faculty workplace satisfaction.
5

Guide to your report
The Provost’s Report Your Provost’s Report is designed to provide the reader with an “at a glance” understanding of where faculty at your campus are thriving and struggling in comparison to peers and the national labor market landscape. It will also help you to understand where subgroups of faculty within your own campus differ. Understanding the balancing act that senior administrators perform on a daily basis, COACHE designed this report with the goal of providing your campus with top-level analysis and some indicators of where to dig deeper. In other words, it is the best place to start, just keep in mind that much more is available. Response rates and peers In this section, you will find the response rates for your campus, your peers, and the faculty labor market. Disaggregation by tenure status, rank, gender, and race will help you to consider non-response generally and within subgroups of your faculty.
Your results at a glance This single chart summarizes the benchmark results for your institution relative to peers and the entire cohort of participating institutions. Each column represents the range of institutional means (not the distribution of individual respondents) along that dimension. Within each chart, you can see your institution’s mean score on the benchmark (), the mean scores of your five peers (), and the distribution of the responses of the entire cohort as signified by the red, grey, and green boxes.
You should be most concerned with the placement of your marker (). A score in the red section of the column indicates that your institution ranked in the bottom 30 percent of all institutions. A mark in the green section indicates your faculty rated a benchmark in the top 30 percent of all institutions. A mark in the grey area indicates a middle-of-the-road result.
This combination of your cohort comparison and peer rank establishes the threshold COACHE uses to identify areas of strength and areas of concern. An area of strength is identified as any benchmark or survey item where your score is in the top two amongst peers and in the top 30 percent across all institutions. An area of concern is any benchmark or item where your campus falls in the bottom two amongst peers and in the bottom 30 percent compared to the entire survey cohort. This two-step criterion allows you to differentiate between results that are typical of your institutional type (and your peers) and those that are out of the ordinary.
The COACHE Dashboard This data display offers a view of your faculty from 10,000 feet. Each benchmark represents the mean score of several items that share a common theme. Thus, the benchmark scores provide a general sense of how faculty feel about a particular aspect of their work/life. The benchmarks include:
• Nature of work in research, teaching, service • Resources in support of faculty work • Benefits, compensation, and work/life • Interdisciplinary work and collaboration • Mentoring • Tenure and promotion practices • Leadership and governance • Departmental collegiality, quality, engagement • Appreciation and recognition
For each result, your report will use two adjacent triangles () to compare your faculty’s rating to those of your peer institutions (the left ) and the cohort (the right ). Red triangles () indicate an area of concern relative to the comparison group; green triangles () are areas of strength; grey triangles () suggest unexceptional performance; and empty triangles () signify insufficient data for reporting comparisons.
6

Guide to your report
With this iconography, your dashboard page shows your results relative to peers and the cohort overall, by tenure status, rank, gender, and race/ethnicity. For example, a finding for females might read , meaning that, compared to women elsewhere, your female faculty’s ratings placed your campus in the top two among peers and in the bottom 30 percent among all COACHE institutions. Thus, although you are generally doing well against peers, you and your peers have room for improvement in women’s attitudes along this dimension.
On the right side of the page are your intra-institutional comparisons, which highlight the meaningful differences between subgroups on your own campus. Here, effect sizes are indicated as small (text appears in cell), moderate (text appears in cell with yellow highlight), and large (text appears in the cell with orange highlight). Trivial differences remain blank. The name of the group with the lower rating appears in the cell to indicate the direction of the difference. Ideally, this section of your report would be blank, suggesting parity across subgroups. (We did not design a typical red/yellow/green signal here because a large difference is not necessarily a poor outcome, but depends, instead, on the context of the result.)
Even if your campus performs well compared to other institutions, large differences between subgroups can suggest a problem. For example, it is quite possible for a campus to perform very well overall on a particular benchmark (or individual item) while still having great disparity based on rank, race, or gender. This is especially true when the number of faculty in a particular subgroup is small. The underrepresented group may be less satisfied, but because their numbers are so small, their concerns may get lost in the overall result.
Benchmark dashboards After reviewing the COACHE Dashboard, you will have a sense of where, generally, your faculty are most satisfied, moderately satisfied, and least satisfied. To understand these benchmarks fully, you
must explore the individual items within them. The next pages of your report apply the same organization of data in the COACHE Dashboard to each survey dimension. Using the framework described above, these tables display results for the individual items nested in each benchmark.
For those institutions with prior COACHE data, the tables include comparisons of your new data to your most recent past results. An addition symbol (+) indicates improvement since your last administration. A subtraction symbol (-) indicates a decline in your score. Change over time is only reported for survey items that have not changed since your prior survey administration. With the update that occurred to the instrument in 2011-12, many questions do not track perfectly to prior versions of the survey. If the question changed even slightly since the last time it was administered, the data are not reported here. However, please feel free to contact COACHE for help comparing more items in this year’s report to prior years’ reports.
Other displays of data Some questions in the COACHE Survey do not fit into a benchmark. This happens when an item does not use a five-point Likert scale or when the nature of the question does not lend itself to analysis by a central tendency (i.e., a mean). In most of these exceptions, a separate display highlights those results.
The Retention and Negotiation items are such an example: the COACHE Survey asks faculty about their intent to remain at the institution and details about what, if anything, they would renegotiate in their employment contracts. The Provost’s Report includes two pages dedicated to these items.
The Best and Worst Aspects pages are another example of important survey items that do not fit a benchmark factor scale. The survey asks faculty to identify, from a list of common characteristics of the academic workplace, the two best and two worst aspects of working at your institution. These pages
7

Guide to your report
summarize the results of your faculty’s responses compared to others overall, by tenure status, rank, gender, and race/ethnicity. The top results are highlighted.
Your Provost’s Report also includes COACHE’s Thematic Analysis of Open-ended Questions. The final open-ended question in the COACHE Survey asks respondents to identify the one thing they feel their institutions could do to improve the workplace for faculty. COACHE reviews all comments, redacts any identifying information, and codes them thematically. This table summarizes those themes by rank and provides comparative data. Note that responses often touch upon multiple themes, so the total number of comments reported in this thematic summary is likely to exceed the actual number of faculty who responded to this question. The complete responses are available in your COACHE Digital Report Portfolio.
Finally, the Demographic Characteristics section includes self-reported background information about respondents’ careers, family status, and other personal qualities. Though most of this information is not used explicitly in our analysis of your results, your online reporting tool (see below) and COACHE staff are available for deeper analysis that deploys these and other survey or institutional variables.
Appendix The Provost’s Report concludes with suggestions in your appendix for taking the next steps in your COACHE campus strategy. The appendix also includes information about COACHE’s methods and definitions, including a list of the colleges and universities that comprise the “All Comparable Institutions” cohort used in your report. That list also includes, separately, the names of institutions that have participated in past rounds of COACHE surveys, for whom comparison data (de-identified) are available for subsequent, follow-up analysis.
The COACHE Digital Report Portfolio
Your digital report portfolio includes access to an online tool for survey data analysis and, in both Excel and PDF formats, the Mean Comparisons and Frequency Distributions for all survey results overall, by tenure status, rank, gender, and race/ethnicity. The digital report also includes survey responses to open-ended questions. Use these tools to gain a comprehensive understanding of every result of your survey, to build your own charts or tables, and to tailor your own analyses of the data.
Mean comparisons The mean comparisons are based on results from all survey respondents at your institution, at the five peer institutions you selected, and at all other institutions participating in this study. For each survey dimension, the mean is the unweighted arithmetic average of faculty responses on a particular item. Means and standard deviations are
provided for your institution overall, for your peer institutions individually and overall, for all comparable institutions overall, and—where population size allows—for groups by tenure status, rank, gender, race/ethnicity (i.e., white faculty or faculty of color), and against prior survey results (if your institution has previously participated in a COACHE survey).* Note that your Digital Report Portfolio also contains these data in Excel format. That file provides additional data hidden in the PDF version, as well as the ability to filter and sort the results.
* During prior administrations of the COACHE Survey,
means were weighted based on race and gender. Although means are no longer weighted, your prior data remain weighted to maintain consistency with your records.
8

Guide to your report
Frequency distributions As with the mean comparisons, these frequency distribution tables are based on results from all survey respondents at your institution and at all other institutions participating in this study. Provided here are the unweighted counts and percentages of faculty responses on each survey dimension. We provide comparisons overall and between the same sub-groups identified in the mean comparisons (i.e., by tenure status, rank, gender, race/ethnicity, and over time).
A note on interpreting means and frequencies Relative frequencies of responses for each item can provide crucial information not given by the mean score alone. While a group’s mean score gives valuable information about the group’s central tendency, the frequency can tell you the extent to which the group is polarized in their responses. For example, consider two hypothetical cases: Case #1: Half of a group of pre-tenure faculty chose
“Very dissatisfied” (1) on a 5-point scale, and half chose “Very satisfied” (5);
Case #2: Every respondent in the group chose “Neither satisfied nor dissatisfied” (3).
In both cases, the mean score is 3.0; however, whereas in the second case the mean reflects individuals’ attitudes perfectly, in the first case, the mean value (“Neither satisfied nor dissatisfied”) does not actually reflect the attitude of anyone in the group. Rather, these respondents seem to be made up of two sub-groups with very different attitudes. It is important to take into account the polarization of scores when considering major policy changes in order to accurately anticipate how faculty members will be affected. Open-ended responses This portion of your report lists the comments written by your faculty in response to open-ended questions, including the final survey item, which
states, “Please use the space below to tell us the number one thing that you, personally, feel your institution could do to improve the workplace.” These results, coded by themes, are also available in Excel format.
Results of custom questions (if applicable) For institutions that appended additional, custom questions to the COACHE survey, the results are displayed here in cross-tabulations and/or open-ended narrative. Online reporting tool (*new*) This new feature allows you to build customized cross-tabulations and charts in a Web browser for simple export into Excel or PDF formats. Use this tool to compare survey responses on any demographic variable or to compare response groups across multiple items. THIS TOOL PROVIDES ACCESS TO YOUR SURVEY RESULTS BY SCHOOL, COLLEGE, OR DIVISION. For access to your online reporting tool, you may need to contact COACHE.
Supplementary material Your digital repository also includes supporting material to help you contextualize your results and to consider policies and practices in response.
• The COACHE Survey Instrument 2011-12 includes in detail all of the survey’s items.
• Your Results in Context compiles in one document the explanatory pages that accompany the Benchmark Dashboards in your Provost’s Report, but includes also a list of seminal readings.
• A t-page review of potential Communication Models and Milestones may help you design a dissemination and engagement strategy around COACHE at your institution.
• A folder of Suggested Readings includes an array of COACHE’s prior reports, research, and other materials to support your efforts to make the most of your investment in this project.
9

Guide to your report
10

The Collaborative on Academic Careers in Higher Education at the Harvard Graduate School of Education
The Provost’s Report
RESULTS
11

12

The Collaborative on Academic Careers in Higher EducationFaculty Job Satisfaction Survey 2011-12
RESPONSE RATES AND SELECTED PEERS
James Madison University
overall tenuredpre-
tenure full assoc men women whitefaculty of
colorpopulation 208 0 208 1 11 112 96 173 35
responders 143 0 143 0 7 73 70 120 23response rate 69% 0% 69% 0% 64% 65% 73% 69% 66%
population 3297 2381 916 1085 1312 1951 1346 2676 590responders 1667 1172 495 532 645 907 760 1412 248
response rate 51% 49% 54% 49% 49% 46% 56% 53% 42%population 27660 19888 7772 10618 9711 17710 9950 21332 6269
responders 13634 9661 3973 5117 4689 8151 5483 10897 2725response rate 49% 49% 51% 48% 48% 46% 55% 51% 43%
SELECTED PEER INSTITUTIONS
PRIOR COHORT YEARS
2008
You selected five institutions as peers against whom to compare your COACHE Survey results. The results at these peer institutions are included throughout this report in the aggregate or, when cited individually, in random order. Your peer i i i
James Madison University
Selected peers
All
*Due to some missing gender and race/ethnicity data, the numbers of males and females, and of white faculty and faculty of color, may not sum to the total populations.
If your institution participated in a previous administration of the COACHE Faculty Job Satisfaction Survey, this report will show change over time for any questions that have remained unchanged. For campuses with multiple years of comparative data, users may toggle between cohort years by using the Criteria tab of the Excel report.
Appalachian State UniversityEast Carolina UniversitySUNY - GeneseoUniversity of North Carolina - CharlotteUniversity of North Carolina - Greensboro
13

This chart summarizes over a half million data points in benchmark results for your institution relative to peers and the full cohort of COACHE’s participating institutions.
Each column represents the range of institutional means (not the distribution of individual respondents) along that dimension. Within each chart, you can see your institution’s mean score on the benchmark (), the mean scores of your five peers (O), and the distribution of the responses of the entire cohort of institutions as signified by the red, grey, and green boxes.
You should be most concerned with the placement of your marker (). A score in the red section of the column indicates that your institution ranked in the bottom 30 percent of all institutions. A mark in the green section indicates your faculty rated a benchmark in the top 30 percent of all institutions. A mark in the grey area indicates a “middle-of-the-road” result.
COACHEResults at a Glance
top 30%of institutions
middle 40%of institutions
bottom 30%of institutions
your institutionselected peers
Mentoring
5.0
4.0
3.0
2.0
1.0
cohort mean
14

The Collaborative on Academic Careers in Higher EducationFaculty Job Satisfaction Survey 2011-12
COACHE RESULTS AT A GLANCE
James Madison University
1.0
1.5
2.0
2.5
3.0
3.5
4.0
4.5
5.0
Na
ture
of w
ork:
Re
sear
ch
Na
ture
of w
ork:
Ser
vice
Na
ture
of w
ork:
Tea
chin
g
Fac
ilitie
s a
nd w
ork
reso
urce
s
Per
sona
l an
d fa
mily
po
licie
s
He
alth
an
d re
tirem
ent
ben
efit
s
Inte
rdis
cip
linar
y w
ork
Co
llabo
ratio
n
Me
nto
ring
Ten
ure
pol
icie
s
Ten
ure
cla
rity
Ten
ure
rea
sona
ble
nes
s
Pro
mot
ion
Lead
ers
hip:
Se
nio
r
Lead
ers
hip:
Div
isio
nal
Lead
ers
hip:
Dep
art
men
tal
De
part
men
tal c
olle
gial
ity
De
part
men
tal e
nga
gem
ent
De
part
men
tal q
ualit
y
App
reci
atio
n a
nd r
eco
gniti
on
15

Here, the faculty subgroup with the lower rating appears. Shading conveys the magnitude of sub-group di�erences: small e�ects appear as text only, moderate e�ects are shaded yellow, and large e�ects are shaded orange. Trivial di�erences remain blank. Change over time appears as +/-.
Regardless of your results compared to peers and others (on the left), you should direct your concern to subgroups who consistently appear here in yellow or orange shaded cells.
mean overall tenured pre-ten full assoc men women white foc tenure rank gender race prior
Health and retirement benefits 3.43 pre-ten full women focInterdisciplinary work 3.00 pre-ten assoc women whiteCollaboration 3.46 tenured full women whiteMentoring 3.18 tenured assoc men focTenure policies 3.64 N/A N/A N/A N<5 N/A N/A women N<5Tenure clarity 3.33 N/A N/A N/A N<5 N/A N/A men
This is theoverall score
(between 1 and 5) for all facultyrespondents
at your institution.
These columns describe how your faculty’s responses compare to similar faculty at other
COACHE institutions: tenured vs. tenured, men vs. men, faculty of color
vs. faculty of color, etc.
These columns comparegroups on your campus:
pre-tenure/tenured, associate/full, women/men,
white/faculty of color.
What do these triangles mean?These symbols represent results that �t COACHE’s criteria (adjustable in Excel) for “areas of strength” (in green) and “areas of concern” (in red).
Your ranking among peers: 1st or 2nd 3rd or 4th 5th or 6th
Your percentile among all members: Top 30% Middle 40% Bottom 30%
women
This result, for example, shows that your female faculty are less satis�ed than are women at your peers (), but moresatis�ed than are women at 70% of other institutions (). Although the women at your institution are “less satis�ed” than women at peers, they still fare better than most.
assoc And these results?
COACHEDashboardGuide
insu�cient data for reporting
2008
+
16

The Collaborative on Academic Careers in Higher EducationFaculty Job Satisfaction Survey 2011-12
COACHE DASHBOARD
James Madison UniversityYOUR RESULTS COMPARED TO PEERS AREAS OF STRENGTH IN GREEN
YOUR RESULTS COMPARED TO COHORT AREAS OF CONCERN IN RED small moderate large
mean overall tenured pre-ten full assoc men women white foc tenure rank gender raceNature of work: Research 3.21 N/A N/A N/A N/A N/A whiteNature of work: Service 3.42 N/A N/A N/A N/A N/A men whiteNature of work: Teaching 3.78 N/A N/A N/A N/A N/A whiteFacilities and work resources 3.88 N/A N/A N/A N/A N/A whitePersonal and family policies 2.74 N/A N/A N/A N/A N/A menHealth and retirement benefits 3.65 N/A N/A N/A N/A N/A men focInterdisciplinary work 2.97 N/A N/A N/A N/A N/ACollaboration 3.60 N/A N/A N/A N/A N/A whiteMentoring 3.18 N/A N/A N/A N/A N/A focTenure policies 3.62 N/A N/A N/A N/A N/A whiteTenure clarity 3.34 N/A N/A N/A N/A N/A men whiteTenure reasonableness 3.90 N/A N/A N/A N/A N/APromotion N/A N/A N/A N/A N/A N/A N/A N/A N/A N/A N/A N/A N/A N/ALeadership: Senior 3.08 N/A N/A N/A N/A N/A men whiteLeadership: Divisional 3.35 N/A N/A N/A N/A N/A whiteLeadership: Departmental 3.96 N/A N/A N/A N/A N/A men whiteDepartmental collegiality 3.91 N/A N/A N/A N/A N/A whiteDepartmental engagement 3.67 N/A N/A N/A N/A N/A men whiteDepartmental quality 3.65 N/A N/A N/A N/A N/A men whiteAppreciation and recognition 3.48 N/A N/A N/A N/A N/A
INTERNAL CAMPUS DIFFERENCES
0%
25%
50%
75%
100%
you peers all comparables
"If I had it to do all over,I would again choose to work at this institution."
somewhat or stronglyagree
neither/nor
somewhat or stronglydisagree
0%
25%
50%
75%
100%
you peers all comparables
If a candidate for a position asked you about your department as a place to work, would you...
strongly recommendyour department as aplace to work
recommend yourdepartment withreservations
not recommend yourdepartment as a placeto work
17

The Collaborative on Academic Careers in Higher Education at the Harvard Graduate School of Education
Your Findings in Context
Nature of Faculty Work: Research, Teaching & Service
Why it matters. Most faculty work primarily in three areas – research, teaching, and service, although at some institutions (public land grants), outreach is important and may be substituted for one of these or actually be a fourth area. Faculty members also spend time on administrative tasks. The COACHE survey asks about all of this, but has benchmarks for the three core areas. Satisfaction with research is primarily a function of the time faculty members have to spend on it and institutional expectations and support for scholarly work production. Satisfaction with teaching is a function of time spent, the number of courses, number and quality of students, and an equitable distribution of courses across the faculty. When gauging satisfaction with service, faculty members consider the number, attractiveness, and amount of work involved with committees, as well as the equity in service load distribution.
The key for every faculty member is to strike a balance between institutional expectations for each aspect of work and time and ability to perform that work. Dissatisfaction can occur when faculty members feel expectations are unreasonable, institutional support is lacking, or the distribution of work is inequitable. Time is the common denominator; if faculty do not have time to adequately perform in any of these areas commensurate with expectations, dissatisfaction can occur and morale and productivity can suffer.
Good practice.
• Provide leadership from the top. Presidential and provostial leadership in stressing the importance of excellence in research and teaching is critical substantively and symbolically. This means that resources directed at supporting faculty work are crucial, as is the messaging that goes along with the financial support.
• Have formal offices and programs to support faculty work. Dedication of resources to supporting faculty work is one clear indicator of how important faculty members are to institutional success.
o Grant support. Many universities offer pre-award support to faculty preparing proposals for outside funding and this is good practice. What’s less common, but equally important, is post-award support.
o Internal grants. Faculty are grateful for internal funding, even in small amounts, especially in the humanities where less money is typically needed to support faculty research.
o Teaching and learning centers. Some faculty are better trained in research than in teaching. Pre-tenure faculty, especially, benefit from such attention to pedagogy; even the experienced will appreciate additional support for improvement.
o Research institutes. Such institutes may be a source of internal grant support, but beyond that, they are places where faculty can find collaborators and engage in interdisciplinary work--something many find fulfilling.
o Colloquia, workshops, and seminars. Pre-tenure faculty members appreciate opportunities to present their research at colloquia on campus, receive feedback, and fine-tune prior to presenting at a national conference. Workshops and seminars for writing grants, running a lab, getting published, mentoring undergraduates and graduates, improving teaching, and getting tenure are all typically well-received by pre-tenure faculty.
• Many schools work diligently to protect pre-tenure faculty from excessive service and even teaching loads. When they achieve tenure, those protections disappear and the new demands can result in a difficult transition time. Consider the development of an Associates Orientation Program to help your newly tenured faculty adjust to life after tenure.
18

The Collaborative on Academic Careers in Higher EducationFaculty Job Satisfaction Survey 2011-12
NATURE OF WORK:RESEARCH, SERVICE, TEACHING
James Madison UniversityYOUR RESULTS COMPARED TO PEERS AREAS OF STRENGTH IN GREEN
YOUR RESULTS COMPARED TO COHORT AREAS OF CONCERN IN RED small moderate large
mean overall tenured pre-ten full assoc. men women white foc tenure rank gender race 2008
Benchmark: Nature of Work Research 3.21 N/A N/A N/A N/A N/A white N/ATime spent on research 2.92 N/A N/A N/A N/A N/A white N/AExpectations for finding external funding 3.35 N/A N/A N/A N/A N/A menInfluence over focus of research 4.26 N/A N/A N/A N/A N/A men focQuality of grad students to support research 2.92 N/A N/A N/A N/A N/A N/ASupport for research 2.88 N/A N/A N/A N/A N/A men white N/ASupport for engaging undergrads in research 3.29 N/A N/A N/A N/A N/A women white N/ASupport for obtaining grants (pre-award) 3.23 N/A N/A N/A N/A N/A white N/ASupport for maintaining grants (post-award) 3.17 N/A N/A N/A N/A N/A men white N/ASupport for securing grad student assistance 2.87 N/A N/A N/A N/A N/A men -Support for travel to present/conduct research 3.50 N/A N/A N/A N/A N/A men N/AAvailability of course release for research 2.19 N/A N/A N/A N/A N/A white N/ABenchmark: Nature of Work: Service 3.42 N/A N/A N/A N/A N/A men white N/ATime spent on service 3.48 N/A N/A N/A N/A N/A men white N/ASupport for faculty in leadership roles 3.03 N/A N/A N/A N/A N/A white N/ANumber of committees 3.52 N/A N/A N/A N/A N/A men white N/AAttractiveness of committees 3.60 N/A N/A N/A N/A N/A men white N/ADiscretion to choose committees 3.59 N/A N/A N/A N/A N/A men N/AEquitability of committee assignments 3.17 N/A N/A N/A N/A N/A white N/ANumber of student advisees 3.53 N/A N/A N/A N/A N/A white N/ABenchmark: Nature of Work: Teaching 3.78 N/A N/A N/A N/A N/A white N/ATime spent on teaching 3.96 N/A N/A N/A N/A N/A white N/ANumber of courses taught 3.50 N/A N/A N/A N/A N/A whiteLevel of courses taught 4.07 N/A N/A N/A N/A N/A menDiscretion over course content 4.43 N/A N/A N/A N/A N/ANumber of students in classes taught 3.60 N/A N/A N/A N/A N/A whiteQuality of students taught 3.64 N/A N/A N/A N/A N/A N/AEquitability of distribution of teaching load 3.50 N/A N/A N/A N/A N/A white N/AQuality of grad students to support teaching 3.24 N/A N/A N/A N/A N/A men white N/ARelated survey itemsTime spent on outreach 3.54 N/A N/A N/A N/A N/A men white N/ATime spent on administrative tasks 3.11 N/A N/A N/A N/A N/A men white N/AAbility to balance teaching/research/service 3.18 N/A N/A N/A N/A N/A white N/A
INTERNAL CAMPUS DIFFERENCES
19

The Collaborative on Academic Careers in Higher Education at the Harvard Graduate School of Education
Your Findings in Context
Facilities, Personal/Family Policies, Benefits & Salary
Why it matters. Facilities and support. COACHE found a number of facets of the physical workplace for faculty to be especially important to faculty satisfaction, including office, lab, research or studio space, equipment, and classrooms. In addition, many faculty need support for technology, administrative work, and improvements to teaching.
Personal and family policies. The COACHE survey measures faculty beliefs about the effectiveness of various policies—many of them related to work-family balance and support for families. This is especially important because over 70 percent of COACHE respondents are married. Of the assistant professors, 62 percent have children under the age of 18 (32 percent have infants or toddlers); of associate professors, 53 percent have children under the age of 18 (16 percent have infants or toddlers); and of full professors, 33 percent have children under 18 (4 percent have infants or toddlers). A number of faculty are providing care for an elderly, disabled, or ill family members (from 10 percent of assistant to 14 percent of full professors).
Health and retirement benefits. Faculty, of course, require health benefits for themselves and their families. Phased retirement programs have become more prevalent recently; such programs provide benefits to individuals and institutions alike. Individuals enjoy the institutional affiliation, intellectual engagement, and contact with students and colleagues; institutions realize salary savings and can make better staffing projections. Asked for the primary reason they would choose to leave their institutions, 34 percent of full professors and 14 percent of associates reported “to retire”.
Good practice.
• When it comes to facilities, new is nice but equity is best. Faculty understand that not everyone can have
a brand new office or lab because campuses must invest in different areas over time, but everyone should enjoy equity in the distribution of resources and space within a department.
• Hire personnel to staff work-life services offices. This is important not only to get the job done but also for symbolic reasons. Putting physical resources into something signifies that it matters beyond the rhetoric. It is unlikely that universities will need fewer personnel in the future to attend to these matters.
• Have written policies. Platitudes that “This is a family-friendly place” or “There’s plenty of work-life balance here” are no longer enough. In addition to assuring pre-tenure faculty that the institution is doing more than just paying lip-service to work-life balance, written policies provide clarity, consistency, and transparency which leads to greater fairness and equity. Written policies are also the primary indicator of how family-friendly a campus actually is. Such policies include dual-career hiring; early promotion and tenure; parental leave; modified duties; part-time tenure options; and stop-the-tenure-clock provisions.
• Ensure that written policies are communicated to everyone—pre-tenure and tenured faculty members, chairs, heads, and deans. COACHE research indicates that written policies are particularly important to women and under-represented minorities. Make certain the policies are easily accessible online, and provide personnel to assist faculty in choosing the right healthcare option.
• Provide additional accommodations: Childcare, eldercare, lactation rooms, flexibility, and opportunities for social occasions in which kids can be included are all relevant practices that help ensure a viable workplace for the future.
• Offer phased retirement for faculty to ease into retirement gradually. At the same time, institutions have the flexibility to fill the void left by retiring faculty more easily. Retiring faculty can continue their contributions to the institution by developing the teachers, scholars, and leaders who follow them.
20

The Collaborative on Academic Careers in Higher EducationFaculty Job Satisfaction Survey 2011-12
FACILITIES, PERSONAL/FAMILY POLICIES,BENEFITS, AND SALARY
James Madison UniversityYOUR RESULTS COMPARED TO PEERS AREAS OF STRENGTH IN GREEN
YOUR RESULTS COMPARED TO COHORT AREAS OF CONCERN IN RED small moderate large
mean overall tenured pre-ten full assoc men women white foc tenure rank gender race 2008
Benchmark: Facilities and work resources 3.88 N/A N/A N/A N/A N/A white N/ASupport for improving teaching 4.02 N/A N/A N/A N/A N/A men N/AOffice 4.06 N/A N/A N/A N/A N/A women N/ALaboratory, research, studio space 3.37 N/A N/A N/A N/A N/A white N/AEquipment 3.78 N/A N/A N/A N/A N/A women white N/AClassrooms 3.73 N/A N/A N/A N/A N/A white N/ALibrary resources 4.11 N/A N/A N/A N/A N/A men foc N/AComputing and technical support 3.96 N/A N/A N/A N/A N/A women whiteClerical/administrative support 3.79 N/A N/A N/A N/A N/A white -Benchmark: Personal and family policies 2.74 N/A N/A N/A N/A N/A men N/AHousing benefits 2.34 N/A N/A N/A N/A N/A men N/ATuition waivers, remission, or exchange 2.15 N/A N/A N/A N/A N/A men foc N/ASpousal/partner hiring program 2.19 N/A N/A N/A N/A N/A white N/AChildcare 2.13 N/A N/A N/A N/A N/A white N/AEldercare 2.52 N/A N/A N/A N/A N/A white N/AFamily medical/parental leave 3.29 N/A N/A N/A N/A N/A men white N/AFlexible workload/modified duties 3.24 N/A N/A N/A N/A N/A white N/AStop-the-clock policies 2.77 N/A N/A N/A N/A N/A men white N/AInst. does what it can for work/life compatibility 2.77 N/A N/A N/A N/A N/A white N/ARight balance between professional/personal 2.99 N/A N/A N/A N/A N/A white N/ABenchmark: Health and retirement benefits 3.65 N/A N/A N/A N/A N/A men foc N/AHealth benefits for yourself 3.83 N/A N/A N/A N/A N/A men foc N/AHealth benefits for family 3.68 N/A N/A N/A N/A N/A men N/ARetirement benefits 3.56 N/A N/A N/A N/A N/A men foc N/APhased retirement options 3.27 N/A N/A N/A N/A N/A N/ARelated survey itemsSalary 2.33 N/A N/A N/A N/A N/A men white -
INTERNAL CAMPUS DIFFERENCES
0%
10%
20%
30%
40%
Housing benefits Tuition waivers Spousal/partnerhiring program
Childcare Eldercare Family medicalleave
Flexible workload Stop-the-clock Phased retirementoptions
Percent of respondents indicating a program or policy is not offered at your institution
you
peers
all comparables
21

The Collaborative on Academic Careers in Higher Education at the Harvard Graduate School of Education
Your Findings in Context
Interdisciplinary Work, Collaboration & Mentoring
Why it matters. Interdisciplinarity. First, institutions have seen widespread growth in research collaboration (within and between universities and with off-campus partners); while not exclusively the province of the sciences, interdisciplinary research has become the predominant model there. Second, there are increasing public monies being dedicated to interdisciplinary research as well as private monies at unprecedented levels. Third, there is a great deal of interest and intrinsic motivation for researchers to cross-fertilize; many graduate students and early-career faculty are attracted to this sort of work. However, there are institutional disincentives to do interdisciplinary research because the academy has not yet fully embraced this work by changing structures and cultures still best-suited to narrower work within disciplines including publication vehicles, multiple authors, peer review, reward structures (for promotion and tenure; merit pay; incentives), to name a few.
Collaboration. Most faculty work requires collaboration–whether with students, peers, administrators, or other colleagues inside and outside the institution, in the classroom or the lab, and with the broader community through service or outreach programs. While many faculty value the work they do independently, they also enjoy collaborative projects within and across their disciplines.
Mentoring. Mentoring has become increasingly important in the academic workplace; in fact, many pre-tenure faculty members feel it is essential to their success. And apparently too often overlooked, mentoring is also necessary for associate professors to achieve promotion to full. While some institutions reply on the mentor-protégé (senior faculty-junior faculty, one-on-one approach), new models encourage mutual mentoring (where faculty members at all ages and stages reap benefits), team mentoring (a small group approach), and
strategic collaborations (in which faculty members build networks beyond their departments and colleges).
Good practice.
• Discuss the importance of interdisciplinarity on your campus, including the variety of forms of interdisciplinary work (e.g., cross-fertilization – when individuals make cognitive connections among disciplines; team-collaboration – when several individuals spanning different fields work together; field creation – when existing research domains are bridged to form new disciplines or subdisciplines at their intersections; and problem orientation – when researchers from multiple disciplines work together to solve a ‘real world’ problem).
• If interdisciplinary work is important on your campus, discuss and if possible remove the barriers to its practice. The most common barriers on campus are the promotion and tenure system (typically rooted in the disciplines), budgets that are discipline-based, and space or facility limitations. Identity barriers to collaboration, as well, and implement policies to facilitate it.
• Discuss the importance of collaboration with the various stakeholders listed above and the factors that enhance or inhibit it on your campus.
• Ensure mentoring for assistant and associate professors. Mentoring benefits both mentee and mentor alike because of the mutuality of the relationship. Mentees learn the ropes, have champions and confidants, and experience a greater sense of “fit” within the department. Importantly, mentoring should meet the individual’s needs; don’t make assumptions about what type of mentoring faculty will want (or even if they’ll want it at all). Mentoring should be tailored to individual needs. Written, departmental guidelines can be helpful for both mentors and protégés. Mentors feel a greater sense of purpose and can be revitalized through these relationships.
• Often, for underrepresented faculty, finding a mentor with a similar background can be vital to
22

Your Findings in Context
their success and yet difficult because of the limited number of underrepresented faculty in some disciplines. Consider building networks beyond the department or division. It may even be beneficial to build and support mentoring networks with other institutions.
• If possible, reward mentors through stipends or course release.
• Evaluate the quality of mentoring. Both mentors and mentees should be part of the evaluative process.
23
The Collaborative on Academic Careers in Higher EducationFaculty Job Satisfaction Survey 2011-12
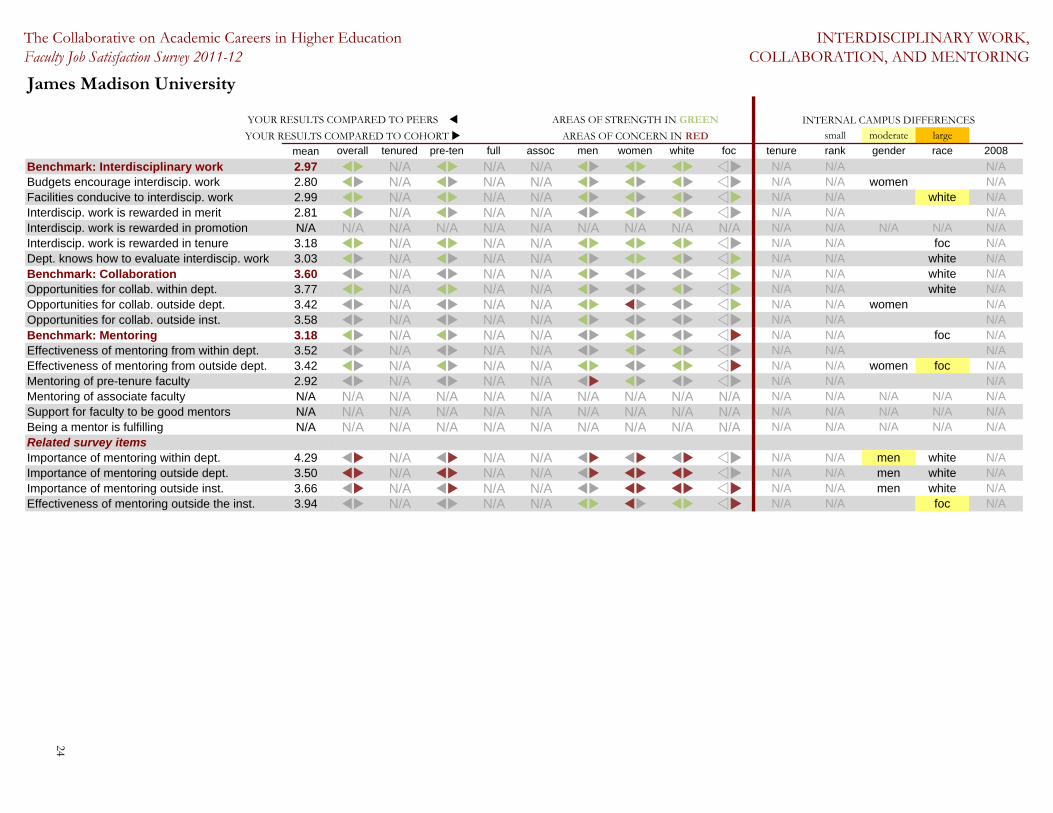
INTERDISCIPLINARY WORK, COLLABORATION, AND MENTORING
James Madison University
YOUR RESULTS COMPARED TO PEERS AREAS OF STRENGTH IN GREEN
YOUR RESULTS COMPARED TO COHORT AREAS OF CONCERN IN RED small moderate large
mean overall tenured pre-ten full assoc men women white foc tenure rank gender race 2008
Benchmark: Interdisciplinary work 2.97 N/A N/A N/A N/A N/A N/ABudgets encourage interdiscip. work 2.80 N/A N/A N/A N/A N/A women N/AFacilities conducive to interdiscip. work 2.99 N/A N/A N/A N/A N/A white N/AInterdiscip. work is rewarded in merit 2.81 N/A N/A N/A N/A N/A N/AInterdiscip. work is rewarded in promotion N/A N/A N/A N/A N/A N/A N/A N/A N/A N/A N/A N/A N/A N/A N/AInterdiscip. work is rewarded in tenure 3.18 N/A N/A N/A N/A N/A foc N/ADept. knows how to evaluate interdiscip. work 3.03 N/A N/A N/A N/A N/A white N/ABenchmark: Collaboration 3.60 N/A N/A N/A N/A N/A white N/AOpportunities for collab. within dept. 3.77 N/A N/A N/A N/A N/A white N/AOpportunities for collab. outside dept. 3.42 N/A N/A N/A N/A N/A women N/AOpportunities for collab. outside inst. 3.58 N/A N/A N/A N/A N/A N/ABenchmark: Mentoring 3.18 N/A N/A N/A N/A N/A foc N/AEffectiveness of mentoring from within dept. 3.52 N/A N/A N/A N/A N/A N/AEffectiveness of mentoring from outside dept. 3.42 N/A N/A N/A N/A N/A women foc N/AMentoring of pre-tenure faculty 2.92 N/A N/A N/A N/A N/A N/AMentoring of associate faculty N/A N/A N/A N/A N/A N/A N/A N/A N/A N/A N/A N/A N/A N/A N/ASupport for faculty to be good mentors N/A N/A N/A N/A N/A N/A N/A N/A N/A N/A N/A N/A N/A N/A N/ABeing a mentor is fulfilling N/A N/A N/A N/A N/A N/A N/A N/A N/A N/A N/A N/A N/A N/A N/ARelated survey itemsImportance of mentoring within dept. 4.29 N/A N/A N/A N/A N/A men white N/AImportance of mentoring outside dept. 3.50 N/A N/A N/A N/A N/A men white N/AImportance of mentoring outside inst. 3.66 N/A N/A N/A N/A N/A men white N/AEffectiveness of mentoring outside the inst. 3.94 N/A N/A N/A N/A N/A foc N/A
INTERNAL CAMPUS DIFFERENCES
24
The Collaborative on Academic Careers in Higher EducationFaculty Job Satisfaction Survey 2011-12
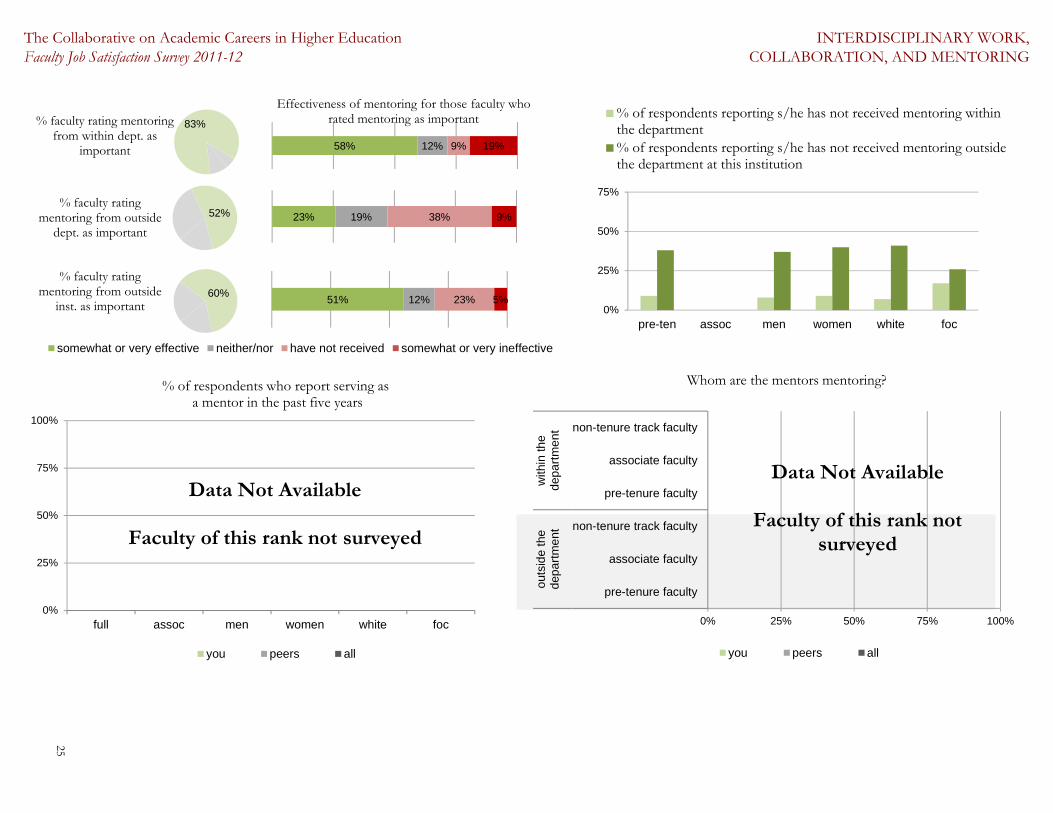
INTERDISCIPLINARY WORK, COLLABORATION, AND MENTORING
51% 12% 23% 5%
somewhat or very effective neither/nor have not received somewhat or very ineffective
0%
25%
50%
75%
100%
full assoc men women white foc
% of respondents who report serving asa mentor in the past five years
you peers all
60%
0%
25%
50%
75%
pre-ten assoc men women white foc
% of respondents reporting s/he has not received mentoring withinthe department% of respondents reporting s/he has not received mentoring outsidethe department at this institution
52%
% faculty rating mentoring from outside
inst. as important
58% 12% 9% 19%
83%
23% 19% 38% 9%
% faculty rating mentoring from within dept. as
important
% faculty rating mentoring from outside
dept. as important
Effectiveness of mentoring for those faculty who rated mentoring as important
0% 25% 50% 75% 100%
pre-tenure faculty
associate faculty
non-tenure track faculty
pre-tenure faculty
associate faculty
non-tenure track faculty
out
sid
e t
hed
epa
rtm
en
tw
ithin
the
dep
art
me
nt
Whom are the mentors mentoring?
you peers all
Data Not Available
Faculty of this rank not surveyed
Data Not Available
Faculty of this rank notsurveyed
25

The Collaborative on Academic Careers in Higher Education at the Harvard Graduate School of Education
Your Findings in Context
Tenure & Promotion
Why it matters. For tenure. While it is impossible to wipe anxiety from the psyche of pre-tenure faculty members, or the stress from their lives while working during the probationary period en route to tenure, it is in everyone’s best interest to be as clear as possible about the institutional expectations for research, teaching, advising, colleagueship and service to the institution and the broader community (if those factors matter in the tenure bid). There should also be clarity about the tenure process (who needs to do what by when), criteria (what counts), standards (the performance threshold), and the body of evidence to be presented (what goes into the tenure dossier). Ideally, pre-tenure faculty should receive consistent messages (one reason for having written criteria and standards) about what is required for tenure and should have reasonable assurance that tenure decisions are fair and equitable in that they are based on performance (e.g., research/creative work, teaching, and service) rather than on other factors like demographics, relationships, or departmental politics.
In addition to being clear, what’s expected of tenure-track faculty should be reasonable. Administrators and faculty alike acknowledge that, at most institutions, the bar to achieve tenure has risen over the years. While that may be good for the academy—and in fact, most pre-tenure faculty report that they do not mind high standards—it is important to be cognizant of the workload on pre-tenure faculty members and attempt to ensure reasonably, not impossibly, high expectations. It is possible to be both rigorous and reasonable.
For promotion. To clarity about the process, criteria, standards, and body of evidence, and some semblance of reasonableness, for associate professors, we add two factors of importance: 1) clarity about the timeframe for putting oneself forward for promotion to full; and 2) a departmental culture that encourages faculty to seek
promotion to full rather than languish forever at the associate level.
Good practice. For Assistant Professors…
• Tell tenure-track faculty what to expect at the outset—during the interview stage—and then reinforce that prior to their arrival on campus and again upon arrival.
• Set weights or priorities with tenure-track faculty members so that they know what counts most and can focus their work in those areas.
• If collegiality, outreach, and service count in the tenure process, provide definitions, say how it counts, and state how it will be measured.
• Provide relevant written information. Pre-tenure faculty members should be informed about where to find all the information they need to get started and feel comfortable on campus and also about how to get tenure. They appreciate clear websites with easy links to relevant policies and people.
• Provide new faculty orientation as well as workshops to support effective teaching and research throughout the pre-tenure years.
• Host Q&A sessions or provide other venues where pre-tenure faculty can safely ask difficult questions and have them answered by those who know.
• Provide plenty of feedback all along the way—annually and more thoroughly still in a third- or fourth-year review. Annual reviews, in writing, are very helpful and midpoint reviews with specific guidance are crucial to pre-tenure faculty clarity, satisfaction, and success.
• Provide sample dossiers to pre-tenure faculty and sample feedback letters to those responsible for writing them.
• Provide education sessions, as needed, for new chairs to learn how to deliver clear performance
26
Your Findings in Context
feedback to pre-tenure faculty annually and more comprehensively at mid-point.
• Hire tenure-track faculty with the expectation that they will achieve tenure. This may sound obvious, but it isn’t always, and it should be explicit. After all, hiring on the tenure-track is an expensive proposition and, if all goes well, the faculty member may stay for their entire career.
• Ensure open doors to the chair and senior faculty members. The most clear and satisfied junior faculty have access to the chair and other senior colleagues not only for questions about tenure but also for feedback, opportunities to collaborate, and colleagueship.
For Associate Professors…
• Be cognizant of the workload that is placed on associate professors. They often find themselves suddenly buried with service, mentoring of tenure-track faculty, and more student advising, as well as more leadership/administrative duties that may actually get in the way of their continued trajectory to full.
• While the academy has provided numerous policies for assistant professors (e.g., research leave; stop-the-tenure-clock; part-time tenure-track), it has done far less for associates. Some ideas include: modified duties; leave; sabbatical planning and other workshops; workload shifts (more teaching or more research); improved communication about timing/nudge to stand for full; small grants to support mid-career faculty (e.g., matching funds, travel support); a trigger mechanism (e.g. 9th year review); and broader, more inclusive criteria.
• Provide mentors; just because a faculty member gets tenure and promoted to the associate rank does not mean that s/he no longer needs or wants a mentor.
27

The Collaborative on Academic Careers in Higher EducationFaculty Job Satisfaction Survey 2011-12
TENURE AND PROMOTION
James Madison UniversityYOUR RESULTS COMPARED TO PEERS AREAS OF STRENGTH IN GREEN
YOUR RESULTS COMPARED TO COHORT AREAS OF CONCERN IN RED small moderate large
mean overall tenured pre-ten full assoc. men women white foc tenure rank gender race 2008
Benchmark: Tenure policies 3.62 N/A N/A N/A N/A N/A white N/AClarity of tenure process 3.86 N/A N/A N/A N/A N/A men whiteClarity of tenure criteria 3.77 N/A N/A N/A N/A N/A whiteClarity of tenure standards 3.53 N/A N/A N/A N/A N/A whiteClarity of body of evidence for deciding tenure 3.45 N/A N/A N/A N/A N/A -Clarity of whether I will achieve tenure 3.74 N/A N/A N/A N/A N/A women foc -Consistency of messages about tenure 3.27 N/A N/A N/A N/A N/ATenure decisions are performance-based 3.72 N/A N/A N/A N/A N/A women -Benchmark: Tenure clarity 3.34 N/A N/A N/A N/A N/A men white N/AClarity of expectations: Scholar 3.81 N/A N/A N/A N/A N/A whiteClarity of expectations: Teacher 3.86 N/A N/A N/A N/A N/A men white +Clarity of expectations: Advisor 3.30 N/A N/A N/A N/A N/A white +Clarity of expectations: Colleague 3.19 N/A N/A N/A N/A N/A whiteClarity of expectations: Campus citizen 3.02 N/A N/A N/A N/A N/A men whiteClarity of expectations: Broader community 2.89 N/A N/A N/A N/A N/A men whiteBenchmark: Tenure reasonableness 3.90 N/A N/A N/A N/A N/A N/AReasonable expectations: Scholar 4.09 N/A N/A N/A N/A N/AReasonable expectations: Teacher 4.20 N/A N/A N/A N/A N/A white +Reasonable expectations: Advisor 3.94 N/A N/A N/A N/A N/A +Reasonable expectations: Colleague 3.95 N/A N/A N/A N/A N/A white +Reasonable expectations: Campus citizen 3.81 N/A N/A N/A N/A N/A men +Reasonable expectations: Community member 3.71 N/A N/A N/A N/A N/A +Benchmark: Promotion N/A N/A N/A N/A N/A N/A N/A N/A N/A N/A N/A N/A N/A N/A N/AReasonable expectations: Promotion N/A N/A N/A N/A N/A N/A N/A N/A N/A N/A N/A N/A N/A N/A N/ADept. culture encourages promotion N/A N/A N/A N/A N/A N/A N/A N/A N/A N/A N/A N/A N/A N/A N/AClarity of promotion process N/A N/A N/A N/A N/A N/A N/A N/A N/A N/A N/A N/A N/A N/A N/AClarity of promotion criteria N/A N/A N/A N/A N/A N/A N/A N/A N/A N/A N/A N/A N/A N/A N/AClarity of promotion standards N/A N/A N/A N/A N/A N/A N/A N/A N/A N/A N/A N/A N/A N/A N/AClarity of body of evidence for promotion N/A N/A N/A N/A N/A N/A N/A N/A N/A N/A N/A N/A N/A N/A N/AClarity of time frame for promotion N/A N/A N/A N/A N/A N/A N/A N/A N/A N/A N/A N/A N/A N/A N/AClarity of whether I will be promoted N/A N/A N/A N/A N/A N/A N/A N/A N/A N/A N/A N/A N/A N/A N/A
INTERNAL CAMPUS DIFFERENCES
28

The Collaborative on Academic Careers in Higher EducationFaculty Job Satisfaction Survey 2011-12
TENURE AND PROMOTION
James Madison University
0% 25% 50% 75% 100%
men
women
white
foc
When do you plan to submit your dossier for promotion to full professor?
never in ten years or more I don't know in more than five years but less than ten years in five years or less
0% 25% 50% 75% 100%
0% 25% 50% 75% 100%
you
peers
all
no yes
0% 25% 50% 75% 100%
you
peers
all
Have you received formal feedback on your progress towards promotion to full professor?
Have you received formal feedback on your progress towards tenure?
0% 25% 50% 75% 100%
you
peers
all
My decision to remain at this institution for the rest of my career depends on whether I am promoted to full professor.
somewhat or strongly disagree neither/nor somewhat or strongly agree
you peers
0% 25% 50% 75% 100%
all
Data Not Available
Faculty of this rank not surveyed
Data Not Available
Faculty of this rank notsurveyed
Data Not Available
Faculty of this rank notsurveyed
Data Not Available
Faculty of this rank notsurveyed
Data Not Available
Faculty of this rank not surveyed
29
The Collaborative on Academic Careers in Higher Education at the Harvard Graduate School of Education
Your Findings in Context
Leadership & Governance
Why it matters. Academic leaders—especially the provost, dean, and department chair—play major roles in shaping the satisfaction or dissatisfaction of faculty members. From the administration, faculty desire: 1) a clearly articulated mission and vision for the institution that does not change frequently in ways that affect faculty work (e.g., focus on research over teaching or vice versa; importance of generating outside grants); 2) clear expectations for the mix of research, teaching, and service or outreach that remain consistent over time; 3) a sense that their work is valued; and 4) support for research (pre- and post-award) and teaching (adapted from COACHE Report, June 2010).
The president affects faculty, especially, through the stated priorities s/he sets, how well those priorities are communicated, and the pace of decision-making. As Chief Academic Officer, the provost has an impact on faculty work and morale in those same ways, but also by ensuring opportunities for faculty input and supporting the faculty in adapting to changes to mission and/or priorities. Deans or divisional leaders affect the faculty in the same categories as the provost. In addition to these factors, we add fairness in faculty evaluation to the list of things that are important to faculty when they judge department head or chair leadership.
Good practice.
• Ideally, the institution’s mission should remain stable for long periods of time; however, it is unrealistic to think that missions are permanent.
• If the mission needs to change, consult with the faculty to seek their views and assistance in ensuring that changes are implemented smoothly.
• Make sure that all faculty members understand how the shifts in institutional mission affect strategic priorities and the work that faculty do.
• Ensure that resources are allocated effectively to support changes in faculty work.
• Be careful to not let tenure-track faculty get caught unaware, unsuspecting, or unprepared for shifts in priorities. The guidelines for tenure and promotion should not be changed midstream; commitments should be honored.
• Allow senior faculty members grace periods to adjust to new expectations.
• It is almost impossible to over-communicate with faculty about changes to mission, institutional priorities, and resource allocation.
• Consistent messaging is pivotal to strong leadership. Work diligently to ensure that senior, divisional, and departmental leaders are hearing and communicating the same message about institutional priorities.
• Institutional priorities need to be communicated via multiple mediums and venues. A blanket email or a change to a section of the webpage does not adequately ensure broad communication of institutional priorities. Develop a communication plan that considers how the majority (and the minority) of faculty get information.
• Provide training and ongoing educational sessions for department chairs; their role is pivotal in the success of faculty and departments.
• Provide web portals with “one stop shopping” for department chairs.
30

The Collaborative on Academic Careers in Higher EducationFaculty Job Satisfaction Survey 2011-12
LEADERSHIP AND GOVERNANCE
James Madison UniversityYOUR RESULTS COMPARED TO PEERS AREAS OF STRENGTH IN GREEN
YOUR RESULTS COMPARED TO COHORT AREAS OF CONCERN IN RED small moderate large
mean overall tenured pre-ten full assoc. men women white foc tenure rank gender race 2008
Leadership Items (not included in benchmark scores)Priorities are stated consistently 3.11 N/A N/A N/A N/A N/A men white N/APriorities are acted on consistently 2.89 N/A N/A N/A N/A N/A men white N/AChanged priorities negatively affect my work* 3.01 N/A N/A N/A N/A N/A women foc N/ABenchmark: Leadership: Senior 3.08 N/A N/A N/A N/A N/A men white N/APres/Chancellor: Pace of decision making 3.13 N/A N/A N/A N/A N/A men white N/APres/Chancellor: Stated priorities 3.13 N/A N/A N/A N/A N/A men white N/APres/Chancellor: Communication of priorities 2.98 N/A N/A N/A N/A N/A men white N/ACAO: Pace of decision making 3.17 N/A N/A N/A N/A N/A men white N/ACAO: Stated priorities 3.14 N/A N/A N/A N/A N/A men white N/ACAO: Communication of priorities 2.97 N/A N/A N/A N/A N/A white N/ACAO: Ensuring faculty input N/A N/A N/A N/A N/A N/A N/A N/A N/A N/A N/A N/A N/A N/A N/ABenchmark: Leadership: Divisional 3.35 N/A N/A N/A N/A N/A white N/ADean: Pace of decision making 3.44 N/A N/A N/A N/A N/A women white N/ADean: Stated priorities 3.45 N/A N/A N/A N/A N/A white N/ADean: Communication of priorities 3.23 N/A N/A N/A N/A N/A white N/ADean: Ensuring faculty input 3.29 N/A N/A N/A N/A N/A white N/ABenchmark: Leadership: Departmental 3.96 N/A N/A N/A N/A N/A men white N/AHead/Chair: Pace of decision making 3.88 N/A N/A N/A N/A N/A white N/AHead/Chair: Stated priorities 3.94 N/A N/A N/A N/A N/A men white N/AHead/Chair: Communication of priorities 3.86 N/A N/A N/A N/A N/A men N/AHead/Chair: Ensuring faculty input 3.99 N/A N/A N/A N/A N/A men white N/AHead/Chair: Fairness in evaluating work 4.13 N/A N/A N/A N/A N/A N/A
*On this item, a higher mean indicates a negative faculty perception. Strengths, concerns, and internal comparisons appropriately reflect this reversed scaling.
INTERNAL CAMPUS DIFFERENCES
Insuffient number of respondents to report
dean
dept. head/chair
Insuffient number of respondents to report
42 faculty reported that your institution's priorities have changed in ways that negatively affect their work. Those respondents were asked if they agreed or disagreed that deans and
dept. heads provided sufficient support in adapting to these changes.
0%
25%
50%
75%
tenu
red
pre
-te
nur
e
full
ass
ocia
te
me
n
wo
me
n
wh
ite foc
My institution's priorities have changed in ways that negatively affect my work (% of respondents who agree)
somewhat or strongly agree neither/nor somewhat or strongly disagree
31

The Collaborative on Academic Careers in Higher Education at the Harvard Graduate School of Education
Your Findings in Context
The Department
Why it matters. While faculty work at institutions, they work in departments; therefore, it is the departmental culture that has the most impact on faculty satisfaction and morale. There are three broad areas in which faculty judge the departments in which they work: collegiality, engagement, and quality.
Collegiality. While many factors comprise faculty members’ opinions about departmental collegiality, COACHE has discovered that faculty are especially cognizant of how well they feel they “fit” in with their colleagues, their personal interactions with colleagues, whether their colleagues “pitch in” when needed, and colleague support for work/life balance (among others). There really is no substitute for a collegial department when it comes to faculty satisfaction, so how well faculty get along with each other cannot be over-emphasized.
Engagement. It is increasingly common to talk about student engagement but perhaps less so faculty engagement. But it is difficult to imagine an engaged student population without ensuring engaged faculty. COACHE measures the engagement of faculty by having them rate their discussions about undergraduate and graduate learning, pedagogy, the use of technology, research methodology, and professional interactions among colleagues.
Quality. Departmental quality is a function of the intellectual vitality of its faculty, the scholarship that is produced, the effectiveness of teaching, how well the department does recruiting and retaining excellent faculty, and whether and how poor faculty performance is handled.
Good practice.
• Chairs especially are well-served to pay attention to departmental collegiality. Have an open-door policy
so that faculty members can stop in and chat about departmental issues. Intervene when necessary.
• Be especially cognizant to ensure that those who are in the minority—whether by gender, race/ethnicity, age, subfield, political views or some other factor—are not excluded or marginalized in the department; one person’s autonomy might be another’s isolation.
• Create forums for faculty to play together – schedule some social activities; be sure that everyone knows about important milestones in each other’s lives. Celebrate!
• Create forums for faculty to work together, to discuss research, methodology, interdisciplinary ideas, pedagogy, and technology.
• Provide chair training for handling performance feedback for tenure-track faculty members (e.g., annual reviews, mid-probationary period reviews), tenured faculty members (e.g., post-tenure review, annual or merit review, informal feedback); and non-tenure-track faculty.
• Discuss the vitality of the department using benchmarks and analytical data when possible to keep these matters from becoming overly personalized.
• Encourage faculty to participate in activities in the campuses’ center for teaching and learning, as appropriate.
• Use department meetings as more than just an opportunity to review a list of chores. Enlist colleagues to discuss new teaching and research methods or to present case studies for faculty to problem-solve. Using this structured time to initiate departmental engagement will encourage the habits outside of departmental meetings. An even better approach is to ask departmental colleagues to co-present.
32

The Collaborative on Academic Careers in Higher EducationFaculty Job Satisfaction Survey 2011-12
DEPARTMENTAL COLLEGIALITY,ENGAGEMENT, AND QUALITY
James Madison UniversityYOUR RESULTS COMPARED TO PEERS AREAS OF STRENGTH IN GREEN
YOUR RESULTS COMPARED TO COHORT AREAS OF CONCERN IN RED small moderate large
mean overall tenured pre-ten full assoc men women white foc tenure rank gender race 2008
Benchmark: Departmental collegiality 3.91 N/A N/A N/A N/A N/A white N/AColleagues support work/life balance 3.71 N/A N/A N/A N/A N/A men white N/AMeeting times compatible with personal needs 4.01 N/A N/A N/A N/A N/A white N/AAmount of personal interaction w/Pre-tenure 3.92 N/A N/A N/A N/A N/AHow well you fit 3.93 N/A N/A N/A N/A N/A men whiteAmount of personal interaction w/Tenured 3.73 N/A N/A N/A N/A N/A whiteColleagues pitch in when needed 3.97 N/A N/A N/A N/A N/A men N/ADept. is collegial 4.07 N/A N/A N/A N/A N/A white N/ARelated survey itemsColleagues committed to diversity/inclusion 3.97 N/A N/A N/A N/A N/A women N/ABenchmark: Departmental engagement 3.67 N/A N/A N/A N/A N/A men white N/ADiscussions of undergrad student learning 4.17 N/A N/A N/A N/A N/A men N/ADiscussions of grad student learning 2.84 N/A N/A N/A N/A N/A men white N/ADiscussions of effective teaching practices 4.02 N/A N/A N/A N/A N/A men white N/ADiscussions of effective use of technology 3.40 N/A N/A N/A N/A N/A men white N/ADiscussions of current research methods 3.39 N/A N/A N/A N/A N/A men white N/AAmount of professional interaction w/Pre-tenure 4.00 N/A N/A N/A N/A N/A whiteAmount of professional interaction w/Tenured 3.74 N/A N/A N/A N/A N/A womenBenchmark: Departmental quality 3.65 N/A N/A N/A N/A N/A men white N/AIntellectual vitality of tenured faculty 3.52 N/A N/A N/A N/A N/A menIntellectual vitality of pre-tenure faculty 4.17 N/A N/A N/A N/A N/A men whiteScholarly productivity of tenured faculty 3.24 N/A N/A N/A N/A N/A men white N/AScholarly productivity of pre-tenure faculty 3.89 N/A N/A N/A N/A N/A men white N/ATeaching effectiveness of tenured faculty 3.75 N/A N/A N/A N/A N/A men white N/ATeaching effectiveness of pre-tenure faculty 3.99 N/A N/A N/A N/A N/A white N/ADept. is successful at faculty recruitment N/A N/A N/A N/A N/A N/A N/A N/A N/A N/A N/A N/A N/A N/A N/ADept. is successful at faculty retention N/A N/A N/A N/A N/A N/A N/A N/A N/A N/A N/A N/A N/A N/A N/ADept. addresses sub-standard performance 2.71 N/A N/A N/A N/A N/A white N/A
INTERNAL CAMPUS DIFFERENCES
0%
25%
50%
75%
100%
you peers all
Overall satisfaction with your department as a place to work
somewhat or very satisfied
neither/nor
somewhat or verydissatisfied
0%
25%
50%
75%
100%
you peers all
Dept. colleagues support/promote diversity and inclusion.
somewhat or stronglyagree
neither/nor
somewhat or strongydisagree
33

The Collaborative on Academic Careers in Higher Education at the Harvard Graduate School of Education
Your Findings in Context
Appreciation & Recognition
Why it matters. Faculty, at all ranks, are just like everyone else when it comes to wanting to be appreciated by colleagues and recognized for doing good work. Focus group research conducted by COACHE showed that while many senior faculty members feel valued by students, they do not receive much recognition from the upper-level administration. They reported that research relationships, with undergraduate and graduate students, were especially gratifying.
“Senior faculty members, especially at the less intensive research institutions, felt that external service that increased the reputation of their institution was not recognized and went unrewarded. Being engaged in the local community or on the board of a nationally recognized association does not get the senior faculty members recognition or appreciation from their home institution. Although they did not feel valued for external service, senior faculty members said that it is expected of them. This disconnection between expectations and appreciation was dissatisfying for many senior faculty members and provided a disincentive for them to serve their institution in this way” (COACHE Report, 2010, pp. 5-6).
The COACHE survey measures levels of faculty satisfaction with the recognition they receive for the primary aspects of their work (e.g., scholarship, teaching, advising, service, and – where applicable – outreach) from colleagues, the chief academic officer, the dean, and the department head. Also part of this benchmark is a measure of whether or not faculty members feel as though their school/college and department are valued by the institution and whether they feel as though the chief academic officer cares about the faculty of one’s rank.
Good practice.
• The chief academic officer should get to know the faculty in a variety of forums including brown bag lunches, speaker’s series, workshops, and seminars that engage faculty members in appealing topics and current issues.
• Likewise, deans and chairs should make opportunities to showcase faculty work and offer kind words and a “pat on the back” from time to time.
• Take note of what faculty are doing and celebrate faculty work in each school or college at some point every year; such occasions do not have to be costly to be meaningful.
• One of the most substantial obstacles to recognizing faculty work is simply knowing what faculty have done that warrants recognition. Cultivate a culture of recognition by offering opportunities for students, faculty, and campus leaders to highlight the accomplishments of your faculty. Create a physical and a virtual drop box so others can comment on the good work of your faculty.
34

The Collaborative on Academic Careers in Higher EducationFaculty Job Satisfaction Survey 2011-12
APPRECIATION AND RECOGNITION
James Madison UniversityYOUR RESULTS COMPARED TO PEERS AREAS OF STRENGTH IN GREEN
YOUR RESULTS COMPARED TO COHORT AREAS OF CONCERN IN RED small moderate large
mean overall tenured pre-ten full assoc men women white foc tenure rank gender race 2008
Benchmark: Appreciation and recognition 3.48 N/A N/A N/A N/A N/A N/ARecognition: For teaching 3.49 N/A N/A N/A N/A N/A N/ARecognition: For advising 3.20 N/A N/A N/A N/A N/A men N/ARecognition: For scholarship 3.52 N/A N/A N/A N/A N/A white N/ARecognition: For service 3.37 N/A N/A N/A N/A N/A men foc N/ARecognition: For outreach 3.37 N/A N/A N/A N/A N/A men N/ARecognition: From colleagues 3.68 N/A N/A N/A N/A N/A white N/ARecognition: From CAO N/A N/A N/A N/A N/A N/A N/A N/A N/A N/A N/A N/A N/A N/A N/ARecognition: From Dean N/A N/A N/A N/A N/A N/A N/A N/A N/A N/A N/A N/A N/A N/A N/ARecognition: From Head/Chair 3.89 N/A N/A N/A N/A N/A N/ASchool/college is valued by Pres/Provost N/A N/A N/A N/A N/A N/A N/A N/A N/A N/A N/A N/A N/A N/A N/ADept. is valued by Pres/Provost N/A N/A N/A N/A N/A N/A N/A N/A N/A N/A N/A N/A N/A N/A N/ACAO cares about faculty of my rank 3.11 N/A N/A N/A N/A N/A women white -
*The academic areas were developed based on a review of structural designations (i.e., schools and colleges, which differ from campus to campus) and Classification of Institutional Programs (CIP) codes, which are often too narrowly defined for IRB-approved reporting. Your institution assigned faculty to one of these twelve groups. This table may include blank rows depending upon the disciplinary characteristics of your institution and response rates. The COACHE Online Reporting Tool can provide additional analysis by academic area or school/college.
INTERNAL CAMPUS DIFFERENCES
0%
25%
50%
75%
100%
assistant associate full
The person who serves as my chief academic officer seems to care about the quality of life for faculty of my rank.
somewhat or stronglydisagree
neither/nor
I don't know
somewhat or stronglyagree
1.0 2.0 3.0 4.0 5.0
Humanities
Social Sciences
Physical Sciences
Biological Sciences
Visual & Performing Arts
Engineering/Comp Sci/Math/Stats
Health & Human Ecology
Agriculture/Nat Res/Env Sci
Business
Education
Medical Schools & Health Professions
Other Professions
I feel that my department is valued by this institution's President/Chancellor and Provost by Academic Area*. (1=Strongly
disagree 5=Strongly Agree)
Data Not Available
Faculty of this rank notsurveyed
35

The Collaborative on Academic Careers in Higher EducationFaculty Job Satisfaction Survey 2011-12
BEST ASPECTS
James Madison University
you peerall
(60) you peerall
(60) you peerall
(60) you peerall
(60) you peerall
(60) you peerall
(60) you peerall
(60)
quality of colleagues 24% 5 51 N/A N/A N/A 24% 5 51 32% 4 50 15% 5 51 26% 0 53 14% 4 38support of colleagues 19% 5 51 N/A N/A N/A 19% 5 51 16% 2 40 23% 5 49 19% 0 48 24% 3 41opportunities to collaborate with colleagues 2% 0 4 N/A N/A N/A 2% 0 4 0% 0 4 5% 0 10 3% 1 5 0% 0 8quality of graduate students 3% 0 1 N/A N/A N/A 3% 0 1 1% 0 1 5% 1 5 4% 0 2 0% 0 5quality of undergraduate students 13% 1 17 N/A N/A N/A 13% 1 17 15% 0 21 11% 1 16 13% 0 22 10% 0 17quality of the facilities 4% 0 2 N/A N/A N/A 4% 0 2 6% 0 4 2% 0 2 4% 0 2 0% 0 6support for research/creative work (e.g., leave) 2% 0 0 N/A N/A N/A 2% 0 0 3% 0 3 2% 1 4 3% 0 0 0% 1 7support for teaching 17% 0 10 N/A N/A N/A 17% 0 10 15% 0 9 20% 0 13 18% 0 11 14% 0 11support for professional development 2% 0 3 N/A N/A N/A 2% 0 3 1% 0 5 3% 0 3 2% 0 4 5% 0 6assistance for grant proposals 3% 0 0 N/A N/A N/A 3% 0 0 4% 0 1 2% 0 3 4% 0 1 0% 0 4childcare policies/practices 0% 0 1 N/A N/A N/A 0% 0 1 0% 0 0 0% 0 1 0% 0 1 0% 0 0availability/quality of childcare facilities 0% 0 0 N/A N/A N/A 0% 0 0 0% 0 1 0% 0 0 0% 0 0 0% 0 1spousal/partner hiring program 1% 0 0 N/A N/A N/A 1% 0 0 0% 0 0 2% 0 0 0% 3 0 5% 0 0compensation 1% 0 3 N/A N/A N/A 1% 0 3 1% 0 3 0% 0 4 1% 0 3 0% 0 5geographic location 22% 3 32 N/A N/A N/A 22% 3 32 22% 2 34 23% 3 34 21% 0 30 29% 3 32diversity 0% 0 3 N/A N/A N/A 0% 0 3 0% 0 2 0% 0 5 0% 3 3 0% 0 10presence of others like me 0% 0 0 N/A N/A N/A 0% 0 0 0% 0 3 0% 0 2 0% 0 0 0% 0 5my sense of "fit" here 23% 3 35 N/A N/A N/A 23% 3 35 25% 2 39 21% 4 33 24% 1 37 19% 3 29protections from service/assignments 2% 0 0 N/A N/A N/A 2% 0 0 1% 0 0 3% 0 0 3% 3 0 0% 0 0commute 5% 0 3 N/A N/A N/A 5% 0 3 7% 0 7 3% 1 9 4% 0 6 10% 0 5cost of living 5% 3 22 N/A N/A N/A 5% 3 22 7% 0 25 3% 3 22 5% 0 20 5% 3 24research requirements for t and p 4% 0 0 N/A N/A N/A 4% 0 0 3% 0 1 5% 0 0 4% 0 0 5% 0 1teaching load 5% 0 1 N/A N/A N/A 5% 0 1 4% 0 4 6% 0 6 4% 0 2 10% 0 7tenure/promotion requirements in general 9% 0 0 N/A N/A N/A 9% 0 0 9% 0 2 9% 0 0 5% 0 1 29% 0 6tenure/promotion criteria clarity 1% 0 0 N/A N/A N/A 1% 0 0 1% 0 0 0% 0 0 1% 0 0 0% 0 1tenure/promotion process clarity 0% 0 0 N/A N/A N/A 0% 0 0 0% 0 0 0% 0 0 0% 0 0 0% 0 0manageable pressure to perform 14% 0 3 N/A N/A N/A 14% 0 3 7% 0 16 21% 0 12 16% 0 7 5% 1 10academic freedom 10% 1 24 N/A N/A N/A 10% 1 24 7% 1 30 14% 2 27 11% 0 22 10% 0 29other (please specify) 3% N/A N/A N/A N/A N/A 3% N/A N/A 3% N/A N/A 3% N/A N/A 4% N/A N/A 0% N/A N/Adecline to answer 1% N/A N/A N/A N/A N/A 1% N/A N/A 1% N/A N/A 2% N/A N/A 1% N/A N/A 5% N/A N/Athere are no positive aspects 1% N/A N/A N/A N/A N/A 1% N/A N/A 1% N/A N/A 0% N/A N/A 1% N/A N/A 0% N/A N/A
Faculty were asked to identity the two (and only two) best aspects of working at your institution. The top four responses for your institution are shown in red and disaggregated by tenure status, gender, and race. The columns labled Peer show the total number of times an item appeared as a top four item amongst any of your five peer institutions. The All column reflects the number of times an item appeared in the top four at any of the institutions in the current cohort. When a best aspect at your institution is also shown as a best aspect for your peers and/or the cohort, the issue may be seen as common in the faculty labor market. Best aspects that are unique to your campus are market differentiators for your institution which can be highlighted in recruitment and retention efforts.
Overall Tenured Pre-tenure Men Women White Faculty of Color
36

The Collaborative on Academic Careers in Higher EducationFaculty Job Satisfaction Survey 2011-12
WORST ASPECTS
James Madison University
you peersall
(60) you peersall
(60) you peersall
(60) you peersall
(60) you peersall
(60) you peersall
(60) you peersall
(60)
quality of colleagues 3% 0 4 N/A N/A N/A 3% 0 4 3% 0 2 3% 0 10 2% 0 6 10% 0 6support of colleagues 4% 1 0 N/A N/A N/A 4% 1 0 4% 0 2 5% 0 5 5% 1 1 0% 1 3opportunities to collaborate with colleagues 3% 0 7 N/A N/A N/A 3% 0 7 0% 0 10 6% 0 6 4% 0 6 0% 0 9quality of graduate students 1% 1 13 N/A N/A N/A 1% 1 13 1% 0 19 0% 0 13 0% 1 13 5% 1 15quality of undergraduate students 5% 2 20 N/A N/A N/A 5% 2 20 3% 0 22 8% 0 14 4% 2 24 14% 0 10quality of the facilities 2% 0 44 N/A N/A N/A 2% 0 44 3% 0 41 2% 0 45 3% 0 44 0% 1 35lack of support for research/creative work (e. 17% 5 3 N/A N/A N/A 17% 5 3 19% 0 1 15% 0 2 18% 5 2 14% 5 3lack of support for teaching 1% 0 3 N/A N/A N/A 1% 0 3 1% 0 9 2% 0 6 2% 0 2 0% 0 7lack of support for professional development 2% 0 2 N/A N/A N/A 2% 0 2 4% 0 4 0% 0 3 2% 0 2 5% 0 4lack of assistance for grant proposals 1% 0 3 N/A N/A N/A 1% 0 3 0% 0 3 2% 0 6 0% 1 7 5% 0 2childcare policies/practices (or lack thereof) 4% 0 2 N/A N/A N/A 4% 0 2 4% 0 1 5% 0 9 5% 1 5 0% 0 3availability/quality of childcare facilities 4% 0 16 N/A N/A N/A 4% 0 16 4% 0 16 3% 0 15 4% 0 9 0% 0 23spousal/partner hiring program (or lack there 11% 1 49 N/A N/A N/A 11% 1 49 9% 0 49 14% 0 44 9% 0 50 24% 2 41compensation 57% 5 23 N/A N/A N/A 57% 5 23 65% 0 23 50% 0 29 58% 5 19 57% 5 26geographic location 10% 2 9 N/A N/A N/A 10% 2 9 4% 0 5 15% 0 10 9% 2 6 14% 2 19lack of diversity 7% 0 2 N/A N/A N/A 7% 0 2 3% 0 3 12% 0 4 8% 0 1 5% 0 10absence of others like me 3% 0 2 N/A N/A N/A 3% 0 2 1% 0 4 5% 0 6 2% 0 3 10% 1 6my lack of "fit" here 4% 1 23 N/A N/A N/A 4% 1 23 4% 0 15 3% 0 23 4% 1 24 0% 1 19too much service/too many assignments 13% 0 4 N/A N/A N/A 13% 0 4 15% 0 6 11% 0 11 13% 0 4 10% 2 6commute 1% 0 8 N/A N/A N/A 1% 0 8 1% 0 9 2% 0 10 2% 0 7 0% 2 10cost of living 2% 1 3 N/A N/A N/A 2% 1 3 1% 0 2 3% 0 4 3% 1 4 0% 1 2research requirements for t and p 1% 1 23 N/A N/A N/A 1% 1 23 0% 0 24 2% 0 25 1% 0 23 0% 1 25teaching load 10% 3 2 N/A N/A N/A 10% 3 2 7% 0 3 14% 0 4 12% 4 1 0% 2 2tenure/promotion requirements in general 1% 0 3 N/A N/A N/A 1% 0 3 3% 0 4 0% 0 5 2% 0 4 0% 0 4tenure/promotion criteria clarity 3% 0 3 N/A N/A N/A 3% 0 3 4% 0 2 2% 0 4 4% 0 4 0% 1 3tenure/promotion process clarity 1% 0 6 N/A N/A N/A 1% 0 6 1% 0 6 2% 0 8 2% 0 6 0% 0 8unrelenting pressure to perform 5% 0 0 N/A N/A N/A 5% 0 0 6% 0 1 5% 0 0 6% 0 0 0% 0 1academic freedom 1% 0 0 N/A N/A N/A 1% 0 0 0% 0 0 2% 0 0 1% 1 0 0% 0 0other (please specify) 3% N/A N/A N/A N/A N/A 3% N/A N/A 4% N/A N/A 2% N/A N/A 4% N/A N/A 0% N/A N/Adecline to answer 3% N/A N/A N/A N/A N/A 3% N/A N/A 4% N/A N/A 2% N/A N/A 3% N/A N/A 5% N/A N/Athere are no negative aspects 4% N/A N/A N/A N/A N/A 4% N/A N/A 4% N/A N/A 5% N/A N/A 4% N/A N/A 10% N/A N/A
Faculty were asked to identity the two (and only two) worst aspects of working at your institution. The top four responses for your institution are shown in red and disaggregated by tenure status, gender, and race. The columns labled Peer show the total number of times an item appeared as a top four item at any of your five peer institutions. The All column shows the number of times an item appeared in the top four at any of the institutions in the current cohort. When a worst aspect at your institution is also shown as a worst aspect by your peers and/or the cohort, the issue may be seen as common in the faculty labor market. More attention should be paid to the worst aspects that are unique to your institution. These distinctions cast the institution in a negative light.
Overall Tenured Pre-tenure Men Women White Faculty of Color
37

The Collaborative on Academic Careers in Higher EducationFaculty Job Satisfaction Survey 2011-12
RETENTION AND NEGOTIATIONS
James Madison University
you peers all you peers all you peers all you peers all you peers all you peers all you peers all
base salary 65% 46% 39% N/A N/A N/A 65% 46% 39% 72% 50% 42% 57% 43% 37% 64% 48% 40% 70% 41% 37%supplemental salary (e.g., overload) 1% 3% 4% N/A N/A N/A 1% 3% 4% 2% 3% 4% 0% 4% 4% 0% 3% 4% 5% 5% 4%tenure clock 3% 5% 5% N/A N/A N/A 3% 5% 5% 3% 5% 4% 2% 5% 6% 3% 5% 5% 0% 5% 5%teaching load (e.g., course release) 8% 14% 13% N/A N/A N/A 8% 14% 13% 3% 13% 11% 14% 14% 15% 9% 13% 12% 5% 16% 15%administrative responsibilities 0% 2% 2% N/A N/A N/A 0% 2% 2% 0% 2% 2% 0% 2% 2% 0% 3% 3% 0% 0% 1%leave time 0% 1% 1% N/A N/A N/A 0% 1% 1% 0% 0% 1% 0% 1% 2% 0% 1% 1% 0% 0% 1%equipment 1% 1% 2% N/A N/A N/A 1% 1% 2% 0% 2% 2% 2% 1% 2% 1% 1% 2% 0% 1% 2%lab/research support 3% 8% 13% N/A N/A N/A 3% 8% 13% 3% 8% 16% 2% 9% 11% 3% 7% 13% 0% 12% 14%employment for spouse/partner 11% 5% 7% N/A N/A N/A 11% 5% 7% 7% 3% 6% 16% 7% 7% 9% 5% 6% 20% 5% 8%sabbatical or other leave time 2% 5% 3% N/A N/A N/A 2% 5% 3% 2% 4% 2% 2% 5% 4% 2% 5% 4% 0% 3% 3%
you peers all you peers all you peers all you peers all you peers all you peers all you peers all
base salary 33% 21% 16% N/A N/A N/A 33% 21% 16% 43% 23% 17% 24% 19% 15% 32% 22% 16% 43% 18% 17%supplemental salary (e.g., overload) 3% 5% 4% N/A N/A N/A 3% 5% 4% 3% 5% 3% 3% 5% 5% 3% 4% 4% 5% 5% 4%tenure clock 4% 12% 13% N/A N/A N/A 4% 12% 13% 4% 13% 14% 4% 11% 12% 4% 10% 13% 5% 20% 12%teaching load (e.g., course release) 11% 9% 10% N/A N/A N/A 11% 9% 10% 12% 13% 10% 10% 6% 9% 12% 9% 10% 5% 9% 10%administrative responsibilities 4% 2% 3% N/A N/A N/A 4% 2% 3% 4% 3% 3% 3% 2% 2% 4% 3% 3% 0% 0% 3%leave time 1% 1% 2% N/A N/A N/A 1% 1% 2% 3% 1% 2% 0% 1% 2% 1% 2% 2% 5% 0% 1%equipment 9% 8% 8% N/A N/A N/A 9% 8% 8% 6% 4% 7% 12% 10% 9% 8% 7% 7% 14% 10% 9%lab/research support 10% 9% 9% N/A N/A N/A 10% 9% 9% 3% 8% 9% 16% 10% 10% 11% 9% 10% 0% 7% 8%employment for spouse/partner 10% 11% 11% N/A N/A N/A 10% 11% 11% 13% 9% 9% 6% 12% 12% 11% 11% 11% 0% 9% 9%sabbatical or other leave time 3% 4% 4% N/A N/A N/A 3% 4% 4% 3% 2% 4% 3% 6% 4% 3% 5% 4% 5% 2% 3%to improve your prospects for promotion 1% 1% 3% N/A N/A N/A 1% 1% 3% 0% 1% 3% 3% 1% 2% 1% 1% 2% 5% 2% 4%to improve geographic location 4% 10% 10% N/A N/A N/A 4% 10% 10% 0% 10% 10% 7% 11% 11% 4% 11% 11% 5% 9% 9%
If you were to choose to leave your institution, what would be your primary reason?
Overall Tenured Pre-tenure Men Women White FOC
White FOC
If you could negotiate adjustments to your employment, which one of the following items would you most like to adjust?
Overall Tenured Pre-tenure Men Women
0% 25% 50% 75% 100%
actively sought an outside job offer
received a formal job offer
renegotiated the terms of your employment
In the past five years, have you...
you peers all
0%
25%
50%
75%
100%
you peers all
Are outside offers necessary for negotiations?
agree
neither/nor
disagree
Data Not Available
Faculty of this rank notsurveyed
38

The Collaborative on Academic Careers in Higher EducationFaculty Job Satisfaction Survey 2011-12
RETENTION AND NEGOTIATIONS
0% 25% 50% 75% 100%
for no more than five years after earningtenure
more than five years but less than ten
ten years or more
I don't know
Assuming you achieve tenure, how long do you plan to remain at this institution? (Pre-tenure Faculty Only)
you peers all
0% 25% 50% 75% 100%
for no more than five years
more than five years but less than ten
ten years or more
I don't know
How long do you plan to remain at this institution? (Tenured Faculty Only)
you peers all
0% 25% 50% 75% 100%
men
women
white
foc
How long do you plan to remain at your institution?
for no more than five years more than five years but less than ten I don't know ten years or more
0% 25% 50% 75% 100% 0% 25% 50% 75% 100%
all comparable institutionspeersyou
Data Not Available
Faculty of this rank notsurveyed
39

The Collaborative on Academic Careers in Higher EducationFaculty Job Satisfaction Survey 2011-12
THEMATIC CODINGOF OPEN-ENDED COMMENTS
James Madison University
Please use the space below to tell us the number one thing that you, personally, feel your institution could do to improve your workplace.
0%
25%
50%
App
reci
atio
n a
nd R
ecog
niti
on
Co
llabo
ratio
n an
d In
terd
iscp
linar
y W
ork
Co
mpe
nsat
ion
and
Be
nefit
s
Cu
lture
De
part
men
tal C
olle
gia
lity
De
part
men
tal E
ngag
em
ent
De
part
men
tal Q
ual
ity
Div
ers
ity
Fac
ilitie
s a
nd R
esou
rces
for
Wor
k
Lead
ers
hip
(De
part
men
tal)
Lead
ers
hip
(Div
isio
nal)
Lead
ers
hip
(Gen
eral
)
Lead
ers
hip
(Sen
ior)
Me
nto
ring
Na
ture
of W
ork:
Gen
era
l
Na
ture
of w
ork:
Re
sear
ch
Na
ture
of W
ork:
Se
rvic
e
Na
ture
of w
ork:
Tea
chin
g
Oth
er
Pro
fess
ion
al D
evel
opm
ent
Pro
mot
ion
Ten
ure
Wor
k an
d P
ers
onal
Life
Bal
ance
full associate assistant all comparable institutions
40

The Collaborative on Academic Careers in Higher EducationFaculty Job Satisfaction Survey 2011-12
DEMOGRAPHIC CHARACTERISTICS
James Madison University
Count % Count % Count %Full-time 143 100% 495 100% 3973 100%Part-time 0 0% 0 0% 0 0%Emeritus 0 0% 0 0% 0 0%Other 0 0% 0 0% 0 0%None of the above 0 0% 0 0% 0 0%Professor (or "Full Professor") 0 0% 0 0% 8 0%Associate Professor 7 5% 26 5% 390 10%Assistant Professor 136 95% 459 93% 3492 88%Instructor/Lecturer 0 0% 2 0% 73 2%Other 0 0% 8 2% 10 0%2000 to present 139 100% 467 100% 3746 99%1990 to 1999 0 0% 1 0% 40 1%1980 to 1989 0 0% 0 0% 3 0%Before 1980 0 0% 0 0% 0 0%Tenured 2 1% 4 1% 22 1%Not tenured but on the tenure track 141 99% 491 99% 3933 99%Not on the tenure track 0 0% 0 0% 18 0%Yes 13 9% 42 9% 406 10%No 129 91% 444 91% 3483 90%Department Chair or Department Head 3 23% 4 13% 55 14%Center or Program Director 5 38% 15 47% 240 63%Dean, Assoc. Dean, or Div. Chief 0 0% 0 0% 14 4%Provost, Assoc. Provost, Vice Provost, etc. 0 0% 0 0% 0 0%Other 5 38% 13 41% 72 19%American Indian or Native American 0 0% 1 0% 35 1%Asian, Asian-American, or Pacific Islander 10 7% 40 9% 506 13%White (non-Hispanic) 114 80% 371 80% 2764 70%Black or African-American 4 3% 25 5% 242 6%Hispanic or Latino 5 3% 19 4% 168 4%Other 1 1% 4 1% 39 1%Multiracial 1 1% 3 1% 55 1%Male 69 50% 190 41% 1880 50%Female 69 50% 278 59% 1910 50%
Q30[Q25=1] Which of the following administrative
titles do you currently hold?
Q35 What is your race/ethnicity?
Q40 What is your sex?
all
Q20 What is your tenure status?
Q10 What is your rank?
you peers
Q5 What is your current appointment status?
Q15In what year were you hired
or appointed to this rank at this institution?
Q25Are you currently serving
in an administrative position?
41

The Collaborative on Academic Careers in Higher EducationFaculty Job Satisfaction Survey 2011-12
DEMOGRAPHIC CHARACTERISTICS
James Madison University
Count % Count % Count %allyou peers
0 111 78% 373 77% 3124 81%1 25 18% 91 19% 606 16%2 4 3% 14 3% 96 2%3 1 1% 4 1% 31 1%4 0 0% 1 0% 3 0%5 or more 1 1% 2 0% 10 0%30 or younger 8 6% 16 4% 132 3%31 to 40 71 50% 218 50% 1881 47%41 to 50 35 24% 137 31% 1097 28%51 to 60 13 9% 61 14% 369 9%61 to 70 2 1% 6 1% 76 2%71 or above 0 0% 0 0% 6 0%Single 30 21% 70 15% 546 15%Married or in a civil union 99 71% 332 72% 2816 76%Unmarried, living with partner 4 3% 21 5% 147 4%Divorced, separated, or widowed 7 5% 41 9% 220 6%Not employed and not seeking employment 13 14% 46 14% 374 13%Not employed but seeking employment 10 10% 41 12% 293 10%Employed at this institution 19 20% 82 24% 628 22%Employed elsewhere 54 56% 166 50% 1577 55%Infants, toddlers, or pre-school age children 44 31% 152 27% 1259 32%Elementary, middle or high school aged children 36 25% 142 25% 1246 32%Children 18 or over who live with you 3 2% 13 2% 110 3%Children away at college for whom you are financially 4 3% 30 5% 233 6%Elders for whom you are providing ongoing care 2 1% 18 3% 115 3%A disabled or ill family member 8 6% 28 5% 245 6%None of these 64 45% 184 32% 1389 35%U.S. citizen 117 83% 415 86% 3107 81%Canadian citizen 0 0% 5 1% 47 1%Resident Alien 20 14% 43 9% 536 14%Non-resident alien 4 3% 16 3% 131 3%Other 0 0% 1 0% 12 0%
Q295Do you have any
of the following responsibilities?
Q280In what year were you born?
(Age calculated from year of birth)
Q285 What is your marital status?
Q290What is your spouse/partner's
employment status?
Q275
What is your citizenship status?Q300
Not counting your current institution, at how many other colleges/universities
have you held a tenured faculty position?
42

The Collaborative on Academic Careers in Higher Education at the Harvard Graduate School of Education
The Provost’s Report
APPENDIX
43

44

The Collaborative on Academic Careers in Higher Education at the Harvard Graduate School of Education
YOUR RESULTS ARE IN YOUR HANDS… NOW WHAT?
YOUR FIRST STEPS By Kiernan Mathews, Director This COACHE Provost’s Report is the culmination of our work since 2003 with faculty focus groups, two pilot studies, and ongoing dialog with institutional researchers and chief academic officers at our member institutions. With so many perspectives on report design, we aim to provide the information you and your campus stakeholders need to translate these COACHE results into substantive, constructive actions. At first glance, the report can be daunting. How does one begin to turn so much data into ideas to improve your institution? To paraphrase Carl Sandburg, this report is like an onion: you peel it off one layer at a time, and sometimes you weep. The Provost’s Report, like the skin of the onion, gives you a glimpse of what lies within, but is the beginning, not the end. It is colored—literally, red and green—by your comparisons to other institutions and to differences between subgroups within your institution. The Results at a Glance and COACHE Dashboard will show you, within 10 minutes or so, the broad themes of your survey results and the areas deserving of immediate scrutiny. Take note of our criteria for determining “areas of strength” and “areas of concern.” COACHE analysts have identified comparative “strengths” as those survey dimensions where your campus ranks first or second among your six peers. A comparative “concern,” on the other hand, means your campus ranked fifth or sixth among your peers. Differences by gender, race, rank, and tenure status are highlighted when mean results differ by a moderate or large effect.
The digital files accompanying this report contain faculty responses to open-ended questions, including their opinions on the one thing your college can do to improve the workplace for faculty. Our members find this qualitative, personal component of the report helpful in illustrating the faculty story in ways that quantitative data cannot. Your rich dataset tells many stories, and review of the means comparisons and frequency distributions will yield some important nuances that defy easy summary. Institutional researchers find these tables particularly useful in organizing data for special constituents’ needs (e.g., for a committee on the status of women or the chief diversity officer), but these crosstabs can be useful to anyone looking for more detail. For example, you can sort the Excel version of these data tables to identify quickly the degree to which your faculty are more or less satisfied than faculty at your six peers. You can also use the Criteria tab in your Excel report to raise or lower the threshold for areas of strength and weakness. If your report is overrun with highlighted differences between men’s and women’s levels of satisfaction, you can easily raise the threshold for highlighting, and the report will adjust itself accordingly. Changing the criteria for “top-level” results, then, allows you to reorganize your report around your biggest successes and most pressing problems. Soon, you will discover that many faculty concerns can be dealt with immediately and inexpensively, while others present themselves as opportunities for broad involvement in designing collaborative solutions. Build a communication plan. If you have not yet developed a “COACHE communication plan,” do so now. Use the
45
Your results are in your hands… now what?
COACHE Communication Models and Milestones charts in your supplementary materials to help you consider where your campus (or your leadership style) fits now on the range of transparency and shared governance, and perhaps where it should be in the future. Of course, this framework is not designed to suggest that one approach is always better than another, but instead, to assist in your determination of which approach is best given your institution’s culture—and given also what your faculty want from you, their leaders, as expressed through the COACHE survey. To inform your communication strategy, review the campus calendar for the most effective venues to discuss COACHE participation, such as faculty senate meetings, collective bargaining group meetings, opening convocations and/or retreats (for deans, chairs, and/or faculty), and new faculty orientations.* Consider print and electronic media outlets (e.g., campus newspapers, HR and provostial newsletters, faculty job postings) for communicating your COACHE enrollment and results. When you have decided on a course of action, prepare and distribute a letter for communicating your plan. Disseminate broadly. Whatever model you feel fits best, do not delay sharing your institutional report, in part or in full, with key constituents on your campus. Consider forming a task force or ad hoc committee. If you choose to do so, you should designate its members as the conduit for all information about COACHE and mention this group in all communication with faculty. Put your data into play with pre-tenure and tenured faculty, the faculty senate, collective bargaining groups, campus committees (e.g., Promotion & Tenure, Status of Women, Diversity), deans, department
* Although COACHE does not survey new hires, these faculty are likely to communicate with their colleagues. Additionally, even though they did not participate in the survey, they will benefit from your responses to the findings.
chairs, the executive council and/or senior administrators, including the Chief Diversity Officer, and the board of trustees (see more on this below). It is particularly important to disseminate your results to the faculty who each spent about 20 minutes completing the survey. Failure to demonstrate action in response to their contribution of time may result in reduced response rates in future surveys. Many COACHE members have posted some or all of their results on their web sites to highlight institutional strengths and demonstrate their commitment to transparency in improving the areas of concern. Many colleges and universities hold workshops and forums with constituents, together or separately, to discuss interpretations of and policy responses to their COACHE findings. When meeting with these groups, ask questions to organize and catalyze the conversations around COACHE. For example: What confirmed (or defied) conventional wisdom? What are the surprises? Disparities? Lessons? Implications? Take ownership. You must take ownership of the results, or insist that people in a position to make change are held accountable for doing so. Our colleagues, Cathy Trower and Jim Honan, cited a provost in The Questions of Tenure (ed. R. Chait, 2002) who said: “Data don’t just get up and walk around by themselves… they only become potent when somebody in charge wants something to happen.” Without the catalyst of responsibility, good intentions may not produce desired results. Consider forming, for example, a mid-career faculty task force that would identify the COACHE findings particularly germane to local concerns of associate professors, then would present a range of policy recommendations emerging from their analysis. As an alternative, ask administrators in academic affairs, faculty development, diversity, and
46

Your results are in your hands… now what?
human resources to read the report and identify the top three things they would recommend as a result. The responses might be broad (e.g., “Demystify the promotion process”) or specific (e.g., “Increase availability of eldercare options”). Naturally, expectations ought to be set so that recommendations are realistic and align with your strategic plan and priorities. Through COACHE, we have seen this accountability exemplified by a provost who memorably signaled a “buck stops here” attitude (not to mention a sense of humor) to improving faculty work/life by donning a shirt imprinted with “C-A-O” in big, bold letters. He understood that the actions suggested by his COACHE report—whether highlighting strengths or addressing concerns—align with the will of policymakers and faculty, and that it must be someone’s responsibility to see the recommendations through to outcomes. Just giving constituents—and in particular, the faculty—some part in the COACHE conversation gives them a stake in advancing better recruiting, retention, and development. Engage with peer institutions. We named this project the Collaborative because only by gathering together the agents for change in faculty work/life will we understand what works well, where, and why. Several times each year, COACHE sends invitations to key contacts at each member institution to participate in conference-based special events and workshops. There, participants share innovative strategies for using COACHE data and tackling the challenges we all have in common. Out of these discussions have emerged more comprehensive data-sharing agreements among peers, site visits to exemplary institutions, and lasting contacts for free advice and consultation. (“We’re thinking about implementing this new program. Has anyone else ever tried it?”)
In addition to bringing COACHE members together for these special events, we continually seek out other ways to support our collaborative spirit: hosting our annual Leaders’ Workshop; highlighting member institutions in our newsletter; trying out new policy and program ideas on the COACHE ListServ (sign up at www.coache.org); and offering to conduct site visits to member campuses. Thanks to these collaborations, we all gain actionable insight into making colleges campuses great places to work. Call us. Think of COACHE as your hotline for suggestions in faculty recruitment, development and success. For the duration of your three-year COACHE membership, please call us (617-495-5285) if you have any questions about how you can make the most of your investment in this project. Also, recommend to anyone working with or presenting COACHE data (such as institutional research staff) to call us for advice and tools to simplify the work. If your COACHE report is collecting dust on the shelf, then we have failed. Let us help you cultivate your data—and your faculty—as a renewable resource. WHAT’S A DEAN TO DO? by Cathy Trower, Research Director Not long ago, after addressing a group of academic deans about the barriers to interdisciplinary scholarship and changes needed to overcome them, a dean asked, “But what’s a dean to do? We are seen as ‘middle meddlers!’” He elaborated by saying that it is difficult to manage or effect change from the decanal vantage point because of the organizational hierarchy and power structure; there’s a provost and president above him and senior, department chairs and tenured faculty in various departments around him.
47

Your results are in your hands… now what?
Since that question was posed to me, I have met with several academic administrators and here is what I’ve learned about what deans can do to bring about improvements on any issue, whether it is promoting interdisciplinary scholarship and supporting such scholars for success, increasing the numbers, status, and success of women in STEM disciplines and of faculty of color, or creating a great place to work for faculty. I hope these suggestions will prove helpful for COACHE member institutions as they focus on the issues related to faculty recruitment, retention and development on their campuses as uncovered by our survey. Focus attention. Most issues have low salience for most people most of the time. In addition, there are always multiple concerns on college campuses and all too often the ‘crisis de jour’ can distract us from persistent, systemic problems. Deans can help focus the attention of faculty and other administrators by spending time, over time, on the issue upon which s/he wishes to influence. Be accountable. Gather data. Deans are in a prime position to call attention to issues or problems by bringing data to bear on them. Research shows that what gets measured gets done. In some cases, the data are quantitative and in others help will come in the form of stories and anecdotes. In any case, marshal the evidence to make the case. Engage colleagues up, down, and across campus. Build alliances with other deans by discussing areas of mutual concern, defining the problems, and thinking of possible solutions. Involve the faculty in those conversations. One administrator with whom I spoke recently said that he plans to form an Advisory Task Force of key senior faculty to figure out how to make progress recruiting and retaining scholars of color. Take the ideas to the provost; in other words, make your best case and make it known that you have support on multiple fronts. Offer solutions, not more problems.
Don’t accept the status quo. In other words, persist. Some decisions in academic institutions are made by accretion and just because one’s proposal is rejected today doesn’t mean that it won’t be accepted later. Deans can persist until progress, even incremental, is made. An effective strategy is not only to anticipate the costs of policy implementation (e.g., modified duties, flextime, stop-the-clock, dual career hires), but also to discuss the cost of maintaining the status quo. Ask questions. Instead of feeling the need to have all the answers all of the time, pose questions in a variety of forums where you already have people’s attention. As one dean said to me, “I lead by asking relevant questions at a variety of tables with various constituencies. Most often, those questions have no easy answers, but I am able to put the issue effectively into play. Raising issues as questions puts academics in a mindset of problem solving. This is, after all, how we all approach our own scholarship – with questions, not with answers.” COACHE & GOVERNANCE by Richard Chait, Research Professor Academic administrators regularly and rightly remind boards of trustees that the quality of a college or university and the vitality of the faculty are very tightly linked. In turn, most trustees recognize that the vitality of the faculty requires that institutions create an attractive and supportive work environment. In particular, colleges must be able to recruit and retain a talented and diverse stream of “new blood” for the faculty. Despite the importance administrators and trustees assign to this objective, boards rarely discuss the topic. COACHE reports offer presidents, provosts, and deans the opportunity to engage trustees at an appropriate policy level in conversations about the quality of work life for the faculty that represent the
48

Your results are in your hands… now what?
institution’s academic future and its current reality. There are two potentially productive lines of inquiry. In the first mode, management educates the board about major themes that emerged from COACHE data and from benchmark comparisons with the institution’s peer group. The Provost’s Report can be further distilled to highlight for trustees the overall or global levels of satisfaction; specific aspects of work/life that faculty consider most agreeable and most problematic; significant disparities by race, gender, or rank; and critical “policy gaps,” areas respondents rated important in principle and unsatisfactory in practice. In short order, trustees will have keener insight into the organizational environment and personal experiences of faculty, as well as a deeper appreciation for management’s commitment and game plan to make the college a great place to work. The second mode, which may be even more profitable, turns the tables. Here, trustees educate the administration. As academic leaders contemplate appropriate responses to the challenges and concerns that faculty confront, board members can be a valuable resource. Whether as corporate executives or senior partners in firms (e.g., law, medicine, consulting, and engineering), many trustees also have to create, if only for competitive reasons, attractive work environments responsive to the preferences and lifestyles of new generations of professionals. While the circumstances are not identical, the fundamental challenges are not terribly different: clarity of performance expectations; professional fulfillment; work-family balance; collegial culture; and diversity, to name a few. With COACHE data as context, trustees can share successful (and unsuccessful) strategies, policies, and practices intended to improve work satisfaction and vitality, whether for relatively young newcomers or seasoned veterans at the company or firm. What did you try, and to what effect? What did you learn? This line of inquiry could well yield some innovative and effective initiatives that can be adapted to
academe, and the discussion will reinforce the board’s role as a source of intellectual capital and as active participants in consequential conversations.
49

Your results are in your hands… now what?
50

The Collaborative on Academic Careers in Higher Education at the Harvard Graduate School of Education
BACKGROUND & DEFINITIONS
Background
The principal purposes of the Collaborative on Academic Careers in Higher Education (COACHE) survey are two-fold: (1) to enlighten academic leaders about the experiences and concerns of full-time, faculty; and (2) to provide data that lead to informed discussions and appropriate actions to improve the quality of work/life for those faculty. Over time, we hope these steps will make the academy an even more attractive and equitable place for talented scholars and teachers to work.
The core element of COACHE is a web-based survey designed on the basis of extensive literature reviews; of themes emerging from multiple focus groups; of feedback from senior administrators in academic affairs; and of extensive pilot studies and cognitive tests in multiple institutional contexts. While there are many faculty surveys, the COACHE instrument is unique in that it was designed expressly to take account of the concerns and experiences faculty on issues with direct policy implications for academic leaders.
This COACHE Faculty Job Satisfaction Survey provides academic leaders with a lever to enhance the quality of work-life for faculty. The report portfolio provides not only interesting data, but also actionable diagnoses—a springboard to workplace improvements, more responsive policies and practices, and an earned reputation as a great place for faculty to work.
Survey Design The chief aim in developing the COACHE Faculty Job Satisfaction Survey was to assess, in a comprehensive and quantitative way, faculty’s work-related quality of life. The survey addresses multiple facets of job satisfaction and includes specific questions that would yield unambiguous, actionable data on key policy-relevant issues.
The COACHE instrument was developed and validated in stages over a period of several years. Focus groups were conducted with faculty to learn how they view certain work-related issues, including specific institutional policies and practices, work climate, the ability to balance professional and personal lives, issues surrounding tenure, and overall job satisfaction.
Drawing from the focus groups, prior surveys on job satisfaction among academics and other professionals, and consultation with subject matter and advisory board experts on survey development, COACHE researchers developed web-based survey prototypes that were then tested in pilot studies across multiple institutions.
COACHE solicited feedback about the survey by conducting follow-up interviews with a sub-sample of the respondents of the pilot study. Cognitive interviews were conducted with faculty from a broad range of institutional types to test the generalizability of questions across various institutional types. The survey was revised in light of this feedback. The current version of the survey was revised further, taking into account feedback provided by respondents in survey administrations annually since 2005. Survey administration All eligible subjects at participating institutions were invited to complete the survey. Eligibility was determined according to the following criteria:
Full-time Not hired in the same year as survey
administration Not clinical faculty in such areas as Medicine,
Dentistry, Nursing, Pharmacy, and Veterinary Medicine
Not in terminal year after being denied tenure
51

Background and definitions
Subjects first received a letter about the survey from a senior administrator (e.g., president, provost, or dean) at their institution. Next, subjects received an email from COACHE inviting them to complete the survey. Over the course of the survey administration period, three automated reminders were sent via email to all subjects who had not completed the survey.
Participants accessed a secure web server through their own unique link provided by COACHE and, and agreeing to an informed consent statement, responded to a series of multiple-choice and open-ended questions (see Supplemental Materials). Generally, respondents completed the survey in less than twenty-five minutes; the mode (most frequent) completion time was approximately 21 minutes.
Data conditioning For a participant’s responses to be included in the data set, s/he had to provide at least one meaningful response beyond the initial demographic section of the instrument. The responses of faculty who either
terminated the survey before completing the demographic section or chose only N/A or Decline to Respond for all questions were removed from the data set. The impact of such deletions, however, is relatively small: on average, greater than 90 percent of respondents who enter the COACHE survey go on to complete it in its entirety.
When respondents completed the survey in an inordinately short time or when the same response was used for at least 95% of items, the respondents were removed from the population file.
In responses to open-ended questions, individually-identifying words or phrases that would compromise the respondent’s anonymity were either excised or emended by COACHE analysts. Where this occurred, the analyst substituted that portion of the original response with brackets containing an ellipsis or alternate word or phrase (e.g., […] or [under-represented minority]). In the case of custom open-ended questions, comments were not altered in any way.
Definitions All comparable institutions, “All comparables,” or “All” Within the report, comparisons between your institution and the cohort group provide context for your results in the broader faculty labor market. While the experiences, demands, and expectations for faculty vary by institutional type—reflected in your peers selections—this comparison to the entire COACHE cohort can add an important dimension to your understanding of your faculty. The institutions included in this year’s “all comparables” group are listed in the appendix of your Provost’s Report. Data weighting or “weight scale” In prior reports, a weighting scale was developed for each institution to adjust for the under- or over-representation in the data set of subgroups defined by race and gender (e.g., White males, Asian females,
etc.). Applying these weights to the data thus allowed the relative proportions of subgroups in the data set for each institution to more accurately reflect the proportions in that institution’s actual population of pre-tenure faculty.
However, the use of weights poses some methodological challenges. First, and foremost, the actual application of weights in the COACHE report only produced very small changes in results. Because COACHE does not use samples the respondent group typically is representative of the full population. Also, weights applied to an overall mean are less useful when comparing subgroups of the respondent population. When weighted data is disaggregated, the utility of the weights is compromised. For these reasons and other, the use
52

Background and definitions
of weights for this type of large scale analysis is becoming less common.
Effect size Put simple, effect size is means for quantifying the difference between two groups. In the COACHE Provost’s Report, effect size is used to compare the difference between subgroups within a campus (e.g. men to women, tenured to pre-tenure, etc.).
Effect size is calculated using the formula below where:
x1-x2
√ (sd12)-(sd22)
It considers both the central tendency and the variance in the calculation which helps to counter concerns about differences in group sizes. Also, unlike other measures of differences between groups, effect size shows both direction and magnitude.
Faculty of color or “foc” Any respondent identified by his or her institution or self-identifying in the survey as non-White. n < 5 To protect the identity of respondents and in accordance with procedures approved by Harvard University’s Committee on the Use of Human Subjects, cells with fewer than five data points (i.e., mean scores for questions that were answered by fewer than five faculty from a subgroup within an institution) are not reported. Instead, “n < 5” will appear as the result. Response rate The percent of all eligible respondents, by tenure status, rank, gender and by race, whose responses, following the data conditioning process, were deemed eligible to be included in this analysis. Thus, your response rate counts as nonrespondents those faculty who were “screened out” by the survey application or by later processes.
Please feel free to contact COACHE with any additional questions about our research design, methodology, or definitions; about survey administration; or about any aspects of our reports and available data.
53

Background and definitions
54

The Collaborative on Academic Careers in Higher Education at the Harvard Graduate School of Education
* Pre-tenure faculty only; ** Tenured faculty only
PARTICIPATING INSTITUTIONS
Faculty from the following institutions comprise the COACHE database for this 2011-12 Provost’s Report.
Auburn University** Christopher Newport University* Clemson University The College of the Holy Cross* Florida International University** Georgia State University** Hamilton College* Hobart & William Smith Colleges** James Madison University* Johns Hopkins University Kansas State University Kenyon College Lincoln University (MO) Loyola University Maryland Merrimack College Middlebury College Mount Holyoke College** New Mexico State University** North Dakota State University Purdue University Saint Mary's College of Maryland Saint Olaf College Stonehill College Tulane University* University of Alabama** University of Kansas University of Memphis** University of North Texas** University of Saint Thomas (MN) University of Tennessee University of Wisconsin - Parkside West Virginia University** The City University of New York:
College of Staten Island** Hunter College** John Jay College Criminal Justice** Lehman College** New York City College of Technology** Queens College**
The State University of New York: Alfred State College Binghamton University Buffalo State College Farmingdale State College Maritime College Morrisville State College Purchase College Stony Brook University University at Albany University at Buffalo State University of New York:
at Canton at Cobleskill at Cortland at Brockport at Delhi at Fredonia at Geneseo at New Paltz at Old Westbury at Oneonta at Oswego at Plattsburgh at Potsdam College of Env. Science and Forestry Institute of Technology at Utica/Rome
The University of North Carolina: Appalachian State University East Carolina University Elizabeth City State University Fayetteville State University North Carolina A&T State University North Carolina Central University North Carolina State University University of North Carolina - Chapel Hill University of North Carolina - Charlotte University of North Carolina - Greensboro University of North Carolina - Pembroke Western Carolina University Winston-Salem State University
55

Participating institutions
The following table lists the previous members of the Collaborative. Pre-tenure faculty at these institutions have completed a prior version of COACHE’s survey instrument; their data are not included in this report’s analysis, but are available for custom reporting. Albright College Amherst College Arizona State University Auburn University Ball State University Barnard College Bates College Boston University Bowdoin College Brown University Carleton College Case Western Reserve University Clemson University Colgate University College of Saint Benedict / Saint John's University The College of Wooster Connecticut College Dartmouth College Davidson College Delaware State University Denison University DePauw University Drexel University Duke University Emerson College Gonzaga University Goucher College Hampshire College Harvard University Hendrix College Hobart & William Smith Colleges Hofstra University Indiana University Iowa State University Ithaca College Kansas State University Lafayette College Lehigh University Loyola Marymount University Loyola University Maryland
Macalester College Manhattanville College McGill University Michigan State University Mississippi State University Montana State University Montclair State University Northeastern University Oberlin College Occidental College The Ohio State University Ohio University Ohio Wesleyan University Old Dominion University Pacific Lutheran University Pomona College Richard Stockton College of New Jersey Rowan University Skidmore College Stanford University Susquehanna University Syracuse University Texas Tech University Trinity College (CT) Tufts University Tulane University Union College University of Alabama University of Arizona University of Arkansas University of Baltimore University of Chicago University of Cincinnati University of Connecticut University of Houston University of Illinois at Urbana-Champaign University of Iowa University of Kentucky University of Massachusetts Amherst University of Massachusetts Lowell
56

Participating institutions
University of Memphis University of Michigan - Flint University of Minnesota University of North Carolina at Asheville University of North Carolina at Wilmington University of North Texas University of Notre Dame University of Puget Sound University of Richmond University of Rochester University of South Carolina University of Texas at Dallas University of Toronto University of Virginia University of Wisconsin Parkside University of Wyoming Virginia Commonwealth University Virginia Polytechnic Institute and State University Wabash College Washington State University Wayne State University Wellesley College Wesleyan University West Virginia University Wheaton College Whitman College California State University:
Cal Poly Pomona Cal Poly San Luis Obispo California State University - Fullerton California State University - Long Beach California State University - San Bernardino California State University - San Marcos Sonoma State University
The City University of New York Bernard M Baruch College Brooklyn College City College College of Staten Island Hunter College John Jay College Criminal Justice Lehman College Medgar Evers College New York City College of Technology Queens College
York College The University of Missouri System:
Missouri University of Science and Technology University of Missouri - Columbia University of Missouri - Kansas City University of Missouri - St. Louis
57


The Collaborative on Academic Careers in Higher Education (COACHE)
at the Harvard Graduate School of Education 8 Story Street, Fifth Floor
Cambridge, Massachusetts 02138 Telephone: (617) 495-5285
E-mail: [email protected] Web: http://www.coache.org