Embed Size (px)
Citation preview

C I T Y O F A S P E N C A N A R Y I N I T I AT I V Eand C L I M AT E M I T I G AT I O N S E R V I C E SMay 2009
A N U P D A T E T O T H E 2 0 0 4 B A S E L I N E


C L I M AT E M I T I G AT I O N S E R V I C E S
R I C H A R D H E E D EPrincipal Investigator
[email protected] · www.climatemitigation.com1626 Gateway Road · Snowmass, CO 81654 USA
970.927.9511 office970.343.0707 mobile
Copyright ©2009 CMSThis work was done July 2008 to April 2009
under contract with the City of Aspen.
C I T Y O F A S P E N P R I N C I P A L C O N TA C T S
NOTE ON UNITS: Common U.S. units are used throughout. The spreadsheets present emissions results in both U.S. and metric units. Emissions of methane and nitrous oxide are expressed in CO2 -equivalent terms (CO2 e). See Appendix A for conversions and emissions factors.
K I M P E T E R S O NGlobal Warming Project Manager
M A R TA D A R B YData Analyst
City of Aspen130 South Galena Street · Aspen, Colorado 81611 · U.S.A.
www.canaryinitiative.com


C I T Y O F A S P E N · C A N A R Y I N I T I A T I V E1
ACKNOWLEDGEMENTS . . . . . . . . . . . . . . . . . . . . . . . . . . . . . . . . . . . . . . . . . 5
EXECUTIVE SUMMARY . . . . . . . . . . . . . . . . . . . . . . . . . . . . . . . . . . . . . . . . . 7
Scope and Emissions Boundary . . . . . . . . . . . . . . . . . . . . . . . . . . . . . . . . . . . . 8
Results . . . . . . . . . . . . . . . . . . . . . . . . . . . . . . . . . . . . . . . . . . . . . . . . 10
Transportation: Ground Transportation & Air Travel . . . . . . . . . . . . . . . . . . . . . . . . . 14
Buildings: Electricity, natural gas, & propane . . . . . . . . . . . . . . . . . . . . . . . . . . . . 15
Other sources . . . . . . . . . . . . . . . . . . . . . . . . . . . . . . . . . . . . . . . . . . . 16
Reduction Efforts: In Review . . . . . . . . . . . . . . . . . . . . . . . . . . . . . . . . . . . . . . 16
Conclusion . . . . . . . . . . . . . . . . . . . . . . . . . . . . . . . . . . . . . . . . . . . . . . 17
PURPOSE, SCOPE, & EMISSIONS BOUNDARY . . . . . . . . . . . . . . . . . . . . . . . . . . . . . 19
Purpose . . . . . . . . . . . . . . . . . . . . . . . . . . . . . . . . . . . . . . . . . . . . . . . . 19
Scope . . . . . . . . . . . . . . . . . . . . . . . . . . . . . . . . . . . . . . . . . . . . . . . . 19
Emissions Boundary . . . . . . . . . . . . . . . . . . . . . . . . . . . . . . . . . . . . . . . . . . 22
Emissions Savings: Emission Reduction Measures . . . . . . . . . . . . . . . . . . . . . . . . . . . 27
CHANGES TO METHODOLOGY . . . . . . . . . . . . . . . . . . . . . . . . . . . . . . . . . . . . . 29
Commercial Air Travel: 2007 calculation . . . . . . . . . . . . . . . . . . . . . . . . . . . . . . . . 29
General Aviation: 2004 baseline inventory revision . . . . . . . . . . . . . . . . . . . . . . . . . . . 29
RESULTS . . . . . . . . . . . . . . . . . . . . . . . . . . . . . . . . . . . . . . . . . . . . . . . . 30
Economics & Aspen’s Greenhouse Gas Emissions . . . . . . . . . . . . . . . . . . . . . . . . . . . 33
In Perspective: Aspen’s Greenhouse Gas Emissions. . . . . . . . . . . . . . . . . . . . . . . . . . . 34
Buildings: Electricity, Natural Gas, & Propane . . . . . . . . . . . . . . . . . . . . . . . . . . . . . 35
Electricity . . . . . . . . . . . . . . . . . . . . . . . . . . . . . . . . . . . . . . . . . . . . . 37
Natural Gas . . . . . . . . . . . . . . . . . . . . . . . . . . . . . . . . . . . . . . . . . . . . 41
Propane . . . . . . . . . . . . . . . . . . . . . . . . . . . . . . . . . . . . . . . . . . . . . . 41
Transportation . . . . . . . . . . . . . . . . . . . . . . . . . . . . . . . . . . . . . . . . . . . . . 42
Ground Transportation . . . . . . . . . . . . . . . . . . . . . . . . . . . . . . . . . . . . . . . 44
Air Travel & Aviation . . . . . . . . . . . . . . . . . . . . . . . . . . . . . . . . . . . . . . . . 48
Other sources . . . . . . . . . . . . . . . . . . . . . . . . . . . . . . . . . . . . . . . . . . . . . 52
Pitkin County Solid Waste Center. . . . . . . . . . . . . . . . . . . . . . . . . . . . . . . . . . 52
Nitrous Oxide Emissions . . . . . . . . . . . . . . . . . . . . . . . . . . . . . . . . . . . . . . 54

C I T Y O F A S P E N · C A N A R Y I N I T I A T I V E2
IN COMPARISON: KEY FINDINGS AND CASE STUDIES . . . . . . . . . . . . . . . . . . . . . . . . 55
Key Findings . . . . . . . . . . . . . . . . . . . . . . . . . . . . . . . . . . . . . . . . . . . . . 55
Buildings: Electricity, Natural Gas, & Propane . . . . . . . . . . . . . . . . . . . . . . . . . . . 55
Transportation . . . . . . . . . . . . . . . . . . . . . . . . . . . . . . . . . . . . . . . . . . . 55
Other Sources . . . . . . . . . . . . . . . . . . . . . . . . . . . . . . . . . . . . . . . . . . . 55
Case Studies . . . . . . . . . . . . . . . . . . . . . . . . . . . . . . . . . . . . . . . . . . . . . 55
ARE WE ON TRACK? . . . . . . . . . . . . . . . . . . . . . . . . . . . . . . . . . . . . . . . . . . . 58
CONCLUSION . . . . . . . . . . . . . . . . . . . . . . . . . . . . . . . . . . . . . . . . . . . . . . 61
REFERENCES . . . . . . . . . . . . . . . . . . . . . . . . . . . . . . . . . . . . . . . . . . . . . . 63
APPENDIX A: CARBON FACTORS & COEFFICIENTS, CONVERSION FACTORS, NOTES . . . . . . . . 67
APPENDIX B: CONTACTS . . . . . . . . . . . . . . . . . . . . . . . . . . . . . . . . . . . . . . . . 69
APPENDIX C: WORKSHEETS . . . . . . . . . . . . . . . . . . . . . . . . . . . . . . . . . . . . . . 71
FIGURES
Figure ES-1. Aspen emissions 2004 versus 2007 . . . . . . . . . . . . . . . . . . . . . . . . . . . . . . 7
Figure ES-2. Geographic emissions boundary. . . . . . . . . . . . . . . . . . . . . . . . . . . . . . . . 9
Figure ES-3. Major sources 2007. . . . . . . . . . . . . . . . . . . . . . . . . . . . . . . . . . . . . . 10
Figure ES-4. Major sources 2004 versus 2007 . . . . . . . . . . . . . . . . . . . . . . . . . . . . . . . 11
Figure ES-5. Electricity emissions and consumption . . . . . . . . . . . . . . . . . . . . . . . . . . . . 13
Figure ES-6. Air travel 2004 versus 2007 . . . . . . . . . . . . . . . . . . . . . . . . . . . . . . . . . . 13
Figure ES-7. Ground transportation 2004 versus 2007 . . . . . . . . . . . . . . . . . . . . . . . . . . . 14
Figure ES-8. Buildings emissions 2004 versus 2007 . . . . . . . . . . . . . . . . . . . . . . . . . . . . 15
Figure 1. Map of Aspen’s Emissions Inventory Boundary & primary GHG emissions sources . . . . . . . . . 22
Figure 2. Aspen emissions 2004 versus 2007 . . . . . . . . . . . . . . . . . . . . . . . . . . . . . . . 30
Figure 3. Emissions by greenhouse gas 2004 versus 2007 . . . . . . . . . . . . . . . . . . . . . . . . . 31
Figure 4. Major sources 2007 . . . . . . . . . . . . . . . . . . . . . . . . . . . . . . . . . . . . . . . 32
Figure 5. Major sources 2004 versus 2007, subcategories . . . . . . . . . . . . . . . . . . . . . . . . . 32
Figure 6. Cost of energy 2004 versus 2007. . . . . . . . . . . . . . . . . . . . . . . . . . . . . . . . . 33
Figure 7. Buildings emissions 2007 . . . . . . . . . . . . . . . . . . . . . . . . . . . . . . . . . . . . 35

C I T Y O F A S P E N · C A N A R Y I N I T I A T I V E3
Figure 8. Electricity, natural gas, propane emissions 2004 versus 2007 . . . . . . . . . . . . . . . . . . . 36
Figure 9. Electricity emissions and consumption . . . . . . . . . . . . . . . . . . . . . . . . . . . . . . 37
Figure 10. Electricity emissions factors 2004 versus 2007 . . . . . . . . . . . . . . . . . . . . . . . . . 37
Figure 11. Electricity emissions by provider 2004 versus 2007. . . . . . . . . . . . . . . . . . . . . . . . 38
Figure 12. Aspen Electric service territory map . . . . . . . . . . . . . . . . . . . . . . . . . . . . . . . 39
Figure 13. Natural gas consumption 2004 versus 2007 . . . . . . . . . . . . . . . . . . . . . . . . . . . 41
Figure 14. Transportation emissions . . . . . . . . . . . . . . . . . . . . . . . . . . . . . . . . . . . . 42
Figure 15. Ground transportation emissions 2004 versus 2007 . . . . . . . . . . . . . . . . . . . . . . . 42
Figure 16. Air travel emissions 2004 versus 2007. . . . . . . . . . . . . . . . . . . . . . . . . . . . . . 43
Figure 17. Highway 82 and commuting emissions . . . . . . . . . . . . . . . . . . . . . . . . . . . . . 44
Figure 18. Vehicle type survey. . . . . . . . . . . . . . . . . . . . . . . . . . . . . . . . . . . . . . . . 46
Figure 19. Ground transportation 2007. . . . . . . . . . . . . . . . . . . . . . . . . . . . . . . . . . . 47
Figure 20. Air travel and aviation emissions 2007. . . . . . . . . . . . . . . . . . . . . . . . . . . . . . 50
Figure 21. Aspen’s emissions 1998 to 2007. . . . . . . . . . . . . . . . . . . . . . . . . . . . . . . . . 58
Figure 22. Aspen’s emissions 1998 to 2008 and achieving 2050 goal . . . . . . . . . . . . . . . . . . . . 59
TABLES
Table ES-1. Aspen’s GHG emissions 2004 versus 2007 . . . . . . . . . . . . . . . . . . . . . . . . . . . 11
Table 1. Emissions: Included and Excluded. . . . . . . . . . . . . . . . . . . . . . . . . . . . . . . . . 21
Table 2. GHG emissions 2004 versus 2007 . . . . . . . . . . . . . . . . . . . . . . . . . . . . . . . . . 30
Table 3. Consumption: Buildings and Transportation 2004 versus 2007 . . . . . . . . . . . . . . . . . . . 31
Table 4. Total Aspen GHG emissions in 2004 & 2007, 2008 (forecast), and 2020 (Canary target) . . . . . . 60
BOXES
Box 1. Climate change and greenhouse gases . . . . . . . . . . . . . . . . . . . . . . . . . . . . . . . 20
Box 2. Aspen’s “industrial” emissions . . . . . . . . . . . . . . . . . . . . . . . . . . . . . . . . . . . 24
Box 3. Aspen Electric . . . . . . . . . . . . . . . . . . . . . . . . . . . . . . . . . . . . . . . . . . . 40
Box 4. Transportation . . . . . . . . . . . . . . . . . . . . . . . . . . . . . . . . . . . . . . . . . . . 45
Box 5. Methane . . . . . . . . . . . . . . . . . . . . . . . . . . . . . . . . . . . . . . . . . . . . . . 54
Box 6. Municipal buildings . . . . . . . . . . . . . . . . . . . . . . . . . . . . . . . . . . . . . . . . . 56


C I T Y O F A S P E N · C A N A R Y I N I T I A T I V E5
Updating a greenhouse gas inventory is a team effort and requires the contributions of many individuals and
organizations. The City of Aspen’s Canary Initiative would like to thank the following individuals for committing
their time, energy, and support to the production of this greenhouse gas inventory:
Aspen’s Mayor Mick Ireland and the Aspen City Council approved funding and methodology for this report.
The City Council has also been supportive of Aspen’s efforts to de-carbonize its fuel mix for Aspen’s municipal
electric utility.
Rick Heede of Climate Mitigation Services is the chief inventorist of both this 2007 inventory and the City of
Aspen’s 2004 baseline greenhouse gas inventory. His thoroughness, methodology and attention to detail are
greatly appreciated.
Marta Darby with the City of Aspen’s Canary Initiative gathered and analyzed much of the data. She also wrote
much of this report.
Phil Overeynder and John Hines of the City of Aspen’s Public Works and Environmental Initiatives department
provided data on Aspen’s electricity mix and are both tireless champions committed to reducing the carbon
intensity of Aspen’s electricity supply.
Kim Peterson directs the City’s Canary Initiative and helped review and pull the final report together. Lauren McDonell also helped with the data gathering. Lee Ledesma of the City’s Public Works Department helped make
all the financial pieces work and made sure everybody got paid.
John Katzenberger of the Aspen Global Change Institute reviewed the final report and methodology.
Jennifer Perez of Open Window Design provided graphic design services to produce the final report.
Jim Elwood of the Aspen/Pitkin County Airport educated the team on the airport’s 2006 greenhouse gas inventory
and provided review of this inventory.
Lind Lesmes and Jennifer Perez generated superb graphics.
The following individuals provided data without which this report could not have been produced: Dan Blankenship and Kenny Osier (RFTA), Fred Brooks, Mark McKeller and Diana Sirko (Aspen School District), Dylan Hoffman,
Ellen Anderson and Timothy Knight (Pitkin County), Ellie Nieslanik (Valley Co-op), Landon Dean (T-Lazy Seven
Ranch), Matt Hamilton (Aspen Skiing Company), Craig Harvey (EPA’s National Vehicle and Fuel Emissions Lab),
John Kreuger, Steve Aitken, Bridgette Kelly, and Brian Flynn (City of Aspen), David Ulane and Stephen P. Schultz (Aspen/Pitkin County Airport), Steve Casey and Craig Tate (Holy Cross Energy), Jill Jones (Municipal
Energy Agency of Nebraska), Natalie Shelbourn and Jerrad Hammer (Source Gas), Bart Levine (AM Gas), Jeff Grebe (MecTric Engineering), Tad Peed (AmeriGas), Tom McBrayer (Cross Prone & Supply Propane Services),
Chris Hoofnagle (Pitkin County Landfill), Dr. Jean Bogner (Landfills + Inc.), Tracy Dillingham (Aspen Sanitation District),
Scott Miller (Maroon Creek Club), and John Schied and Jeffrey E. Bowick (Aspen Valley Hospital).
Thanks also to the volunteers who assisted with the August 2008 traffic count: Aaron Reed, John Krueger, CJ Oliver, Kim Peterson, John Eisler, Jannette Whitcomb, Ashley Cantrell, Ada Christensen, and Marta Darby.

C I T Y O F A S P E N · C A N A R Y I N I T I A T I V E7
The Aspen Greenhouse Gas Emissions Inventory, 2007 is the first update to Aspen’s 2004 baseline emissions
inventory,1 providing insight into the impacts of reduction measures taken since 2004 and suggesting what
actions we must take to further reduce emissions. The report examines emission trends in various sectors, and
assesses whether emission reduction gains to date are on track to meet the City’s 30 percent emission reduction
target for 2020. Identifying the results of past actions enables the Aspen community to determine what next steps
must be taken to further mitigate climate change.
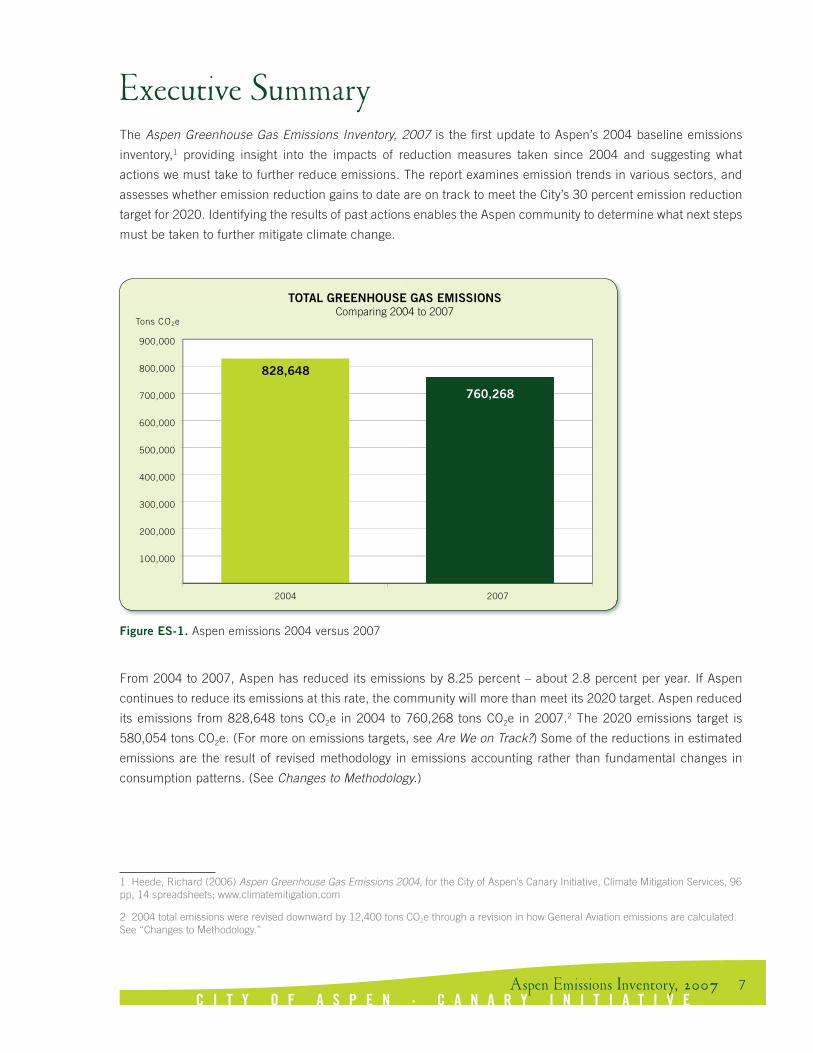
From 2004 to 2007, Aspen has reduced its emissions by 8.25 percent – about 2.8 percent per year. If Aspen
continues to reduce its emissions at this rate, the community will more than meet its 2020 target. Aspen reduced
its emissions from 828,648 tons CO2e in 2004 to 760,268 tons CO2e in 2007.2 The 2020 emissions target is
580,054 tons CO2e. (For more on emissions targets, see Are We on Track?) Some of the reductions in estimated
emissions are the result of revised methodology in emissions accounting rather than fundamental changes in
consumption patterns. (See Changes to Methodology.)
1 Heede, Richard (2006) Aspen Greenhouse Gas Emissions 2004, for the City of Aspen’s Canary Initiative, Climate Mitigation Services, 96 pp, 14 spreadsheets; www.climatemitigation.com
2 2004 total emissions were revised downward by 12,400 tons CO2e through a revision in how General Aviation emissions are calculated. See “Changes to Methodology.”
TOTAL GREENHOUSE GAS EMISSIONSComparing 2004 to 2007
Tons CO2e
900,000
800,000
700,000
600,000
500,000
400,000
300,000
200,000
100,000
20072004
828,648
760,268
Figure ES-1. Aspen emissions 2004 versus 2007

C I T Y O F A S P E N · C A N A R Y I N I T I A T I V E8
Aspen has reduced its emissions in nearly every category – buildings and facilities, commuting and ground
transportation, air travel and general aviation – except for the County Landfill’s methane emissions, a result of
better data on such fugitive emissions becoming available in 2007.
Policies alone do not drive emissions reductions. The cost of energy also affects consumption. For example, when
gasoline costs increase, more people ride the bus. The data reflects this trend in the increase in bus ridership and
decrease in traffic. While fuel use and emissions associated with Roaring Fork Transportation Authority (RFTA)
buses go up, fuel use and emissions associated with commuting go down – decreasing more than that of RFTA’s
emissions increase.
Each of the three sectors (Transportation, Buildings, and Other Sources) is broken down to provide a more
detailed analysis. For example the Transportation sector, is broken into Ground Transportation and Air Travel,
both of which are sub-categorized further. The Buildings sector is divided according to zoning type: commercial,
residential, and municipal; as well as utility type: electricity, natural gas, and propane.
SCOPE AND EMISSIONS BOUNDARY
The scope of the update captures what Aspen’s community is responsible for directly, as well as the most
important indirect emissions sources that are attributable to the activities, buildings, and people of Aspen.
It follows the same protocol established in the 2004 baseline. In short, the 2007 inventory defines the carbon
footprint reasonably attributable to Aspen’s physical, cultural, and economic existence and the progress made
toward reducing emissions.
The 2007 update encompasses the same area analyzed in the 2004 baseline – all emissions sources within the
Emissions Inventory Boundary (EIB). Geographically, the boundary extends beyond the Aspen city limits to include
adjacent areas, such as Mountain Valley, Starwood, Red Mountain, the Aspen Airport Business Center, and others
that are tied closely to Aspen (Figure ES-2). Conceptually, the EIB includes sources such as energy use (natural
gas, propane, and electricity) from both residential and commercial buildings, including the indirect emissions
from such sources as coal-burning power plants that generate electricity for Aspen; road travel emissions from
commercial and personal vehicles; emissions from the Pitkin County Solid Waste Center; emissions from the
Aspen Skiing Company (excluding Snowmass); and emissions from air travel to and from Aspen and general
aviation aircraft that land and depart from the Aspen Pitkin County Airport, as well as commercial air travel at
nearby airports. (For more on inclusions and exclusions, see Purpose, Scope, & Emissions Boundary.)

C I T Y O F A S P E N · C A N A R Y I N I T I A T I V E9
82
AspenSki Area
ButtermilkSki Area
AspenHighlandsSki Area
Whitehorse Springs& Starwood
AirportBusiness Center
North 40
Highway 82Traffic
MountainValley
AspenSchoolDistrict
AspenValley Hospital
Pitkin CountyLandfill
RFTA
Pitkin CountyAirport & Air Travel
Emissions Inventory Area
City of Aspen Boundary
Ski Area Boundary
EMISSIONS INVENTORY MAP
ALSO INCLUDED
Natural Gas UsePropane Use
Electricity UseIn-Town Vehicle Traffic
Aspen-Related RFTA Bus Trips
Figure ES-2. Geographic emissions boundary

C I T Y O F A S P E N · C A N A R Y I N I T I A T I V E10
RESULTS
The amount of greenhouse gas emissions in and attributable to the Aspen-area in 2007 is 760,268 tons of
carbon dioxide equivalent (CO2e),3 down 8.25 percent from the 2004 baseline total of 828,648 tons CO2e and an
emissions decrease of 68,380 tons CO2e – a decline equivalent to the emissions of 2,680 average Aspen homes
(Figure ES-1).4 While Aspen’s total emissions decreased, consumption of electricity increased by 9.8 percent
and natural gas consumption increased by 3.7 percent. Aspen’s total energy use dropped by 5.5 percent from
2004 to 2007, largely a result of the decrease in fuel consumption in the Transportation sector.
The decrease in emissions is largely the result of the increase in the non-carbon fraction of the City of Aspen
Electric energy portfolio, up 28.6 percent over 2004, and the significant decrease in Air Travel & Aviation
emissions, down 16.7 percent from 2004. Nearly all of Aspen’s emissions are carbon dioxide resulting from the
combustion of fossil fuels (95.7 percent), with the remaining 4.3 percent arising from methane (primarily from
the landfill) and nitrous-oxide gases from fertilizers.
3 Equivalent carbon dioxide (CO2e) is a standard unit of measure used to account for the global warming potential of a mix of greenhouse gases, including carbon dioxide and methane.
4 The average Aspen home emits 25.51 tons CO2e per year, according the Sopris Foundation’s 2007 report, Anybody Home?: Energy Consumption and Carbon Emissions from Second Homes in Aspen. The value is based on 2004 data and includes condos, duplexes/ triplexes, multifamily, and single-family homes.
MAJOR SOURCES OF EMISSIONS2007
Air Travel & Aviation36.4%
Ground Transportation26.8%
Natural Gas & Propane14.0%
Electricity20.6%
Landfill2.2% Nitrous Oxide
0.05%
Figure ES-3. Major sources 2007

C I T Y O F A S P E N · C A N A R Y I N I T I A T I V E11
The Inventory reflects everyday actions such as lighting homes and driving to the store. Of the three sectors
– Buildings, Transportation, and Other Sources – the Transportation sector contributes the most to Aspen’s
emissions (63.2 percent), as it did in the 2004 baseline inventory (65.6 percent) (Figure ES-3).
Source 2004 (tons CO2 ) 2007 (tons CO2 ) ChangeBuildings -4.0% Electricity 166,557 156,392 -6.1%
Natural gas & propane 106,768 106,084 -0.6%
Transportation -11.6%
Ground transportation 211,175 203,471 3.6%
Air travel: commercial 186,631 147,370 -21.0%
Air travel: general aviation 145,616 129,537 -11.0%
Other
Landfill & nitrous oxide 11,902 17,414 46.3%
Total 828,648 760,268 -8.3%
Greenhouse Gas Emissions Sources: 2004 vs. 2007
e e
Table ES-1. Aspen’s GHG emissions 2004 versus 2007
Note: 2004 General Aviation emissions revised from 157,856 to 145,616 tons CO2e and Aspen’s total emissions from 840,888 to 828,648 tons CO2e.
MAJOR EMISSIONS SOURCESComparing 2004 to 2007
Tons CO2e
180,000
160,000
140,000
120,000
100,000
80,000
60,000
40,000
20,000
2004
2007
LandfillMethane
GA: JetsAir Travelvia OtherAirports
Air Travelvia Aspen
TouristDriving
AroundTown
CommutingNaturalGas
Electricity
Figure ES-4. Major sources 2004 versus 2007

C I T Y O F A S P E N · C A N A R Y I N I T I A T I V E12
Emissions decreased in both the Transportation and Building Sectors – the two sectors that contribute the most
to emissions in Aspen. Emissions from the Transportation sector decreased by 11.6 percent; emissions from the
Buildings sector dropped by 4.0 percent; and emissions from Other Sources (landfill and nitrous oxide) increased
by 46.3 percent (Table ES-1, Figure ES-4). Other Sources plays the smallest role in Aspen’s overall emissions
at 2.3 percent of the total.
Of the six main categories analyzed in the emissions inventory – Electricity, Natural Gas & Propane,
Ground Transportation, Air Travel & Aviation, Landfill, and Nitrous Oxide Sources – Air Travel & Aviation
contributed the most to Aspen’s total emissions at 36.4 percent (40.1 percent in 2004), followed by
Ground Transportation at 26.8 percent (25.5 percent in 2004), and Electricity at 20.6 percent (20.1 percent in
2004) (Figure ES-3, Table ES-1).
From 2004 to 2007, the largest emission decreases were in the Electricity and Air Travel categories, with
smaller emission decreases from ground transportation and natural gas and propane use. While electric
emissions decreased (down 6.1 percent), electric consumption rose 9.8 percent from 2004 to 2007
(Figure ES-4).
The electric emissions decrease relative to its consumption increase is a result of the greening of the City of Aspen
Electric portfolio, which rose from 35.7 percent to 65.8 percent renewable (44.2 percent to 72.7 percent non-
carbon).5 The increase in Aspen Electric’s non-carbon portion of its fuel mix resulted in a significant decrease in
the utility’s carbon factor, thus resulting in fewer emissions per kilowatt hour of electricity consumed. Holy Cross
Energy’s carbon factor also decreased from 2004 to 2007.
Aspen Electric customers increased their electric use by 2.9 percent. Despite Aspen Electric customer’s increase
in consumption, their associated electric emissions decreased 51.5 percent, a result of the considerable increase
in the utility’s non-carbon sources of energy. Holy Cross customers increased their electric consumption by 12.8
percent. Emissions attributed to Holy Cross electricity use increased by 8.1 percent (Figure ES-5).
Air travel and aviation emissions decreased by 16.7 percent from 2004 to 2007, with notable drops in aviation
in and out of the Aspen-Pitkin County Airport. Commercial air travel emissions via Aspen decreased by 22.8
percent, by 16.0 percent via other regional airports, and private aviation jets and turboprops decreased by
11.0 percent (combined). Air Travel fuel consumption dropped by 16.6 percent (Figure ES-6). Contributing to
the decrease in emissions is the change in methodology used to calculate commercial air travel emissions (see
Updates to Air Travel & Aviation Methodology).6 Also contributing to the emissions decrease was the two-month
closure of the Aspen-Pitkin County Airport from April 9 to June 7, 2007.
5 Renewable energy sources include hydropower and wind. Non-carbon sources include nuclear, hydropower, and wind.
6 Some of the emissions reductions from Air Travel and General Aviation (personal and business jets and turboprops) arise from improved accounting methods, and some reductions reflect decreased passenger air travel or fewer general aviation jets landing at Aspen in 2007 compared to 2004. Also, the airlines improved their average load factor (the percentage of occupied seats), which reduced the emission factor per passenger-mile flown by Aspen’s 361,262 arriving and departing passengers.

C I T Y O F A S P E N · C A N A R Y I N I T I A T I V E13
9.1% Aspen Electric:
Residential 1.8%
Aspen Electric:Municipal
15.0% Aspen Electric:
Commercial
40.4% Holy Cross: Residential
31.4% Holy Cross:Commercial
10
20
30
40
50
60
70
80
90
20,000 40,000 80,000 100,000 120,000
Thou
sand
s of
Ton
s CO
2e
Megawatt Hours
60,000
ELECTRICITY EMISSIONS BY COMPANY AND SECTOR, 2007
Figure ES-5. Electricity emissions and consumption, 2007. The area of each circle represents the carbon footprint of each utility’s end-use sector.
AIR TRAVEL AND AVIATION EMISSIONSComparing 2004 to 2007
Tons CO2e
160,000
140,000
120,000
100,000
80,000
60,000
40,000
20,000
2004
2007
GA: Air Ambulance
GA:Piston
GA:Turboprops
GA: JetsAir Travelvia OtherAirports
Air Travelvia Aspen
Figure ES-6. Air travel 2004 versus 2007

C I T Y O F A S P E N · C A N A R Y I N I T I A T I V E14
Transportation: Ground Travel & Air Travel
Greenhouse gas emissions from the Transportation sector arise from the combustion of gasoline, diesel, jet fuel,
and aviation gasoline.
Emissions from the Transportation sector represent 63.2 percent of Aspen’s total emissions. The 2007 inventory
indicates an 11.6 percent decrease in Transportation sector emissions over 2004, representing an emissions
decrease of 63,044 tons CO2e – the equivalent of 2,470 average Aspen homes. Fuel consumption also decreased
by 12.2 percent, corresponding to a drop in fuel use of 6.5 million gallons.
The Transportation sector is divided into two categories: Ground Transportation and Air Travel & Aviation.
Ground transportation emissions comprise 42.4 percent of the total emissions from the Transportation sector
(26.8 percent of Aspen’s total) (Figure ES-7); air travel and aviation emissions comprise 57.6 percent of the
sector’s total (36.4 percent of Aspen’s total) (Figure ES-6).7
From 2004 to 2007, ground transportation emissions decreased 3.6 percent, an emissions savings of about
7,700 tons CO2e. Air travel and aviation emissions decreased by 16.7 percent, reducing emissions by
55,340 tons CO2e from 2004.
7 Because air travel is an integral part of Aspen’s economy, both legs of air travel were included, as was done in the 2004 baseline inventory.
MAJOR GROUND TRANSPORTATION EMISSIONSComparing 2004 to 2007
Tons CO2e
140,000
120,000
100,000
80,000
60,000
40,000
20,000
SkiCoDiesel & Gasoline
RFTATourist DrivingAround TownCommuting
Figure ES-7. Ground transportation 2004 versus 2007

C I T Y O F A S P E N · C A N A R Y I N I T I A T I V E15
Buildings: Electricity, Natural Gas, & Propane
Greenhouse gas emissions from the Buildings sector come from the generation of electricity and the burning
of natural gas and propane for heat. Energy use in buildings and facilities accounts for 34.5 percent of Aspen’s
emissions. From 2004 to 2007, emissions from buildings dropped by 4.0 percent – an emissions savings of
10,849 tons CO2e – roughly equal to 425 average Aspen homes.
The Buildings sector is divided into two categories: Electricity and Natural Gas & Propane. Electricity contributes
the most to emissions from the Buildings sector at 59.6 percent (20.6 percent of Aspen’s total emissions).
Natural gas and propane comprise 40.4 percent of emissions from the sector (14.0 percent of Aspen’s total
emissions) (Figure ES-8).
The Buildings sector also is subdivided into building type: Residential and Commercial & Municipal. Both of the
categories contribute roughly equally to Aspen’s emissions (Figure ES-5).8 This trend is consistent with that of
the 2004 baseline inventory.9
8 Residential buildings consumed 113 million kWh of electricity in 2007 (83,696 tons CO2e) and 957 billion cubic feet (Bcf) of natural gas (52,599 tons CO2e). Commercial & Municipal buildings consumed 111 million kWh of electricity (72,696 tons CO2e) and 927 Bcf of natural gas (50,965 tons CO2e). Commercial Municipal includes electricity used for street lighting, ski lifts, runway lighting, and wastewater treatment.
9 In the 2004 baseline, natural gas provider Kinder Morgan (now SourceGas) assumed that natural gas for consumed for both the Residential and Commercial & Municipal categories was equal. For the 2007 inventory, Source Gas did not make the 50-50 assumption, and instead provided usage figures for both categories. AM Gas also supplies natural gas to commercial customers. As a result, in 2004 Commercial & Municipal buildings were responsible for 60 percent of the emissions associated with natural gas. In 2007, natural gas emissions were 50.8 percent residential and 49.2 percent commercial and institutional. In 2004, electric consumption and emissions were roughly equal between the two building types.
Tons CO2e
ELECTRICITY, NATURAL GAS, AND PROPANE EMISSIONSComparing 2004 to 2007
160,000
140,000
120,000
100,000
80,000
60,000
40,000
20,000
Aspen Electric AM Gas Propane VendorsHoly Cross SourceGas
2004
2007
Figure ES-8. Buildings emissions 2004 versus 2007

C I T Y O F A S P E N · C A N A R Y I N I T I A T I V E16
Other Sources
Emissions from the Pitkin County Solid Waste Center and sources of nitrous oxide contributed the least to
greenhouse gas emissions in 2007, consistent with the 2004 baseline inventory.
Landfill. Landfill emissions consider the energy used onsite and fugitive methane emissions from the breakdown
of the buried wastes. Landfill emissions contribute to 2.2 percent of Aspen’s total. From 2004 to 2007, landfill
emissions increased by 47.5 percent, representing an emissions increase of 5,495 tons CO2e – the equivalent of
215 Aspen homes. Electricity usage, diesel and gasoline consumption, and methane all contributed to the rise
in emissions, with fugitive methane emissions increasing the most over 2004 (up 47.6 percent, 5,468 more tons
CO2e), a result of a 47.5 percent increase in the total amount of fugitive methane produced at the landfill. The
increase in methane emissions can be attributed to a better estimate of methane generation and leakage, based
on a 2007 report.10
Nitrous oxide. Nitrous-oxide emissions arise from nitrogen-based fertilizers applied to City- and privately-owned
golf courses, athletic fields, parks, and backyards. They account for 0.05 percent of Aspen’s emissions. From
2004 to 2007, nitrous oxide emissions rose by 5.4 percent, up 17 tons CO2e.
Although the amount of nitrous oxide applied is relatively small, its effect as a greenhouse gas is 296 times
stronger than carbon dioxide.
REDUCTION EFFORTS: IN REVIEW
Since 2004, a number of steps have been taken to reduce Aspen’s greenhouse gas emissions. Of the actions
adopted since the 2004 inventory, increasing the renewable portfolio of the City’s electric utility and enhancing
mass-transit options have had the greatest impact on reducing emissions.
Increasing the City of Aspen Electric’s energy portfolio to 72.7 percent non-carbon in 2007 (up from 44.2 percent in 2004).
Result: Decrease in emissions associated with Aspen Electric, despite the increase in electric consumption.
In the absence of the strides made toward a more renewable power supply, emissions associated with
Aspen Electric would have increased by 4 percent to 41,350 tons CO2e instead of declining to 19,298
tons CO2e.
Increasing ridership on RFTA’s buses to 2.79 million riders using city shuttles, Music Associates of Aspen and skier buses, as well as valley routes. RFTA also increased its fleet of hybrid buses to 11.
Result: While emissions attributed to RFTA increased from 2004 to 2007, the service “saves” emissions by
keeping bus riders from using personal vehicles. RFTA saves an estimated 961,000 gallons of gasoline
and keeps 9,416 tons CO2e from being emitted.
10 Golder Associates (2007) Landfill Gas Evaluation of the Pitkin County Solid Waste Center, Lakewood CO, 41 p., www.golder.com

C I T Y O F A S P E N · C A N A R Y I N I T I A T I V E17
CONCLUSION
Since 2004, Aspen’s emissions have decreased by 8.25 percent, largely thanks to the greening of the City of
Aspen’s municipal electric utility and the significant decrease in Air Travel & Aviation emissions. Despite the
decrease in electric emissions, electric consumption increased by 9.8 percent (2.9 percent for Aspen Electric
and 13 percent for Holy Cross Energy).
The two main drivers of reduced air travel emissions are the change to the commercial air travel load factor
calculation and, to a smaller extent, the two-month closure of the Aspen-Pitkin County Airport. While neither
of these factors represents a real reduction in air travel attributable to our community, emissions decreased
substantially.
So far, we are on track as a community to meet our greenhouse gas reductions goals. However, some of the
“low-hanging fruit” has already been picked. Early indications using QuickTracker data from 2008 reveal that
emissions are likely to increase 1.9 percent from 2007, largely as a result of increased air travel.11
Meeting our community-wide 2020 goals will require deliberate and committed action from Aspen’s residents,
visitors, businesses, government, and events to substantially reduce that portion of the energy they consume
from carbon based sources. Electricity and natural gas usage must decline rather than rise and the electric
utilities serving the Aspen-area must continue to expand their renewable-energy portfolios. Residents and visitors
also must utilize mass transit with even greater frequency. RFTA’s service expansion plans are poised to meet a
significant increase in demand. Finally, until viable biofuels are developed for aviation and the carbon intensity of
air travel can be mitigated, aviation emissions will likely remain high.
The City of Aspen, through de-carbonizing its electric utility, and RFTA, for its extensive transit network, have
led our community toward a decrease in emissions. Now it’s time to take the next steps – reducing consumer
demand for energy through abundant and profitable energy efficiency measures and continuing to add more
clean energy sources.
11 The QuickTracker is an emissions calculation tool that provides an estimate of emissions based on traffic counts, new building, and air travel.


C I T Y O F A S P E N · C A N A R Y I N I T I A T I V E19
PURPOSE
In March 2005, the Aspen City Council passed a resolution creating the Canary Initiative and directing the City
Manager to “establish a greenhouse gas (GHG) emission inventory for the City of Aspen that quantifies GHG
emissions and is capable of tracking progress or lack of progress quantitatively in reducing emissions for all
sectors of the Aspen economy.”12 In 2006, the first Aspen-area emissions inventory was completed, establishing
a baseline with 2004 data.
This inventory, based on 2007 data, is the first update to the 2004 baseline emissions inventory. It seeks to
answer two questions: How has the carbon footprint attributable to Aspen’s physical, cultural, and economic
existence changed from 2004 to 2007, and what are the primary drivers of those changes?
The 2007 update follows the same methodology as the 2004 baseline and is fully documented with respect to
sources and methods so that future inventories can accurately assess progress or regress in reducing emissions.
The complete core set of 16 spreadsheets (Appendix C) details the methods and results for each emissions
source as well as the data, calculations, caveats, formulas, and assumptions used in the Aspen Greenhouse Gas
Emissions Inventory, 2007.
SCOPE
The first inventory of Aspen’s citywide greenhouse emissions was conducted for 2004. The scope and boundary
of the 2007 inventory follows the same guidelines established during the 2004 baseline. While the inventory is
comprehensive, not all emissions sources are considered (Table 1).
12 The resolution states, in part “Therefore: […] 6. Establish a greenhouse gas (GHG) emission inventory for the City of Aspen that quantifies GHG emissions and is capable of tracking progress or lack of progress quantitatively in reducing emissions for all sectors of the Aspen economy. Said emission inventory shall be of sufficient quality, at a minimum, to qualify for consideration by the Chicago Climate Exchange membership and participation. 7. Establish, with the assistance of the Aspen Global Warming Alliance, periodic GHG reduction goals for the City of Aspen, and various sectors of the community. 12. Prepare and present for City Council consideration, a plan to reduce GHG emissions from transportation and vehicular traffic in Aspen. 13. Prepare appropriate legislation for City Council consideration that would reduce energy consumption in multi-family and commercial buildings in the City of Aspen. 14. Establish a comprehensive, aggressive and sustained public awareness campaign on global warming for the Aspen-area that is readily capable of duplication for other regions of the state or country. The public awareness campaign shall, at a minimum, include the publication and distribution of educational materials explaining the reason for the City’s adoption of the Canary Initiative, an objective explanation of the global warming phenomenon, and an objective recitation of the potential threat of climate change to the Aspen economy and way of life.”
C I T Y O F A S P E N · C A N A R Y I N I T I A T I V E20
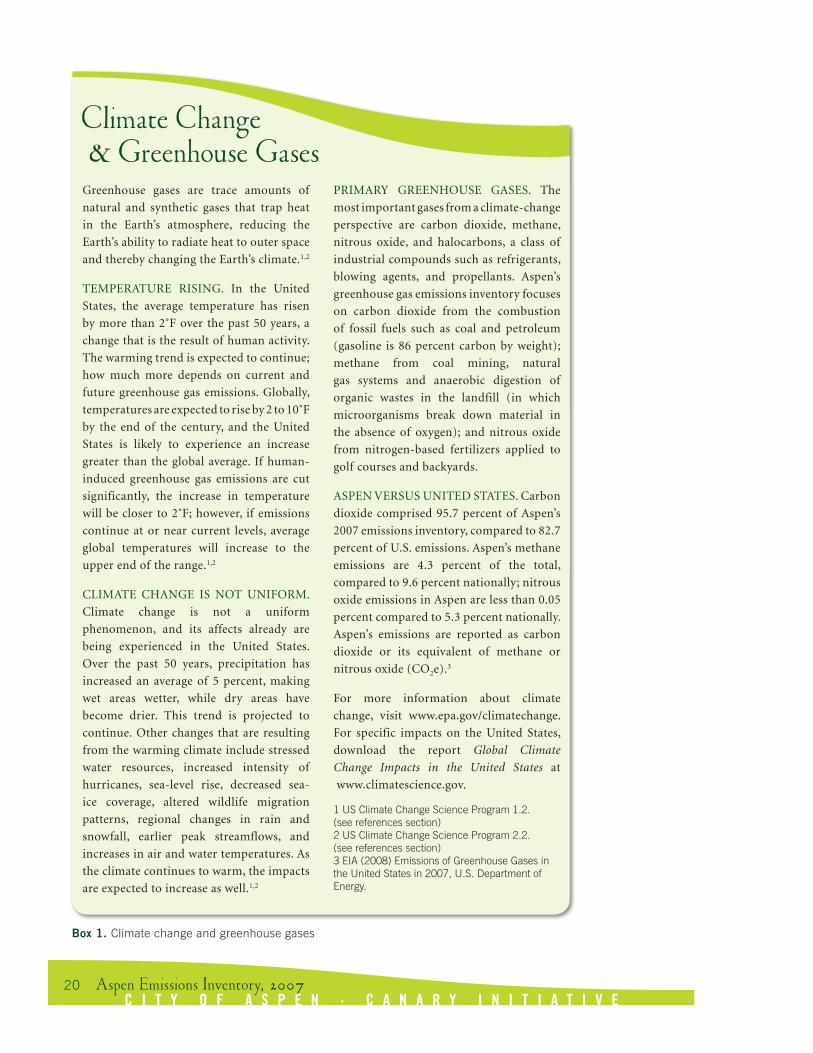
Greenhouse gases are trace amounts of natural and synthetic gases that trap heat in the Earth’s atmosphere, reducing the Earth’s ability to radiate heat to outer space and thereby changing the Earth’s climate.1,2
TEMPERATURE RISING. In the United States, the average temperature has risen by more than 2˚F over the past 50 years, a change that is the result of human activity. The warming trend is expected to continue; how much more depends on current and future greenhouse gas emissions. Globally, temperatures are expected to rise by 2 to 10˚F by the end of the century, and the United States is likely to experience an increase greater than the global average. If human-induced greenhouse gas emissions are cut significantly, the increase in temperature will be closer to 2˚F; however, if emissions continue at or near current levels, average global temperatures will increase to the upper end of the range.1,2
CLIMATE CHANGE IS NOT UNIFORM. Climate change is not a uniform phenomenon, and its affects already are being experienced in the United States. Over the past 50 years, precipitation has increased an average of 5 percent, making wet areas wetter, while dry areas have become drier. This trend is projected to continue. Other changes that are resulting from the warming climate include stressed water resources, increased intensity of hurricanes, sea-level rise, decreased sea-ice coverage, altered wildlife migration patterns, regional changes in rain and snowfall, earlier peak streamflows, and increases in air and water temperatures. As the climate continues to warm, the impacts are expected to increase as well.1,2
PRIMARY GREENHOUSE GASES. The most important gases from a climate-change perspective are carbon dioxide, methane, nitrous oxide, and halocarbons, a class of industrial compounds such as refrigerants, blowing agents, and propellants. Aspen’s greenhouse gas emissions inventory focuses on carbon dioxide from the combustion of fossil fuels such as coal and petroleum (gasoline is 86 percent carbon by weight); methane from coal mining, natural gas systems and anaerobic digestion of organic wastes in the landfill (in which microorganisms break down material in the absence of oxygen); and nitrous oxide from nitrogen-based fertilizers applied to golf courses and backyards.
ASPEN VERSUS UNITED STATES. Carbon dioxide comprised 95.7 percent of Aspen’s 2007 emissions inventory, compared to 82.7 percent of U.S. emissions. Aspen’s methane emissions are 4.3 percent of the total, compared to 9.6 percent nationally; nitrous oxide emissions in Aspen are less than 0.05 percent compared to 5.3 percent nationally. Aspen’s emissions are reported as carbon dioxide or its equivalent of methane or nitrous oxide (CO2e).3
For more information about climate change, visit www.epa.gov/climatechange. For specific impacts on the United States, download the report Global Climate Change Impacts in the United States at www.climatescience.gov.
1 US Climate Change Science Program 1.2. (see references section)2 US Climate Change Science Program 2.2. (see references section)3 EIA (2008) Emissions of Greenhouse Gases in the United States in 2007, U.S. Department of Energy.
Box 1. Climate change and greenhouse gases

C I T Y O F A S P E N · C A N A R Y I N I T I A T I V E21
Table 1. Emissions: included and excluded
EMISSIONS SOURCES: INCLUDED VERSUS EXCLUDED SOURCES INCLUDED EXCLUDED
CARBON DIOXIDE Buildings Electricity use X Buildings Natural gas use X Buildings Propane use X Transportation Gasoline, diesel fuel use X (eg., in-town driving, tourists, commuting) Transportation Gasoline and diesel fuel use X (snowmobiles, groomers, RFTA, school busses, other) Transportation Jet fuel use, Aspen X (both legs of air travel, commercial and private) Transportation Jet fuel use, other regional airports X (both legs of air travel, commercial) Transportation Aviation gasoline, Aspen (itinerant and local aircraft) X Landfill Electricity use X Landfill Diesel use X Resources (other) Harvesting, processing, transportation of materials X (building materials; agriculture, meat, and beverages; fuel transport) Resources (other) Extraction, harvesting, fabrication, processing, X manufacturing (appliances, vehicles, clothing, fertilizers), Wood burning X
METHANE Buildings Mining coal for power generation, attributed to Aspen X Buildings Drilling for natural gas and propane attributed to Aspen X Landfill Decomposition of organic materials X Resources (other) Harvesting, processing, transportation of materials X (building materials; agriculture, meat, and beverages; fuel transport) Resources (other) Extraction, harvesting, fabrication, processing, X manufacturing (appliances, vehicles, clothing, fertilizers)
NITROUS OXIDE Nitrogen-based fertilizer use X Resources (other) Nonlocal application of fertilizers for use in agriculture X
OTHER Halocarbon and related refrigerants & foam-blowing agents X Radiative forcing from high-altitude jet aircraft operations X

C I T Y O F A S P E N · C A N A R Y I N I T I A T I V E22
EMISSIONS BOUNDARY
Geographic boundary. The geographic boundary is nearly identical to the City of Aspen’s Urban Growth Boundary
(UGB), but also includes Starwood and the White Horse Springs section of the McLain Flats residential areas.
The Emissions Inventory Boundary (EIB) covers the residential areas within and contiguous to the Aspen city
limits such as Red Mountain, Mountain Valley (on the southeastern edge of town), Highlands, Buttermilk West,
the Aspen-Pitkin County Airport, the Aspen Airport Business Center, and North Forty (Figure 1). The EIB also
extends beyond the UGB to include the electricity used to run lifts and facilities on Aspen Mountain, Aspen
Highlands, and Buttermilk ski areas because the base facilities and many lifts are within the EIB. The fuel used
by Aspen Skiing Company’s snowmobiles, snowcats, and other equipment also is included, as is natural gas used
in its buildings and facilities (with the exception of Snowmass).
Figure 1. Map of Aspen’s Emissions Inventory Boundary & primary GHG emissions sources
82
AspenSki Area
ButtermilkSki Area
AspenHighlandsSki Area
Whitehorse Springs& Starwood
AirportBusiness Center
North 40
Highway 82Traffic
MountainValley
AspenSchoolDistrict
AspenValley Hospital
Pitkin CountyLandfill
RFTA
Pitkin CountyAirport & Air Travel
Emissions Inventory Area
City of Aspen Boundary
Ski Area Boundary
EMISSIONS INVENTORY MAP
ALSO INCLUDED
Natural Gas UsePropane Use
Electricity UseIn-Town Vehicle Traffic
Aspen-Related RFTA Bus Trips

C I T Y O F A S P E N · C A N A R Y I N I T I A T I V E23
Conceptual boundary. The conceptual emissions boundary is broader than the geographic boundary, encompassing
emissions within the geographic boundary (direct emissions) as well as those that are attributable to Aspen but
occur elsewhere (indirect emissions).
Direct emissions. Direct emissions considered in the inventory include: carbon-dioxide emissions from
natural gas and propane consumption; carbon dioxide emissions from fuel used for ground transportation
within the boundary; methane emissions from Pitkin County Solid Waste Center; and nitrous oxide
emissions from fertilizers applied to local golf courses, backyards, and athletic fields.
Indirect emissions. Indirect emissions considered in the inventory include: carbon dioxide emissions
from fossil fuels combusted in power plants that supply electric power to Aspen (primarily located in
Colorado), as well as methane emissions from the coal mines supplying those power plants; methane
emissions from leaks associated with the supply of natural gas;13 energy-related emissions from the
Pitkin County Solid Waste Center;14 carbon dioxide emissions from air travel (both coming to and leaving
from Aspen); and carbon dioxide emissions from fuel used for commuting, tourist driving, and RFTA
outside the boundary.
Aspen versus other cities. Aspen’s inventory includes emissions from fuel burned in cars and aircraft that bring
residents and visitors to and from Aspen. It is the first city to include both directions of air and commuting travel
(coming to and leaving from Aspen) in its emissions inventory (Box 2). Aspen’s tourist-based economy depends
on visitors staying in town as well as traveling to Aspen; thus, air- and ground-travel emissions are attributable to
the community.15 Transportation-related fuel and emissions are calculated from points of origin, whether Sydney
or Carbondale, rather than just the emissions that occur within the Aspen area.16
Within the boundary: included emissions. The following emissions sources are included in the inventory, either
because they occur directly within the geographic boundary or indirectly outside the boundary yet are attributable
to the Aspen-area (Table 1). For information regarding how the emissions estimates are made, refer to Changes
to Methodology and the 16 worksheets in Appendix C.
13 An industry-wide fugitive methane emissions rate — from natural gas production, processing, and transportation — is applied to Aspen’s gas consumption. It is not an estimate of SourceGas’s own fugitive emissions, e.g., the pipeline breaks that occur at construction sites, because of system failures, and replacing old pipelines. Such leaks have not, to our knowledge, been quantified. In any case, Aspen is attributed a share of the industry-wide emissions in proportion to Aspens’ consumption of natural gas.
14 Since the landfill receives waste (and recyclables) from within Aspen’s emissions boundary as well as other areas of Pitkin County, we allocate emissions on the basis of estimated materials flow to the landfill originating in Aspen.
15 The emissions are allocated on the basis of arriving and departing passengers who are flying to Aspen (70 percent), excluding the remainder who use the Aspen Pitkin Airport but do not live or are not visiting Aspen, e.g., Snowmass Village, Carbondale, or other local destinations.
16 The Aspen Global Warming Alliance considered attributing half or even zero air travel, commuting, and tourist driving emissions to Aspen — ostensibly to avoid counting emissions that other communities where Aspen-bound workers or visitors live could include if they did their own inventories — but Alliance members concluded that our inventory should include both legs of such travel in order to fully account for Aspen’s impact on the global climate (see Box 2).

C I T Y O F A S P E N · C A N A R Y I N I T I A T I V E24
In brief, the major inventory emissions sources include:
1. Carbon-dioxide emissions from the use of electricity in buildings and facilities within the boundary, plus related methane emissions from mines supplying coal to power plants generating the power consumed in Aspen;
2. Carbon-dioxide emissions from the combustion of natural gas and propane in buildings within the emissions boundary. This includes gas used in residential, commercial, and public buildings
and facilities (e.g., in homes, businesses, schools, government buildings, pools, and heated
driveways);
3. Methane emissions from the U.S. natural gas industry in proportion to the amount of natural gas supplied to Aspen customers by natural gas and propane vendors;
4. Carbon-dioxide emissions from combustion of gasoline and diesel fuel within the boundary, including in-town driving. This includes personal and commercial vehicles, trucks, RFTA buses
serving City routes, school buses, and City and County vehicles such as snowplows and police
cruisers used within Aspen’s emissions boundary;
5. Emissions from fuel used in commuting by Roaring Fork Valley residents who work in Aspen but live downvalley, RFTA’s valley routes, as well as emissions from commercial and industrial vehicle travel (e.g., by plumbers, couriers, and dump trucks on Highway 82);17
6. Emissions from fuel used in ground transportation of tourists and visitors;
17 Vehicle travel and related fuel consumption on Highway 82 inbound or outbound from Aspen is based on traffic counters at Castle Creek Bridge and upon a survey of vehicle types entering Aspen.
Most municipal inventories include emissions from industries and businesses within their boundary. Aspen’s main economic engines – its industries – are tourism and second homeownership, both of which involve a great deal of travel, and thus fuel use and carbon emissions. Tourism and related commerce are fundamental to Aspen’s quality of life and economy.
Visitors who travel by car or commercial or private aircraft are all included in the inventory. Both travel to and from Aspen is included to acknowledge Aspen’s role as a tourist destination. Energy used in all homes, restaurants, hotels, clubs, retail stores, and tourism-related commerce and industry (including the Aspen Skiing Company) is included in the inventory.
ASPEN’S “INDUSTRIAL” EMISSIONS
Box 2. Aspen’s “industrial” emissions

C I T Y O F A S P E N · C A N A R Y I N I T I A T I V E25
7. Emissions from commercial and personal/business aircraft transporting visitors and residents to and from Aspen;
8. Emissions from commercial air travel by visitors and residents bound for or departing from Aspen as well as travelers using other regional airports (Eagle, Grand Junction, and Denver);
9. Emissions from locally-based and itinerant single- and twin-engine piston aircraft;
10. Emissions from fuel used by snowmobiles, groomers, construction and excavation equipment, and miscellaneous gas-powered contraptions (e.g., lawnmowers, snow-blowers, leaf-blowers);
11. Electric- and diesel-consumption emissions at the Pitkin County Solid Waste Center, plus methane emissions released from the decomposition of organic materials buried at the site (apportioned to
Aspen based upon an estimate of the waste originating within the EIB);
12. Nitrous-oxide emissions from the use of nitrogen-based fertilizers (e.g., on golf courses, backyards,
and city parks and athletic fields).
Beyond the boundary: excluded emissions. Like any other town in the United States, Aspen draws resources
and thus energy and emissions from around the world – e.g., cement from Utah, hardwoods from Brazil,
water from Fiji. Aspen’s food-related carbon footprint has a similar global range.18 While Aspen depends on
such resources for its economic vitality and connectivity, emissions from resource extraction and emissions
from fabrication and delivery of these goods and materials are not included in the Aspen Greenhouse Gas
Emissions Inventory, 2007, consistent with the 2004 baseline.19
Emissions sources not attributed to Aspen include:
1. Emissions from harvesting, processing, manufacturing, or transportation of construction materials (e.g., lumber, concrete and cement, steel, copper, marble, ornamental rock, gypsum, insulation
materials, paints and finishes, windows, roofing materials, and tropical woods);
2. Emissions from extraction, harvesting, fabrication, processing, or manufacturing of resources
(e.g., appliances, vehicles, aircraft, backhoes, heating and cooling equipment, water heaters,
snowmobiles, clothing, leather, medical imaging equipment, computers, furnishings, and skis);
3. Emissions from the extraction and production of other manufactured goods and basic materials indirectly supporting Aspen’s economy (e.g., asphalt for road construction20 steel and other metals
used in appliances, vehicles, buildings, and infrastructure; industrial chemicals and petrochemicals
for paints, waxes, cleansers, and lubricants);
18 The average morsel of food travels 1,200 miles from field to table, according to the U.S. Department of Defense (undated) U.S. Agriculture: Potential Vulnerabilities, from Durning, p. 73.
19 A small proportion of the transportation energy and emissions are included for in-valley and in-city delivery only.
20 Sand and gravel for road construction and concrete is produced locally but outside the emissions boundary, i.e., in Carbondale and Woody Creek.
C I T Y O F A S P E N · C A N A R Y I N I T I A T I V E26
4. Emissions from the production of other processed materials (e.g., fertilizers, consumer chemicals,
pharmaceuticals, plastics, glass, newsprint, paper, containers, and packaging);
5. Emissions from the transportation of the foregoing materials, goods, and equipment (often
transported thousands of miles);
6. Emissions from the food and beverage industries (e.g., planting and/or harvesting of basic
agricultural products, vegetables, and fruits; foods and beverages processing; and packaging);
7. Emissions from the meat, fowl, and fish industries (e.g., energy used for ranching, poultry farming,
and fishing to the extent these facilities fall outside the EIB; and energy consumed in energy-
intensive processing, refrigeration, and transportation — often in refrigerated trucks or air freighted
for required freshness);21
8. Methane emissions from the meat, poultry, and agricultural sectors (ruminant animals and animal
manure emit large quantities of methane gas);22
9. Halocarbon and related refrigerants and foam blowing agent emissions;23
10. Nitrous-oxide emissions from agriculture and industry (other than local fertilizer applications);
11. Emissions from the oil and natural gas industries (e.g., exploration, production, transportation,
refining, and delivery of gasoline, diesel, and jet fuel).24 Fugitive methane from the natural gas,
propane, and coal mining/power generation industries are included;
12. Emissions from energy consumption from refineries, carbon-dioxide venting, and flaring in the natural gas industry;
13. Carbon-dioxide emissions from wood burning.25
13. Radiative forcing (CRF) factor from the fuel emissions and vapor trails of aircraft operating at high altitude.
21 Minor parts of the related energy inputs and emissions have been captured in this inventory, e.g., local trucking of foods in transportation, operation of local groceries, and cooking energy in local homes and restaurants. As an indication of the scale of the ignored energy inputs, Durning, p. 69: “The consumer food chain in its entirety uses about 17 percent of all energy; 3 percent for livestock production, 3 percent for other types of agriculture, 6 percent for food processing and packaging, and 5 percent to transport, sell, refrigerate, and cook the food and to wash the dishes afterwards.” Durning, p. 69. The greenhouse gas contribution will be far higher than 17 percent of energy inputs, given the methane and nitrous emissions from the various food chains.
22 Methane gas from animal digestion and wastes contribute 2.5 percent of total U.S. emissions. EIA (2005).
23 Nationally, halocarbons, bromines, sulfur hexafluoride, and related compounds comprise 2.1 percent (U.S. Energy Information Administration) to 11 percent (Heede) of total domestic greenhouse gas emissions. The principal reason for their exclusion is the low incidence of air conditioning in local buildings, but this use is increasing. Also, use of vehicle air conditioning is nearly universal, as are commercial and residential refrigerators and freezers. Most such equipment has slow leaks, and even though it is Federal law to carefully recover chlorofluorocarbons (CFCs) when replacing refrigerants, leakage is common. CMS recommends that halocarbons be included in any update or extension of this inventory.
24 Emissions from exploration, production, transportation, refining, and delivery of gasoline, diesel, and jet fuel adds 19-27 percent to the emissions from their combustion alone (as considered in the inventory). Wang (2001). A life-cycle assessment of gasoline concludes that upstream emissions from gasoline is 27 percent above combustion emissions, and diesel (since the fuel requires less refinery energy) emits 19 percent more; Delucchi (2003).
25 While wood burning is considered a carbon-neutral heating source, CMS recommends that its related emissions be included, at least partially. Wood burning has declined sharply over the last several years, but likely remains a relatively small emissions source (CMS).

C I T Y O F A S P E N · C A N A R Y I N I T I A T I V E27
EMISSIONS SAVINGS: EMISSION REDUCTION MEASURES
Several emission reduction measures have been quantified, most of which are reflected in the emissions
calculations. Such reduction measures include the use of biodiesel by RFTA and the Aspen Skiing Company and
the lower carbon intensity of local electric utilities. Additional savings have been calculated for reference only,
and are not deducted from Aspen’s total emissions. Renewable and non-carbon electricity generation is included
in the emissions calculations for the power sector (see “Electricity carbon factor” worksheet, Appendix C).
Savings resulting from emission-reduction measures have been estimated for RFTA’s public transportation
services and the recycling program at the Pitkin County Solid Waste Center (the same two examples considered
in the 2004 inventory). As in the baseline inventory, the fuel and electricity inputs to RFTA’s bus fleet and to the
Pitkin County Solid Waste Center are included in the inventory.
1. Public transportation. RFTA’s buses reduce vehicle use, thereby lowering overall commuting
emissions. From 2004 to 2007, RFTA’s fuel use and emissions increased 40 percent to 4,395 tons
CO2e, while ridership increased from 2.07 to 2.79 million riders attributed to Aspen routes.26 These
avoided car trips save an estimated 18.4 million vehicle-miles, 0.96 million gallons of fuel, and
9,416 tons CO2e. These savings are not deducted from the inventory since the inventory accounts
for actual emissions from both buses and cars. Increased RFTA emissions are viewed as a “success”
when coupled with decreased vehicle emissions.
2. Recycling and composting. Aspen’s recycling program saves energy and reduces emissions.
Recyclable materials, including glass, metal, newsprint and cardboard, reduce the demand for virgin
forms of these products. The Pitkin County Solid Waste Center’s composting program decreases the
amount of wood, brush, and dirt buried in the landfill, thereby reducing methane emissions. We
estimate that the landfill’s recycling of 5,502 tons of glass, aluminum, paper, newsprint, etc. reduces
emissions by 9,161 tons CO2e. This is estimated to illustrate the climate-related savings from local
recycling efforts, and is not deducted from the inventory. The rate of recycling in the City of Aspen
is about 18 percent.27 These savings are not deducted from the inventory because emissions from
providing the material inputs to Aspen-area consumers are not included in the inventory.
26 A technical improvement was made to the 2007 inventory in data collection for RFTA’s ridership. Interviews with RFTA CEO Dan Blankenship resulted in a higher proportion (71.6 percent in 2007 versus 39.1 percent in 2004) of riders on valley routes attributed to Aspen. RFTA’s increased use of biodiesel (13.4 percent in 2007 versus 5.0 percent in 2004) tempered emissions increases.
27 The recycling rate is the total weight of recycled materials divided by the total weight of recycled materials plus the total amount of waste generated. City of Aspen 2008 Recycling Report, www.aspenpitkin.com/uploads/Final%202008%20report.pdf

C I T Y O F A S P E N · C A N A R Y I N I T I A T I V E28
Aspen also has taken steps to reduce fuel-related transportation emissions by using biodiesel. RFTA and the
Aspen Skiing Company use biodiesel in at least part of their fleets:
1. RFTA’s diesel fuel is 13.4 percent biodiesel when averaged over all of 2007. The carbon coefficient
for RFTA’s diesel fuel is reduced from 22.38 (conventional diesel) to 20.03 pounds CO2 per gallon,
compared to RFTA’s 2004 biodiesel value of 21.51 pounds CO2 per gallon.28
2. Aspen Skiing Company used 20 percent biodiesel in 2007. The company is currently phasing out
the use of biodiesel.29
Aspen has several other programs that significantly reduce emissions. Also in the “savings” category but not
quantified:
1. Local consumer and City of Aspen generation and procurement of renewable sources of electricity
(e.g. solar PV and solar hot water systems).
2. The City and County’s Renewable Energy Mitigation Program (REMP) that invests fees, collected
based on excessive energy use in large homes, in energy-efficiency and renewable-energy measures
in both public and nonprofit projects throughout Pitkin County.
3. Cutting-edge energy building codes promulgated throughout Pitkin County have and continue
to keep thousands of tons coal and natural gas in the ground and thus thousands of tons of
carbon dioxide out of the atmosphere. These savings are not quantified, since we are accounting for
actual and measurable emissions, but a back-of-the-envelope calculation suggests that if Aspen’s
residential and commercial buildings were 20 percent less efficient then the community would emit
on the order of 50,000 tons additional tons CO2e per year – the equivalent of about 1,960 average
Aspen homes.30
4. Everyday actions by residents and business-owners that save fuel in buildings and transportation,
including improving the energy efficiency of their homes and buildings and carpooling or walking to
work.
28 CMS applies the net carbon savings of 78.4 percent from the biodiesel life cycle assessment in National Renewable Energy Laboratory (1998) Life Cycle Inventory of Biodiesel and Petroleum Diesel for Use in an Urban Bus, 314 pp.
29 Aspen Skiing Company website, viewed Apr09.
30 Aspen’s emissions from electricity, natural gas, and propane consumption totaled 262,475 tons CO2e in 2007, nearly all of it in buildings.
C I T Y O F A S P E N · C A N A R Y I N I T I A T I V E29
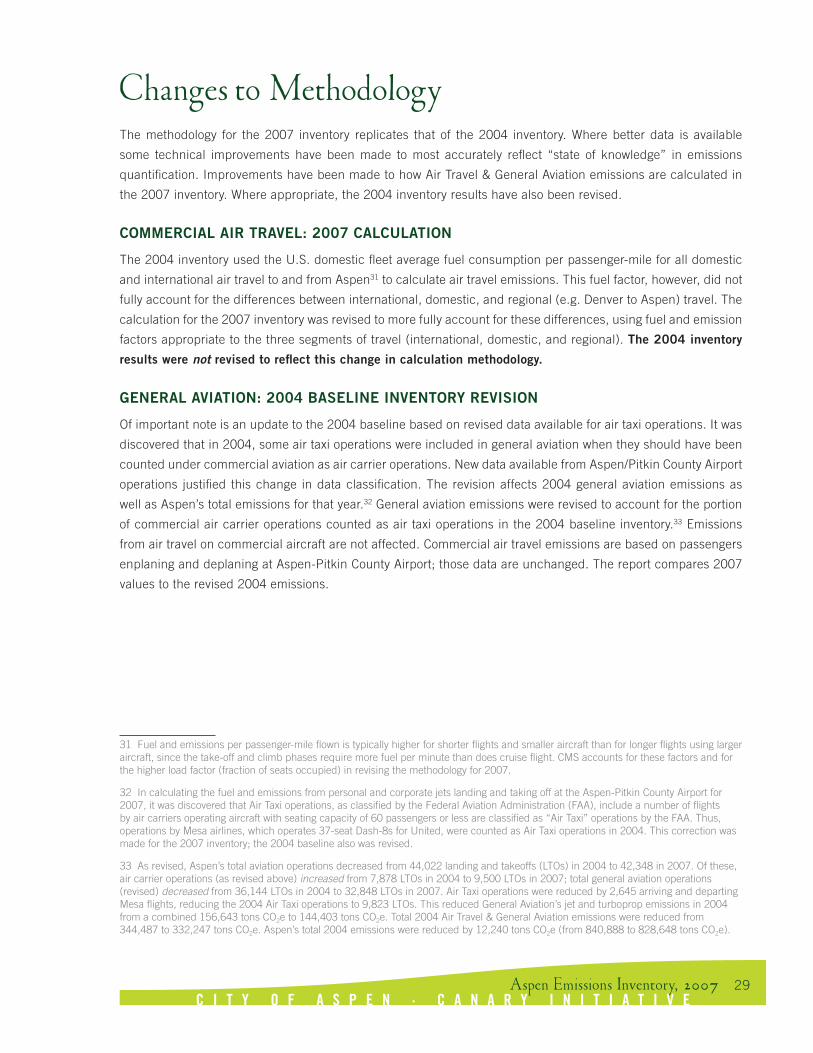
The methodology for the 2007 inventory replicates that of the 2004 inventory. Where better data is available
some technical improvements have been made to most accurately reflect “state of knowledge” in emissions
quantification. Improvements have been made to how Air Travel & General Aviation emissions are calculated in
the 2007 inventory. Where appropriate, the 2004 inventory results have also been revised.
COMMERCIAL AIR TRAVEL: 2007 CALCULATION
The 2004 inventory used the U.S. domestic fleet average fuel consumption per passenger-mile for all domestic
and international air travel to and from Aspen31 to calculate air travel emissions. This fuel factor, however, did not
fully account for the differences between international, domestic, and regional (e.g. Denver to Aspen) travel. The
calculation for the 2007 inventory was revised to more fully account for these differences, using fuel and emission
factors appropriate to the three segments of travel (international, domestic, and regional). The 2004 inventory results were not revised to reflect this change in calculation methodology.
GENERAL AVIATION: 2004 BASELINE INVENTORY REVISION
Of important note is an update to the 2004 baseline based on revised data available for air taxi operations. It was
discovered that in 2004, some air taxi operations were included in general aviation when they should have been
counted under commercial aviation as air carrier operations. New data available from Aspen/Pitkin County Airport
operations justified this change in data classification. The revision affects 2004 general aviation emissions as
well as Aspen’s total emissions for that year.32 General aviation emissions were revised to account for the portion
of commercial air carrier operations counted as air taxi operations in the 2004 baseline inventory.33 Emissions
from air travel on commercial aircraft are not affected. Commercial air travel emissions are based on passengers
enplaning and deplaning at Aspen-Pitkin County Airport; those data are unchanged. The report compares 2007
values to the revised 2004 emissions.
31 Fuel and emissions per passenger-mile flown is typically higher for shorter flights and smaller aircraft than for longer flights using larger aircraft, since the take-off and climb phases require more fuel per minute than does cruise flight. CMS accounts for these factors and for the higher load factor (fraction of seats occupied) in revising the methodology for 2007.
32 In calculating the fuel and emissions from personal and corporate jets landing and taking off at the Aspen-Pitkin County Airport for 2007, it was discovered that Air Taxi operations, as classified by the Federal Aviation Administration (FAA), include a number of flights by air carriers operating aircraft with seating capacity of 60 passengers or less are classified as “Air Taxi” operations by the FAA. Thus, operations by Mesa airlines, which operates 37-seat Dash-8s for United, were counted as Air Taxi operations in 2004. This correction was made for the 2007 inventory; the 2004 baseline also was revised.
33 As revised, Aspen’s total aviation operations decreased from 44,022 landing and takeoffs (LTOs) in 2004 to 42,348 in 2007. Of these, air carrier operations (as revised above) increased from 7,878 LTOs in 2004 to 9,500 LTOs in 2007; total general aviation operations (revised) decreased from 36,144 LTOs in 2004 to 32,848 LTOs in 2007. Air Taxi operations were reduced by 2,645 arriving and departing Mesa flights, reducing the 2004 Air Taxi operations to 9,823 LTOs. This reduced General Aviation’s jet and turboprop emissions in 2004 from a combined 156,643 tons CO2e to 144,403 tons CO2e. Total 2004 Air Travel & General Aviation emissions were reduced from 344,487 to 332,247 tons CO2e. Aspen’s total 2004 emissions were reduced by 12,240 tons CO2e (from 840,888 to 828,648 tons CO2e).

C I T Y O F A S P E N · C A N A R Y I N I T I A T I V E30
In 2007, Aspen’s direct and indirect greenhouse gas emissions totaled 760,268 tons of carbon dioxide-equivalent
(CO2e), a decrease of 8.25 percent over the revised 2004 baseline (Figure 2, Table 2). The majority of emissions
are carbon dioxide (95.7 percent) with the remaining 4.3 percent of emissions from methane and nitrous oxide
(Figure 3). The total includes greenhouse gas emissions from the three major sectors — Buildings, Transportation,
and Other Sources. Calculations, methods, sources, and detailed results are included in the folio of worksheets
in Appendix C.
Figure 2. Aspen emissions 2004 versus 2007
Table 2. GHG emissions 2004 versus 2007
10,000
20,000
30,000
40,000
50,000
60,000
70,000
Tons CO2e
Passenger Cars
(Sedans, Cabriolets)
Small SUVs and
Small Trucks
Medium/LargeSUVs &
Large “Light”Trucks
2-Axle Medium Duty Trucks & RVs
3-Axle Trucks,Dump Trucks
Semis,ComboTrucks
Motor-cycles
TOTAL GREENHOUSE GAS EMISSIONSComparing 2004 to 2007
Tons CO2e
Tons CO2e
ELECTRICITY, NATURAL GAS, AND PROPANE EMISSIONSComparing 2004 to 2007
MAJOR SOURCES OF EMISSIONS2007
AIR TRAVEL AND AVIATION EMISSIONSComparing 2004 to 2007
ELECTRICITY CONSUMPTIONComparing 2004 to 2007
MAJOR EMISSIONS SOURCESComparing 2004 to 2007
MAJOR GROUND TRANSPORTATION EMISSIONSComparing 2004 to 2007
Tons CO2e
Tons CO2e
Tons CO2e
kWh
160,000
140,000
120,000
100,000
80,000
60,000
40,000
20,000
Aspen Electric AM Gas Propane VendorsHoly Cross SourceGas
160,000
140,000
120,000
100,000
80,000
60,000
40,000
20,000
180,000
160,000
140,000
120,000
100,000
80,000
60,000
40,000
20,000
140,000
120,000
100,000
80,000
60,000
40,000
20,000
Aspen Electric Holy Cross
180,000,000
160,000,000
140,000,000
120,000,000
100,000,000
80,000,000
60,000,000
40,000,000
20,000,000
2004
2007
2004
2007
2004
2007
2004
2007
2004
2007
2004
2007
900,000
800,000
700,000
600,000
500,000
400,000
300,000
200,000
100,000
20072004
GA: Air Ambulance
GA:Piston
GA:Turboprops
GA: JetsAir Travelvia OtherAirports
Air Travelvia Aspen
LandfillMethane
GA: JetsAir Travelvia OtherAirports
Air Travelvia Aspen
TouristDriving
AroundTown
CommutingNaturalGas
Electricity
SkiCoDiesel & Gasoline
RFTATourist DrivingAround TownCommuting
Air Travel & Aviation36.4%
Ground Transportation26.8%
Natural Gas & Propane14.0%
9.1% Aspen Electric:
Residential 1.8%
Aspen Electric:Municipal
15.0% Aspen Electric:
Commercial
40.4% Holy Cross: Residential
31.4% Holy Cross:
Commercial
10
20
30
40
50
60
70
80
90
20,000 40,000 80,000 100,000 120,000
Thou
sand
s of
Ton
s CO
2e
Megawatt Hours
60,000
828,648
760,268
Other Sources
Air Travel
Buildings
Commuting
2007
2007
2008
2008
2004
2004
Tons CO2e/yr
Aspen Total EmissionsAir Travel
Buildings
Commuting
Tons CO2e/yr
AIR TRAVEL AND AVIATION, 2007Tons CO2
General Aviation:Air Ambulance
69 tons
Commercial Air Travelvia Regional Airports
41,689 tons
Commercial Air Travelvia Aspen County Airport
105,681 tons
General Aviation:Piston Aircraft
1,039 tons
General Aviation:Turboprops6,147 tons
General Aviation:Jet Aircraft
122,289 tons
ASPEN EMISSIONS: GROUND TRANSPORTATION 2007Tons CO2
2008
2008
ASPEN EMISSIONS: GROUND TRANSPORTATION 2007Tons CO2
Around-Town Driving37,713 tons
Off-Road: SkiCo, Yard Widgets, Construction Equipment
3,339 tons RFTA Buses4,395 tons
Aspen School District371 tons
Commuting, Hwy 82117,242 tons
Pitkin County186 tons
Tourist Road Travel39,211 tons
City of Aspen1,015 tons
VEHICLE TYPE SURVEYAugust 2008
Medium & HeavyTrucks/SUVs
39.1%
Large 2-Axle Trucks2.6%
Large 3-Axle Trucks2.4%
Semis0.7%
Buses (RFTA)1.3%
Motorcycles *0.50.6%
Passenger Cars26.8%
Light Trucks and SUVs26.5%
2004
2007
HIGHWAY 82 AND COMMUTING EMISSIONSComparing 2004 to 2007
2004
2007
GROUND TRANSPORTATIONComparing 2004 to 2007
ASPEN BUILDING EMISSIONS, 2007Gallonsof Fuel
14,000,000
12,000,000
10,000,000
8,000,000
6,000,000
4,000,000
2,000,000
Off-RoadFuel
SkiCoDiesel& Gas
RFTATouristDriving
AroundTown
Commuting
ASPEN’S MAJOR AIR AND GROUND TRANSPORTATION EMISSIONS2007 COST OF ENERGY
Comparing 2004 to 2007140,000
120,000
100,000
80,000
60,000
40,000
20,000
Tons CO2e/yr
GeneralAviation(Jets)
CommercialAir Travelvia Aspen
CommercialAir Travelvia OtherAirports
Commutingvia Hwy 82
Around-TownDriving
TouristRoad Travel
To/From Aspen
Mcf
1,600,000
1,400,000
1,200,000
1,000,000
800,000
600,000
400,000
200,000
AM GasSourceGas
Aspen Electric Carbon Dioxide Methane Nitrous OxideHoly Cross
ELECTRICITY EMISSIONSComparing 2004 to 2007
NATURAL GAS CONSUMPTIONComparing 2004 to 2007
EMISSIONS BY GREENHOUSE GASComparing 2004 to 2007
ASPEN EMISSIONS: MAJOR SOURCES, 2007Tons CO2e
Tons CO2e
160,000
140,000
120,000
100,000
80,000
60,000
40,000
20,000
Tons CO2e
160,000
140,000
120,000
100,000
80,000
60,000
40,000
20,000
Aspen Electric AM Gas Propane VendorsHoly Cross SourceGas
19,298 21,214
137,094
82,350
2,506
2004
2007
Electricity Natural Gas Propane GroundTransportation
Aviation
$90,000,000
$80,000,000
$70,000,000
$60,000,000
$50,000,000
$40,000,000
$30,000,000
$20,000,000
$10,000,000
General Aviation129,537 tons
Commercial Air Travel147,370 tons
All GroundTransportation203,471 tons
Natural Gas andPropane
106,070 tons
Electricity156,392 tons
Landfill and N2O17,414 tons
Tons CO2e
900,000
800,000
700,000
600,000
500,000
400,000
300,000
200,000
100,000
ELECTRICITY EMISSIONS BY COMPANY AND SECTOR, 2007
1998 20302026
Aspen’s 2020 Target:580,054 tons CO2e
20182014201020062002 20342022 20462042 20502038
Aspen’s 2050 Target:165,730 tons CO2e
ELECTRICITY EMISSION FACTORSComparing 2004 to 2007
1.26
1.791.72
0.60
Aspen Electric Holy Cross
2004
2007
lbs CO2e/kWhdel ivered
Electricity20.6%
Landfill2.2% Nitrous Oxide
0.05%
1998 2006200520032002200120001999
900,000
800,000
700,000
600,000
500,000
400,000
300,000
200,000
100,000
ASPEN’S QUICKTRACKER SOURCES AND TOTAL EMISSIONS1998 to 2008
900,000
800,000
700,000
600,000
500,000
400,000
300,000
200,000
100,000
ASPEN’S TOTAL EMISSIONS1998 to 2050
Commercial Air Travelvia Aspen County Airport
105,681 tons
General Aviation:Jet Aircraft
122,289 tons
Passenger Cars26.8%
-
40,000
20,000
00,000
80,000
60,000
40,000
20,000
$9
$8
$7
$6
$5
$4
$3
$2
-
2.0
1.8
1.6
1.4
1.2
1.0
0.8
0.6
0.4
0.2
Source 2004 (tons CO2 ) 2007 (tons CO2 ) ChangeBuildings -4.0% Electricity 166,557 156,392 -6.1%
Natural gas & propane 106,768 106,084 -0.6%
Transportation -11.6%
Ground transportation 211,175 203,471 3.6%
Air travel: commercial 186,631 147,370 -21.0%
Air travel: general aviation 145,616 129,537 -11.0%
Other
Landfill & nitrous oxide 11,902 17,414 46.3%
Total 828,648 760,268 -8.3%
Greenhouse Gas Emissions Sources: 2004 vs. 2007
e e
Note: 2004 General Aviation emissions revised from 157,856 to 145,616 tons CO2e and Aspen’s total emissions from 840,888 to 828,648 tons CO2e.
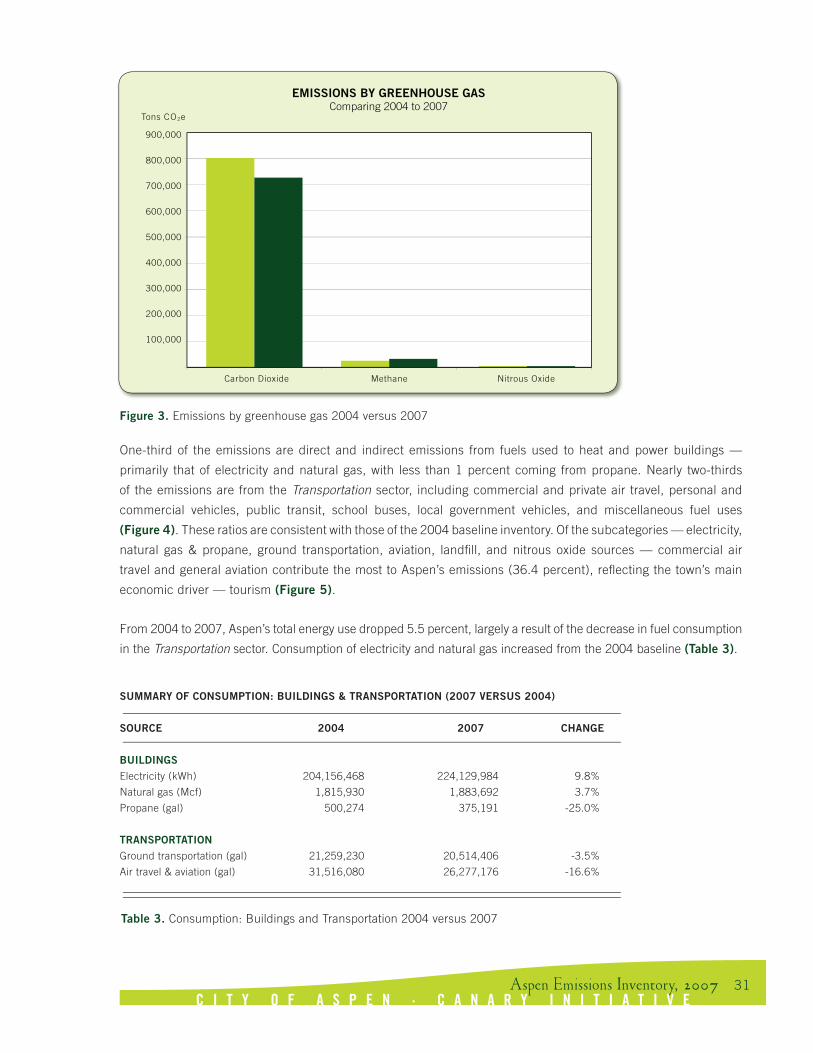
C I T Y O F A S P E N · C A N A R Y I N I T I A T I V E31
One-third of the emissions are direct and indirect emissions from fuels used to heat and power buildings —
primarily that of electricity and natural gas, with less than 1 percent coming from propane. Nearly two-thirds
of the emissions are from the Transportation sector, including commercial and private air travel, personal and
commercial vehicles, public transit, school buses, local government vehicles, and miscellaneous fuel uses
(Figure 4). These ratios are consistent with those of the 2004 baseline inventory. Of the subcategories — electricity,
natural gas & propane, ground transportation, aviation, landfill, and nitrous oxide sources — commercial air
travel and general aviation contribute the most to Aspen’s emissions (36.4 percent), reflecting the town’s main
economic driver — tourism (Figure 5).
From 2004 to 2007, Aspen’s total energy use dropped 5.5 percent, largely a result of the decrease in fuel consumption
in the Transportation sector. Consumption of electricity and natural gas increased from the 2004 baseline (Table 3).
Figure 3. Emissions by greenhouse gas 2004 versus 2007
10,000
20,000
30,000
40,000
50,000
60,000
70,000
Tons CO2e
Passenger Cars
(Sedans, Cabriolets)
Small SUVs and
Small Trucks
Medium/LargeSUVs &
Large “Light”Trucks
2-Axle Medium Duty Trucks & RVs
3-Axle Trucks,Dump Trucks
Semis,ComboTrucks
Motor-cycles
TOTAL GREENHOUSE GAS EMISSIONSComparing 2004 to 2007
Tons CO2e
Tons CO2e
ELECTRICITY, NATURAL GAS, AND PROPANE EMISSIONSComparing 2004 to 2007
MAJOR SOURCES OF EMISSIONS2007
AIR TRAVEL AND AVIATION EMISSIONSComparing 2004 to 2007
ELECTRICITY CONSUMPTIONComparing 2004 to 2007
MAJOR EMISSIONS SOURCESComparing 2004 to 2007
MAJOR GROUND TRANSPORTATION EMISSIONSComparing 2004 to 2007
Tons CO2e
Tons CO2e
Tons CO2e
kWh
160,000
140,000
120,000
100,000
80,000
60,000
40,000
20,000
Aspen Electric AM Gas Propane VendorsHoly Cross SourceGas
160,000
140,000
120,000
100,000
80,000
60,000
40,000
20,000
180,000
160,000
140,000
120,000
100,000
80,000
60,000
40,000
20,000
140,000
120,000
100,000
80,000
60,000
40,000
20,000
Aspen Electric Holy Cross
180,000,000
160,000,000
140,000,000
120,000,000
100,000,000
80,000,000
60,000,000
40,000,000
20,000,000
2004
2007
2004
2007
2004
2007
2004
2007
2004
2007
2004
2007
900,000
800,000
700,000
600,000
500,000
400,000
300,000
200,000
100,000
20072004
GA: Air Ambulance
GA:Piston
GA:Turboprops
GA: JetsAir Travelvia OtherAirports
Air Travelvia Aspen
LandfillMethane
GA: JetsAir Travelvia OtherAirports
Air Travelvia Aspen
TouristDriving
AroundTown
CommutingNaturalGas
Electricity
SkiCoDiesel & Gasoline
RFTATourist DrivingAround TownCommuting
Air Travel & Aviation36.4%
Ground Transportation26.8%
Natural Gas & Propane14.0%
9.1% Aspen Electric:
Residential 1.8%
Aspen Electric:Municipal
15.0% Aspen Electric:
Commercial
40.4% Holy Cross: Residential
31.4% Holy Cross:Commercial
10
20
30
40
50
60
70
80
90
20,000 40,000 80,000 100,000 120,000
Thou
sand
s of
Ton
s CO
2e
Megawatt Hours
60,000
828,648
760,268
Other Sources
Air Travel
Buildings
Commuting
2007
2007
2008
2008
2004
2004
Tons CO2e/yr
Aspen Total EmissionsAir Travel
Buildings
Commuting
Tons CO2e/yr
AIR TRAVEL AND AVIATION, 2007Tons CO2
General Aviation:Air Ambulance
69 tons
Commercial Air Travelvia Regional Airports
41,689 tons
Commercial Air Travelvia Aspen County Airport
105,681 tons
General Aviation:Piston Aircraft
1,039 tons
General Aviation:Turboprops6,147 tons
General Aviation:Jet Aircraft
122,289 tons
ASPEN EMISSIONS: GROUND TRANSPORTATION 2007Tons CO2
2008
2008
ASPEN EMISSIONS: GROUND TRANSPORTATION 2007Tons CO2
Around-Town Driving37,713 tons
Off-Road: SkiCo, Yard Widgets, Construction Equipment
3,339 tons RFTA Buses4,395 tons
Aspen School District371 tons
Commuting, Hwy 82117,242 tons
Pitkin County186 tons
Tourist Road Travel39,211 tons
City of Aspen1,015 tons
VEHICLE TYPE SURVEYAugust 2008
Medium & HeavyTrucks/SUVs
39.1%
Large 2-Axle Trucks2.6%
Large 3-Axle Trucks2.4%
Semis0.7%
Buses (RFTA)1.3%
Motorcycles *0.50.6%
Passenger Cars26.8%
Light Trucks and SUVs26.5%
2004
2007
HIGHWAY 82 AND COMMUTING EMISSIONSComparing 2004 to 2007
2004
2007
GROUND TRANSPORTATIONComparing 2004 to 2007
ASPEN BUILDING EMISSIONS, 2007Gallonsof Fuel
14,000,000
12,000,000
10,000,000
8,000,000
6,000,000
4,000,000
2,000,000
Off-RoadFuel
SkiCoDiesel& Gas
RFTATouristDriving
AroundTown
Commuting
ASPEN’S MAJOR AIR AND GROUND TRANSPORTATION EMISSIONS2007 COST OF ENERGY
Comparing 2004 to 2007140,000
120,000
100,000
80,000
60,000
40,000
20,000
Tons CO2e/yr
GeneralAviation(Jets)
CommercialAir Travelvia Aspen
CommercialAir Travelvia OtherAirports
Commutingvia Hwy 82
Around-TownDriving
TouristRoad Travel
To/From Aspen
Mcf
1,600,000
1,400,000
1,200,000
1,000,000
800,000
600,000
400,000
200,000
AM GasSourceGas
Aspen Electric Carbon Dioxide Methane Nitrous OxideHoly Cross
ELECTRICITY EMISSIONSComparing 2004 to 2007
NATURAL GAS CONSUMPTIONComparing 2004 to 2007
EMISSIONS BY GREENHOUSE GASComparing 2004 to 2007
ASPEN EMISSIONS: MAJOR SOURCES, 2007Tons CO2e
Tons CO2e
160,000
140,000
120,000
100,000
80,000
60,000
40,000
20,000
Tons CO2e
160,000
140,000
120,000
100,000
80,000
60,000
40,000
20,000
Aspen Electric AM Gas Propane VendorsHoly Cross SourceGas
19,298 21,214
137,094
82,350
2,506
2004
2007
Electricity Natural Gas Propane GroundTransportation
Aviation
$90,000,000
$80,000,000
$70,000,000
$60,000,000
$50,000,000
$40,000,000
$30,000,000
$20,000,000
$10,000,000
General Aviation129,537 tons
Commercial Air Travel147,370 tons
All GroundTransportation203,471 tons
Natural Gas andPropane
106,070 tons
Electricity156,392 tons
Landfill and N2O17,414 tons
Tons CO2e
900,000
800,000
700,000
600,000
500,000
400,000
300,000
200,000
100,000
ELECTRICITY EMISSIONS BY COMPANY AND SECTOR, 2007
1998 20302026
Aspen’s 2020 Target:580,054 tons CO2e
20182014201020062002 20342022 20462042 20502038
Aspen’s 2050 Target:165,730 tons CO2e
ELECTRICITY EMISSION FACTORSComparing 2004 to 2007
1.26
1.791.72
0.60
Aspen Electric Holy Cross
2004
2007
lbs CO2e/kWhdel ivered
Electricity20.6%
Landfill2.2% Nitrous Oxide
0.05%
1998 2006200520032002200120001999
900,000
800,000
700,000
600,000
500,000
400,000
300,000
200,000
100,000
ASPEN’S QUICKTRACKER SOURCES AND TOTAL EMISSIONS1998 to 2008
900,000
800,000
700,000
600,000
500,000
400,000
300,000
200,000
100,000
ASPEN’S TOTAL EMISSIONS1998 to 2050
Commercial Air Travelvia Aspen County Airport
105,681 tons
General Aviation:Jet Aircraft
122,289 tons
Passenger Cars26.8%
-
40,000
20,000
00,000
80,000
60,000
40,000
20,000
$9
$8
$7
$6
$5
$4
$3
$2
-
2.0
1.8
1.6
1.4
1.2
1.0
0.8
0.6
0.4
0.2
SUMMARY OF CONSUMPTION: BUILDINGS & TRANSPORTATION (2007 VERSUS 2004)
SOURCE 2004 2007 CHANGE
BUILDINGS Electricity (kWh) 204,156,468 224,129,984 9.8%Natural gas (Mcf) 1,815,930 1,883,692 3.7%Propane (gal) 500,274 375,191 -25.0%
TRANSPORTATION Ground transportation (gal) 21,259,230 20,514,406 -3.5%Air travel & aviation (gal) 31,516,080 26,277,176 -16.6%
Table 3. Consumption: Buildings and Transportation 2004 versus 2007

C I T Y O F A S P E N · C A N A R Y I N I T I A T I V E32
Figure 4. Major sources 2007
10,000
20,000
30,000
40,000
50,000
60,000
70,000
Tons CO2e
Passenger Cars
(Sedans, Cabriolets)
Small SUVs and
Small Trucks
Medium/LargeSUVs &
Large “Light”Trucks
2-Axle Medium Duty Trucks & RVs
3-Axle Trucks,Dump Trucks
Semis,ComboTrucks
Motor-cycles
TOTAL GREENHOUSE GAS EMISSIONSComparing 2004 to 2007
Tons CO2e
Tons CO2e
ELECTRICITY, NATURAL GAS, AND PROPANE EMISSIONSComparing 2004 to 2007
MAJOR SOURCES OF EMISSIONS2007
AIR TRAVEL AND AVIATION EMISSIONSComparing 2004 to 2007
ELECTRICITY CONSUMPTIONComparing 2004 to 2007
MAJOR EMISSIONS SOURCESComparing 2004 to 2007
MAJOR GROUND TRANSPORTATION EMISSIONSComparing 2004 to 2007
Tons CO2e
Tons CO2e
Tons CO2e
kWh
160,000
140,000
120,000
100,000
80,000
60,000
40,000
20,000
Aspen Electric AM Gas Propane VendorsHoly Cross SourceGas
160,000
140,000
120,000
100,000
80,000
60,000
40,000
20,000
180,000
160,000
140,000
120,000
100,000
80,000
60,000
40,000
20,000
140,000
120,000
100,000
80,000
60,000
40,000
20,000
Aspen Electric Holy Cross
180,000,000
160,000,000
140,000,000
120,000,000
100,000,000
80,000,000
60,000,000
40,000,000
20,000,000
2004
2007
2004
2007
2004
2007
2004
2007
2004
2007
2004
2007
900,000
800,000
700,000
600,000
500,000
400,000
300,000
200,000
100,000
20072004
GA: Air Ambulance
GA:Piston
GA:Turboprops
GA: JetsAir Travelvia OtherAirports
Air Travelvia Aspen
LandfillMethane
GA: JetsAir Travelvia OtherAirports
Air Travelvia Aspen
TouristDriving
AroundTown
CommutingNaturalGas
Electricity
SkiCoDiesel & Gasoline
RFTATourist DrivingAround TownCommuting
Air Travel & Aviation36.4%
Ground Transportation26.8%
Natural Gas & Propane14.0%
9.1% Aspen Electric:
Residential 1.8%
Aspen Electric:Municipal
15.0% Aspen Electric:
Commercial
40.4% Holy Cross: Residential
31.4% Holy Cross:Commercial
10
20
30
40
50
60
70
80
90
20,000 40,000 80,000 100,000 120,000
Thou
sand
s of
Ton
s CO
2e
Megawatt Hours
60,000
828,648
760,268
Other Sources
Air Travel
Buildings
Commuting
2007
2007
2008
2008
2004
2004
Tons CO2e/yr
Aspen Total EmissionsAir Travel
Buildings
Commuting
Tons CO2e/yr
AIR TRAVEL AND AVIATION, 2007Tons CO2
General Aviation:Air Ambulance
69 tons
Commercial Air Travelvia Regional Airports
41,689 tons
Commercial Air Travelvia Aspen County Airport
105,681 tons
General Aviation:Piston Aircraft
1,039 tons
General Aviation:Turboprops6,147 tons
General Aviation:Jet Aircraft
122,289 tons
ASPEN EMISSIONS: GROUND TRANSPORTATION 2007Tons CO2
2008
2008
ASPEN EMISSIONS: GROUND TRANSPORTATION 2007Tons CO2
Around-Town Driving37,713 tons
Off-Road: SkiCo, Yard Widgets, Construction Equipment
3,339 tons RFTA Buses4,395 tons
Aspen School District371 tons
Commuting, Hwy 82117,242 tons
Pitkin County186 tons
Tourist Road Travel39,211 tons
City of Aspen1,015 tons
VEHICLE TYPE SURVEYAugust 2008
Medium & HeavyTrucks/SUVs
39.1%
Large 2-Axle Trucks2.6%
Large 3-Axle Trucks2.4%
Semis0.7%
Buses (RFTA)1.3%
Motorcycles *0.50.6%
Passenger Cars26.8%
Light Trucks and SUVs26.5%
2004
2007
HIGHWAY 82 AND COMMUTING EMISSIONSComparing 2004 to 2007
2004
2007
GROUND TRANSPORTATIONComparing 2004 to 2007
ASPEN BUILDING EMISSIONS, 2007Gallonsof Fuel
14,000,000
12,000,000
10,000,000
8,000,000
6,000,000
4,000,000
2,000,000
Off-RoadFuel
SkiCoDiesel& Gas
RFTATouristDriving
AroundTown
Commuting
ASPEN’S MAJOR AIR AND GROUND TRANSPORTATION EMISSIONS2007 COST OF ENERGY
Comparing 2004 to 2007140,000
120,000
100,000
80,000
60,000
40,000
20,000
Tons CO2e/yr
GeneralAviation(Jets)
CommercialAir Travelvia Aspen
CommercialAir Travelvia OtherAirports
Commutingvia Hwy 82
Around-TownDriving
TouristRoad Travel
To/From Aspen
Mcf
1,600,000
1,400,000
1,200,000
1,000,000
800,000
600,000
400,000
200,000
AM GasSourceGas
Aspen Electric Carbon Dioxide Methane Nitrous OxideHoly Cross
ELECTRICITY EMISSIONSComparing 2004 to 2007
NATURAL GAS CONSUMPTIONComparing 2004 to 2007
EMISSIONS BY GREENHOUSE GASComparing 2004 to 2007
ASPEN EMISSIONS: MAJOR SOURCES, 2007Tons CO2e
Tons CO2e
160,000
140,000
120,000
100,000
80,000
60,000
40,000
20,000
Tons CO2e
160,000
140,000
120,000
100,000
80,000
60,000
40,000
20,000
Aspen Electric AM Gas Propane VendorsHoly Cross SourceGas
19,298 21,214
137,094
82,350
2,506
2004
2007
Electricity Natural Gas Propane GroundTransportation
Aviation
$90,000,000
$80,000,000
$70,000,000
$60,000,000
$50,000,000
$40,000,000
$30,000,000
$20,000,000
$10,000,000
General Aviation129,537 tons
Commercial Air Travel147,370 tons
All GroundTransportation203,471 tons
Natural Gas andPropane
106,070 tons
Electricity156,392 tons
Landfill and N2O17,414 tons
Tons CO2e
900,000
800,000
700,000
600,000
500,000
400,000
300,000
200,000
100,000
ELECTRICITY EMISSIONS BY COMPANY AND SECTOR, 2007
1998 20302026
Aspen’s 2020 Target:580,054 tons CO2e
20182014201020062002 20342022 20462042 20502038
Aspen’s 2050 Target:165,730 tons CO2e
ELECTRICITY EMISSION FACTORSComparing 2004 to 2007
1.26
1.791.72
0.60
Aspen Electric Holy Cross
2004
2007
lbs CO2e/kWhdel ivered
Electricity20.6%
Landfill2.2% Nitrous Oxide
0.05%
1998 2006200520032002200120001999
900,000
800,000
700,000
600,000
500,000
400,000
300,000
200,000
100,000
ASPEN’S QUICKTRACKER SOURCES AND TOTAL EMISSIONS1998 to 2008
900,000
800,000
700,000
600,000
500,000
400,000
300,000
200,000
100,000
ASPEN’S TOTAL EMISSIONS1998 to 2050
Commercial Air Travelvia Aspen County Airport
105,681 tons
General Aviation:Jet Aircraft
122,289 tons
Passenger Cars26.8%
-
40,000
20,000
00,000
80,000
60,000
40,000
20,000
$9
$8
$7
$6
$5
$4
$3
$2
-
2.0
1.8
1.6
1.4
1.2
1.0
0.8
0.6
0.4
0.2
Figure 5. Major sources 2004 versus 2007, subcategories
10,000
20,000
30,000
40,000
50,000
60,000
70,000
Tons CO2e
Passenger Cars
(Sedans, Cabriolets)
Small SUVs and
Small Trucks
Medium/LargeSUVs &
Large “Light”Trucks
2-Axle Medium Duty Trucks & RVs
3-Axle Trucks,Dump Trucks
Semis,ComboTrucks
Motor-cycles
TOTAL GREENHOUSE GAS EMISSIONSComparing 2004 to 2007
Tons CO2e
Tons CO2e
ELECTRICITY, NATURAL GAS, AND PROPANE EMISSIONSComparing 2004 to 2007
MAJOR SOURCES OF EMISSIONS2007
AIR TRAVEL AND AVIATION EMISSIONSComparing 2004 to 2007
ELECTRICITY CONSUMPTIONComparing 2004 to 2007
MAJOR EMISSIONS SOURCESComparing 2004 to 2007
MAJOR GROUND TRANSPORTATION EMISSIONSComparing 2004 to 2007
Tons CO2e
Tons CO2e
Tons CO2e
kWh
160,000
140,000
120,000
100,000
80,000
60,000
40,000
20,000
Aspen Electric AM Gas Propane VendorsHoly Cross SourceGas
160,000
140,000
120,000
100,000
80,000
60,000
40,000
20,000
180,000
160,000
140,000
120,000
100,000
80,000
60,000
40,000
20,000
140,000
120,000
100,000
80,000
60,000
40,000
20,000
Aspen Electric Holy Cross
180,000,000
160,000,000
140,000,000
120,000,000
100,000,000
80,000,000
60,000,000
40,000,000
20,000,000
2004
2007
2004
2007
2004
2007
2004
2007
2004
2007
2004
2007
900,000
800,000
700,000
600,000
500,000
400,000
300,000
200,000
100,000
20072004
GA: Air Ambulance
GA:Piston
GA:Turboprops
GA: JetsAir Travelvia OtherAirports
Air Travelvia Aspen
LandfillMethane
GA: JetsAir Travelvia OtherAirports
Air Travelvia Aspen
TouristDriving
AroundTown
CommutingNaturalGas
Electricity
SkiCoDiesel & Gasoline
RFTATourist DrivingAround TownCommuting
Air Travel & Aviation36.4%
Ground Transportation26.8%
Natural Gas & Propane14.0%
9.1% Aspen Electric:
Residential 1.8%
Aspen Electric:Municipal
15.0% Aspen Electric:
Commercial
40.4% Holy Cross: Residential
31.4% Holy Cross:
Commercial
10
20
30
40
50
60
70
80
90
20,000 40,000 80,000 100,000 120,000
Thou
sand
s of
Ton
s CO
2e
Megawatt Hours
60,000
828,648
760,268
Other Sources
Air Travel
Buildings
Commuting
2007
2007
2008
2008
2004
2004
Tons CO2e/yr
Aspen Total EmissionsAir Travel
Buildings
Commuting
Tons CO2e/yr
AIR TRAVEL AND AVIATION, 2007Tons CO2
General Aviation:Air Ambulance
69 tons
Commercial Air Travelvia Regional Airports
41,689 tons
Commercial Air Travelvia Aspen County Airport
105,681 tons
General Aviation:Piston Aircraft
1,039 tons
General Aviation:Turboprops6,147 tons
General Aviation:Jet Aircraft
122,289 tons
ASPEN EMISSIONS: GROUND TRANSPORTATION 2007Tons CO2
2008
2008
ASPEN EMISSIONS: GROUND TRANSPORTATION 2007Tons CO2
Around-Town Driving37,713 tons
Off-Road: SkiCo, Yard Widgets, Construction Equipment
3,339 tons RFTA Buses4,395 tons
Aspen School District371 tons
Commuting, Hwy 82117,242 tons
Pitkin County186 tons
Tourist Road Travel39,211 tons
City of Aspen1,015 tons
VEHICLE TYPE SURVEYAugust 2008
Medium & HeavyTrucks/SUVs
39.1%
Large 2-Axle Trucks2.6%
Large 3-Axle Trucks2.4%
Semis0.7%
Buses (RFTA)1.3%
Motorcycles *0.50.6%
Passenger Cars26.8%
Light Trucks and SUVs26.5%
2004
2007
HIGHWAY 82 AND COMMUTING EMISSIONSComparing 2004 to 2007
2004
2007
GROUND TRANSPORTATIONComparing 2004 to 2007
ASPEN BUILDING EMISSIONS, 2007Gallonsof Fuel
14,000,000
12,000,000
10,000,000
8,000,000
6,000,000
4,000,000
2,000,000
Off-RoadFuel
SkiCoDiesel& Gas
RFTATouristDriving
AroundTown
Commuting
ASPEN’S MAJOR AIR AND GROUND TRANSPORTATION EMISSIONS2007 COST OF ENERGY
Comparing 2004 to 2007140,000
120,000
100,000
80,000
60,000
40,000
20,000
Tons CO2e/yr
GeneralAviation(Jets)
CommercialAir Travelvia Aspen
CommercialAir Travelvia OtherAirports
Commutingvia Hwy 82
Around-TownDriving
TouristRoad Travel
To/From Aspen
Mcf
1,600,000
1,400,000
1,200,000
1,000,000
800,000
600,000
400,000
200,000
AM GasSourceGas
Aspen Electric Carbon Dioxide Methane Nitrous OxideHoly Cross
ELECTRICITY EMISSIONSComparing 2004 to 2007
NATURAL GAS CONSUMPTIONComparing 2004 to 2007
EMISSIONS BY GREENHOUSE GASComparing 2004 to 2007
ASPEN EMISSIONS: MAJOR SOURCES, 2007Tons CO2e
Tons CO2e
160,000
140,000
120,000
100,000
80,000
60,000
40,000
20,000
Tons CO2e
160,000
140,000
120,000
100,000
80,000
60,000
40,000
20,000
Aspen Electric AM Gas Propane VendorsHoly Cross SourceGas
19,298 21,214
137,094
82,350
2,506
2004
2007
Electricity Natural Gas Propane GroundTransportation
Aviation
$90,000,000
$80,000,000
$70,000,000
$60,000,000
$50,000,000
$40,000,000
$30,000,000
$20,000,000
$10,000,000
General Aviation129,537 tons
Commercial Air Travel147,370 tons
All GroundTransportation203,471 tons
Natural Gas andPropane
106,070 tons
Electricity156,392 tons
Landfill and N2O17,414 tons
Tons CO2e
900,000
800,000
700,000
600,000
500,000
400,000
300,000
200,000
100,000
ELECTRICITY EMISSIONS BY COMPANY AND SECTOR, 2007
1998 20302026
Aspen’s 2020 Target:580,054 tons CO2e
20182014201020062002 20342022 20462042 20502038
Aspen’s 2050 Target:165,730 tons CO2e
ELECTRICITY EMISSION FACTORSComparing 2004 to 2007
1.26
1.791.72
0.60
Aspen Electric Holy Cross
2004
2007
lbs CO2e/kWhdel ivered
Electricity20.6%
Landfill2.2% Nitrous Oxide
0.05%
1998 2006200520032002200120001999
900,000
800,000
700,000
600,000
500,000
400,000
300,000
200,000
100,000
ASPEN’S QUICKTRACKER SOURCES AND TOTAL EMISSIONS1998 to 2008
900,000
800,000
700,000
600,000
500,000
400,000
300,000
200,000
100,000
ASPEN’S TOTAL EMISSIONS1998 to 2050
Commercial Air Travelvia Aspen County Airport
105,681 tons
General Aviation:Jet Aircraft
122,289 tons
Passenger Cars26.8%
-
40,000
20,000
00,000
80,000
60,000
40,000
20,000
$9
$8
$7
$6
$5
$4
$3
$2
-
2.0
1.8
1.6
1.4
1.2
1.0
0.8
0.6
0.4
0.2
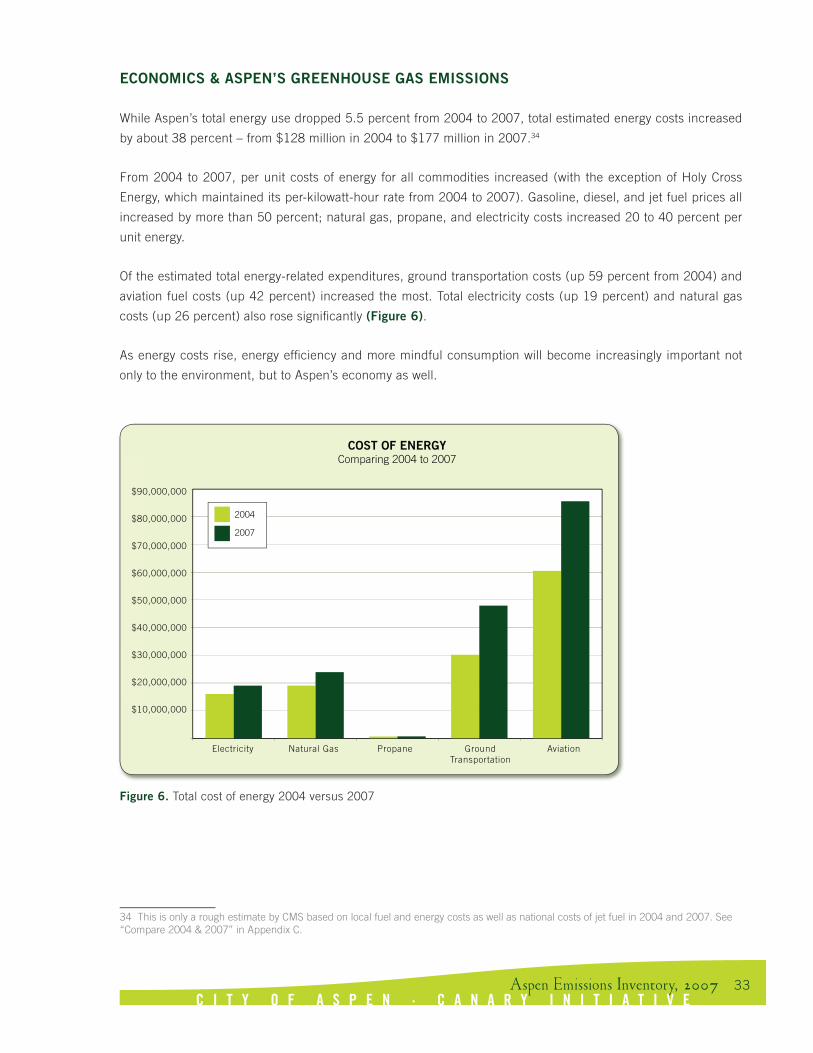
C I T Y O F A S P E N · C A N A R Y I N I T I A T I V E33
ECONOMICS & ASPEN’S GREENHOUSE GAS EMISSIONS
While Aspen’s total energy use dropped 5.5 percent from 2004 to 2007, total estimated energy costs increased
by about 38 percent – from $128 million in 2004 to $177 million in 2007.34
From 2004 to 2007, per unit costs of energy for all commodities increased (with the exception of Holy Cross
Energy, which maintained its per-kilowatt-hour rate from 2004 to 2007). Gasoline, diesel, and jet fuel prices all
increased by more than 50 percent; natural gas, propane, and electricity costs increased 20 to 40 percent per
unit energy.
Of the estimated total energy-related expenditures, ground transportation costs (up 59 percent from 2004) and
aviation fuel costs (up 42 percent) increased the most. Total electricity costs (up 19 percent) and natural gas
costs (up 26 percent) also rose significantly (Figure 6).
As energy costs rise, energy efficiency and more mindful consumption will become increasingly important not
only to the environment, but to Aspen’s economy as well.
34 This is only a rough estimate by CMS based on local fuel and energy costs as well as national costs of jet fuel in 2004 and 2007. See “Compare 2004 & 2007” in Appendix C.
Figure 6. Total cost of energy 2004 versus 2007
10,000
20,000
30,000
40,000
50,000
60,000
70,000
Tons CO2e
Passenger Cars
(Sedans, Cabriolets)
Small SUVs and
Small Trucks
Medium/LargeSUVs &
Large “Light”Trucks
2-Axle Medium Duty Trucks & RVs
3-Axle Trucks,Dump Trucks
Semis,ComboTrucks
Motor-cycles
TOTAL GREENHOUSE GAS EMISSIONSComparing 2004 to 2007
Tons CO2e
Tons CO2e
ELECTRICITY, NATURAL GAS, AND PROPANE EMISSIONSComparing 2004 to 2007
MAJOR SOURCES OF EMISSIONS2007
AIR TRAVEL AND AVIATION EMISSIONSComparing 2004 to 2007
ELECTRICITY CONSUMPTIONComparing 2004 to 2007
MAJOR EMISSIONS SOURCESComparing 2004 to 2007
MAJOR GROUND TRANSPORTATION EMISSIONSComparing 2004 to 2007
Tons CO2e
Tons CO2e
Tons CO2e
kWh
160,000
140,000
120,000
100,000
80,000
60,000
40,000
20,000
Aspen Electric AM Gas Propane VendorsHoly Cross SourceGas
160,000
140,000
120,000
100,000
80,000
60,000
40,000
20,000
180,000
160,000
140,000
120,000
100,000
80,000
60,000
40,000
20,000
140,000
120,000
100,000
80,000
60,000
40,000
20,000
Aspen Electric Holy Cross
180,000,000
160,000,000
140,000,000
120,000,000
100,000,000
80,000,000
60,000,000
40,000,000
20,000,000
2004
2007
2004
2007
2004
2007
2004
2007
2004
2007
2004
2007
900,000
800,000
700,000
600,000
500,000
400,000
300,000
200,000
100,000
20072004
GA: Air Ambulance
GA:Piston
GA:Turboprops
GA: JetsAir Travelvia OtherAirports
Air Travelvia Aspen
LandfillMethane
GA: JetsAir Travelvia OtherAirports
Air Travelvia Aspen
TouristDriving
AroundTown
CommutingNaturalGas
Electricity
SkiCoDiesel & Gasoline
RFTATourist DrivingAround TownCommuting
Air Travel & Aviation36.4%
Ground Transportation26.8%
Natural Gas & Propane14.0%
9.1% Aspen Electric:
Residential 1.8%
Aspen Electric:Municipal
15.0% Aspen Electric:
Commercial
40.4% Holy Cross: Residential
31.4% Holy Cross:Commercial
10
20
30
40
50
60
70
80
90
20,000 40,000 80,000 100,000 120,000
Thou
sand
s of
Ton
s CO
2e
Megawatt Hours
60,000
828,648
760,268
Other Sources
Air Travel
Buildings
Commuting
2007
2007
2008
2008
2004
2004
Tons CO2e/yr
Aspen Total EmissionsAir Travel
Buildings
Commuting
Tons CO2e/yr
AIR TRAVEL AND AVIATION, 2007Tons CO2
General Aviation:Air Ambulance
69 tons
Commercial Air Travelvia Regional Airports
41,689 tons
Commercial Air Travelvia Aspen County Airport
105,681 tons
General Aviation:Piston Aircraft
1,039 tons
General Aviation:Turboprops6,147 tons
General Aviation:Jet Aircraft
122,289 tons
ASPEN EMISSIONS: GROUND TRANSPORTATION 2007Tons CO2
2008
2008
ASPEN EMISSIONS: GROUND TRANSPORTATION 2007Tons CO2
Around-Town Driving37,713 tons
Off-Road: SkiCo, Yard Widgets, Construction Equipment
3,339 tons RFTA Buses4,395 tons
Aspen School District371 tons
Commuting, Hwy 82117,242 tons
Pitkin County186 tons
Tourist Road Travel39,211 tons
City of Aspen1,015 tons
VEHICLE TYPE SURVEYAugust 2008
Medium & HeavyTrucks/SUVs
39.1%
Large 2-Axle Trucks2.6%
Large 3-Axle Trucks2.4%
Semis0.7%
Buses (RFTA)1.3%
Motorcycles *0.50.6%
Passenger Cars26.8%
Light Trucks and SUVs26.5%
2004
2007
HIGHWAY 82 AND COMMUTING EMISSIONSComparing 2004 to 2007
2004
2007
GROUND TRANSPORTATIONComparing 2004 to 2007
ASPEN BUILDING EMISSIONS, 2007Gallonsof Fuel
14,000,000
12,000,000
10,000,000
8,000,000
6,000,000
4,000,000
2,000,000
Off-RoadFuel
SkiCoDiesel& Gas
RFTATouristDriving
AroundTown
Commuting
ASPEN’S MAJOR AIR AND GROUND TRANSPORTATION EMISSIONS2007 COST OF ENERGY
Comparing 2004 to 2007140,000
120,000
100,000
80,000
60,000
40,000
20,000
Tons CO2e/yr
GeneralAviation(Jets)
CommercialAir Travelvia Aspen
CommercialAir Travelvia OtherAirports
Commutingvia Hwy 82
Around-TownDriving
TouristRoad Travel
To/From Aspen
Mcf
1,600,000
1,400,000
1,200,000
1,000,000
800,000
600,000
400,000
200,000
AM GasSourceGas
Aspen Electric Carbon Dioxide Methane Nitrous OxideHoly Cross
ELECTRICITY EMISSIONSComparing 2004 to 2007
NATURAL GAS CONSUMPTIONComparing 2004 to 2007
EMISSIONS BY GREENHOUSE GASComparing 2004 to 2007
ASPEN EMISSIONS: MAJOR SOURCES, 2007Tons CO2e
Tons CO2e
160,000
140,000
120,000
100,000
80,000
60,000
40,000
20,000
Tons CO2e
160,000
140,000
120,000
100,000
80,000
60,000
40,000
20,000
Aspen Electric AM Gas Propane VendorsHoly Cross SourceGas
19,298 21,214
137,094
82,350
2,506
2004
2007
Electricity Natural Gas Propane GroundTransportation
Aviation
$90,000,000
$80,000,000
$70,000,000
$60,000,000
$50,000,000
$40,000,000
$30,000,000
$20,000,000
$10,000,000
General Aviation129,537 tons
Commercial Air Travel147,370 tons
All GroundTransportation203,471 tons
Natural Gas andPropane
106,070 tons
Electricity156,392 tons
Landfill and N2O17,414 tons
Tons CO2e
900,000
800,000
700,000
600,000
500,000
400,000
300,000
200,000
100,000
ELECTRICITY EMISSIONS BY COMPANY AND SECTOR, 2007
1998 20302026
Aspen’s 2020 Target:580,054 tons CO2e
20182014201020062002 20342022 20462042 20502038
Aspen’s 2050 Target:165,730 tons CO2e
ELECTRICITY EMISSION FACTORSComparing 2004 to 2007
1.26
1.791.72
0.60
Aspen Electric Holy Cross
2004
2007
lbs CO2e/kWhdel ivered
Electricity20.6%
Landfill2.2% Nitrous Oxide
0.05%
1998 2006200520032002200120001999
900,000
800,000
700,000
600,000
500,000
400,000
300,000
200,000
100,000
ASPEN’S QUICKTRACKER SOURCES AND TOTAL EMISSIONS1998 to 2008
900,000
800,000
700,000
600,000
500,000
400,000
300,000
200,000
100,000
ASPEN’S TOTAL EMISSIONS1998 to 2050
Commercial Air Travelvia Aspen County Airport
105,681 tons
General Aviation:Jet Aircraft
122,289 tons
Passenger Cars26.8%
-
40,000
20,000
00,000
80,000
60,000
40,000
20,000
$9
$8
$7
$6
$5
$4
$3
$2
-
2.0
1.8
1.6
1.4
1.2
1.0
0.8
0.6
0.4
0.2

C I T Y O F A S P E N · C A N A R Y I N I T I A T I V E34
IN PERSPECTIVE: ASPEN’S GREENHOUSE GAS EMISSIONS
Aspen accounts for approximately 0.01 percent of total U.S. emissions.35
The drop in emissions from 2004 to 2007 — 68,381 tons CO2e — is equivalent to eliminating the
emissions from 2,680 average Aspen homes.36
The emissions rate — if converted into equivalent energy content of gasoline — equals the arrival of
a very large (9,500 gallon) tanker truck every hour, night and day, all year long.37
Aspen’s annual emissions “weigh” 48 times as much
as the 16,000-ton Maroon Creek Bridge.38 That is,
Aspen emits the bridge’s weight in greenhouse gases
every 7.6 days.
If Aspen’s total energy appetite were supplied by
coal, it would require eleven 120-ton railroad cars
of coal every day. If a year’s worth of equivalent coal
consumption were piled onto 2.6-acre Wagner Park,
it would reach a depth of 155 feet (approximately a
15-story building), or enough to cover Aspen’s 43-
acre commercial core with nine feet of coal.
35 In 2007, the United States emitted 8,027 million tons CO2e, compared to Aspen’s 0.760 million tons CO2e in 2007. EIA (2008) Emissions of Greenhouse Gases in the United States in 2007, U.S. Department of Energy. Aspen also consumed 0.0098 percent of the nation’s energy in 2007: Aspen’s 10.08 trillion (1012) Btu / U.S. 102.4 quadrillion (1015) Btu = 0.00010. EIA (2007), Annual Energy Outlook 2007 with Projections to 2030. U.S. Department of Energy.
36 The average Aspen home emits 25.51 tons of CO2e per year. From 2004 to 2007, emissions attributable to Aspen decreased by 68,380 tons CO2e (from 828,648 to 760,268 tons CO2e).
37 80.6 million gallons of gasoline equivalent/yr = 2.6 gallons/second = 23 very large (9,500-gallon) gasoline tankers per day, or one tanker every 58 minutes. Similarly, the city’s annual energy consumption of gasoline equivalent would cover Aspen’s 43-acre commercial core to a depth of 5.7 feet.
38 Maroon Creek Bridge: Concrete 30,213,000 lb; reinforcing steel 1,339,085 lb; pre-stressing steel 262,717 lb. Total 31,814,802 lb, or 15,907 tons. Aspen’s 2007 emissions: 760,268 tons CO2e, or 47.8 times Maroon Creek Bridge’s mass, soaking wet. Data from Colorado Dept. of Transportation, personal communication, 19Sep05.

C I T Y O F A S P E N · C A N A R Y I N I T I A T I V E35
BUILDINGS: ELECTRICITY, NATURAL GAS, & PROPANE
Buildings and facilities account for 34.5 percent of Aspen’s total emissions.39 In 2007, commercial and residential
buildings consumed 4.6 percent more energy than in 2004. Yet, emissions from the Buildings sector decreased
by 4.0 percent over 2004 levels — largely because of the dramatically reduced carbon content of the City of
Aspen Electric portfolio, which reduced emissions by 20,458 tons CO2e — a decline equivalent to 802 Aspen
homes. The drop in emissions occurred despite the 2.9 percent increase in electricity consumption associated
with the utility. Holy Cross Energy, which comprises roughly 71 percent of total electric consumption (Figure 11), saw a 12.8 percent growth in demand from 2004 to 2007. Of Aspen’s total emissions, electric emissions
represent 20.6 percent; natural gas emissions represent 13.6 percent; and propane emissions represent 0.3
percent (Figure 7, 8).
In 2007, both electric and natural gas consumption increased over the 2004 baseline. Electric consumption rose
significantly (up 9.8 percent) (Figure 9), and natural gas consumption increased by 3.7 percent (Figure 12). Propane consumption decreased by 25 percent from 2004, likely a result of better data availability between 2004
and 2007.40 Propane use, however, contributes very little to Aspen’s total emissions, at just 0.3 percent.
39 “Buildings and facilities” includes energy used in street lighting, ski lifts, heated driveways, irrigation and well pumps, airport runway lighting, snow-making equipment, wastewater treatment, ice-rink chillers, propane grills, and miscellaneous uses.
40 In 2004, Ferrellgas did not provide propane consumption data and, thus, it was assumed equal to that of Aspen’s other propane supplier, AmeriGas. In 2007, Ferrellgas provided data. Propane consumption associated with Ferrellgas dropped by 85.51 percent, down nearly 214,000 gallons from 2004.
10,000
20,000
30,000
40,000
50,000
60,000
70,000
Tons CO2e
Passenger Cars
(Sedans, Cabriolets)
Small SUVs and
Small Trucks
Medium/LargeSUVs &
Large “Light”Trucks
2-Axle Medium Duty Trucks & RVs
3-Axle Trucks,Dump Trucks
Semis,ComboTrucks
Motor-cycles
TOTAL GREENHOUSE GAS EMISSIONSComparing 2004 to 2007
Tons CO2e
Tons CO2e
ELECTRICITY, NATURAL GAS, AND PROPANE EMISSIONSComparing 2004 to 2007
MAJOR SOURCES OF EMISSIONS2007
AIR TRAVEL AND AVIATION EMISSIONSComparing 2004 to 2007
ELECTRICITY CONSUMPTIONComparing 2004 to 2007
MAJOR EMISSIONS SOURCESComparing 2004 to 2007
MAJOR GROUND TRANSPORTATION EMISSIONSComparing 2004 to 2007
Tons CO2e
Tons CO2e
Tons CO2e
kWh
160,000
140,000
120,000
100,000
80,000
60,000
40,000
20,000
Aspen Electric AM Gas Propane VendorsHoly Cross SourceGas
160,000
140,000
120,000
100,000
80,000
60,000
40,000
20,000
180,000
160,000
140,000
120,000
100,000
80,000
60,000
40,000
20,000
140,000
120,000
100,000
80,000
60,000
40,000
20,000
Aspen Electric Holy Cross
180,000,000
160,000,000
140,000,000
120,000,000
100,000,000
80,000,000
60,000,000
40,000,000
20,000,000
2004
2007
2004
2007
2004
2007
2004
2007
2004
2007
2004
2007
900,000
800,000
700,000
600,000
500,000
400,000
300,000
200,000
100,000
20072004
GA: Air Ambulance
GA:Piston
GA:Turboprops
GA: JetsAir Travelvia OtherAirports
Air Travelvia Aspen
LandfillMethane
GA: JetsAir Travelvia OtherAirports
Air Travelvia Aspen
TouristDriving
AroundTown
CommutingNaturalGas
Electricity
SkiCoDiesel & Gasoline
RFTATourist DrivingAround TownCommuting
Air Travel & Aviation36.4%
Ground Transportation26.8%
Natural Gas & Propane14.0%
9.1% Aspen Electric:
Residential 1.8%
Aspen Electric:Municipal
15.0% Aspen Electric:
Commercial
40.4% Holy Cross: Residential
31.4% Holy Cross:Commercial
10
20
30
40
50
60
70
80
90
20,000 40,000 80,000 100,000 120,000
Thou
sand
s of
Ton
s CO
2e
Megawatt Hours
60,000
828,648
760,268
Other Sources
Air Travel
Buildings
Commuting
2007
2007
2008
2008
2004
2004
Tons CO2e/yr
Aspen Total EmissionsAir Travel
Buildings
Commuting
Tons CO2e/yr
AIR TRAVEL AND AVIATION, 2007Tons CO2
General Aviation:Air Ambulance
69 tons
Commercial Air Travelvia Regional Airports
41,689 tons
Commercial Air Travelvia Aspen County Airport
105,681 tons
General Aviation:Piston Aircraft
1,039 tons
General Aviation:Turboprops6,147 tons
General Aviation:Jet Aircraft
122,289 tons
ASPEN EMISSIONS: GROUND TRANSPORTATION 2007Tons CO2
2008
2008
ASPEN EMISSIONS: GROUND TRANSPORTATION 2007Tons CO2
Around-Town Driving37,713 tons
Off-Road: SkiCo, Yard Widgets, Construction Equipment
3,339 tons RFTA Buses4,395 tons
Aspen School District371 tons
Commuting, Hwy 82117,242 tons
Pitkin County186 tons
Tourist Road Travel39,211 tons
City of Aspen1,015 tons
VEHICLE TYPE SURVEYAugust 2008
Medium & HeavyTrucks/SUVs
39.1%
Large 2-Axle Trucks2.6%
Large 3-Axle Trucks2.4%
Semis0.7%
Buses (RFTA)1.3%
Motorcycles *0.50.6%
Passenger Cars26.8%
Light Trucks and SUVs26.5%
2004
2007
HIGHWAY 82 AND COMMUTING EMISSIONSComparing 2004 to 2007
2004
2007
GROUND TRANSPORTATIONComparing 2004 to 2007
ASPEN BUILDING EMISSIONS, 2007Gallonsof Fuel
14,000,000
12,000,000
10,000,000
8,000,000
6,000,000
4,000,000
2,000,000
Off-RoadFuel
SkiCoDiesel& Gas
RFTATouristDriving
AroundTown
Commuting
ASPEN’S MAJOR AIR AND GROUND TRANSPORTATION EMISSIONS2007 COST OF ENERGY
Comparing 2004 to 2007140,000
120,000
100,000
80,000
60,000
40,000
20,000
Tons CO2e/yr
GeneralAviation(Jets)
CommercialAir Travelvia Aspen
CommercialAir Travelvia OtherAirports
Commutingvia Hwy 82
Around-TownDriving
TouristRoad Travel
To/From Aspen
Mcf
1,600,000
1,400,000
1,200,000
1,000,000
800,000
600,000
400,000
200,000
AM GasSourceGas
Aspen Electric Carbon Dioxide Methane Nitrous OxideHoly Cross
ELECTRICITY EMISSIONSComparing 2004 to 2007
NATURAL GAS CONSUMPTIONComparing 2004 to 2007
EMISSIONS BY GREENHOUSE GASComparing 2004 to 2007
ASPEN EMISSIONS: MAJOR SOURCES, 2007Tons CO2e
Tons CO2e
160,000
140,000
120,000
100,000
80,000
60,000
40,000
20,000
Tons CO2e
160,000
140,000
120,000
100,000
80,000
60,000
40,000
20,000
Aspen Electric AM Gas Propane VendorsHoly Cross SourceGas
19,298 21,214
137,094
82,350
2,506
2004
2007
Electricity Natural Gas Propane GroundTransportation
Aviation
$90,000,000
$80,000,000
$70,000,000
$60,000,000
$50,000,000
$40,000,000
$30,000,000
$20,000,000
$10,000,000
General Aviation129,537 tons
Commercial Air Travel147,370 tons
All GroundTransportation203,471 tons
Natural Gas andPropane
106,070 tons
Electricity156,392 tons
Landfill and N2O17,414 tons
Tons CO2e
900,000
800,000
700,000
600,000
500,000
400,000
300,000
200,000
100,000
ELECTRICITY EMISSIONS BY COMPANY AND SECTOR, 2007
1998 20302026
Aspen’s 2020 Target:580,054 tons CO2e
20182014201020062002 20342022 20462042 20502038
Aspen’s 2050 Target:165,730 tons CO2e
ELECTRICITY EMISSION FACTORSComparing 2004 to 2007
1.26
1.791.72
0.60
Aspen Electric Holy Cross
2004
2007
lbs CO2e/kWhdel ivered
Electricity20.6%
Landfill2.2% Nitrous Oxide
0.05%
1998 2006200520032002200120001999
900,000
800,000
700,000
600,000
500,000
400,000
300,000
200,000
100,000
ASPEN’S QUICKTRACKER SOURCES AND TOTAL EMISSIONS1998 to 2008
900,000
800,000
700,000
600,000
500,000
400,000
300,000
200,000
100,000
ASPEN’S TOTAL EMISSIONS1998 to 2050
Commercial Air Travelvia Aspen County Airport
105,681 tons
General Aviation:Jet Aircraft
122,289 tons
Passenger Cars26.8%
-
40,000
20,000
00,000
80,000
60,000
40,000
20,000
$9
$8
$7
$6
$5
$4
$3
$2
-
2.0
1.8
1.6
1.4
1.2
1.0
0.8
0.6
0.4
0.2
Figure 7. Buildings emissions 2007
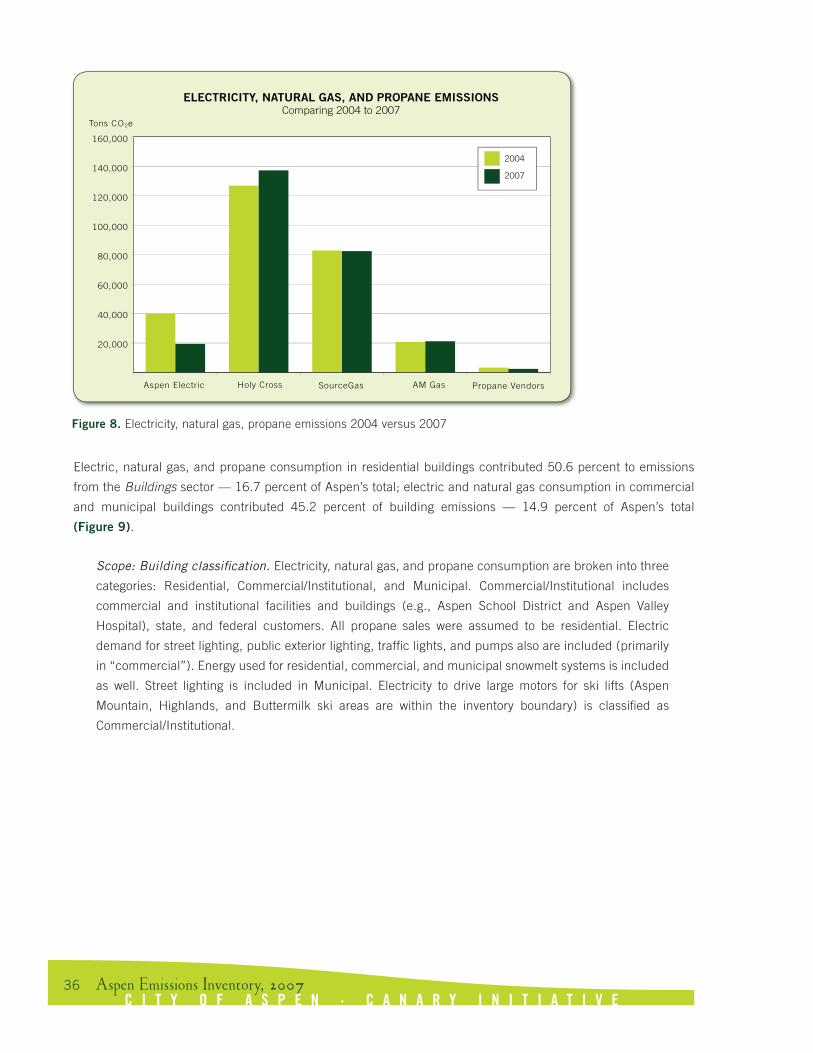
C I T Y O F A S P E N · C A N A R Y I N I T I A T I V E36
Electric, natural gas, and propane consumption in residential buildings contributed 50.6 percent to emissions
from the Buildings sector — 16.7 percent of Aspen’s total; electric and natural gas consumption in commercial
and municipal buildings contributed 45.2 percent of building emissions — 14.9 percent of Aspen’s total
(Figure 9).
Scope: Building classification. Electricity, natural gas, and propane consumption are broken into three
categories: Residential, Commercial/Institutional, and Municipal. Commercial/Institutional includes
commercial and institutional facilities and buildings (e.g., Aspen School District and Aspen Valley
Hospital), state, and federal customers. All propane sales were assumed to be residential. Electric
demand for street lighting, public exterior lighting, traffic lights, and pumps also are included (primarily
in “commercial”). Energy used for residential, commercial, and municipal snowmelt systems is included
as well. Street lighting is included in Municipal. Electricity to drive large motors for ski lifts (Aspen
Mountain, Highlands, and Buttermilk ski areas are within the inventory boundary) is classified as
Commercial/Institutional.
Figure 8. Electricity, natural gas, propane emissions 2004 versus 2007
10,000
20,000
30,000
40,000
50,000
60,000
70,000
Tons CO2e
Passenger Cars
(Sedans, Cabriolets)
Small SUVs and
Small Trucks
Medium/LargeSUVs &
Large “Light”Trucks
2-Axle Medium Duty Trucks & RVs
3-Axle Trucks,Dump Trucks
Semis,ComboTrucks
Motor-cycles
TOTAL GREENHOUSE GAS EMISSIONSComparing 2004 to 2007
Tons CO2e
Tons CO2e
ELECTRICITY, NATURAL GAS, AND PROPANE EMISSIONSComparing 2004 to 2007
MAJOR SOURCES OF EMISSIONS2007
AIR TRAVEL AND AVIATION EMISSIONSComparing 2004 to 2007
ELECTRICITY CONSUMPTIONComparing 2004 to 2007
MAJOR EMISSIONS SOURCESComparing 2004 to 2007
MAJOR GROUND TRANSPORTATION EMISSIONSComparing 2004 to 2007
Tons CO2e
Tons CO2e
Tons CO2e
kWh
160,000
140,000
120,000
100,000
80,000
60,000
40,000
20,000
Aspen Electric AM Gas Propane VendorsHoly Cross SourceGas
160,000
140,000
120,000
100,000
80,000
60,000
40,000
20,000
180,000
160,000
140,000
120,000
100,000
80,000
60,000
40,000
20,000
140,000
120,000
100,000
80,000
60,000
40,000
20,000
Aspen Electric Holy Cross
180,000,000
160,000,000
140,000,000
120,000,000
100,000,000
80,000,000
60,000,000
40,000,000
20,000,000
2004
2007
2004
2007
2004
2007
2004
2007
2004
2007
2004
2007
900,000
800,000
700,000
600,000
500,000
400,000
300,000
200,000
100,000
20072004
GA: Air Ambulance
GA:Piston
GA:Turboprops
GA: JetsAir Travelvia OtherAirports
Air Travelvia Aspen
LandfillMethane
GA: JetsAir Travelvia OtherAirports
Air Travelvia Aspen
TouristDriving
AroundTown
CommutingNaturalGas
Electricity
SkiCoDiesel & Gasoline
RFTATourist DrivingAround TownCommuting
Air Travel & Aviation36.4%
Ground Transportation26.8%
Natural Gas & Propane14.0%
9.1% Aspen Electric:
Residential 1.8%
Aspen Electric:Municipal
15.0% Aspen Electric:
Commercial
40.4% Holy Cross: Residential
31.4% Holy Cross:
Commercial
10
20
30
40
50
60
70
80
90
20,000 40,000 80,000 100,000 120,000
Thou
sand
s of
Ton
s CO
2e
Megawatt Hours
60,000
828,648
760,268
Other Sources
Air Travel
Buildings
Commuting
2007
2007
2008
2008
2004
2004
Tons CO2e/yr
Aspen Total EmissionsAir Travel
Buildings
Commuting
Tons CO2e/yr
AIR TRAVEL AND AVIATION, 2007Tons CO2
General Aviation:Air Ambulance
69 tons
Commercial Air Travelvia Regional Airports
41,689 tons
Commercial Air Travelvia Aspen County Airport
105,681 tons
General Aviation:Piston Aircraft
1,039 tons
General Aviation:Turboprops6,147 tons
General Aviation:Jet Aircraft
122,289 tons
ASPEN EMISSIONS: GROUND TRANSPORTATION 2007Tons CO2
2008
2008
ASPEN EMISSIONS: GROUND TRANSPORTATION 2007Tons CO2
Around-Town Driving37,713 tons
Off-Road: SkiCo, Yard Widgets, Construction Equipment
3,339 tons RFTA Buses4,395 tons
Aspen School District371 tons
Commuting, Hwy 82117,242 tons
Pitkin County186 tons
Tourist Road Travel39,211 tons
City of Aspen1,015 tons
VEHICLE TYPE SURVEYAugust 2008
Medium & HeavyTrucks/SUVs
39.1%
Large 2-Axle Trucks2.6%
Large 3-Axle Trucks2.4%
Semis0.7%
Buses (RFTA)1.3%
Motorcycles *0.50.6%
Passenger Cars26.8%
Light Trucks and SUVs26.5%
2004
2007
HIGHWAY 82 AND COMMUTING EMISSIONSComparing 2004 to 2007
2004
2007
GROUND TRANSPORTATIONComparing 2004 to 2007
ASPEN BUILDING EMISSIONS, 2007Gallonsof Fuel
14,000,000
12,000,000
10,000,000
8,000,000
6,000,000
4,000,000
2,000,000
Off-RoadFuel
SkiCoDiesel& Gas
RFTATouristDriving
AroundTown
Commuting
ASPEN’S MAJOR AIR AND GROUND TRANSPORTATION EMISSIONS2007 COST OF ENERGY
Comparing 2004 to 2007140,000
120,000
100,000
80,000
60,000
40,000
20,000
Tons CO2e/yr
GeneralAviation(Jets)
CommercialAir Travelvia Aspen
CommercialAir Travelvia OtherAirports
Commutingvia Hwy 82
Around-TownDriving
TouristRoad Travel
To/From Aspen
Mcf
1,600,000
1,400,000
1,200,000
1,000,000
800,000
600,000
400,000
200,000
AM GasSourceGas
Aspen Electric Carbon Dioxide Methane Nitrous OxideHoly Cross
ELECTRICITY EMISSIONSComparing 2004 to 2007
NATURAL GAS CONSUMPTIONComparing 2004 to 2007
EMISSIONS BY GREENHOUSE GASComparing 2004 to 2007
ASPEN EMISSIONS: MAJOR SOURCES, 2007Tons CO2e
Tons CO2e
160,000
140,000
120,000
100,000
80,000
60,000
40,000
20,000
Tons CO2e
160,000
140,000
120,000
100,000
80,000
60,000
40,000
20,000
Aspen Electric AM Gas Propane VendorsHoly Cross SourceGas
19,298 21,214
137,094
82,350
2,506
2004
2007
Electricity Natural Gas Propane GroundTransportation
Aviation
$90,000,000
$80,000,000
$70,000,000
$60,000,000
$50,000,000
$40,000,000
$30,000,000
$20,000,000
$10,000,000
General Aviation129,537 tons
Commercial Air Travel147,370 tons
All GroundTransportation203,471 tons
Natural Gas andPropane
106,070 tons
Electricity156,392 tons
Landfill and N2O17,414 tons
Tons CO2e
900,000
800,000
700,000
600,000
500,000
400,000
300,000
200,000
100,000
ELECTRICITY EMISSIONS BY COMPANY AND SECTOR, 2007
1998 20302026
Aspen’s 2020 Target:580,054 tons CO2e
20182014201020062002 20342022 20462042 20502038
Aspen’s 2050 Target:165,730 tons CO2e
ELECTRICITY EMISSION FACTORSComparing 2004 to 2007
1.26
1.791.72
0.60
Aspen Electric Holy Cross
2004
2007
lbs CO2e/kWhdel ivered
Electricity20.6%
Landfill2.2% Nitrous Oxide
0.05%
1998 2006200520032002200120001999
900,000
800,000
700,000
600,000
500,000
400,000
300,000
200,000
100,000
ASPEN’S QUICKTRACKER SOURCES AND TOTAL EMISSIONS1998 to 2008
900,000
800,000
700,000
600,000
500,000
400,000
300,000
200,000
100,000
ASPEN’S TOTAL EMISSIONS1998 to 2050
Commercial Air Travelvia Aspen County Airport
105,681 tons
General Aviation:Jet Aircraft
122,289 tons
Passenger Cars26.8%
-
40,000
20,000
00,000
80,000
60,000
40,000
20,000
$9
$8
$7
$6
$5
$4
$3
$2
-
2.0
1.8
1.6
1.4
1.2
1.0
0.8
0.6
0.4
0.2

C I T Y O F A S P E N · C A N A R Y I N I T I A T I V E37
Electricity
Electric emissions in 2007 account for 59.6 percent of the emissions from the Buildings sector. In 2007, Aspen
consumed 224 million kilowatt hours of electricity, a 9.8 percent increase from 2004 (204 million kilowatt hours)
(Figure 9). Despite the significant rise in consumption, electricity emissions decreased to 156,400 tons CO2e, 6.1
percent below the 2004 baseline emissions of 166,600 tons CO2e (Figure 11).
Figure 9. Electricity emissions and consumption, 2007. The area of each circle represents the carbon footprint of each utility’s end-use sector.
10,000
20,000
30,000
40,000
50,000
60,000
70,000
Tons CO2e
Passenger Cars
(Sedans, Cabriolets)
Small SUVs and
Small Trucks
Medium/LargeSUVs &
Large “Light”Trucks
2-Axle Medium Duty Trucks & RVs
3-Axle Trucks,Dump Trucks
Semis,ComboTrucks
Motor-cycles
TOTAL GREENHOUSE GAS EMISSIONSComparing 2004 to 2007
Tons CO2e
Tons CO2e
ELECTRICITY, NATURAL GAS, AND PROPANE EMISSIONSComparing 2004 to 2007
MAJOR SOURCES OF EMISSIONS2007
AIR TRAVEL AND AVIATION EMISSIONSComparing 2004 to 2007
ELECTRICITY CONSUMPTIONComparing 2004 to 2007
MAJOR EMISSIONS SOURCESComparing 2004 to 2007
MAJOR GROUND TRANSPORTATION EMISSIONSComparing 2004 to 2007
Tons CO2e
Tons CO2e
Tons CO2e
kWh
160,000
140,000
120,000
100,000
80,000
60,000
40,000
20,000
Aspen Electric AM Gas Propane VendorsHoly Cross SourceGas
160,000
140,000
120,000
100,000
80,000
60,000
40,000
20,000
180,000
160,000
140,000
120,000
100,000
80,000
60,000
40,000
20,000
140,000
120,000
100,000
80,000
60,000
40,000
20,000
Aspen Electric Holy Cross
180,000,000
160,000,000
140,000,000
120,000,000
100,000,000
80,000,000
60,000,000
40,000,000
20,000,000
2004
2007
2004
2007
2004
2007
2004
2007
2004
2007
2004
2007
900,000
800,000
700,000
600,000
500,000
400,000
300,000
200,000
100,000
20072004
GA: Air Ambulance
GA:Piston
GA:Turboprops
GA: JetsAir Travelvia OtherAirports
Air Travelvia Aspen
LandfillMethane
GA: JetsAir Travelvia OtherAirports
Air Travelvia Aspen
TouristDriving
AroundTown
CommutingNaturalGas
Electricity
SkiCoDiesel & Gasoline
RFTATourist DrivingAround TownCommuting
Air Travel & Aviation36.4%
Ground Transportation26.8%
Natural Gas & Propane14.0%
9.1% Aspen Electric:
Residential 1.8%
Aspen Electric:Municipal
15.0% Aspen Electric:
Commercial
40.4% Holy Cross: Residential
31.4% Holy Cross:Commercial
10
20
30
40
50
60
70
80
90
20,000 40,000 80,000 100,000 120,000
Thou
sand
s of
Ton
s CO
2e
Megawatt Hours
60,000
828,648
760,268
Other Sources
Air Travel
Buildings
Commuting
2007
2007
2008
2008
2004
2004
Tons CO2e/yr
Aspen Total EmissionsAir Travel
Buildings
Commuting
Tons CO2e/yr
AIR TRAVEL AND AVIATION, 2007Tons CO2
General Aviation:Air Ambulance
69 tons
Commercial Air Travelvia Regional Airports
41,689 tons
Commercial Air Travelvia Aspen County Airport
105,681 tons
General Aviation:Piston Aircraft
1,039 tons
General Aviation:Turboprops6,147 tons
General Aviation:Jet Aircraft
122,289 tons
ASPEN EMISSIONS: GROUND TRANSPORTATION 2007Tons CO2
2008
2008
ASPEN EMISSIONS: GROUND TRANSPORTATION 2007Tons CO2
Around-Town Driving37,713 tons
Off-Road: SkiCo, Yard Widgets, Construction Equipment
3,339 tons RFTA Buses4,395 tons
Aspen School District371 tons
Commuting, Hwy 82117,242 tons
Pitkin County186 tons
Tourist Road Travel39,211 tons
City of Aspen1,015 tons
VEHICLE TYPE SURVEYAugust 2008
Medium & HeavyTrucks/SUVs
39.1%
Large 2-Axle Trucks2.6%
Large 3-Axle Trucks2.4%
Semis0.7%
Buses (RFTA)1.3%
Motorcycles *0.50.6%
Passenger Cars26.8%
Light Trucks and SUVs26.5%
2004
2007
HIGHWAY 82 AND COMMUTING EMISSIONSComparing 2004 to 2007
2004
2007
GROUND TRANSPORTATIONComparing 2004 to 2007
ASPEN BUILDING EMISSIONS, 2007Gallonsof Fuel
14,000,000
12,000,000
10,000,000
8,000,000
6,000,000
4,000,000
2,000,000
Off-RoadFuel
SkiCoDiesel& Gas
RFTATouristDriving
AroundTown
Commuting
ASPEN’S MAJOR AIR AND GROUND TRANSPORTATION EMISSIONS2007 COST OF ENERGY
Comparing 2004 to 2007140,000
120,000
100,000
80,000
60,000
40,000
20,000
Tons CO2e/yr
GeneralAviation(Jets)
CommercialAir Travelvia Aspen
CommercialAir Travelvia OtherAirports
Commutingvia Hwy 82
Around-TownDriving
TouristRoad Travel
To/From Aspen
Mcf
1,600,000
1,400,000
1,200,000
1,000,000
800,000
600,000
400,000
200,000
AM GasSourceGas
Aspen Electric Carbon Dioxide Methane Nitrous OxideHoly Cross
ELECTRICITY EMISSIONSComparing 2004 to 2007
NATURAL GAS CONSUMPTIONComparing 2004 to 2007
EMISSIONS BY GREENHOUSE GASComparing 2004 to 2007
ASPEN EMISSIONS: MAJOR SOURCES, 2007Tons CO2e
Tons CO2e
160,000
140,000
120,000
100,000
80,000
60,000
40,000
20,000
Tons CO2e
160,000
140,000
120,000
100,000
80,000
60,000
40,000
20,000
Aspen Electric AM Gas Propane VendorsHoly Cross SourceGas
19,298 21,214
137,094
82,350
2,506
2004
2007
Electricity Natural Gas Propane GroundTransportation
Aviation
$90,000,000
$80,000,000
$70,000,000
$60,000,000
$50,000,000
$40,000,000
$30,000,000
$20,000,000
$10,000,000
General Aviation129,537 tons
Commercial Air Travel147,370 tons
All GroundTransportation203,471 tons
Natural Gas andPropane
106,070 tons
Electricity156,392 tons
Landfill and N2O17,414 tons
Tons CO2e
900,000
800,000
700,000
600,000
500,000
400,000
300,000
200,000
100,000
ELECTRICITY EMISSIONS BY COMPANY AND SECTOR, 2007
1998 20302026
Aspen’s 2020 Target:580,054 tons CO2e
20182014201020062002 20342022 20462042 20502038
Aspen’s 2050 Target:165,730 tons CO2e
ELECTRICITY EMISSION FACTORSComparing 2004 to 2007
1.26
1.791.72
0.60
Aspen Electric Holy Cross
2004
2007
lbs CO2e/kWhdel ivered
Electricity20.6%
Landfill2.2% Nitrous Oxide
0.05%
1998 2006200520032002200120001999
900,000
800,000
700,000
600,000
500,000
400,000
300,000
200,000
100,000
ASPEN’S QUICKTRACKER SOURCES AND TOTAL EMISSIONS1998 to 2008
900,000
800,000
700,000
600,000
500,000
400,000
300,000
200,000
100,000
ASPEN’S TOTAL EMISSIONS1998 to 2050
Commercial Air Travelvia Aspen County Airport
105,681 tons
General Aviation:Jet Aircraft
122,289 tons
Passenger Cars26.8%
-
40,000
20,000
00,000
80,000
60,000
40,000
20,000
$9
$8
$7
$6
$5
$4
$3
$2
-
2.0
1.8
1.6
1.4
1.2
1.0
0.8
0.6
0.4
0.2
Figure 10. Electricity emissions factors, 2004 versus 2007
10,000
20,000
30,000
40,000
50,000
60,000
70,000
Tons CO2e
Passenger Cars
(Sedans, Cabriolets)
Small SUVs and
Small Trucks
Medium/LargeSUVs &
Large “Light”Trucks
2-Axle Medium Duty Trucks & RVs
3-Axle Trucks,Dump Trucks
Semis,ComboTrucks
Motor-cycles
TOTAL GREENHOUSE GAS EMISSIONSComparing 2004 to 2007
Tons CO2e
Tons CO2e
ELECTRICITY, NATURAL GAS, AND PROPANE EMISSIONSComparing 2004 to 2007
MAJOR SOURCES OF EMISSIONS2007
AIR TRAVEL AND AVIATION EMISSIONSComparing 2004 to 2007
ELECTRICITY CONSUMPTIONComparing 2004 to 2007
MAJOR EMISSIONS SOURCESComparing 2004 to 2007
MAJOR GROUND TRANSPORTATION EMISSIONSComparing 2004 to 2007
Tons CO2e
Tons CO2e
Tons CO2e
kWh
160,000
140,000
120,000
100,000
80,000
60,000
40,000
20,000
Aspen Electric AM Gas Propane VendorsHoly Cross SourceGas
160,000
140,000
120,000
100,000
80,000
60,000
40,000
20,000
180,000
160,000
140,000
120,000
100,000
80,000
60,000
40,000
20,000
140,000
120,000
100,000
80,000
60,000
40,000
20,000
Aspen Electric Holy Cross
180,000,000
160,000,000
140,000,000
120,000,000
100,000,000
80,000,000
60,000,000
40,000,000
20,000,000
2004
2007
2004
2007
2004
2007
2004
2007
2004
2007
2004
2007
900,000
800,000
700,000
600,000
500,000
400,000
300,000
200,000
100,000
20072004
GA: Air Ambulance
GA:Piston
GA:Turboprops
GA: JetsAir Travelvia OtherAirports
Air Travelvia Aspen
LandfillMethane
GA: JetsAir Travelvia OtherAirports
Air Travelvia Aspen
TouristDriving
AroundTown
CommutingNaturalGas
Electricity
SkiCoDiesel & Gasoline
RFTATourist DrivingAround TownCommuting
Air Travel & Aviation36.4%
Ground Transportation26.8%
Natural Gas & Propane14.0%
9.1% Aspen Electric:
Residential 1.8%
Aspen Electric:Municipal
15.0% Aspen Electric:
Commercial
40.4% Holy Cross: Residential
31.4% Holy Cross:Commercial
10
20
30
40
50
60
70
80
90
20,000 40,000 80,000 100,000 120,000
Thou
sand
s of
Ton
s CO
2e
Megawatt Hours
60,000
828,648
760,268
Other Sources
Air Travel
Buildings
Commuting
2007
2007
2008
2008
2004
2004
Tons CO2e/yr
Aspen Total EmissionsAir Travel
Buildings
Commuting
Tons CO2e/yr
AIR TRAVEL AND AVIATION, 2007Tons CO2
General Aviation:Air Ambulance
69 tons
Commercial Air Travelvia Regional Airports
41,689 tons
Commercial Air Travelvia Aspen County Airport
105,681 tons
General Aviation:Piston Aircraft
1,039 tons
General Aviation:Turboprops6,147 tons
General Aviation:Jet Aircraft
122,289 tons
ASPEN EMISSIONS: GROUND TRANSPORTATION 2007Tons CO2
2008
2008
ASPEN EMISSIONS: GROUND TRANSPORTATION 2007Tons CO2
Around-Town Driving37,713 tons
Off-Road: SkiCo, Yard Widgets, Construction Equipment
3,339 tons RFTA Buses4,395 tons
Aspen School District371 tons
Commuting, Hwy 82117,242 tons
Pitkin County186 tons
Tourist Road Travel39,211 tons
City of Aspen1,015 tons
VEHICLE TYPE SURVEYAugust 2008
Medium & HeavyTrucks/SUVs
39.1%
Large 2-Axle Trucks2.6%
Large 3-Axle Trucks2.4%
Semis0.7%
Buses (RFTA)1.3%
Motorcycles *0.50.6%
Passenger Cars26.8%
Light Trucks and SUVs26.5%
2004
2007
HIGHWAY 82 AND COMMUTING EMISSIONSComparing 2004 to 2007
2004
2007
GROUND TRANSPORTATIONComparing 2004 to 2007
ASPEN BUILDING EMISSIONS, 2007Gallonsof Fuel
14,000,000
12,000,000
10,000,000
8,000,000
6,000,000
4,000,000
2,000,000
Off-RoadFuel
SkiCoDiesel& Gas
RFTATouristDriving
AroundTown
Commuting
ASPEN’S MAJOR AIR AND GROUND TRANSPORTATION EMISSIONS2007 COST OF ENERGY
Comparing 2004 to 2007140,000
120,000
100,000
80,000
60,000
40,000
20,000
Tons CO2e/yr
GeneralAviation(Jets)
CommercialAir Travelvia Aspen
CommercialAir Travelvia OtherAirports
Commutingvia Hwy 82
Around-TownDriving
TouristRoad Travel
To/From Aspen
Mcf
1,600,000
1,400,000
1,200,000
1,000,000
800,000
600,000
400,000
200,000
AM GasSourceGas
Aspen Electric Carbon Dioxide Methane Nitrous OxideHoly Cross
ELECTRICITY EMISSIONSComparing 2004 to 2007
NATURAL GAS CONSUMPTIONComparing 2004 to 2007
EMISSIONS BY GREENHOUSE GASComparing 2004 to 2007
ASPEN EMISSIONS: MAJOR SOURCES, 2007Tons CO2e
Tons CO2e
160,000
140,000
120,000
100,000
80,000
60,000
40,000
20,000
Tons CO2e
160,000
140,000
120,000
100,000
80,000
60,000
40,000
20,000
Aspen Electric AM Gas Propane VendorsHoly Cross SourceGas
19,298 21,214
137,094
82,350
2,506
2004
2007
Electricity Natural Gas Propane GroundTransportation
Aviation
$90,000,000
$80,000,000
$70,000,000
$60,000,000
$50,000,000
$40,000,000
$30,000,000
$20,000,000
$10,000,000
General Aviation129,537 tons
Commercial Air Travel147,370 tons
All GroundTransportation203,471 tons
Natural Gas andPropane
106,070 tons
Electricity156,392 tons
Landfill and N2O17,414 tons
Tons CO2e
900,000
800,000
700,000
600,000
500,000
400,000
300,000
200,000
100,000
ELECTRICITY EMISSIONS BY COMPANY AND SECTOR, 2007
1998 20302026
Aspen’s 2020 Target:580,054 tons CO2e
20182014201020062002 20342022 20462042 20502038
Aspen’s 2050 Target:165,730 tons CO2e
ELECTRICITY EMISSION FACTORSComparing 2004 to 2007
1.26
1.791.72
0.60
Aspen Electric Holy Cross
2004
2007
lbs CO2e/kWhdel ivered
Electricity20.6%
Landfill2.2% Nitrous Oxide
0.05%
1998 2006200520032002200120001999
900,000
800,000
700,000
600,000
500,000
400,000
300,000
200,000
100,000
ASPEN’S QUICKTRACKER SOURCES AND TOTAL EMISSIONS1998 to 2008
900,000
800,000
700,000
600,000
500,000
400,000
300,000
200,000
100,000
ASPEN’S TOTAL EMISSIONS1998 to 2050
Commercial Air Travelvia Aspen County Airport
105,681 tons
General Aviation:Jet Aircraft
122,289 tons
Passenger Cars26.8%
-
40,000
20,000
00,000
80,000
60,000
40,000
20,000
$9
$8
$7
$6
$5
$4
$3
$2
-
2.0
1.8
1.6
1.4
1.2
1.0
0.8
0.6
0.4
0.2

C I T Y O F A S P E N · C A N A R Y I N I T I A T I V E38
The decline in electric emissions relative to the increase in consumption can be explained by the significant
increase in City of Aspen Electric renewable-energy fuel mix. Aspen Electric increased its renewable-energy
portfolio considerably, from 35.7 percent renewable in 2004 to 65.8 percent in 2007. Adding in nuclear
generation via MEAN (Municipal Energy Agency of Nebraska), which provided 26.8 million of Aspen Electric’s
total supply of 69.3 million kilowatt hours in 2007, bumps the non-carbon fraction up to 72.7 percent.41 The non-
carbon generation mix resulted in a 52.8 percent drop in the utility’s carbon factor (Box 3).42 Electricity demand
from the City utility rose by 1.8 million kilowatt hours (2.9 percent) between 2004 and 2007. Despite the rise in
demand, Aspen Electric’s lower carbon content caused a decrease in emissions of 22,053 tons CO2e (Figure 10).
Holy Cross Energy’s carbon factor decreased slightly from 2004 to 2007. Electric demand for the regional
utility rose by 12.8 percent from 2004 to 2007 (an increase of 18.2 million kilowatt hours), while emissions
increased by 8.1 percent. Holy Cross’s carbon factor decreased from 1.79 lbs CO2e/kWh to 1.72 lbs CO2e/kWh
(Figure 10).
41 Renewable-energy sources include hydropower and wind. Non-carbon sources include nuclear, hydropower, and wind. Aspen Electric generates its own hydropower and buys power from Municipal Energy Agency of Nebraska, of which the generation portfolio includes 18 percent nuclear power.
42 Carbon factors are used to calculate the amount of CO2e produced per unit of energy consumption. For example, consuming 1 kilowatt-hour of electricity supplied by Aspen Electric emits 0.60 pounds of CO2e, whereas consuming 1 kilowatt-hour of electricity supplied by Holy Cross Energy emits 1.72 pounds of CO2e. Transmission and distribution losses are factored into the carbon factor per delivered kilowatt hour of electricity as is fugitive methane for that portion of the fuel mix derived from coal. This methodology is applied to both Aspen Electric and Holy Cross Energy carbon factors.
10,000
20,000
30,000
40,000
50,000
60,000
70,000
Tons CO2e
Passenger Cars
(Sedans, Cabriolets)
Small SUVs and
Small Trucks
Medium/LargeSUVs &
Large “Light”Trucks
2-Axle Medium Duty Trucks & RVs
3-Axle Trucks,Dump Trucks
Semis,ComboTrucks
Motor-cycles
TOTAL GREENHOUSE GAS EMISSIONSComparing 2004 to 2007
Tons CO2e
Tons CO2e
ELECTRICITY, NATURAL GAS, AND PROPANE EMISSIONSComparing 2004 to 2007
MAJOR SOURCES OF EMISSIONS2007
AIR TRAVEL AND AVIATION EMISSIONSComparing 2004 to 2007
ELECTRICITY CONSUMPTIONComparing 2004 to 2007
MAJOR EMISSIONS SOURCESComparing 2004 to 2007
MAJOR GROUND TRANSPORTATION EMISSIONSComparing 2004 to 2007
Tons CO2e
Tons CO2e
Tons CO2e
kWh
160,000
140,000
120,000
100,000
80,000
60,000
40,000
20,000
Aspen Electric AM Gas Propane VendorsHoly Cross SourceGas
160,000
140,000
120,000
100,000
80,000
60,000
40,000
20,000
180,000
160,000
140,000
120,000
100,000
80,000
60,000
40,000
20,000
140,000
120,000
100,000
80,000
60,000
40,000
20,000
Aspen Electric Holy Cross
180,000,000
160,000,000
140,000,000
120,000,000
100,000,000
80,000,000
60,000,000
40,000,000
20,000,000
2004
2007
2004
2007
2004
2007
2004
2007
2004
2007
2004
2007
900,000
800,000
700,000
600,000
500,000
400,000
300,000
200,000
100,000
20072004
GA: Air Ambulance
GA:Piston
GA:Turboprops
GA: JetsAir Travelvia OtherAirports
Air Travelvia Aspen
LandfillMethane
GA: JetsAir Travelvia OtherAirports
Air Travelvia Aspen
TouristDriving
AroundTown
CommutingNaturalGas
Electricity
SkiCoDiesel & Gasoline
RFTATourist DrivingAround TownCommuting
Air Travel & Aviation36.4%
Ground Transportation26.8%
Natural Gas & Propane14.0%
9.1% Aspen Electric:
Residential 1.8%
Aspen Electric:Municipal
15.0% Aspen Electric:
Commercial
40.4% Holy Cross: Residential
31.4% Holy Cross:Commercial
10
20
30
40
50
60
70
80
90
20,000 40,000 80,000 100,000 120,000
Thou
sand
s of
Ton
s CO
2e
Megawatt Hours
60,000
828,648
760,268
Other Sources
Air Travel
Buildings
Commuting
2007
2007
2008
2008
2004
2004
Tons CO2e/yr
Aspen Total EmissionsAir Travel
Buildings
Commuting
Tons CO2e/yr
AIR TRAVEL AND AVIATION, 2007Tons CO2
General Aviation:Air Ambulance
69 tons
Commercial Air Travelvia Regional Airports
41,689 tons
Commercial Air Travelvia Aspen County Airport
105,681 tons
General Aviation:Piston Aircraft
1,039 tons
General Aviation:Turboprops6,147 tons
General Aviation:Jet Aircraft
122,289 tons
ASPEN EMISSIONS: GROUND TRANSPORTATION 2007Tons CO2
2008
2008
ASPEN EMISSIONS: GROUND TRANSPORTATION 2007Tons CO2
Around-Town Driving37,713 tons
Off-Road: SkiCo, Yard Widgets, Construction Equipment
3,339 tons RFTA Buses4,395 tons
Aspen School District371 tons
Commuting, Hwy 82117,242 tons
Pitkin County186 tons
Tourist Road Travel39,211 tons
City of Aspen1,015 tons
VEHICLE TYPE SURVEYAugust 2008
Medium & HeavyTrucks/SUVs
39.1%
Large 2-Axle Trucks2.6%
Large 3-Axle Trucks2.4%
Semis0.7%
Buses (RFTA)1.3%
Motorcycles *0.50.6%
Passenger Cars26.8%
Light Trucks and SUVs26.5%
2004
2007
HIGHWAY 82 AND COMMUTING EMISSIONSComparing 2004 to 2007
2004
2007
GROUND TRANSPORTATIONComparing 2004 to 2007
ASPEN BUILDING EMISSIONS, 2007Gallonsof Fuel
14,000,000
12,000,000
10,000,000
8,000,000
6,000,000
4,000,000
2,000,000
Off-RoadFuel
SkiCoDiesel& Gas
RFTATouristDriving
AroundTown
Commuting
ASPEN’S MAJOR AIR AND GROUND TRANSPORTATION EMISSIONS2007 COST OF ENERGY
Comparing 2004 to 2007140,000
120,000
100,000
80,000
60,000
40,000
20,000
Tons CO2e/yr
GeneralAviation(Jets)
CommercialAir Travelvia Aspen
CommercialAir Travelvia OtherAirports
Commutingvia Hwy 82
Around-TownDriving
TouristRoad Travel
To/From Aspen
Mcf
1,600,000
1,400,000
1,200,000
1,000,000
800,000
600,000
400,000
200,000
AM GasSourceGas
Aspen Electric Carbon Dioxide Methane Nitrous OxideHoly Cross
ELECTRICITY EMISSIONSComparing 2004 to 2007
NATURAL GAS CONSUMPTIONComparing 2004 to 2007
EMISSIONS BY GREENHOUSE GASComparing 2004 to 2007
ASPEN EMISSIONS: MAJOR SOURCES, 2007Tons CO2e
Tons CO2e
160,000
140,000
120,000
100,000
80,000
60,000
40,000
20,000
Tons CO2e
160,000
140,000
120,000
100,000
80,000
60,000
40,000
20,000
Aspen Electric AM Gas Propane VendorsHoly Cross SourceGas
19,298 21,214
137,094
82,350
2,506
2004
2007
Electricity Natural Gas Propane GroundTransportation
Aviation
$90,000,000
$80,000,000
$70,000,000
$60,000,000
$50,000,000
$40,000,000
$30,000,000
$20,000,000
$10,000,000
General Aviation129,537 tons
Commercial Air Travel147,370 tons
All GroundTransportation203,471 tons
Natural Gas andPropane
106,070 tons
Electricity156,392 tons
Landfill and N2O17,414 tons
Tons CO2e
900,000
800,000
700,000
600,000
500,000
400,000
300,000
200,000
100,000
ELECTRICITY EMISSIONS BY COMPANY AND SECTOR, 2007
1998 20302026
Aspen’s 2020 Target:580,054 tons CO2e
20182014201020062002 20342022 20462042 20502038
Aspen’s 2050 Target:165,730 tons CO2e
ELECTRICITY EMISSION FACTORSComparing 2004 to 2007
1.26
1.791.72
0.60
Aspen Electric Holy Cross
2004
2007
lbs CO2e/kWhdel ivered
Electricity20.6%
Landfill2.2% Nitrous Oxide
0.05%
1998 2006200520032002200120001999
900,000
800,000
700,000
600,000
500,000
400,000
300,000
200,000
100,000
ASPEN’S QUICKTRACKER SOURCES AND TOTAL EMISSIONS1998 to 2008
900,000
800,000
700,000
600,000
500,000
400,000
300,000
200,000
100,000
ASPEN’S TOTAL EMISSIONS1998 to 2050
Commercial Air Travelvia Aspen County Airport
105,681 tons
General Aviation:Jet Aircraft
122,289 tons
Passenger Cars26.8%
-
40,000
20,000
00,000
80,000
60,000
40,000
20,000
$9
$8
$7
$6
$5
$4
$3
$2
-
2.0
1.8
1.6
1.4
1.2
1.0
0.8
0.6
0.4
0.2
Figure 11. Electricity emissions by provider 2004 versus 2007

C I T Y O F A S P E N · C A N A R Y I N I T I A T I V E39
Emissions calculation: Electric carbon factors. Electricity used in town emits greenhouse gases
elsewhere, including carbon dioxide emissions from the smokestacks of coal- and natural gas-fired
power plants located in Northern Colorado and the Upper Great Plains. Also included are methane
emissions from the coal mines and natural gas production and distribution supplying coal- and gas-fired
power plants.43 These emissions are included in the 2007 inventory, as they were in the 2004 baseline.
Electricity transmission and distribution losses also are included in the inventory and are estimated at
about 6 percent.
Aspen Electric’s service area within the Emissions Inventory Boundary is much smaller than that of Holy Cross
Energy. In 2007, Holy Cross provided 71.1 percent of the electric demand in the Aspen area, whereas Aspen
Electric provided 28.9 percent of the electricity to the area (a difference of 94.7 million kilowatt hours) (Figure 12). As a result, Holy Cross’s energy portfolio has a much greater impact on Aspen’s emissions than that of Aspen
Electric (Figures 9, 10 and 11).
43 86 percent of associated methane emissions is tied to the production, processing, and transportation of natural gas and is not a measure of SourceGas’s direct methane emissions but rather Aspen’s proportion of the natural gas industry as a whole. Nationally, the leakage rate is 0.57 percent. 14 percent of the methane is from the coal mining regions that supply coal to the power plants generating electricity for Aspen’s customers. Mines in these regions emit 14 to 77 cubic feet of methane per ton of coal mined. See the worksheets in Appendix C for details.
Figure 12. Aspen Electric service territory map. Map by Bridgette Kelly, Aspen/Pitkin County GIS.

C I T Y O F A S P E N · C A N A R Y I N I T I A T I V E40
Residential. Of the building types, residential buildings had the largest increase in electric consumption, up
14.4 percent. Residential buildings consumed 113 million kilowatt hours of electricity in 2007, up from 99 million
kilowatt hours in 2004. Residential buildings accounted for 50.5 percent of Aspen’s electric demand in 2007. In
line with significant increase in consumption, emissions attributed to residential buildings dropped 1.9 percent
compared to 2004 (Figure 9).
Commercial, institutional, & municipal. Commercial/Institutional and Municipal (CI&M) buildings experienced
the smallest increase in demand (up 5.5 percent) while emissions were down 17.3 percent from 2004. CI&M
buildings consumed 111 million kilowatt hours of electricity in 2007, up from 105 million kilowatt hours in 2004.
In 2007, CI&M buildings represented 49.4 percent of Aspen’s electric demand.44 Street lighting is included in
CI&M, as is electricity for large facilities such as ski lifts and the Aspen sanitation plant (Figure 9).45
Irrigation pumps. Of the total electric consumption, irrigation pumps consumed 91,600 kilowatt hours of
electricity, a decrease of 15.1 percent over 2004’s total of 108,000 kilowatt hours.46 In 2007, irrigation pumps
represented 0.04 percent of the electric demand (Figure 9).
44 Of total CI&M electricity demand, municipal uses accounted for 8.9 million kWh in 2004 and 4.2 million kWh in 2007. However, Holy Cross did not disaggregate municipal demand in 2007 (it did in 2004: 4.6 million kWh), which makes a comparison impossible.
45 CMS does not have detailed end-use consumption data on these uses. The Aspen Skiing Company used 19.2 million kWh in 2006/2007 for its on-mountain lifts, facilities, and restaurants — including Snowmass, which is outside our inventory boundary.
46 Irrigation pumps were not classified as a separate category by Holy Cross Energy in 2004 as they were for 2007. For the 2007 inventory, both electric utilities classified irrigation pumps in their own category. This category does not include water pumping energy (e.g., pumping water up Red Mountain well pumps, snowmaking pressure pumps).
Box 3. Aspen Electric
From 2004 to 2007, City of Aspen Electric increased its noncarbon energy portfolio significantly – from 44 to 73 percent noncarbon (36 to 66 percent renewable). In 2007, the municipal utility’s energy portfolio included 45,589,547 kilowatt hours of renewable energy (50,405,547 kilowatt hours noncarbon).
The city-owned utility has plans to become 100 percent renewable. Current renewable projects for the City’s utility include build-ing the Castle Creek hydroelectric plant,
adding 45 kilowatts of solar photovoltaics to help power the water plant, and using geothermal energy to develop a heating and cooling district for the downtown core.
By nearly doubling its renewable-portfolio from 2004 to 2007, the municipal electric utility significantly decreased the amount of carbon emissions per kilowatt hour of electricity consumed. As a result, Aspen Electric played a major role in the emissions decrease between 2004 and 2007.
ASPEN ELECTRIC INCREASES RENEWABLE-ENERGY PORTFOLIO

C I T Y O F A S P E N · C A N A R Y I N I T I A T I V E41
Natural Gas
Natural gas emissions in 2007 represented 39.5 percent of the emissions from the Buildings sector, and 13.6
percent of Aspen’s total emissions. In 2007, Aspen consumed 1.88 billion cubic feet (Bcf) of natural gas, 3.7
percent more than in 2004 (Figure 13). Emissions attributed to natural gas increased modestly from 2004 to
2007, a difference of 135 tons CO2e.
Commercial/Institutional and Municipal categories contributed roughly equally to the total emissions from natural
gas (50.8 percent residential and 49.2 percent Commercial/Institutional and Municipal).
While changes in weather are not included in the inventory, weather affects energy consumption. From 2004
to 2007, the number of heating degree days decreased by 4.8 percent, representing a decrease in heating
requirements in 2007. Despite the decrease, natural gas consumption increased over the period.
Propane
Propane emissions in 2007 represented 0.95 percent of the emissions from the Buildings sector, and 0.33
percent of Aspen’s total emissions. In 2007, Aspen consumed 375,200 gallons of propane, 25 percent less than
in 2004 (500,300 gallons).
The large difference in consumption is likely the result of changes in data availability. Ferrellgas did not provide
propane consumption data in 2004, and it was assumed equal to that of Aspen’s other main propane supplier,
AmeriGas. In 2007, Ferrellgas agreed to provide data. This reporting decreased total propane consumption and
emissions by 24.6 percent. Propane use, however, contributes very little to emissions from the Buildings sector
as well as to Aspen’s total emissions. Emissions attributed to propane decreased a corresponding amount from
2004 to 2007, down 819 tons CO2e.
Propane emissions are chiefly from residential buildings, either for space or water heating. Propane cylinders for
construction jobs during winter are also counted.
Figure 13. Natural gas consumption 2004 versus 2007
10,000
20,000
30,000
40,000
50,000
60,000
70,000
Tons CO2e
Passenger Cars
(Sedans, Cabriolets)
Small SUVs and
Small Trucks
Medium/LargeSUVs &
Large “Light”Trucks
2-Axle Medium Duty Trucks & RVs
3-Axle Trucks,Dump Trucks
Semis,ComboTrucks
Motor-cycles
TOTAL GREENHOUSE GAS EMISSIONSComparing 2004 to 2007
Tons CO2e
Tons CO2e
ELECTRICITY, NATURAL GAS, AND PROPANE EMISSIONSComparing 2004 to 2007
MAJOR SOURCES OF EMISSIONS2007
AIR TRAVEL AND AVIATION EMISSIONSComparing 2004 to 2007
ELECTRICITY CONSUMPTIONComparing 2004 to 2007
MAJOR EMISSIONS SOURCESComparing 2004 to 2007
MAJOR GROUND TRANSPORTATION EMISSIONSComparing 2004 to 2007
Tons CO2e
Tons CO2e
Tons CO2e
kWh
160,000
140,000
120,000
100,000
80,000
60,000
40,000
20,000
Aspen Electric AM Gas Propane VendorsHoly Cross SourceGas
160,000
140,000
120,000
100,000
80,000
60,000
40,000
20,000
180,000
160,000
140,000
120,000
100,000
80,000
60,000
40,000
20,000
140,000
120,000
100,000
80,000
60,000
40,000
20,000
Aspen Electric Holy Cross
180,000,000
160,000,000
140,000,000
120,000,000
100,000,000
80,000,000
60,000,000
40,000,000
20,000,000
2004
2007
2004
2007
2004
2007
2004
2007
2004
2007
2004
2007
900,000
800,000
700,000
600,000
500,000
400,000
300,000
200,000
100,000
20072004
GA: Air Ambulance
GA:Piston
GA:Turboprops
GA: JetsAir Travelvia OtherAirports
Air Travelvia Aspen
LandfillMethane
GA: JetsAir Travelvia OtherAirports
Air Travelvia Aspen
TouristDriving
AroundTown
CommutingNaturalGas
Electricity
SkiCoDiesel & Gasoline
RFTATourist DrivingAround TownCommuting
Air Travel & Aviation36.4%
Ground Transportation26.8%
Natural Gas & Propane14.0%
9.1% Aspen Electric:
Residential 1.8%
Aspen Electric:Municipal
15.0% Aspen Electric:
Commercial
40.4% Holy Cross: Residential
31.4% Holy Cross:Commercial
10
20
30
40
50
60
70
80
90
20,000 40,000 80,000 100,000 120,000
Thou
sand
s of
Ton
s CO
2e
Megawatt Hours
60,000
828,648
760,268
Other Sources
Air Travel
Buildings
Commuting
2007
2007
2008
2008
2004
2004
Tons CO2e/yr
Aspen Total EmissionsAir Travel
Buildings
Commuting
Tons CO2e/yr
AIR TRAVEL AND AVIATION, 2007Tons CO2
General Aviation:Air Ambulance
69 tons
Commercial Air Travelvia Regional Airports
41,689 tons
Commercial Air Travelvia Aspen County Airport
105,681 tons
General Aviation:Piston Aircraft
1,039 tons
General Aviation:Turboprops6,147 tons
General Aviation:Jet Aircraft
122,289 tons
ASPEN EMISSIONS: GROUND TRANSPORTATION 2007Tons CO2
2008
2008
ASPEN EMISSIONS: GROUND TRANSPORTATION 2007Tons CO2
Around-Town Driving37,713 tons
Off-Road: SkiCo, Yard Widgets, Construction Equipment
3,339 tons RFTA Buses4,395 tons
Aspen School District371 tons
Commuting, Hwy 82117,242 tons
Pitkin County186 tons
Tourist Road Travel39,211 tons
City of Aspen1,015 tons
VEHICLE TYPE SURVEYAugust 2008
Medium & HeavyTrucks/SUVs
39.1%
Large 2-Axle Trucks2.6%
Large 3-Axle Trucks2.4%
Semis0.7%
Buses (RFTA)1.3%
Motorcycles *0.50.6%
Passenger Cars26.8%
Light Trucks and SUVs26.5%
2004
2007
HIGHWAY 82 AND COMMUTING EMISSIONSComparing 2004 to 2007
2004
2007
GROUND TRANSPORTATIONComparing 2004 to 2007
ASPEN BUILDING EMISSIONS, 2007Gallonsof Fuel
14,000,000
12,000,000
10,000,000
8,000,000
6,000,000
4,000,000
2,000,000
Off-RoadFuel
SkiCoDiesel& Gas
RFTATouristDriving
AroundTown
Commuting
ASPEN’S MAJOR AIR AND GROUND TRANSPORTATION EMISSIONS2007 COST OF ENERGY
Comparing 2004 to 2007140,000
120,000
100,000
80,000
60,000
40,000
20,000
Tons CO2e/yr
GeneralAviation(Jets)
CommercialAir Travelvia Aspen
CommercialAir Travelvia OtherAirports
Commutingvia Hwy 82
Around-TownDriving
TouristRoad Travel
To/From Aspen
Mcf
1,600,000
1,400,000
1,200,000
1,000,000
800,000
600,000
400,000
200,000
AM GasSourceGas
Aspen Electric Carbon Dioxide Methane Nitrous OxideHoly Cross
ELECTRICITY EMISSIONSComparing 2004 to 2007
NATURAL GAS CONSUMPTIONComparing 2004 to 2007
EMISSIONS BY GREENHOUSE GASComparing 2004 to 2007
ASPEN EMISSIONS: MAJOR SOURCES, 2007Tons CO2e
Tons CO2e
160,000
140,000
120,000
100,000
80,000
60,000
40,000
20,000
Tons CO2e
160,000
140,000
120,000
100,000
80,000
60,000
40,000
20,000
Aspen Electric AM Gas Propane VendorsHoly Cross SourceGas
19,298 21,214
137,094
82,350
2,506
2004
2007
Electricity Natural Gas Propane GroundTransportation
Aviation
$90,000,000
$80,000,000
$70,000,000
$60,000,000
$50,000,000
$40,000,000
$30,000,000
$20,000,000
$10,000,000
General Aviation129,537 tons
Commercial Air Travel147,370 tons
All GroundTransportation203,471 tons
Natural Gas andPropane
106,070 tons
Electricity156,392 tons
Landfill and N2O17,414 tons
Tons CO2e
900,000
800,000
700,000
600,000
500,000
400,000
300,000
200,000
100,000
ELECTRICITY EMISSIONS BY COMPANY AND SECTOR, 2007
1998 20302026
Aspen’s 2020 Target:580,054 tons CO2e
20182014201020062002 20342022 20462042 20502038
Aspen’s 2050 Target:165,730 tons CO2e
ELECTRICITY EMISSION FACTORSComparing 2004 to 2007
1.26
1.791.72
0.60
Aspen Electric Holy Cross
2004
2007
lbs CO2e/kWhdel ivered
Electricity20.6%
Landfill2.2% Nitrous Oxide
0.05%
1998 2006200520032002200120001999
900,000
800,000
700,000
600,000
500,000
400,000
300,000
200,000
100,000
ASPEN’S QUICKTRACKER SOURCES AND TOTAL EMISSIONS1998 to 2008
900,000
800,000
700,000
600,000
500,000
400,000
300,000
200,000
100,000
ASPEN’S TOTAL EMISSIONS1998 to 2050
Commercial Air Travelvia Aspen County Airport
105,681 tons
General Aviation:Jet Aircraft
122,289 tons
Passenger Cars26.8%
-
40,000
20,000
00,000
80,000
60,000
40,000
20,000
$9
$8
$7
$6
$5
$4
$3
$2
-
2.0
1.8
1.6
1.4
1.2
1.0
0.8
0.6
0.4
0.2

C I T Y O F A S P E N · C A N A R Y I N I T I A T I V E42
TRANSPORTATION
The Transportation sector comprises 63.2 percent of Aspen’s total emissions, emitting 480,378 tons CO2e
through the combustion of 46.8 million gallons of gasoline, diesel, and jet fuel. This is a decrease of 11.7 percent
compared to 2004 (Figure 15).
Figure 14. Transportation emissions
Figure 15. Ground transportation emissions 2004 versus 2007
10,000
20,000
30,000
40,000
50,000
60,000
70,000
Tons CO2e
Passenger Cars
(Sedans, Cabriolets)
Small SUVs and
Small Trucks
Medium/LargeSUVs &
Large “Light”Trucks
2-Axle Medium Duty Trucks & RVs
3-Axle Trucks,Dump Trucks
Semis,ComboTrucks
Motor-cycles
TOTAL GREENHOUSE GAS EMISSIONSComparing 2004 to 2007
Tons CO2e
Tons CO2e
ELECTRICITY, NATURAL GAS, AND PROPANE EMISSIONSComparing 2004 to 2007
MAJOR SOURCES OF EMISSIONS2007
AIR TRAVEL AND AVIATION EMISSIONSComparing 2004 to 2007
ELECTRICITY CONSUMPTIONComparing 2004 to 2007
MAJOR EMISSIONS SOURCESComparing 2004 to 2007
MAJOR GROUND TRANSPORTATION EMISSIONSComparing 2004 to 2007
Tons CO2e
Tons CO2e
Tons CO2e
kWh
160,000
140,000
120,000
100,000
80,000
60,000
40,000
20,000
Aspen Electric AM Gas Propane VendorsHoly Cross SourceGas
160,000
140,000
120,000
100,000
80,000
60,000
40,000
20,000
180,000
160,000
140,000
120,000
100,000
80,000
60,000
40,000
20,000
140,000
120,000
100,000
80,000
60,000
40,000
20,000
Aspen Electric Holy Cross
180,000,000
160,000,000
140,000,000
120,000,000
100,000,000
80,000,000
60,000,000
40,000,000
20,000,000
2004
2007
2004
2007
2004
2007
2004
2007
2004
2007
2004
2007
900,000
800,000
700,000
600,000
500,000
400,000
300,000
200,000
100,000
20072004
GA: Air Ambulance
GA:Piston
GA:Turboprops
GA: JetsAir Travelvia OtherAirports
Air Travelvia Aspen
LandfillMethane
GA: JetsAir Travelvia OtherAirports
Air Travelvia Aspen
TouristDriving
AroundTown
CommutingNaturalGas
Electricity
SkiCoDiesel & Gasoline
RFTATourist DrivingAround TownCommuting
Air Travel & Aviation36.4%
Ground Transportation26.8%
Natural Gas & Propane14.0%
9.1% Aspen Electric:
Residential 1.8%
Aspen Electric:Municipal
15.0% Aspen Electric:
Commercial
40.4% Holy Cross: Residential
31.4% Holy Cross:Commercial
10
20
30
40
50
60
70
80
90
20,000 40,000 80,000 100,000 120,000
Thou
sand
s of
Ton
s CO
2e
Megawatt Hours
60,000
828,648
760,268
Other Sources
Air Travel
Buildings
Commuting
2007
2007
2008
2008
2004
2004
Tons CO2e/yr
Aspen Total EmissionsAir Travel
Buildings
Commuting
Tons CO2e/yr
AIR TRAVEL AND AVIATION, 2007Tons CO2
General Aviation:Air Ambulance
69 tons
Commercial Air Travelvia Regional Airports
41,689 tons
Commercial Air Travelvia Aspen County Airport
105,681 tons
General Aviation:Piston Aircraft
1,039 tons
General Aviation:Turboprops6,147 tons
General Aviation:Jet Aircraft
122,289 tons
ASPEN EMISSIONS: GROUND TRANSPORTATION 2007Tons CO2
2008
2008
ASPEN EMISSIONS: GROUND TRANSPORTATION 2007Tons CO2
Around-Town Driving37,713 tons
Off-Road: SkiCo, Yard Widgets, Construction Equipment
3,339 tons RFTA Buses4,395 tons
Aspen School District371 tons
Commuting, Hwy 82117,242 tons
Pitkin County186 tons
Tourist Road Travel39,211 tons
City of Aspen1,015 tons
VEHICLE TYPE SURVEYAugust 2008
Medium & HeavyTrucks/SUVs
39.1%
Large 2-Axle Trucks2.6%
Large 3-Axle Trucks2.4%
Semis0.7%
Buses (RFTA)1.3%
Motorcycles *0.50.6%
Passenger Cars26.8%
Light Trucks and SUVs26.5%
2004
2007
HIGHWAY 82 AND COMMUTING EMISSIONSComparing 2004 to 2007
2004
2007
GROUND TRANSPORTATIONComparing 2004 to 2007
ASPEN BUILDING EMISSIONS, 2007Gallonsof Fuel
14,000,000
12,000,000
10,000,000
8,000,000
6,000,000
4,000,000
2,000,000
Off-RoadFuel
SkiCoDiesel& Gas
RFTATouristDriving
AroundTown
Commuting
ASPEN’S MAJOR AIR AND GROUND TRANSPORTATION EMISSIONS2007 COST OF ENERGY
Comparing 2004 to 2007140,000
120,000
100,000
80,000
60,000
40,000
20,000
Tons CO2e/yr
GeneralAviation(Jets)
CommercialAir Travelvia Aspen
CommercialAir Travelvia OtherAirports
Commutingvia Hwy 82
Around-TownDriving
TouristRoad Travel
To/From Aspen
Mcf
1,600,000
1,400,000
1,200,000
1,000,000
800,000
600,000
400,000
200,000
AM GasSourceGas
Aspen Electric Carbon Dioxide Methane Nitrous OxideHoly Cross
ELECTRICITY EMISSIONSComparing 2004 to 2007
NATURAL GAS CONSUMPTIONComparing 2004 to 2007
EMISSIONS BY GREENHOUSE GASComparing 2004 to 2007
ASPEN EMISSIONS: MAJOR SOURCES, 2007Tons CO2e
Tons CO2e
160,000
140,000
120,000
100,000
80,000
60,000
40,000
20,000
Tons CO2e
160,000
140,000
120,000
100,000
80,000
60,000
40,000
20,000
Aspen Electric AM Gas Propane VendorsHoly Cross SourceGas
19,298 21,214
137,094
82,350
2,506
2004
2007
Electricity Natural Gas Propane GroundTransportation
Aviation
$90,000,000
$80,000,000
$70,000,000
$60,000,000
$50,000,000
$40,000,000
$30,000,000
$20,000,000
$10,000,000
General Aviation129,537 tons
Commercial Air Travel147,370 tons
All GroundTransportation203,471 tons
Natural Gas andPropane
106,070 tons
Electricity156,392 tons
Landfill and N2O17,414 tons
Tons CO2e
900,000
800,000
700,000
600,000
500,000
400,000
300,000
200,000
100,000
ELECTRICITY EMISSIONS BY COMPANY AND SECTOR, 2007
1998 20302026
Aspen’s 2020 Target:580,054 tons CO2e
20182014201020062002 20342022 20462042 20502038
Aspen’s 2050 Target:165,730 tons CO2e
ELECTRICITY EMISSION FACTORSComparing 2004 to 2007
1.26
1.791.72
0.60
Aspen Electric Holy Cross
2004
2007
lbs CO2e/kWhdel ivered
Electricity20.6%
Landfill2.2% Nitrous Oxide
0.05%
1998 2006200520032002200120001999
900,000
800,000
700,000
600,000
500,000
400,000
300,000
200,000
100,000
ASPEN’S QUICKTRACKER SOURCES AND TOTAL EMISSIONS1998 to 2008
900,000
800,000
700,000
600,000
500,000
400,000
300,000
200,000
100,000
ASPEN’S TOTAL EMISSIONS1998 to 2050
Commercial Air Travelvia Aspen County Airport
105,681 tons
General Aviation:Jet Aircraft
122,289 tons
Passenger Cars26.8%
-
40,000
20,000
00,000
80,000
60,000
40,000
20,000
$9
$8
$7
$6
$5
$4
$3
$2
-
2.0
1.8
1.6
1.4
1.2
1.0
0.8
0.6
0.4
0.2

C I T Y O F A S P E N · C A N A R Y I N I T I A T I V E43
Transportation is divided into two main categories: Ground Transportation and Air Travel & Aviation. From 2004
to 2007, Ground Transportation emissions decreased 3.6 percent, equivalent to 7,700 tons CO2e (Figures 15, 19). Air Travel & Aviation emissions decreased by 16.7 percent — a drop of 55,700 tons CO2e (equivalent to
2,183 average Aspen homes) (Figure 16). Ground Transportation emissions comprise 42.4 percent of the total
emissions from the Transportation sector (26.8 percent of Aspen’s total).
Ground transportation. Emissions from ground transportation include Highway 82 commuting fuel and emissions
(inbound and outbound traffic), tourism travel, driving around town, RFTA buses (in-town and valley routes),
construction vehicles, school buses, City and County vehicles, and other fuel use within or attributable to
Aspen, such as Aspen Skiing Company,47 construction equipment, and miscellaneous off-road vehicles such as
snowmobiles and yard equipment. Emissions are calculated on the basis of fuel consumed in each sector, and
exclude upstream emissions.48
Air travel & aviation. Emissions from air travel include both directions of travel at the Aspen-Pitkin County Airport
for both commercial and private planes, as well as a portion of commercial travel at nearby airports including
Eagle/Vail, Grand Junction, and Denver.
47 Snowmass is outside of the Emissions Inventory Boundary. Fuel for snowmobiles and groomers at Aspen Mountain, Highlands, and Buttermilk is included.
48 We have not estimated emissions from the production, refining, storage, and distribution of liquid fuels. Such “wells-to-tank” emissions add 19 percent (diesel) to 27 percent (gasoline) to the fuel combusted by consumers — not including the emissions from energy used by service stations. Nor are the upstream emissions from the fabrication of mega-tons of steel, concrete, and other resources embodied in the oil and fuel-delivery infrastructure.
Figure 16. Air travel emissions 2004 versus 2007
10,000
20,000
30,000
40,000
50,000
60,000
70,000
Tons CO2e
Passenger Cars
(Sedans, Cabriolets)
Small SUVs and
Small Trucks
Medium/LargeSUVs &
Large “Light”Trucks
2-Axle Medium Duty Trucks & RVs
3-Axle Trucks,Dump Trucks
Semis,ComboTrucks
Motor-cycles
TOTAL GREENHOUSE GAS EMISSIONSComparing 2004 to 2007
Tons CO2e
Tons CO2e
ELECTRICITY, NATURAL GAS, AND PROPANE EMISSIONSComparing 2004 to 2007
MAJOR SOURCES OF EMISSIONS2007
AIR TRAVEL AND AVIATION EMISSIONSComparing 2004 to 2007
ELECTRICITY CONSUMPTIONComparing 2004 to 2007
MAJOR EMISSIONS SOURCESComparing 2004 to 2007
MAJOR GROUND TRANSPORTATION EMISSIONSComparing 2004 to 2007
Tons CO2e
Tons CO2e
Tons CO2e
kWh
160,000
140,000
120,000
100,000
80,000
60,000
40,000
20,000
Aspen Electric AM Gas Propane VendorsHoly Cross SourceGas
160,000
140,000
120,000
100,000
80,000
60,000
40,000
20,000
180,000
160,000
140,000
120,000
100,000
80,000
60,000
40,000
20,000
140,000
120,000
100,000
80,000
60,000
40,000
20,000
Aspen Electric Holy Cross
180,000,000
160,000,000
140,000,000
120,000,000
100,000,000
80,000,000
60,000,000
40,000,000
20,000,000
2004
2007
2004
2007
2004
2007
2004
2007
2004
2007
2004
2007
900,000
800,000
700,000
600,000
500,000
400,000
300,000
200,000
100,000
20072004
GA: Air Ambulance
GA:Piston
GA:Turboprops
GA: JetsAir Travelvia OtherAirports
Air Travelvia Aspen
LandfillMethane
GA: JetsAir Travelvia OtherAirports
Air Travelvia Aspen
TouristDriving
AroundTown
CommutingNaturalGas
Electricity
SkiCoDiesel & Gasoline
RFTATourist DrivingAround TownCommuting
Air Travel & Aviation36.4%
Ground Transportation26.8%
Natural Gas & Propane14.0%
9.1% Aspen Electric:
Residential 1.8%
Aspen Electric:Municipal
15.0% Aspen Electric:
Commercial
40.4% Holy Cross: Residential
31.4% Holy Cross:Commercial
10
20
30
40
50
60
70
80
90
20,000 40,000 80,000 100,000 120,000
Thou
sand
s of
Ton
s CO
2e
Megawatt Hours
60,000
828,648
760,268
Other Sources
Air Travel
Buildings
Commuting
2007
2007
2008
2008
2004
2004
Tons CO2e/yr
Aspen Total EmissionsAir Travel
Buildings
Commuting
Tons CO2e/yr
AIR TRAVEL AND AVIATION, 2007Tons CO2
General Aviation:Air Ambulance
69 tons
Commercial Air Travelvia Regional Airports
41,689 tons
Commercial Air Travelvia Aspen County Airport
105,681 tons
General Aviation:Piston Aircraft
1,039 tons
General Aviation:Turboprops6,147 tons
General Aviation:Jet Aircraft
122,289 tons
ASPEN EMISSIONS: GROUND TRANSPORTATION 2007Tons CO2
2008
2008
ASPEN EMISSIONS: GROUND TRANSPORTATION 2007Tons CO2
Around-Town Driving37,713 tons
Off-Road: SkiCo, Yard Widgets, Construction Equipment
3,339 tons RFTA Buses4,395 tons
Aspen School District371 tons
Commuting, Hwy 82117,242 tons
Pitkin County186 tons
Tourist Road Travel39,211 tons
City of Aspen1,015 tons
VEHICLE TYPE SURVEYAugust 2008
Medium & HeavyTrucks/SUVs
39.1%
Large 2-Axle Trucks2.6%
Large 3-Axle Trucks2.4%
Semis0.7%
Buses (RFTA)1.3%
Motorcycles *0.50.6%
Passenger Cars26.8%
Light Trucks and SUVs26.5%
2004
2007
HIGHWAY 82 AND COMMUTING EMISSIONSComparing 2004 to 2007
2004
2007
GROUND TRANSPORTATIONComparing 2004 to 2007
ASPEN BUILDING EMISSIONS, 2007Gallonsof Fuel
14,000,000
12,000,000
10,000,000
8,000,000
6,000,000
4,000,000
2,000,000
Off-RoadFuel
SkiCoDiesel& Gas
RFTATouristDriving
AroundTown
Commuting
ASPEN’S MAJOR AIR AND GROUND TRANSPORTATION EMISSIONS2007 COST OF ENERGY
Comparing 2004 to 2007140,000
120,000
100,000
80,000
60,000
40,000
20,000
Tons CO2e/yr
GeneralAviation(Jets)
CommercialAir Travelvia Aspen
CommercialAir Travelvia OtherAirports
Commutingvia Hwy 82
Around-TownDriving
TouristRoad Travel
To/From Aspen
Mcf
1,600,000
1,400,000
1,200,000
1,000,000
800,000
600,000
400,000
200,000
AM GasSourceGas
Aspen Electric Carbon Dioxide Methane Nitrous OxideHoly Cross
ELECTRICITY EMISSIONSComparing 2004 to 2007
NATURAL GAS CONSUMPTIONComparing 2004 to 2007
EMISSIONS BY GREENHOUSE GASComparing 2004 to 2007
ASPEN EMISSIONS: MAJOR SOURCES, 2007Tons CO2e
Tons CO2e
160,000
140,000
120,000
100,000
80,000
60,000
40,000
20,000
Tons CO2e
160,000
140,000
120,000
100,000
80,000
60,000
40,000
20,000
Aspen Electric AM Gas Propane VendorsHoly Cross SourceGas
19,298 21,214
137,094
82,350
2,506
2004
2007
Electricity Natural Gas Propane GroundTransportation
Aviation
$90,000,000
$80,000,000
$70,000,000
$60,000,000
$50,000,000
$40,000,000
$30,000,000
$20,000,000
$10,000,000
General Aviation129,537 tons
Commercial Air Travel147,370 tons
All GroundTransportation203,471 tons
Natural Gas andPropane
106,070 tons
Electricity156,392 tons
Landfill and N2O17,414 tons
Tons CO2e
900,000
800,000
700,000
600,000
500,000
400,000
300,000
200,000
100,000
ELECTRICITY EMISSIONS BY COMPANY AND SECTOR, 2007
1998 20302026
Aspen’s 2020 Target:580,054 tons CO2e
20182014201020062002 20342022 20462042 20502038
Aspen’s 2050 Target:165,730 tons CO2e
ELECTRICITY EMISSION FACTORSComparing 2004 to 2007
1.26
1.791.72
0.60
Aspen Electric Holy Cross
2004
2007
lbs CO2e/kWhdel ivered
Electricity20.6%
Landfill2.2% Nitrous Oxide
0.05%
1998 2006200520032002200120001999
900,000
800,000
700,000
600,000
500,000
400,000
300,000
200,000
100,000
ASPEN’S QUICKTRACKER SOURCES AND TOTAL EMISSIONS1998 to 2008
900,000
800,000
700,000
600,000
500,000
400,000
300,000
200,000
100,000
ASPEN’S TOTAL EMISSIONS1998 to 2050
Commercial Air Travelvia Aspen County Airport
105,681 tons
General Aviation:Jet Aircraft
122,289 tons
Passenger Cars26.8%
-
40,000
20,000
00,000
80,000
60,000
40,000
20,000
$9
$8
$7
$6
$5
$4
$3
$2
-
2.0
1.8
1.6
1.4
1.2
1.0
0.8
0.6
0.4
0.2

C I T Y O F A S P E N · C A N A R Y I N I T I A T I V E44
Ground Transportation
Highway 82. In 2007, 57.6 percent of Ground Transportation emissions (15.5 percent of Aspen’s total emissions)
were from private and commercial vehicles traveling on Highway 82. Highway 82 traffic consumed 11.8 million
gallons of fuel, a 6.8 percent decrease over 2004’s total of 12.6 million gallons (Figure 17).
Transit buses. The amount of fuel consumed by RFTA buses (and allocated to Aspen) increased to 439,040
gallons of diesel fuel, a 50 percent increase in fuel use (up from 291,989 gallons in 2004). Most of this difference
is attributable to better data which allocates a higher percentage of valley riders to Aspen. In 2007, 2.2 percent
of Ground Transportation emissions (0.6 percent of Aspen’s emissions) were from RFTA transit buses, with
emissions from buses totaling 4,395 tons of CO2e, an increase of 1,256 tons CO2e. This increase is somewhat
mitigated by RFTA’s higher usage of biodiesel, which increased from 5 percent to 13.4 percent biodiesel averaged
over each year’s total fuel consumption (Box 4).49
49 Nearly all of the increased fuel consumption and emissions is due to revising the RFTA methodology. CMS, in consultation with Dan Blankenship, attributed 71.6 percent of RFTA’s valley routes to Aspen (compared to 39.1 percent in 2004). While CMS did not revise the 2004 Inventory, a re-calculation shows that RFTA’s fuel use was 417,212 gallons and emissions totaled 4,486 tons CO2e – or a decrease of 90 tons CO2e in 2007, chiefly due to the agency’s higher use of biodiesel in 2007.
Figure 17. Highway 82 and commuting emissions
10,000
20,000
30,000
40,000
50,000
60,000
70,000
Tons CO2e
Passenger Cars
(Sedans, Cabriolets)
Small SUVs and
Small Trucks
Medium/LargeSUVs &
Large “Light”Trucks
2-Axle Medium Duty Trucks & RVs
3-Axle Trucks,Dump Trucks
Semis,ComboTrucks
Motor-cycles
TOTAL GREENHOUSE GAS EMISSIONSComparing 2004 to 2007
Tons CO2e
Tons CO2e
ELECTRICITY, NATURAL GAS, AND PROPANE EMISSIONSComparing 2004 to 2007
MAJOR SOURCES OF EMISSIONS2007
AIR TRAVEL AND AVIATION EMISSIONSComparing 2004 to 2007
ELECTRICITY CONSUMPTIONComparing 2004 to 2007
MAJOR EMISSIONS SOURCESComparing 2004 to 2007
MAJOR GROUND TRANSPORTATION EMISSIONSComparing 2004 to 2007
Tons CO2e
Tons CO2e
Tons CO2e
kWh
160,000
140,000
120,000
100,000
80,000
60,000
40,000
20,000
Aspen Electric AM Gas Propane VendorsHoly Cross SourceGas
160,000
140,000
120,000
100,000
80,000
60,000
40,000
20,000
180,000
160,000
140,000
120,000
100,000
80,000
60,000
40,000
20,000
140,000
120,000
100,000
80,000
60,000
40,000
20,000
Aspen Electric Holy Cross
180,000,000
160,000,000
140,000,000
120,000,000
100,000,000
80,000,000
60,000,000
40,000,000
20,000,000
2004
2007
2004
2007
2004
2007
2004
2007
2004
2007
2004
2007
900,000
800,000
700,000
600,000
500,000
400,000
300,000
200,000
100,000
20072004
GA: Air Ambulance
GA:Piston
GA:Turboprops
GA: JetsAir Travelvia OtherAirports
Air Travelvia Aspen
LandfillMethane
GA: JetsAir Travelvia OtherAirports
Air Travelvia Aspen
TouristDriving
AroundTown
CommutingNaturalGas
Electricity
SkiCoDiesel & Gasoline
RFTATourist DrivingAround TownCommuting
Air Travel & Aviation36.4%
Ground Transportation26.8%
Natural Gas & Propane14.0%
9.1% Aspen Electric:
Residential 1.8%
Aspen Electric:Municipal
15.0% Aspen Electric:
Commercial
40.4% Holy Cross: Residential
31.4% Holy Cross:Commercial
10
20
30
40
50
60
70
80
90
20,000 40,000 80,000 100,000 120,000
Thou
sand
s of
Ton
s CO
2e
Megawatt Hours
60,000
828,648
760,268
Other Sources
Air Travel
Buildings
Commuting
2007
2007
2008
2008
2004
2004
Tons CO2e/yr
Aspen Total EmissionsAir Travel
Buildings
Commuting
Tons CO2e/yr
AIR TRAVEL AND AVIATION, 2007Tons CO2
General Aviation:Air Ambulance
69 tons
Commercial Air Travelvia Regional Airports
41,689 tons
Commercial Air Travelvia Aspen County Airport
105,681 tons
General Aviation:Piston Aircraft
1,039 tons
General Aviation:Turboprops6,147 tons
General Aviation:Jet Aircraft
122,289 tons
ASPEN EMISSIONS: GROUND TRANSPORTATION 2007Tons CO2
2008
2008
ASPEN EMISSIONS: GROUND TRANSPORTATION 2007Tons CO2
Around-Town Driving37,713 tons
Off-Road: SkiCo, Yard Widgets, Construction Equipment
3,339 tons RFTA Buses4,395 tons
Aspen School District371 tons
Commuting, Hwy 82117,242 tons
Pitkin County186 tons
Tourist Road Travel39,211 tons
City of Aspen1,015 tons
VEHICLE TYPE SURVEYAugust 2008
Medium & HeavyTrucks/SUVs
39.1%
Large 2-Axle Trucks2.6%
Large 3-Axle Trucks2.4%
Semis0.7%
Buses (RFTA)1.3%
Motorcycles *0.50.6%
Passenger Cars26.8%
Light Trucks and SUVs26.5%
2004
2007
HIGHWAY 82 AND COMMUTING EMISSIONSComparing 2004 to 2007
2004
2007
GROUND TRANSPORTATIONComparing 2004 to 2007
ASPEN BUILDING EMISSIONS, 2007Gallonsof Fuel
14,000,000
12,000,000
10,000,000
8,000,000
6,000,000
4,000,000
2,000,000
Off-RoadFuel
SkiCoDiesel& Gas
RFTATouristDriving
AroundTown
Commuting
ASPEN’S MAJOR AIR AND GROUND TRANSPORTATION EMISSIONS2007 COST OF ENERGY
Comparing 2004 to 2007140,000
120,000
100,000
80,000
60,000
40,000
20,000
Tons CO2e/yr
GeneralAviation(Jets)
CommercialAir Travelvia Aspen
CommercialAir Travelvia OtherAirports
Commutingvia Hwy 82
Around-TownDriving
TouristRoad Travel
To/From Aspen
Mcf
1,600,000
1,400,000
1,200,000
1,000,000
800,000
600,000
400,000
200,000
AM GasSourceGas
Aspen Electric Carbon Dioxide Methane Nitrous OxideHoly Cross
ELECTRICITY EMISSIONSComparing 2004 to 2007
NATURAL GAS CONSUMPTIONComparing 2004 to 2007
EMISSIONS BY GREENHOUSE GASComparing 2004 to 2007
ASPEN EMISSIONS: MAJOR SOURCES, 2007Tons CO2e
Tons CO2e
160,000
140,000
120,000
100,000
80,000
60,000
40,000
20,000
Tons CO2e
160,000
140,000
120,000
100,000
80,000
60,000
40,000
20,000
Aspen Electric AM Gas Propane VendorsHoly Cross SourceGas
19,298 21,214
137,094
82,350
2,506
2004
2007
Electricity Natural Gas Propane GroundTransportation
Aviation
$90,000,000
$80,000,000
$70,000,000
$60,000,000
$50,000,000
$40,000,000
$30,000,000
$20,000,000
$10,000,000
General Aviation129,537 tons
Commercial Air Travel147,370 tons
All GroundTransportation203,471 tons
Natural Gas andPropane
106,070 tons
Electricity156,392 tons
Landfill and N2O17,414 tons
Tons CO2e
900,000
800,000
700,000
600,000
500,000
400,000
300,000
200,000
100,000
ELECTRICITY EMISSIONS BY COMPANY AND SECTOR, 2007
1998 20302026
Aspen’s 2020 Target:580,054 tons CO2e
20182014201020062002 20342022 20462042 20502038
Aspen’s 2050 Target:165,730 tons CO2e
ELECTRICITY EMISSION FACTORSComparing 2004 to 2007
1.26
1.791.72
0.60
Aspen Electric Holy Cross
2004
2007
lbs CO2e/kWhdel ivered
Electricity20.6%
Landfill2.2% Nitrous Oxide
0.05%
1998 2006200520032002200120001999
900,000
800,000
700,000
600,000
500,000
400,000
300,000
200,000
100,000
ASPEN’S QUICKTRACKER SOURCES AND TOTAL EMISSIONS1998 to 2008
900,000
800,000
700,000
600,000
500,000
400,000
300,000
200,000
100,000
ASPEN’S TOTAL EMISSIONS1998 to 2050
Commercial Air Travelvia Aspen County Airport
105,681 tons
General Aviation:Jet Aircraft
122,289 tons
Passenger Cars26.8%
-
40,000
20,000
00,000
80,000
60,000
40,000
20,000
$9
$8
$7
$6
$5
$4
$3
$2
-
2.0
1.8
1.6
1.4
1.2
1.0
0.8
0.6
0.4
0.2

C I T Y O F A S P E N · C A N A R Y I N I T I A T I V E45
Box 4. Transportation
In 2007, the Roaring Fork Transportation Authority (RFTA) kept 961,130 gallons of gasoline from being consumed – an emissions savings of 9,416 tons CO2e, or 28 percent over 2004. RFTA operations avoid fuel use by keeping bus riders from using personal vehicles. Every ton of emissions by a RFTA bus avoids 2.1 tons from personal vehicles.
Bus ridership increased in 2007 by 8.2 percent over 2004, with 3.5 million passengers using the service to get around town and into and out of Aspen. RFTA also greened its fleet, increasing its fleet of hybrid buses to 11 by the end of summer 2007.
BEYOND 2007… By 2013, RFTA will have expanded its service significantly — adding more bus-only lanes, increasing its service, and implementing intelligent-
transportation systems, through the Regional Bus Rapid Transit project. In 2008, one phase of the project was completed, with the construction of new bus-only lanes between Aspen and the Aspen Airport Business Center.1 The improved transit system likely will reduce emissions from the Transportation sector in the Aspen area as well as the Roaring Fork Valley.
Also, in 2008, RFTA and the City of Aspen teamed up to retrofit six in-town shuttle buses with lower-emission diesel engines. Per vehicle, the retrofits decrease particulate-matter pollution by about 90 percent, carbon-monoxide pollution by about 75 percent, and hydrocarbon pollution by about 85 percent – improving air quality significantly.
1 Source: http://www.rftabrt.com (accessed 16 Mar 09)
BUS RIDERSHIP ON THE RISE… AND GREENER

C I T Y O F A S P E N · C A N A R Y I N I T I A T I V E46
Around town. Around-town traffic comprised 18.5 percent of Ground Transportation emissions (5 percent of
Aspen’s total emissions), and consumed 3.8 million gallons of fuel, an increase of 2.9 percent (up 106,000
gallons from 2004). Around-town emissions totaled 37,713 tons of CO2e, up 2.7 percent from 2004.
Emissions calculation: Highway 82 & around town. Highway 82 emissions and around-town driving emissions
are based on (a) the traffic counter at Castle Creek Bridge (which counted 8.15 million vehicles crossing the
bridge in both directions in 2007, down from 8.59 million vehicles in 2004), (b) a vehicle-miles-traveled (VMT)
estimate generated by the Colorado Department of Public Health, which was included in a particulate pollution
report on the City of Aspen (for driving around town), (c) conservative estimates of miles per trip for commuting
on Highway 82, and (d) a vehicle-type survey performed for this analysis.50 Vehicles entering and driving around
Aspen were assigned fuel economy averages (e.g., 7.4 mpg for heavy trucks, 17 mpg for large SUVs, and
22.1 mpg for passenger cars) to generate fuel and emissions estimates (Figure 18). There was a slight increase
in the composite fuel efficiency of the vehicles driving around town and commuting – from 18.6 mpg in 2004 to
19.2 mpg in 2007.
50 Castle Creek Bridge traffic counts from John Krueger (City of Aspen Transportation Department). Colorado Dept of Public Health (2000) PM10 report. Vehicle-type survey conducted at Maroon Creek Bridge on Highway 82 and at the intersection of Cemetery Lane and Power Plant Road in Aspen.
10,000
20,000
30,000
40,000
50,000
60,000
70,000
Tons CO2e
Passenger Cars
(Sedans, Cabriolets)
Small SUVs and
Small Trucks
Medium/LargeSUVs &
Large “Light”Trucks
2-Axle Medium Duty Trucks & RVs
3-Axle Trucks,Dump Trucks
Semis,ComboTrucks
Motor-cycles
TOTAL GREENHOUSE GAS EMISSIONSComparing 2004 to 2007
Tons CO2e
Tons CO2e
ELECTRICITY, NATURAL GAS, AND PROPANE EMISSIONSComparing 2004 to 2007
MAJOR SOURCES OF EMISSIONS2007
AIR TRAVEL AND AVIATION EMISSIONSComparing 2004 to 2007
ELECTRICITY CONSUMPTIONComparing 2004 to 2007
MAJOR EMISSIONS SOURCESComparing 2004 to 2007
MAJOR GROUND TRANSPORTATION EMISSIONSComparing 2004 to 2007
Tons CO2e
Tons CO2e
Tons CO2e
kWh
160,000
140,000
120,000
100,000
80,000
60,000
40,000
20,000
Aspen Electric AM Gas Propane VendorsHoly Cross SourceGas
160,000
140,000
120,000
100,000
80,000
60,000
40,000
20,000
180,000
160,000
140,000
120,000
100,000
80,000
60,000
40,000
20,000
140,000
120,000
100,000
80,000
60,000
40,000
20,000
Aspen Electric Holy Cross
180,000,000
160,000,000
140,000,000
120,000,000
100,000,000
80,000,000
60,000,000
40,000,000
20,000,000
2004
2007
2004
2007
2004
2007
2004
2007
2004
2007
2004
2007
900,000
800,000
700,000
600,000
500,000
400,000
300,000
200,000
100,000
20072004
GA: Air Ambulance
GA:Piston
GA:Turboprops
GA: JetsAir Travelvia OtherAirports
Air Travelvia Aspen
LandfillMethane
GA: JetsAir Travelvia OtherAirports
Air Travelvia Aspen
TouristDriving
AroundTown
CommutingNaturalGas
Electricity
SkiCoDiesel & Gasoline
RFTATourist DrivingAround TownCommuting
Air Travel & Aviation36.4%
Ground Transportation26.8%
Natural Gas & Propane14.0%
9.1% Aspen Electric:
Residential 1.8%
Aspen Electric:Municipal
15.0% Aspen Electric:
Commercial
40.4% Holy Cross: Residential
31.4% Holy Cross:Commercial
10
20
30
40
50
60
70
80
90
20,000 40,000 80,000 100,000 120,000
Thou
sand
s of
Ton
s C
O2e
Megawatt Hours
60,000
828,648
760,268
Other Sources
Air Travel
Buildings
Commuting
2007
2007
2008
2008
2004
2004
Tons CO2e/yr
Aspen Total EmissionsAir Travel
Buildings
Commuting
Tons CO2e/yr
AIR TRAVEL AND AVIATION, 2007Tons CO2
General Aviation:Air Ambulance
69 tons
Commercial Air Travelvia Regional Airports
41,689 tons
Commercial Air Travelvia Aspen County Airport
105,681 tons
General Aviation:Piston Aircraft
1,039 tons
General Aviation:Turboprops6,147 tons
General Aviation:Jet Aircraft
122,289 tons
ASPEN EMISSIONS: GROUND TRANSPORTATION 2007Tons CO2
2008
2008
ASPEN EMISSIONS: GROUND TRANSPORTATION 2007Tons CO2
Around-Town Driving37,713 tons
Off-Road: SkiCo, Yard Widgets, Construction Equipment
3,339 tons RFTA Buses4,395 tons
Aspen School District371 tons
Commuting, Hwy 82117,242 tons
Pitkin County186 tons
Tourist Road Travel39,211 tons
City of Aspen1,015 tons
VEHICLE TYPE SURVEYAugust 2008
Medium & HeavyTrucks/SUVs
39.1%
Large 2-Axle Trucks2.6%
Large 3-Axle Trucks2.4%
Semis0.7%
Buses (RFTA)1.3%
Motorcycles *0.50.6%
Passenger Cars26.8%
Light Trucks and SUVs26.5%
2004
2007
HIGHWAY 82 AND COMMUTING EMISSIONSComparing 2004 to 2007
2004
2007
GROUND TRANSPORTATIONComparing 2004 to 2007
ASPEN BUILDING EMISSIONS, 2007Gallonsof Fuel
14,000,000
12,000,000
10,000,000
8,000,000
6,000,000
4,000,000
2,000,000
Off-RoadFuel
SkiCoDiesel& Gas
RFTATouristDriving
AroundTown
Commuting
ASPEN’S MAJOR AIR AND GROUND TRANSPORTATION EMISSIONS2007 COST OF ENERGY
Comparing 2004 to 2007140,000
120,000
100,000
80,000
60,000
40,000
20,000
Tons CO2e/yr
GeneralAviation(Jets)
CommercialAir Travelvia Aspen
CommercialAir Travelvia OtherAirports
Commutingvia Hwy 82
Around-TownDriving
TouristRoad Travel
To/From Aspen
Mcf
1,600,000
1,400,000
1,200,000
1,000,000
800,000
600,000
400,000
200,000
AM GasSourceGas
Aspen Electric Carbon Dioxide Methane Nitrous OxideHoly Cross
ELECTRICITY EMISSIONSComparing 2004 to 2007
NATURAL GAS CONSUMPTIONComparing 2004 to 2007
EMISSIONS BY GREENHOUSE GASComparing 2004 to 2007
ASPEN EMISSIONS: MAJOR SOURCES, 2007Tons CO2e
Tons CO2e
160,000
140,000
120,000
100,000
80,000
60,000
40,000
20,000
Tons CO2e
160,000
140,000
120,000
100,000
80,000
60,000
40,000
20,000
Aspen Electric AM Gas Propane VendorsHoly Cross SourceGas
19,298 21,214
137,094
82,350
2,506
2004
2007
Electricity Natural Gas Propane GroundTransportation
Aviation
$90,000,000
$80,000,000
$70,000,000
$60,000,000
$50,000,000
$40,000,000
$30,000,000
$20,000,000
$10,000,000
General Aviation129,537 tons
Commercial Air Travel147,370 tons
All GroundTransportation203,471 tons
Natural Gas andPropane
106,070 tons
Electricity156,392 tons
Landfill and N2O17,414 tons
Tons CO2e
900,000
800,000
700,000
600,000
500,000
400,000
300,000
200,000
100,000
ELECTRICITY EMISSIONS BY COMPANY AND SECTOR, 2007
1998 20302026
Aspen’s 2020 Target:580,054 tons CO2e
20182014201020062002 20342022 20462042 20502038
Aspen’s 2050 Target:165,730 tons CO2e
ELECTRICITY EMISSION FACTORSComparing 2004 to 2007
1.26
1.791.72
0.60
Aspen Electric Holy Cross
2004
2007
lbs CO2e/kWhdel ivered
Electricity20.6%
Landfill2.2% Nitrous Oxide
0.05%
1998 2006200520032002200120001999
900,000
800,000
700,000
600,000
500,000
400,000
300,000
200,000
100,000
ASPEN’S QUICKTRACKER SOURCES AND TOTAL EMISSIONS1998 to 2008
900,000
800,000
700,000
600,000
500,000
400,000
300,000
200,000
100,000
ASPEN’S TOTAL EMISSIONS1998 to 2050
Commercial Air Travelvia Aspen County Airport
105,681 tons
General Aviation:Jet Aircraft
122,289 tons
Passenger Cars26.8%
-
40,000
20,000
00,000
80,000
60,000
40,000
20,000
$9
$8
$7
$6
$5
$4
$3
$2
-
2.0
1.8
1.6
1.4
1.2
1.0
0.8
0.6
0.4
0.2
Figure 18. Vehicle type survey
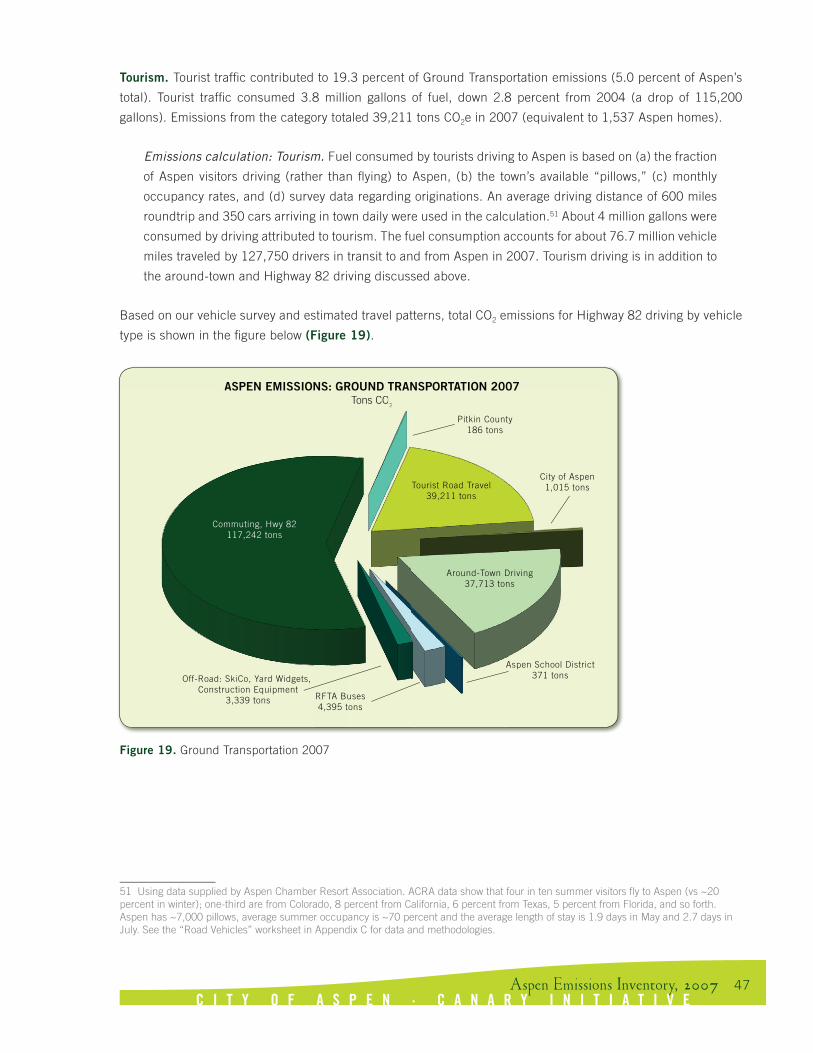
C I T Y O F A S P E N · C A N A R Y I N I T I A T I V E47
Tourism. Tourist traffic contributed to 19.3 percent of Ground Transportation emissions (5.0 percent of Aspen’s
total). Tourist traffic consumed 3.8 million gallons of fuel, down 2.8 percent from 2004 (a drop of 115,200
gallons). Emissions from the category totaled 39,211 tons CO2e in 2007 (equivalent to 1,537 Aspen homes).
Emissions calculation: Tourism. Fuel consumed by tourists driving to Aspen is based on (a) the fraction
of Aspen visitors driving (rather than flying) to Aspen, (b) the town’s available “pillows,” (c) monthly
occupancy rates, and (d) survey data regarding originations. An average driving distance of 600 miles
roundtrip and 350 cars arriving in town daily were used in the calculation.51 About 4 million gallons were
consumed by driving attributed to tourism. The fuel consumption accounts for about 76.7 million vehicle
miles traveled by 127,750 drivers in transit to and from Aspen in 2007. Tourism driving is in addition to
the around-town and Highway 82 driving discussed above.
Based on our vehicle survey and estimated travel patterns, total CO2 emissions for Highway 82 driving by vehicle
type is shown in the figure below (Figure 19).
51 Using data supplied by Aspen Chamber Resort Association. ACRA data show that four in ten summer visitors fly to Aspen (vs ~20 percent in winter); one-third are from Colorado, 8 percent from California, 6 percent from Texas, 5 percent from Florida, and so forth. Aspen has ~7,000 pillows, average summer occupancy is ~70 percent and the average length of stay is 1.9 days in May and 2.7 days in July. See the “Road Vehicles” worksheet in Appendix C for data and methodologies.
Figure 19. Ground Transportation 2007
10,000
20,000
30,000
40,000
50,000
60,000
70,000
Tons CO2e
Passenger Cars
(Sedans, Cabriolets)
Small SUVs and
Small Trucks
Medium/LargeSUVs &
Large “Light”Trucks
2-Axle Medium Duty Trucks & RVs
3-Axle Trucks,Dump Trucks
Semis,ComboTrucks
Motor-cycles
TOTAL GREENHOUSE GAS EMISSIONSComparing 2004 to 2007
Tons CO2e
Tons CO2e
ELECTRICITY, NATURAL GAS, AND PROPANE EMISSIONSComparing 2004 to 2007
MAJOR SOURCES OF EMISSIONS2007
AIR TRAVEL AND AVIATION EMISSIONSComparing 2004 to 2007
ELECTRICITY CONSUMPTIONComparing 2004 to 2007
MAJOR EMISSIONS SOURCESComparing 2004 to 2007
MAJOR GROUND TRANSPORTATION EMISSIONSComparing 2004 to 2007
Tons CO2e
Tons CO2e
Tons CO2e
kWh
160,000
140,000
120,000
100,000
80,000
60,000
40,000
20,000
Aspen Electric AM Gas Propane VendorsHoly Cross SourceGas
160,000
140,000
120,000
100,000
80,000
60,000
40,000
20,000
180,000
160,000
140,000
120,000
100,000
80,000
60,000
40,000
20,000
140,000
120,000
100,000
80,000
60,000
40,000
20,000
Aspen Electric Holy Cross
180,000,000
160,000,000
140,000,000
120,000,000
100,000,000
80,000,000
60,000,000
40,000,000
20,000,000
2004
2007
2004
2007
2004
2007
2004
2007
2004
2007
2004
2007
900,000
800,000
700,000
600,000
500,000
400,000
300,000
200,000
100,000
20072004
GA: Air Ambulance
GA:Piston
GA:Turboprops
GA: JetsAir Travelvia OtherAirports
Air Travelvia Aspen
LandfillMethane
GA: JetsAir Travelvia OtherAirports
Air Travelvia Aspen
TouristDriving
AroundTown
CommutingNaturalGas
Electricity
SkiCoDiesel & Gasoline
RFTATourist DrivingAround TownCommuting
Air Travel & Aviation36.4%
Ground Transportation26.8%
Natural Gas & Propane14.0%
9.1% Aspen Electric:
Residential 1.8%
Aspen Electric:Municipal
15.0% Aspen Electric:
Commercial
40.4% Holy Cross: Residential
31.4% Holy Cross:
Commercial
10
20
30
40
50
60
70
80
90
20,000 40,000 80,000 100,000 120,000
Thou
sand
s of
Ton
s C
O2e
Megawatt Hours
60,000
828,648
760,268
Other Sources
Air Travel
Buildings
Commuting
2007
2007
2008
2008
2004
2004
Tons CO2e/yr
Aspen Total EmissionsAir Travel
Buildings
Commuting
Tons CO2e/yr
AIR TRAVEL AND AVIATION, 2007Tons CO2
General Aviation:Air Ambulance
69 tons
Commercial Air Travelvia Regional Airports
41,689 tons
Commercial Air Travelvia Aspen County Airport
105,681 tons
General Aviation:Piston Aircraft
1,039 tons
General Aviation:Turboprops6,147 tons
General Aviation:Jet Aircraft
122,289 tons
ASPEN EMISSIONS: GROUND TRANSPORTATION 2007Tons CO2
2008
2008
ASPEN EMISSIONS: GROUND TRANSPORTATION 2007Tons CO2
Around-Town Driving37,713 tons
Off-Road: SkiCo, Yard Widgets, Construction Equipment
3,339 tons RFTA Buses4,395 tons
Aspen School District371 tons
Commuting, Hwy 82117,242 tons
Pitkin County186 tons
Tourist Road Travel39,211 tons
City of Aspen1,015 tons
VEHICLE TYPE SURVEYAugust 2008
Medium & HeavyTrucks/SUVs
39.1%
Large 2-Axle Trucks2.6%
Large 3-Axle Trucks2.4%
Semis0.7%
Buses (RFTA)1.3%
Motorcycles *0.50.6%
Passenger Cars26.8%
Light Trucks and SUVs26.5%
2004
2007
HIGHWAY 82 AND COMMUTING EMISSIONSComparing 2004 to 2007
2004
2007
GROUND TRANSPORTATIONComparing 2004 to 2007
ASPEN BUILDING EMISSIONS, 2007Gallonsof Fuel
14,000,000
12,000,000
10,000,000
8,000,000
6,000,000
4,000,000
2,000,000
Off-RoadFuel
SkiCoDiesel& Gas
RFTATouristDriving
AroundTown
Commuting
ASPEN’S MAJOR AIR AND GROUND TRANSPORTATION EMISSIONS2007 COST OF ENERGY
Comparing 2004 to 2007140,000
120,000
100,000
80,000
60,000
40,000
20,000
Tons CO2e/yr
GeneralAviation(Jets)
CommercialAir Travelvia Aspen
CommercialAir Travelvia OtherAirports
Commutingvia Hwy 82
Around-TownDriving
TouristRoad Travel
To/From Aspen
Mcf
1,600,000
1,400,000
1,200,000
1,000,000
800,000
600,000
400,000
200,000
AM GasSourceGas
Aspen Electric Carbon Dioxide Methane Nitrous OxideHoly Cross
ELECTRICITY EMISSIONSComparing 2004 to 2007
NATURAL GAS CONSUMPTIONComparing 2004 to 2007
EMISSIONS BY GREENHOUSE GASComparing 2004 to 2007
ASPEN EMISSIONS: MAJOR SOURCES, 2007Tons CO2e
Tons CO2e
160,000
140,000
120,000
100,000
80,000
60,000
40,000
20,000
Tons CO2e
160,000
140,000
120,000
100,000
80,000
60,000
40,000
20,000
Aspen Electric AM Gas Propane VendorsHoly Cross SourceGas
19,298 21,214
137,094
82,350
2,506
2004
2007
Electricity Natural Gas Propane GroundTransportation
Aviation
$90,000,000
$80,000,000
$70,000,000
$60,000,000
$50,000,000
$40,000,000
$30,000,000
$20,000,000
$10,000,000
General Aviation129,537 tons
Commercial Air Travel147,370 tons
All GroundTransportation203,471 tons
Natural Gas andPropane
106,070 tons
Electricity156,392 tons
Landfill and N2O17,414 tons
Tons CO2e
900,000
800,000
700,000
600,000
500,000
400,000
300,000
200,000
100,000
ELECTRICITY EMISSIONS BY COMPANY AND SECTOR, 2007
1998 20302026
Aspen’s 2020 Target:580,054 tons CO2e
20182014201020062002 20342022 20462042 20502038
Aspen’s 2050 Target:165,730 tons CO2e
ELECTRICITY EMISSION FACTORSComparing 2004 to 2007
1.26
1.791.72
0.60
Aspen Electric Holy Cross
2004
2007
lbs CO2e/kWhdel ivered
Electricity20.6%
Landfill2.2% Nitrous Oxide
0.05%
1998 2006200520032002200120001999
900,000
800,000
700,000
600,000
500,000
400,000
300,000
200,000
100,000
ASPEN’S QUICKTRACKER SOURCES AND TOTAL EMISSIONS1998 to 2008
900,000
800,000
700,000
600,000
500,000
400,000
300,000
200,000
100,000
ASPEN’S TOTAL EMISSIONS1998 to 2050
Commercial Air Travelvia Aspen County Airport
105,681 tons
General Aviation:Jet Aircraft
122,289 tons
Passenger Cars26.8%
-
40,000
20,000
00,000
80,000
60,000
40,000
20,000
$9
$8
$7
$6
$5
$4
$3
$2
-
2.0
1.8
1.6
1.4
1.2
1.0
0.8
0.6
0.4
0.2

C I T Y O F A S P E N · C A N A R Y I N I T I A T I V E48
Other ground transportation. Aspen School District buses and other school vehicles used 35,000 gallons of fuel
and emitted 371 tons CO2 (0.18 percent of Ground Transportation emissions / 0.05 percent of Aspen’s total). City
of Aspen vehicles used 95,400 gallons and contributed 1,015 tons CO2 (0.50 percent of Ground Transportation
/ 0.13 percent of Aspen’s total emissions); Pitkin County vehicles consumed 17,700 gallons of fuel and emitted
186 tons CO2 (0.09 percent of Ground Transportation / 0.02 percent of Aspen’s total emissions).52 The Aspen
Skiing Company consumed 237,350 gallons of diesel and gasoline, emitting 2,263 tons CO2 (1.1 percent of
Ground Transportation / 0.30 percent of Aspen’s total emissions). Off-road and miscellaneous vehicles and uses53
consumed 101,600 gallons of fuel and contributed 1,047 tons CO2 (0.51 percent of Ground Transportation / 0.14
percent of Aspen’s total emissions).
Air Travel & Aviation
Air Travel & Aviation accounts for 58 percent of the emissions from the Transportation sector (36.4 percent of
Aspen’s total), emitting 276,907 tons CO2e, a decrease of 16.7 percent from 2004’s total of 332,247 tons CO2e.
General aviation comprises 47 percent of Air Travel emissions; commercial air travel contributes 53 percent
(Figure 16, 20).
The decrease in Air Travel emissions is, in part, a result of the change in calculation methodology with regard to
dividing air travel into distance segments: regional short-haul flights, domestic flights, and international flights
(see Changes to Methodology). While this accounting change is an improvement, it also reduces emissions over
what the estimate would have been without the change. Also playing a role in the decrease was 2007’s two-month
closure of the Aspen-Pitkin Country Airport from April 9 to June 7. The impact of the runway closure as reduces
emissions by about 8.5 percent of total air travel via Aspen, which is equivalent to about 9,045 tons CO2e.54
A similar calculation has not been made for the impact of the closure on general aviation operations and emissions,
nor do we know whether those “missing” travelers simply flew to Eagle or elsewhere instead, or delayed their trips
and came later in the year.
This inventory excludes the additional climate impact of the fuel combustion emissions and vapor trail formation
of commercial and general aviation operating at high altitudes. This “radiative forcing” (CRF) factor is excluded
in accordance with IPCC, EPA, WRI, and similar inventory protocols, although many air travel calculations do
include RF “emissions.”55
52 The inventory allocates 20 percent of Pitkin County’s gasoline and diesel consumption to Aspen for snowplows, Sheriff, dump trucks, road maintenance vehicles, runway plows and sweepers, etc.
53 Not included in off-road and miscellaneous vehicles are ambulances and Aspen Skiing Company vehicles.
54 Apr-Jun total passenger enplanements and deplanements totaled 60,292 in 2006 and 73,211 in 2008, and 35,851 in 2007 (the airport was open part of Apr07 and most of Jun07). If we normalize Apr-Jun07 to the average of Apr-Jun06&08, we’d expect an additional 30,901 passengers — if the airport was not closed. This adds 8.55 percent to the air travelers via ASE in 2007, and 105,750 tons CO2e x 0.085 = 9,045 tons CO2e.
55 The Canary Initiative air travel calculator (www.aspenzgreen.com/offsets_calculator_air.cfm) includes an option for air travelers to voluntarily add an RF factor to their total air travel estimate. CMS has reviewed the recent science (Samsen, et al., (2005) and Wuebbles (2006)) and estimates an RF factor of 88.9 percent above combustion of jet fuel.

C I T Y O F A S P E N · C A N A R Y I N I T I A T I V E49
Emissions calculation: Air Travel & Aviation. Air Travel & Aviation emissions include both legs of
travel.
Air travel on commercial air carriers. The Aspen Pitkin County Airport compiles data on the number of
enplaning and deplaning passengers by month, carrier, and year; 361,262 total passengers in 2007 vs.
362,556 passengers in 2004.56 Average fuel consumption per passenger-mile flown is used and is divided
into three segments: regional flights between Aspen and Denver (and other flights directly to Aspen from,
for example, Los Angeles, Chicago, and Phoenix), other domestic flights to Denver, and international
flights. Appropriate fuel and emission rates per passenger-mile are applied to total passenger-miles
flown, using 125 miles per passenger flying direct to Aspen, 975 miles for other domestic flights, and
4,875 miles for international flights. Short-haul flights average 0.974 pounds CO2e per passenger-mile,
domestic flights average 0.509 pounds CO2e/passenger-mile, and international flights average 0.375
pounds CO2e/passenger-mile. Aspen’s total of 361,262 arriving and departing passengers fly a total of
643 million passenger-miles, use 14.3 million gallons of jet fuel, and emit 150,973 tons CO2e. Seventy
percent of Aspen’s total is attributed to the Aspen emission inventory boundary, and the remaining 30
percent is allocated to residents and visitors to other areas in the Roaring Fork Valley. Aspen’s total is
thus 105,681 tons CO2e. A similar calculation is made for Aspen-bound residents and visitors flying in
and out of other regional airports, such as Eagle, Grand Junction, and Denver (and presumably driving
from those airports to Aspen, emissions from which are captured in the Highway 82 traffic counts).
Emissions attributed to Aspen for air travel via other airports totals 41,689 tons CO2e.
General Aviation revision. As noted in the Changes to Methodology chapter, the 2004 and 2007
methodology was revised to account for the inclusion of commercial air carrier flights included in
FAA data on General Aviation operations.57 Emissions from air travel on commercial aircraft are not
affected. Commercial air travel emissions are based on passengers enplaning and deplaning at Aspen-
Pitkin County Airport; those data are unchanged. The 2004 numbers referenced in this report and all
comparisons to the baseline reflect the revision to the 2004 baseline inventory.
56 Enplanements and deplanements increased substantially in 2008, to a total 441,289. This 22 percent increase is expected to increase emissions commensurately. See the companion report to this inventory – The Aspen QuickTracker – for details.
57 As revised, Aspen’s total aviation operations decreased from 44,022 landing and takeoffs (LTOs) in 2004 to 42,348 in 2007. Of these, air carrier operations (as revised above) increased from 7,878 LTOs in 2004 to 9,500 LTOs in 2007; total general aviation operations (revised) decreased from 36,144 LTOs in 2004 to 32,848 LTOs in 2007. Air Taxi operations were reduced by 2,645 arriving and departing Mesa flights, reducing the 2004 Air Taxi operations from LTOs to 9,823 LTOs. This reduced General Aviation’s jet and turboprop emissions from a combined 156,643 tons CO2e in 2004 to 144,403 tons CO2e. Total 2004 Air Travel (general aviation and commercial) emissions were reduced from 344,487 to 332,247 tons of CO2e. Aspen’s total 2004 emissions were reduced by 12,240 tons of CO2e (from 840,888 tons to 828,648 tons of CO2e).

C I T Y O F A S P E N · C A N A R Y I N I T I A T I V E50
General Aviation calculation. The FAA tower compiles data on General Aviation and Air Taxi operations
at the Aspen Pitkin County Airport. The inventory estimates that 75 percent of General Aviation
operations are jet aircraft, averages jet aircraft types, assumes (since such data is not tracked) that
the average flight to and from Aspen is 1,000 nautical miles (likely conservative), and estimates that
the average jet consumes 658 gallons per 1,000 nautical mile flight, including start-up, taxi, take-off,
climb, cruise, descent, and landing).58 All jet, turboprop, single- and twin-engine traffic in and out
of Aspen (32,848 operations) consumed and estimated 16.6 million gallons of jet fuel (which emits
20.09 lb CO2e per gallon59), for which emissions totaled 174,699 tons CO2e in 2007. As with air travel,
70 percent is attributed to the Aspen emissions inventory, and 30 percent to elsewhere in the valley.
Similar calculations are made for turboprop aircraft operations, the 45 military flights, air ambulance,
and light piston single- and twin-engine planes. Aspen’s total all General Aviation is thus 129,537 tons
CO2e for 2007.
58 Data was compiled for 106 in-production and out-of-production (but in-service) jet aircraft. The fuel consumption performances of these 106 makes and models (ranging from light to long-range jets) for a 1,000 nautical mile flight averages 658 gallons of jet fuel. Calculations based on Business & Commercial Aviation (2008) Operations Planning Guide.
59 The inventory calculates an emission factor (unlike most jet fuel calculators) that accounts for (a) the carbon content of Jet-A, (b) associated methane and nitrous oxide emissions (although excluding radiative forcing impact of high-altitude aircraft emissions and upstream refinery emissions [which Delucchi, 2003, estimates as ~10 percent additional LCA emissions]), and (c) a 1 percent non-combustion factor, per IPCC. The final result is an emission factor of 21.088 lb CO2e per gallon. This is very close to the typical factor for Jet-A — 21.095 lb CO2e per gallon — that does not account for the net effect of CH4, N2O, and the combustion factor.
10,000
20,000
30,000
40,000
50,000
60,000
70,000
Tons CO2e
Passenger Cars
(Sedans, Cabriolets)
Small SUVs and
Small Trucks
Medium/LargeSUVs &
Large “Light”Trucks
2-Axle Medium Duty Trucks & RVs
3-Axle Trucks,Dump Trucks
Semis,ComboTrucks
Motor-cycles
TOTAL GREENHOUSE GAS EMISSIONSComparing 2004 to 2007
Tons CO2e
Tons CO2e
ELECTRICITY, NATURAL GAS, AND PROPANE EMISSIONSComparing 2004 to 2007
MAJOR SOURCES OF EMISSIONS2007
AIR TRAVEL AND AVIATION EMISSIONSComparing 2004 to 2007
ELECTRICITY CONSUMPTIONComparing 2004 to 2007
MAJOR EMISSIONS SOURCESComparing 2004 to 2007
MAJOR GROUND TRANSPORTATION EMISSIONSComparing 2004 to 2007
Tons CO2e
Tons CO2e
Tons CO2e
kWh
160,000
140,000
120,000
100,000
80,000
60,000
40,000
20,000
Aspen Electric AM Gas Propane VendorsHoly Cross SourceGas
160,000
140,000
120,000
100,000
80,000
60,000
40,000
20,000
180,000
160,000
140,000
120,000
100,000
80,000
60,000
40,000
20,000
140,000
120,000
100,000
80,000
60,000
40,000
20,000
Aspen Electric Holy Cross
180,000,000
160,000,000
140,000,000
120,000,000
100,000,000
80,000,000
60,000,000
40,000,000
20,000,000
2004
2007
2004
2007
2004
2007
2004
2007
2004
2007
2004
2007
900,000
800,000
700,000
600,000
500,000
400,000
300,000
200,000
100,000
20072004
GA: Air Ambulance
GA:Piston
GA:Turboprops
GA: JetsAir Travelvia OtherAirports
Air Travelvia Aspen
LandfillMethane
GA: JetsAir Travelvia OtherAirports
Air Travelvia Aspen
TouristDriving
AroundTown
CommutingNaturalGas
Electricity
SkiCoDiesel & Gasoline
RFTATourist DrivingAround TownCommuting
Air Travel & Aviation36.4%
Ground Transportation26.8%
Natural Gas & Propane14.0%
9.1% Aspen Electric:
Residential 1.8%
Aspen Electric:Municipal
15.0% Aspen Electric:
Commercial
40.4% Holy Cross: Residential
31.4% Holy Cross:Commercial
10
20
30
40
50
60
70
80
90
20,000 40,000 80,000 100,000 120,000
Thou
sand
s of
Ton
s C
O2e
Megawatt Hours
60,000
828,648
760,268
Other Sources
Air Travel
Buildings
Commuting
2007
2007
2008
2008
2004
2004
Tons CO2e/yr
Aspen Total EmissionsAir Travel
Buildings
Commuting
Tons CO2e/yr
AIR TRAVEL AND AVIATION, 2007Tons CO2
General Aviation:Air Ambulance
69 tons
Commercial Air Travelvia Regional Airports
41,689 tons
Commercial Air Travelvia Aspen County Airport
105,681 tons
General Aviation:Piston Aircraft
1,039 tons
General Aviation:Turboprops6,147 tons
General Aviation:Jet Aircraft
122,289 tons
ASPEN EMISSIONS: GROUND TRANSPORTATION 2007Tons CO2
2008
2008
ASPEN EMISSIONS: GROUND TRANSPORTATION 2007Tons CO2
Around-Town Driving37,713 tons
Off-Road: SkiCo, Yard Widgets, Construction Equipment
3,339 tons RFTA Buses4,395 tons
Aspen School District371 tons
Commuting, Hwy 82117,242 tons
Pitkin County186 tons
Tourist Road Travel39,211 tons
City of Aspen1,015 tons
VEHICLE TYPE SURVEYAugust 2008
Medium & HeavyTrucks/SUVs
39.1%
Large 2-Axle Trucks2.6%
Large 3-Axle Trucks2.4%
Semis0.7%
Buses (RFTA)1.3%
Motorcycles *0.50.6%
Passenger Cars26.8%
Light Trucks and SUVs26.5%
2004
2007
HIGHWAY 82 AND COMMUTING EMISSIONSComparing 2004 to 2007
2004
2007
GROUND TRANSPORTATIONComparing 2004 to 2007
ASPEN BUILDING EMISSIONS, 2007Gallonsof Fuel
14,000,000
12,000,000
10,000,000
8,000,000
6,000,000
4,000,000
2,000,000
Off-RoadFuel
SkiCoDiesel& Gas
RFTATouristDriving
AroundTown
Commuting
ASPEN’S MAJOR AIR AND GROUND TRANSPORTATION EMISSIONS2007 COST OF ENERGY
Comparing 2004 to 2007140,000
120,000
100,000
80,000
60,000
40,000
20,000
Tons CO2e/yr
GeneralAviation(Jets)
CommercialAir Travelvia Aspen
CommercialAir Travelvia OtherAirports
Commutingvia Hwy 82
Around-TownDriving
TouristRoad Travel
To/From Aspen
Mcf
1,600,000
1,400,000
1,200,000
1,000,000
800,000
600,000
400,000
200,000
AM GasSourceGas
Aspen Electric Carbon Dioxide Methane Nitrous OxideHoly Cross
ELECTRICITY EMISSIONSComparing 2004 to 2007
NATURAL GAS CONSUMPTIONComparing 2004 to 2007
EMISSIONS BY GREENHOUSE GASComparing 2004 to 2007
ASPEN EMISSIONS: MAJOR SOURCES, 2007Tons CO2e
Tons CO2e
160,000
140,000
120,000
100,000
80,000
60,000
40,000
20,000
Tons CO2e
160,000
140,000
120,000
100,000
80,000
60,000
40,000
20,000
Aspen Electric AM Gas Propane VendorsHoly Cross SourceGas
19,298 21,214
137,094
82,350
2,506
2004
2007
Electricity Natural Gas Propane GroundTransportation
Aviation
$90,000,000
$80,000,000
$70,000,000
$60,000,000
$50,000,000
$40,000,000
$30,000,000
$20,000,000
$10,000,000
General Aviation129,537 tons
Commercial Air Travel147,370 tons
All GroundTransportation203,471 tons
Natural Gas andPropane
106,070 tons
Electricity156,392 tons
Landfill and N2O17,414 tons
Tons CO2e
900,000
800,000
700,000
600,000
500,000
400,000
300,000
200,000
100,000
ELECTRICITY EMISSIONS BY COMPANY AND SECTOR, 2007
1998 20302026
Aspen’s 2020 Target:580,054 tons CO2e
20182014201020062002 20342022 20462042 20502038
Aspen’s 2050 Target:165,730 tons CO2e
ELECTRICITY EMISSION FACTORSComparing 2004 to 2007
1.26
1.791.72
0.60
Aspen Electric Holy Cross
2004
2007
lbs CO2e/kWhdel ivered
Electricity20.6%
Landfill2.2% Nitrous Oxide
0.05%
1998 2006200520032002200120001999
900,000
800,000
700,000
600,000
500,000
400,000
300,000
200,000
100,000
ASPEN’S QUICKTRACKER SOURCES AND TOTAL EMISSIONS1998 to 2008
900,000
800,000
700,000
600,000
500,000
400,000
300,000
200,000
100,000
ASPEN’S TOTAL EMISSIONS1998 to 2050
Commercial Air Travelvia Aspen County Airport
105,681 tons
General Aviation:Jet Aircraft
122,289 tons
Passenger Cars26.8%
-
40,000
20,000
00,000
80,000
60,000
40,000
20,000
$9
$8
$7
$6
$5
$4
$3
$2
-
2.0
1.8
1.6
1.4
1.2
1.0
0.8
0.6
0.4
0.2
Figure 20. Air travel and aviation emissions 2007

C I T Y O F A S P E N · C A N A R Y I N I T I A T I V E51
Commercial air travel. Commercial air travel comprises 31 percent of emissions from the Transportation sector
(20 percent of Aspen’s total), emitting 147,370 tons CO2e, down 21 percent from 2004’s total of 186,631 tons
CO2e. In 2007, commercial air travel attributed to Aspen converted 14 million gallons of jet fuel into carbon
dioxide.
Commercial air travel includes a portion of commercial flights from the Aspen-Pitkin County Airport as well as
other nearby airports.
Aspen-Pitkin County Airport. The inventory estimates that about 65.5 percent of residents and visitors
flying to Aspen use the Aspen-Pitkin County Airport. In 2007, 177,630 passengers departed from and
183,632 passengers arrived at the airport, of which 82 percent were flying domestically, with 18 percent
having international originations and destinations. Of the passengers arriving and departing, 70 percent
are allocated to Aspen with the remainder assumed to have other final destinations. Passenger-miles
allocated to Aspen totaled 450 million miles, consuming 10 million gallons of jet fuel and emitting
105,681 tons CO2e.
Other regional airports. The inventory also includes emissions from the Denver International Airport,
Eagle County Airport, and Grand Junction Regional Airport, estimating that about 34.5 percent of residents
and visitors flying to and from Aspen use these airports. In 2007, 93,560 passengers departed from and
96,720 passengers arrived using these airports to travel to and from Aspen, of which 95 percent were
flying domestically. Total passenger miles allocated to Aspen for travel via other airports was 172 million
miles, consuming 4 million gallons of jet fuel and emitting 41,689 tons CO2e.
General aviation. General aviation comprises 27 percent of emissions from the Transportation sector (17 percent
of Aspen’s total), emitting 129,537 tons CO2e, down 11 percent from 2004’s total of 145,616 tons CO2e (emissions
reductions equivalent to 630 Aspen homes). In 2007, general aviation attributed to Aspen consumed 12.3 million
gallons of jet fuel.
General aviation includes jet turbine aircraft, turboprop planes, air ambulance aircraft (fixed wing and helicopters),
and single- and twin-piston aircraft (local and itinerant, including training, sightseeing, and touch-and-go flights).
Of the general aviation types, jet turbine aircraft contributed the most to Aspen’s total emissions, emitting 122,300
tons CO2e, 94 percent of the general aviation emissions.
Private jets consume large amounts of fuel, contributing significantly to emissions. A Cessna Citation X emits 6.7
tons CO2e during a 1,000 nautical-mile trip, consuming 667 gallons of fuel (an average fuel economy of 1.7 miles
per gallon and 11.6 pounds CO2 per mile). By comparison, the average automobile emits 1.02 pounds CO2 per
mile. With six passengers onboard, the Citation emits 1.9 pounds CO2 per passenger-mile – about equal to the
emissions performance of the Hummer H2 when driven alone.

C I T Y O F A S P E N · C A N A R Y I N I T I A T I V E52
OTHER SOURCES
Pitkin County Solid Waste Center
In 2007, emission from the Pitkin County Solid Waste Center totaled 17,072 tons CO2e (2 percent of Aspen’s
total), 47 percent higher than in 2004. Much of the increase in emissions at the landfill is a result of the significant
rise in estimated fugitive-methane emissions, up 5,468 tons CO2e from 2004 to 2007. The rise is roughly equal
to 214 average Aspen homes.60 The increase is associated with a more than 47.6 percent increase in the total
amount of fugitive methane produced at the landfill. This is the result of a new assessment of methane emissions
from the Landfill that improved the estimate of emission rates rather than a rise in emissions.61
Emissions calculation: Pitkin County Solid Waste Center. The Pitkin County Solid Waste Center serves
Aspen, the Town of Snowmass Village, and Pitkin County east of Basalt. The inventory estimates that
about half of the waste originates in Aspen, and as such allocates half of the landfill’s emission to the
Aspen community.
Making newsprint, cardboard, office paper, and beverage containers from recycled materials uses far less
energy than producing these products from virgin materials, thereby reducing emissions. Diverting these
materials from burial in landfills also reduces methane emissions (Box 5). As in 2004, the greenhouse
gas emissions reductions from recycling are calculated for illustrative purposes but are not deducted
from the 2007 inventory.
By weight, commingled materials represented the largest quantity recycled (38 percent of the total),
including the recycling of glass (65 percent of commingled by weight), steel containers (18 percent),
plastics (10.5 percent), and aluminum (6.5 percent). Of recycling at the landfill, newsprint represents
the largest CO2e savings, accounting for 33 percent of the emissions savings. Per pound of recycled
material, aluminum saves the most energy and emissions, with CO2e emissions savings 15 to 40 times
the weight of the aluminum. Office paper saves about 5 times its weight because of both energy savings
and methane reduction; glass has the lowest per-pound savings, with an emissions benefit equal to
about 40 percent of its weight.
60 The rise in fugitive methane emissions is, in part, a result of the revised global warming potential of methane, according to the Intergovernmental Panel on Climate Change’s Fourth Assessment Report, up from up from 23xCO2 to 25xCO2 (100-yr time horizon).
61 Golder Associates (2007) Landfill Gas Evaluation of the Pitkin County Solid Waste Center, Lakewood CO, 41 p., www.golder.com.

C I T Y O F A S P E N · C A N A R Y I N I T I A T I V E53
Energy and methane. In 2007, energy emissions attributed to Aspen from the Pitkin County Solid Waste Center
(from the consumption of electricity and diesel fuel) are very small, totaling 103 tons CO2e. Emissions from
fugitive methane gas are much more significant, emitting 16,969 tons CO2e. The Golder Associates assessment
estimated a range of methane generation and resulting leakage rates — from 295 to 483 cubic feet of methane
(CH4 ) generated per minute and from 1,128 to 1,587 tons CH4 emitted to the atmosphere. CMS averages annual
emissions to 1,357 tons CH4, which converts to 33,937 tons CO2e (using a global warming potential factor for
methane of 25 times CO2), half of which (16,969 tons CO2e) is attributed to the Aspen community (Box 5).
Waste recovery: Greenhouse gas reductions. In 2007, the Pitkin County Solid Waste Center recycled 5,502
tons of material — a CO2e savings of about 15,268 tons, of which 60 percent is attributed to Aspen (for a total
9,161 tons CO2e) because of the city’s higher recycling rate versus the other entities that use the landfill.62 As
in the 2004 baseline, composting operations were not included as additional savings because of the conflicting
research regarding its emissions benefits.
Nitrous Oxide Emissions
In 2007, 74,205 pounds of nitrogen-based fertilizer were applied to golf courses, athletic fields, parks, and yards
in the Aspen-area, emitting 343 tons CO2e (0.05 percent of Aspen’s total emissions) and just slightly more than
2004’s total nitrous oxide emissions of 325 tons.
Nationwide, nitrous-oxide emissions account for 5.3 percent of greenhouse gas emissions,63 a large portion of
which come from agriculture.
Scope: Nitrous-oxide sources. Consistent with the 2004 baseline, estimates of nitrous-oxide emissions
from downstream suppliers of meat, agricultural foodstuffs, and other “elsewhere” emissions are not
included in the 2007 inventory. The inventory includes emissions estimates from applying nitrogen-
based fertilizers to athletic fields, golf courses, parks, green spaces, and yards within the Emissions
Inventory Boundary.
62 The 60 percent allocation to Aspen is based on an assumed recycling contribution. Additional research would firm up this estimate. The emissions savings rates for each recycled material is from Ackerman, Table 1. Note: these estimates are based on U.S. average emissions savings in an EPA (1998) analysis in which the baseline savings assumes that 40 percent of the methane is recovered (whereas none of the Pitkin County methane is recovered). Estimated savings varies from 0.4 to 15.7 tonnes CO2e per tonne of recycled material (glass and aluminum, respectively), and, for Aspen’s recycling mix, averages 3.9 tonnes CO2e. Note that the EPA/Ackerman analysis is generic and not specific to Aspen’s conditions, trucking distances, volumes, and so forth.
63 U.S. Energy Information Administration. Emissions of Greenhouse Gases Report. www.eia.doe.gov/oiaf/1605/ggrpt/index.html

C I T Y O F A S P E N · C A N A R Y I N I T I A T I V E54
Box 5. Methane
A significant greenhouse gas, methane is 25 times more effective at trapping heat in the atmosphere than CO2 over a 100-year period. Methane has a large impact on temperature over a short time period, while CO2 has a small effect over a longer time frame. Methane’s short lifespan in the atmosphere compared to that of CO2 (approximately 12 years versus more than 100 years), makes it a strong candidate for mitigating climate change in the near-term.1
ASPEN. Methane emissions comprise 4.3 percent of Aspen’s total emissions, including those embodied by electricity generation, fuel combustion, etc.
USES. Biodegradable materials decompose under anaerobic conditions (in the absence of oxygen) into methane, carbon-dioxide gas (CO2), and water vapor, with the aid of microorganisms. Such anaerobic conditions exist at landfills.
Landfill gas can be used as an energy source to generate heat and electricity. Methane gas recovery operations not only provide a constant energy supply (and thereby reduce energy demand from fossil-fuel sources), but also significantly reduce methane emissions from landfills. Gas obtained from landfills has a heating value of 350 to 600 Btu per cubic foot, about half that of natural gas. (The primary component of natural gas is methane.)2
ASPEN AND LANDFILL GAS. A 2007 feasibility study commissioned by the Pitkin County Solid Waste Center concluded that the landfill would not produce enough commercial-grade methane to make developing a landfill gas energy project economically feasible because the methane content of the gas produced is too low.3
1 U.S. EPA. Methane. www.epa.gov/methane2 U.S. EPA. Landfill Methane Outreach Program. www.epa.gov/lmop/faq-3.htm#13 Landfill Gas Evaluation (2007). Pitkin County Solid Waste Center, Aspen, Colorado. [Golder Associates Inc.]
ITS EFFECT ON CLIMATE, MITIGATION, AND ASPEN

C I T Y O F A S P E N · C A N A R Y I N I T I A T I V E55
Since 2004, the Aspen community has made strides toward reducing its greenhouse gas emissions, primarily
through the greening of its municipal electric utility, Aspen Electric. Other efforts include improving the energy
efficiency of buildings. Significant emissions reductions also have been noted in aviation, chiefly from improving
the way air travel and general aviation emissions are calculated as well as a decrease in general aviation
operations.
KEY FINDINGS
Buildings: Electricity, Natural Gas, & Propane
Electricity usage up by 9.8 percent, but emissions down by 6.1 percent, thanks chiefly to Aspen
Electric’s investment in renewable energy and higher hydro-electric production at Ruedi Reservoir,
reducing the municipal utility’s carbon emission factor from 1.26 to 0.60 pounds CO2e per kilowatt hour.
Natural gas usage up 3.7 percent, but emissions up by only 0.13 percent as a result of using
SourceGas’s revised adjustment that accounts for the difference in pressure at higher altitudes.
Propane use down, chiefly because of improved data submission by propane vendors.
Transportation
Fuel use and emissions down in nearly all categories.
Average annual daily traffic counts decreased by 5.2 percent across Castle Creek Bridge, driving
commuting emissions down by 6.7 percent.
Change to methodology and two-month closure of Aspen-Pitkin County Airport contributing to a
drop in fuel use and emissions from air travel.
Other Sources
Increase in landfill fugitive methane emissions, resulting from improved data.
CASE STUDIES
The 2004 baseline inventory analyzed the energy consumption and emissions of several buildings in the Aspen-
area. Some of these facilities, including the Aspen Recreation Center (ARC), Wheeler Opera House, and Aspen
Middle School, have made strides toward improving their energy efficiency, and as a result have reduced their
emissions.
Aspen Recreation Center
Since the 2004 baseline, the ARC has made strides toward energy-efficiency, most notably by improving the
systems that run the facility. The City-owned recreation center reduced its emissions by 6.6 percent from 2004
to 2007. The facility is served by Holy Cross Energy (Box 6).

C I T Y O F A S P E N · C A N A R Y I N I T I A T I V E56
Box 6. Municipal buildings
From 2004 to 2007, the Aspen Recreation Center (ARC) and Wheeler Opera House upgraded the energy efficiency of their facilities, and as a result reduced their consumption of energy and their emissions.
ASPEN RECREATION CENTER. Since the 2004 baseline, the ARC has made strides toward energy-efficiency, most notably by improving the systems that run the facility. Air-to-air heat exchangers (which capture heat from air ventilated from the building and use it to heat incoming air) have saved about 30 percent to date on the recreation center’s natural gas bill. Other improvements include: a reverse-osmosis water purification system for the ice rink, which allows the facility to use less energy to freeze the water; using the heat emitted from the ice rink’s refrigeration system to warm water used for the showers; an innovative heat-exchange system that cycles heated water throughout the building so that it returns to the boiler colder than it otherwise would, which improves the boiler’s condensation efficiency; installing auto-timer and occupancy-sensor lighting as well as low-flow showerheads and toilets and pool covers to reduce heat loss and water lost to evaporation.
Emissions and energy consumption. From 2004 to 2007, the emissions at the ARC dropped by 6.6 percent (from 2,651 tons CO2e in 2004 to 2,476 tons CO2e in 2007).
Since electricity consumption is up 10.5 percent (to 1.9 million kilowatt hours), the decrease in emissions is due to a 20.5 percent decrease in natural gas consumption. Natural gas consumption decreased because of significant improvements to the facility’s heating systems. Electric consumption increased by 10.5 percent over 2004 and electricity emissions increased by 5.1 percent. (The smaller increase in emissions relative to consumption is the result of Holy Cross improving its carbon factor slightly .)
WHEELER OPERA HOUSE. Between 2004 and 2007, the Wheeler Opera House renovated its facility, contributing to its 22 percent decrease in natural gas consumption. Upgrades to the heating systems are largely responsible for the decrease in natural gas consumption. Renovations included installing three new high-efficiency boilers and installing economizers in all the air handlers. The Wheeler also installed high-efficiency lighting in the theater including theatrical LED lighting. The city-owned facility is served by Aspen Electric.
Emissions and energy consumption. From 2004 to 2007, emissions at the Wheeler Opera House decreased by 42 percent (from 504 tons CO2e in 2004 to 293 tons CO2e in 2007). The decrease in Aspen Electric’s carbon factor is largely responsible for the building’s decrease in emissions.
ARC, WHEELER OPERA HOUSE IMPROVE EFFICIENCY, REDUCE CARBON FOOTPRINTS

C I T Y O F A S P E N · C A N A R Y I N I T I A T I V E57
Wheeler Opera House
The Wheeler Opera House renovated its facility starting in 2005, contributing to its 22 percent decrease in natural
gas consumption and 42 percent decrease in emissions from 2004 to 2007. The city-owned facility is served by
Aspen Electric (Box 6).
Aspen School District
The Aspen School District campus (served by Holy Cross Energy) decreased its emissions by 500 tons CO2e
(from 5,007 to 4,507 tons CO2e), a decrease of 10 percent from 2004. Both natural gas and electric emissions
dropped by about 10 percent, with natural gas consumption decreasing by 7 percent and electric consumption
dropping by 6 percent. The school also increased its square footage by 12 percent, including a new middle
school facility.
Aspen Middle School. Aspen Middle School upgraded to a new facility in August 2007. The building became
the first school in Colorado to achieve Leadership in Energy and Environmental Design (LEED) gold certification.
Sustainable strategies at the new school include: daylighting, high-efficiency electric lighting, solar air heating,
occupancy sensors, reflective roofing, waterless urinals, and low-maintenance concrete and linoleum flooring.
The school district also salvaged what it could during the deconstruction of its former middle school facility.
The upgrade increased the middle school’s floor area – from 80,000 square feet in 2004 to 113,000 square feet
in 2007.
Emissions and energy consumption: Aspen Middle School. While emissions at Aspen Middle School
rose by 11 percent from 2004 to 2007, emissions likely will decrease in future years. For much of
2007, during construction of the new facility, both the old and new buildings were consuming electricity
and natural gas. Natural gas was used to heat the new facility during its construction (which included
construction during the winter months) – more than doubling the middle school’s natural gas consumption
that year. As a result, emissions from natural gas rose by 90 percent in 2007. Emissions from electricity
that year, however, decreased by 35 percent.
A fourth-quarter comparison between 2007 and 2004 points to the promise of the new middle school’s
potential energy- and emissions-savings. From September to December 2007, the middle school
consumed 41 percent less natural gas and 45 percent less electricity than it did during the same quarter
in 2004 – an overall emissions savings of 61 percent and 203 tons CO2e. These decreases arose during
the last quarter of 2007 despite the 41 percent increase in the new facility’s square footage over the
previous building.

C I T Y O F A S P E N · C A N A R Y I N I T I A T I V E58
The Canary Action Plan calls for 30 percent reduction in community-wide greenhouse gases emissions below
Aspen’s 2004 baseline by 2020 and a reduction of 80 percent below 2004 by 2050. The goals were based on an
emerging international consensus calling for 80 percent-plus reductions in global emissions to avoid “dangerous”
climate change (variously interpreted as requiring that global temperatures do not rise more than 2°C and that
atmospheric CO2 concentrations do not rise above 450 parts per million (ppm)).64
Let’s state the obvious success: Aspen’s emissions declined by 68,381 tons CO2e from 2004 (828,648 tons CO2e)
to 2007 (760,268 tons CO2e), a decrease of 8.3 percent between 2004 and 2007, or approximately 2.8 percent
annually (Figure 21). Ostensibly, we are meeting our goal — so far. If the Aspen community can maintain this
trend, we will be on track to meet Aspen’s emissions target of 30 percent below the 2004 baseline by 2020.
To meet our community-wide 2020 goal, emissions must decline by 2.4 percent annually (Figure 22).
Aspen’s emissions reduction target means reducing emissions by approximately 18,000 tons per year from
current total of 760,268 tons. From 2004 to 2007, Aspen averaged a reduction of 22,790 tons per year, but only
roughly half were substantive reductions while roughly half were a result of accounting changes.
The reduction task is complicated by the fact that some of the emissions reductions since 2004 have been
“non-recurring” items: that is, are a result of methodological changes in the inventory (such as a required re-
calculation of General Aviation flights (12,400 tons), a revised pressure altitude adjustment for natural gas (3,860
tons), and division of air travel into distance segments (regional, domestic, and international emission factors
together reduced emissions by 15,800 tons)).
64 James Hansen of NASA and others believe that we need to return to an atmospheric CO2 concentration of 350 ppm; we are now at 384 ppm and climbing.
Figure 21. Aspen emissions 1998 to 2008
10,000
20,000
30,000
40,000
50,000
60,000
70,000
Tons CO2e
Passenger Cars
(Sedans, Cabriolets)
Small SUVs and
Small Trucks
Medium/LargeSUVs &
Large “Light”Trucks
2-Axle Medium Duty Trucks & RVs
3-Axle Trucks,Dump Trucks
Semis,ComboTrucks
Motor-cycles
TOTAL GREENHOUSE GAS EMISSIONSComparing 2004 to 2007
Tons CO2e
Tons CO2e
ELECTRICITY, NATURAL GAS, AND PROPANE EMISSIONSComparing 2004 to 2007
MAJOR SOURCES OF EMISSIONS2007
AIR TRAVEL AND AVIATION EMISSIONSComparing 2004 to 2007
ELECTRICITY CONSUMPTIONComparing 2004 to 2007
MAJOR EMISSIONS SOURCESComparing 2004 to 2007
MAJOR GROUND TRANSPORTATION EMISSIONSComparing 2004 to 2007
Tons CO2e
Tons CO2e
Tons CO2e
kWh
160,000
140,000
120,000
100,000
80,000
60,000
40,000
20,000
Aspen Electric AM Gas Propane VendorsHoly Cross SourceGas
160,000
140,000
120,000
100,000
80,000
60,000
40,000
20,000
180,000
160,000
140,000
120,000
100,000
80,000
60,000
40,000
20,000
140,000
120,000
100,000
80,000
60,000
40,000
20,000
Aspen Electric Holy Cross
180,000,000
160,000,000
140,000,000
120,000,000
100,000,000
80,000,000
60,000,000
40,000,000
20,000,000
2004
2007
2004
2007
2004
2007
2004
2007
2004
2007
2004
2007
900,000
800,000
700,000
600,000
500,000
400,000
300,000
200,000
100,000
20072004
GA: Air Ambulance
GA:Piston
GA:Turboprops
GA: JetsAir Travelvia OtherAirports
Air Travelvia Aspen
LandfillMethane
GA: JetsAir Travelvia OtherAirports
Air Travelvia Aspen
TouristDriving
AroundTown
CommutingNaturalGas
Electricity
SkiCoDiesel & Gasoline
RFTATourist DrivingAround TownCommuting
Air Travel & Aviation36.4%
Ground Transportation26.8%
Natural Gas & Propane14.0%
9.1% Aspen Electric:
Residential 1.8%
Aspen Electric:Municipal
15.0% Aspen Electric:
Commercial
40.4% Holy Cross: Residential
31.4% Holy Cross:Commercial
10
20
30
40
50
60
70
80
90
20,000 40,000 80,000 100,000 120,000
Thou
sand
s of
Ton
s C
O2e
Megawatt Hours
60,000
828,648
760,268
Other Sources
Air Travel
Buildings
Commuting
2007
2007
2008
2008
2004
2004
Tons CO2e/yr
Aspen Total EmissionsAir Travel
Buildings
Commuting
Tons CO2e/yr
AIR TRAVEL AND AVIATION, 2007Tons CO2
General Aviation:Air Ambulance
69 tons
Commercial Air Travelvia Regional Airports
41,689 tons
Commercial Air Travelvia Aspen County Airport
105,681 tons
General Aviation:Piston Aircraft
1,039 tons
General Aviation:Turboprops6,147 tons
General Aviation:Jet Aircraft
122,289 tons
ASPEN EMISSIONS: GROUND TRANSPORTATION 2007Tons CO2
2008
2008
ASPEN EMISSIONS: GROUND TRANSPORTATION 2007Tons CO2
Around-Town Driving37,713 tons
Off-Road: SkiCo, Yard Widgets, Construction Equipment
3,339 tons RFTA Buses4,395 tons
Aspen School District371 tons
Commuting, Hwy 82117,242 tons
Pitkin County186 tons
Tourist Road Travel39,211 tons
City of Aspen1,015 tons
VEHICLE TYPE SURVEYAugust 2008
Medium & HeavyTrucks/SUVs
39.1%
Large 2-Axle Trucks2.6%
Large 3-Axle Trucks2.4%
Semis0.7%
Buses (RFTA)1.3%
Motorcycles *0.50.6%
Passenger Cars26.8%
Light Trucks and SUVs26.5%
2004
2007
HIGHWAY 82 AND COMMUTING EMISSIONSComparing 2004 to 2007
2004
2007
GROUND TRANSPORTATIONComparing 2004 to 2007
ASPEN BUILDING EMISSIONS, 2007Gallonsof Fuel
14,000,000
12,000,000
10,000,000
8,000,000
6,000,000
4,000,000
2,000,000
Off-RoadFuel
SkiCoDiesel& Gas
RFTATouristDriving
AroundTown
Commuting
ASPEN’S MAJOR AIR AND GROUND TRANSPORTATION EMISSIONS2007 COST OF ENERGY
Comparing 2004 to 2007140,000
120,000
100,000
80,000
60,000
40,000
20,000
Tons CO2e/yr
GeneralAviation(Jets)
CommercialAir Travelvia Aspen
CommercialAir Travelvia OtherAirports
Commutingvia Hwy 82
Around-TownDriving
TouristRoad Travel
To/From Aspen
Mcf
1,600,000
1,400,000
1,200,000
1,000,000
800,000
600,000
400,000
200,000
AM GasSourceGas
Aspen Electric Carbon Dioxide Methane Nitrous OxideHoly Cross
ELECTRICITY EMISSIONSComparing 2004 to 2007
NATURAL GAS CONSUMPTIONComparing 2004 to 2007
EMISSIONS BY GREENHOUSE GASComparing 2004 to 2007
ASPEN EMISSIONS: MAJOR SOURCES, 2007Tons CO2e
Tons CO2e
160,000
140,000
120,000
100,000
80,000
60,000
40,000
20,000
Tons CO2e
160,000
140,000
120,000
100,000
80,000
60,000
40,000
20,000
Aspen Electric AM Gas Propane VendorsHoly Cross SourceGas
19,298 21,214
137,094
82,350
2,506
2004
2007
Electricity Natural Gas Propane GroundTransportation
Aviation
$90,000,000
$80,000,000
$70,000,000
$60,000,000
$50,000,000
$40,000,000
$30,000,000
$20,000,000
$10,000,000
General Aviation129,537 tons
Commercial Air Travel147,370 tons
All GroundTransportation203,471 tons
Natural Gas andPropane
106,070 tons
Electricity156,392 tons
Landfill and N2O17,414 tons
Tons CO2e
900,000
800,000
700,000
600,000
500,000
400,000
300,000
200,000
100,000
ELECTRICITY EMISSIONS BY COMPANY AND SECTOR, 2007
1998 20302026
Aspen’s 2020 Target:580,054 tons CO2e
20182014201020062002 20342022 20462042 20502038
Aspen’s 2050 Target:165,730 tons CO2e
ELECTRICITY EMISSION FACTORSComparing 2004 to 2007
1.26
1.791.72
0.60
Aspen Electric Holy Cross
2004
2007
lbs CO2e/kWhdel ivered
Electricity20.6%
Landfill2.2% Nitrous Oxide
0.05%
1998 2006200520032002200120001999
900,000
800,000
700,000
600,000
500,000
400,000
300,000
200,000
100,000
ASPEN’S QUICKTRACKER SOURCES AND TOTAL EMISSIONS1998 to 2008
900,000
800,000
700,000
600,000
500,000
400,000
300,000
200,000
100,000
ASPEN’S TOTAL EMISSIONS1998 to 2050
Commercial Air Travelvia Aspen County Airport
105,681 tons
General Aviation:Jet Aircraft
122,289 tons
Passenger Cars26.8%
-
40,000
20,000
00,000
80,000
60,000
40,000
20,000
$9
$8
$7
$6
$5
$4
$3
$2
-
2.0
1.8
1.6
1.4
1.2
1.0
0.8
0.6
0.4
0.2

C I T Y O F A S P E N · C A N A R Y I N I T I A T I V E59
On the plus side, Aspen Electric reduced emissions by 20,500 tons (over three years) by lowering the carbon
content of its power supply. Commuting also is down in terms of traffic counts and the vehicle survey shifted the
distribution toward lighter vehicles, reducing fuel and emissions by 8,500 tons. Airlines improved their average
emission factor by about 11.3 percent (domestic flights declined from 0.574 pounds CO2 per passenger-mile
in 2004 to 0.509 pounds CO2 per passenger-mile in 2007), reducing Aspen emissions by 15,400 tons in the
process.
Future emissions are sensitive to the carbon intensity of electricity supply. Aspen’s municipal electric utility is
on a path toward 100 percent non-carbon electricity.* While the carbon factor for Holy Cross Energy dropped
slightly since 2004, this was likely because of the increased portion of natural gas versus coal in the electricity
it purchased from its supplier. In the fall of 2009, Xcel Energy (which supplies power to Holy Cross Energy) is
scheduled to bring a new 750-megawatt coal-fired power plant (Comanche 3) online. Presumably, Holy Cross
will be purchasing more coal-fired electricity at that point, which would increase emissions if its fuel mix is not
balanced by other non-carbon sources of energy.
Furthermore, electricity consumption by residents and businesses is increasing. Electricity use has risen by about
3.2 percent per year while natural gas consumption has risen 1.2 percent per year. Unlike electric suppliers,
natural gas utilities do not have the option to lower the carbon factor of their fuel mix since it only contains one
fuel. The rate of increased consumption is greater than that of the rate of new construction in Aspen.65 If the
increased rate of electricity and natural gas consumption continues, Aspen’s emissions likely will increase as well.
*However, even this improvement will only reduce emissions by about 19,300 tons.
65 Based on property records in the Tax Assessors database, new construction of residential and commercial buildings added between 35,100 and 442,500 square feet (SF) of heated floor area within City limits between 2004 and 2008. This adds between 0.4 percent and 5.2 percent to each year’s building stock, which stands at 9.09 million SF at year-end 2008. However, demolition of existing buildings is not accounted for, and neither CMS nor the Tax Assessor nor the County or City building departments have a solid idea of the demolition rates, and thus net additions of heated building stock is unknown.
Figure 22. Aspen emissions 1998 to 2008 and achieving 2050 goal
10,000
20,000
30,000
40,000
50,000
60,000
70,000
Tons CO2e
Passenger Cars
(Sedans, Cabriolets)
Small SUVs and
Small Trucks
Medium/LargeSUVs &
Large “Light”Trucks
2-Axle Medium Duty Trucks & RVs
3-Axle Trucks,Dump Trucks
Semis,ComboTrucks
Motor-cycles
TOTAL GREENHOUSE GAS EMISSIONSComparing 2004 to 2007
Tons CO2e
Tons CO2e
ELECTRICITY, NATURAL GAS, AND PROPANE EMISSIONSComparing 2004 to 2007
MAJOR SOURCES OF EMISSIONS2007
AIR TRAVEL AND AVIATION EMISSIONSComparing 2004 to 2007
ELECTRICITY CONSUMPTIONComparing 2004 to 2007
MAJOR EMISSIONS SOURCESComparing 2004 to 2007
MAJOR GROUND TRANSPORTATION EMISSIONSComparing 2004 to 2007
Tons CO2e
Tons CO2e
Tons CO2e
kWh
160,000
140,000
120,000
100,000
80,000
60,000
40,000
20,000
Aspen Electric AM Gas Propane VendorsHoly Cross SourceGas
160,000
140,000
120,000
100,000
80,000
60,000
40,000
20,000
180,000
160,000
140,000
120,000
100,000
80,000
60,000
40,000
20,000
140,000
120,000
100,000
80,000
60,000
40,000
20,000
Aspen Electric Holy Cross
180,000,000
160,000,000
140,000,000
120,000,000
100,000,000
80,000,000
60,000,000
40,000,000
20,000,000
2004
2007
2004
2007
2004
2007
2004
2007
2004
2007
2004
2007
900,000
800,000
700,000
600,000
500,000
400,000
300,000
200,000
100,000
20072004
GA: Air Ambulance
GA:Piston
GA:Turboprops
GA: JetsAir Travelvia OtherAirports
Air Travelvia Aspen
LandfillMethane
GA: JetsAir Travelvia OtherAirports
Air Travelvia Aspen
TouristDriving
AroundTown
CommutingNaturalGas
Electricity
SkiCoDiesel & Gasoline
RFTATourist DrivingAround TownCommuting
Air Travel & Aviation36.4%
Ground Transportation26.8%
Natural Gas & Propane14.0%
9.1% Aspen Electric:
Residential 1.8%
Aspen Electric:Municipal
15.0% Aspen Electric:
Commercial
40.4% Holy Cross: Residential
31.4% Holy Cross:Commercial
10
20
30
40
50
60
70
80
90
20,000 40,000 80,000 100,000 120,000
Thou
sand
s of
Ton
s C
O2e
Megawatt Hours
60,000
828,648
760,268
Other Sources
Air Travel
Buildings
Commuting
2007
2007
2008
2008
2004
2004
Tons CO2e/yr
Aspen Total EmissionsAir Travel
Buildings
Commuting
Tons CO2e/yr
AIR TRAVEL AND AVIATION, 2007Tons CO2
General Aviation:Air Ambulance
69 tons
Commercial Air Travelvia Regional Airports
41,689 tons
Commercial Air Travelvia Aspen County Airport
105,681 tons
General Aviation:Piston Aircraft
1,039 tons
General Aviation:Turboprops6,147 tons
General Aviation:Jet Aircraft
122,289 tons
ASPEN EMISSIONS: GROUND TRANSPORTATION 2007Tons CO2
2008
2008
ASPEN EMISSIONS: GROUND TRANSPORTATION 2007Tons CO2
Around-Town Driving37,713 tons
Off-Road: SkiCo, Yard Widgets, Construction Equipment
3,339 tons RFTA Buses4,395 tons
Aspen School District371 tons
Commuting, Hwy 82117,242 tons
Pitkin County186 tons
Tourist Road Travel39,211 tons
City of Aspen1,015 tons
VEHICLE TYPE SURVEYAugust 2008
Medium & HeavyTrucks/SUVs
39.1%
Large 2-Axle Trucks2.6%
Large 3-Axle Trucks2.4%
Semis0.7%
Buses (RFTA)1.3%
Motorcycles *0.50.6%
Passenger Cars26.8%
Light Trucks and SUVs26.5%
2004
2007
HIGHWAY 82 AND COMMUTING EMISSIONSComparing 2004 to 2007
2004
2007
GROUND TRANSPORTATIONComparing 2004 to 2007
ASPEN BUILDING EMISSIONS, 2007Gallonsof Fuel
14,000,000
12,000,000
10,000,000
8,000,000
6,000,000
4,000,000
2,000,000
Off-RoadFuel
SkiCoDiesel& Gas
RFTATouristDriving
AroundTown
Commuting
ASPEN’S MAJOR AIR AND GROUND TRANSPORTATION EMISSIONS2007 COST OF ENERGY
Comparing 2004 to 2007140,000
120,000
100,000
80,000
60,000
40,000
20,000
Tons CO2e/yr
GeneralAviation(Jets)
CommercialAir Travelvia Aspen
CommercialAir Travelvia OtherAirports
Commutingvia Hwy 82
Around-TownDriving
TouristRoad Travel
To/From Aspen
Mcf
1,600,000
1,400,000
1,200,000
1,000,000
800,000
600,000
400,000
200,000
AM GasSourceGas
Aspen Electric Carbon Dioxide Methane Nitrous OxideHoly Cross
ELECTRICITY EMISSIONSComparing 2004 to 2007
NATURAL GAS CONSUMPTIONComparing 2004 to 2007
EMISSIONS BY GREENHOUSE GASComparing 2004 to 2007
ASPEN EMISSIONS: MAJOR SOURCES, 2007Tons CO2e
Tons CO2e
160,000
140,000
120,000
100,000
80,000
60,000
40,000
20,000
Tons CO2e
160,000
140,000
120,000
100,000
80,000
60,000
40,000
20,000
Aspen Electric AM Gas Propane VendorsHoly Cross SourceGas
19,298 21,214
137,094
82,350
2,506
2004
2007
Electricity Natural Gas Propane GroundTransportation
Aviation
$90,000,000
$80,000,000
$70,000,000
$60,000,000
$50,000,000
$40,000,000
$30,000,000
$20,000,000
$10,000,000
General Aviation129,537 tons
Commercial Air Travel147,370 tons
All GroundTransportation203,471 tons
Natural Gas andPropane
106,070 tons
Electricity156,392 tons
Landfill and N2O17,414 tons
Tons CO2e
900,000
800,000
700,000
600,000
500,000
400,000
300,000
200,000
100,000
ELECTRICITY EMISSIONS BY COMPANY AND SECTOR, 2007
1998 20302026
Aspen’s 2020 Target:580,054 tons CO2e
20182014201020062002 20342022 20462042 20502038
Aspen’s 2050 Target:165,730 tons CO2e
ELECTRICITY EMISSION FACTORSComparing 2004 to 2007
1.26
1.791.72
0.60
Aspen Electric Holy Cross
2004
2007
lbs CO2e/kWhdel ivered
Electricity20.6%
Landfill2.2% Nitrous Oxide
0.05%
1998 2006200520032002200120001999
900,000
800,000
700,000
600,000
500,000
400,000
300,000
200,000
100,000
ASPEN’S QUICKTRACKER SOURCES AND TOTAL EMISSIONS1998 to 2008
900,000
800,000
700,000
600,000
500,000
400,000
300,000
200,000
100,000
ASPEN’S TOTAL EMISSIONS1998 to 2050
Commercial Air Travelvia Aspen County Airport
105,681 tons
General Aviation:Jet Aircraft
122,289 tons
Passenger Cars26.8%
-
40,000
20,000
00,000
80,000
60,000
40,000
20,000
$9
$8
$7
$6
$5
$4
$3
$2
-
2.0
1.8
1.6
1.4
1.2
1.0
0.8
0.6
0.4
0.2

C I T Y O F A S P E N · C A N A R Y I N I T I A T I V E60
QuickTracker
To fill in the knowledge gap of tri-annual emissions inventories that delays assessments of the impact of reduction
measures, policies, and other changing conditions that influence Aspen’s emission trends, the Canary Initiative
commissioned the development of a “quick tracker” system. The system identifies three pertinent trends —
commuting, new construction, and air travel — for which data is readily available from official sources. These
drivers comprised 64 percent of Aspen’s total emissions in 2007.
For 2008 the QuickTracker estimates the following (Table 4):
Based on decreasing traffic counts at Castle Creek Bridge, commuting emissions will decline by
3.5 percent from 117,336 tons CO2 in 2007 to 113,246 tons CO2 in 2008;
Based on decreasing rate of building completions in 2008 and coupled with an assumed decrease
in electricity’s carbon intensity, building emissions will decline by 1.7 percent from 262,475 tons
CO2 in 2007 to 258,002 tons CO2 in 2008;
Based on a sharp increase in passengers enplaning at Aspen in 2008, the QuickTracker estimates
that air travel emissions will rise 16.9 percent from 105,681 tons CO2 in 2007 to 123,501 tons CO2
in 2008;
Total emissions are forecast to increase by 1.9 percent from 760,268 tons CO2 in 2007 to 774,763
tons CO2 in 2008.
While emissions have increased in 2008,, it might be short-lived, considering the current economic downturn.
Certainly, a decrease in construction activity as well as employment will affect traffic counts, and it is likely that
visitors and residents will do less flying in 2009 than 2008. However, the QuickTracker is not a speculative tool. It
is designed to estimate emissions trends based on actual data, albeit in easier and somewhat less accurate form
than a full emissions inventory. Details on the methodology and results are available in the Aspen QuickTracker
report.66
66 Heede, Richard (2009) Aspen QuickTracker: Early detection of major drivers of greenhouse gas emissions, A Manual for the City of Aspen’s Canary Initiative, 16 pp.
Table 4. Total Aspen greenhouse gas emissions in 2004 & 2007, 2008 (forecast), and 2020 (Canary target)
ASPEN’S GREENHOUSE GAS EMISSIONS: 2004, 2007, 2008, 2020
SOURCE 2004 2007 2008 2020TARGET
Commuting on Highway 82 125,714 117,336 113,246 83,161
Buildings (electricity, gas, & propane) 273,324 262,475 258,002 217,326
Air Travel via Aspen 136,946 105,681 123,501 99,503
Subtotal of QuickTracker sources 535,984 485,492 494,749 399,990
Sources not in QuickTracker 292,664 274,775 280,014 180,064
TOTAL 828,648 760,268 774,763 580,054
Note: Actual inventory results 2004 and 2007; QuickTracker forecast for 2008; Canary Initiative target for 2020. The total for 2020 represents the target if Aspen meets its objective of reducing emissions 30 percent below 2004 baseline; however, the Quick Tracker elements are speculative.

C I T Y O F A S P E N · C A N A R Y I N I T I A T I V E61
Aspen has achieved some early successes in reducing greenhouse gas emissions over a short period of time.
The City government has lead by example and has reduced emissions from its own operations by 15.6 percent
from its 2004 baseline.
While Aspen’s emissions in 2007 decreased by 8.25 percent below the 2004 baseline, electricity and natural
gas consumption increased. The greening of the City of Aspen Electric energy portfolio and the decrease in Air
Travel & Aviation emissions contributed significantly to the emissions decrease. The change in the calculation of
commercial air travel emissions contributed to the drop in emissions associated with Air Travel & Aviation.
If electricity and natural gas consumption continue to increase, Aspen’s emissions might increase as well. Future
inventories will use the revised 2007 methodology to determine emissions from commercial air travel, and as
a result significant drops in air travel emissions – if any at all – will be far less likely. While Aspen Electric is
committed to increasing its non-carbon energy portfolio to 100 percent and is launching programs to reduce
consumer demand, the other electric and gas utilities serving Aspen cannot be counted on to mitigate the effects
of increased energy consumption in the Buildings sector. The increasing rate of energy consumption in the
Buildings sector is unsustainable at its current level if emissions reduction targets are to be met.
Collectively Aspen has made a good start. If Aspen’s emissions are to continue to decline, then residents, visitors,
businesses, and other organizations must modify their energy consumption and travel patterns and demand more
clean energy from utility providers. While Aspen contributes a mere 0.01 percent of total U.S. emissions, we can
serve as a model to others in curbing the greenhouse gas emissions that will affect the entire world by getting own
our house in order. Let’s start today.


C I T Y O F A S P E N · C A N A R Y I N I T I A T I V E63
Ackerman, Frank (~2000) Waste, Recycling, and Climate Change, Tufts University, Medford, MA, www.tufts.edu/tuftsrecycles/energy.htm See also: Ackerman (2000) “Waste Management and Climate Change,” Local Environment, vol. 5(2):223-229.
Amann, Jennifer Thorne, Alex Wilson, & Katie Ackerly (2007) Consumer Guide to Home Energy Savings, Ninth edition, American Council for an Energy-Efficient Economy, Washington, 239 pp., www.aceee.org
Aspen Global Change Institute (2006) Climate Change and Aspen: An assessment of impacts and potential responses, 175 pp., www.agci.org
Aspen-Pitkin County Airport (2008) Greenhouse Gas Emissions Inventory (2006), Dunkelberg & Co., Synergy Consultants, BridgeNet International, 73 pp.
Aspen Skiing Company (2008) Sustainability Report 2006-2007, 36 pp., www.aspensnowmass.com
Black & Veatch Corporation (2005) Electric and Water Utilities Business Plan: City of Aspen, Colorado, Centennial, CO, 80 pp.
Business and Commercial Aviation (2007) “Operations and Planning Guide: Operating Costs Guide for Current and Out of Production Aircraft,” Business & Commercial Aviation, Aug07, vol. 101(2):82-116, www.aviationnow.com/bca
City of Aspen (2009) 2008 Recycling Report, www.aspenpitkin.com/uploads/Final%202008%20report.pdf
Colorado Department of Public Health (2000) Technical Support Document for the PM10 Redesignation Request and Maintenance Plan for the Aspen Area, Air Pollution Control Division, Denver, 18 pp.
Climate Change Science Program 1.2. Polyak, L., J. Andrews, J. Brigham-Grette, D. Darby, A. Dyke, S. Funder, M. Holland, A. Jennings, J. Savelle, M. Serreze, and E. Wolff, 2009: History of sea ice in the Arctic. In: Past Climate Variability and Change in the Arctic and at High Latitude [Alley R.B., Brigham-Grette J., Miller G.H., Polyak L., and White J.W.C. (eds.)]. Synthesis and Assessment Product 1.2. U.S. Climate Change Science Program, Washington, DC.
Climate Change Science Program 2.2. Field, C.B., J. Sarmiento, and B. Hales, 2007: The carbon cycle of North America in a global context. In: The First State of the Carbon Cycle Report (SOCCR): The North American Carbon Budget and Implications for the Global Carbon Cycle [King, A.W., L. Dilling, G.P. Zimmerman, D.M. Fairman, R.A. Houghton, G. Marland, A.Z. Rose, and T.J. Wilbanks (eds.)]. Synthesis and Assessment Product 2.2. National Oceanic and Atmospheric Administration, National Climatic Data Center, Asheville, NC.
Davis, Stacy C., Susan Diegel, & Robert G. Boundy (2007) Transportation Energy Data Book, 27th edition, Oak Ridge National Laboratory, Oak Ridge, TN, www-cta.ornl.gov/data/Index.html
Delucchi, Mark (2003) A Lifecycle Emissions Model (LEM: Lifecycle emissions from transportation fuels, motor vehicles, transportation modes, electricity use, heating and cooking fuels, and materials, Institute for Transportation Studies, University of California, Davis, 444 pp. Tables 56 and 63.
Durning, Alan Thein (1992) How Much is Enough? Worldwatch Institute, W.W. Norton, 200 pp. Forster, P. M. de F., K. P. Shine, & N. Stuber (2006) “It is premature to include non-CO2 effects of aviation in emission trading schemes,” Atmos. Environment, vol. 40:1117- 1121.

C I T Y O F A S P E N · C A N A R Y I N I T I A T I V E64
Gillenwater, Michael (2008) “Forgotten carbon: Indirect CO2 in greenhouse gas emission inventories,” Environmental Science and Policy, volume 11:195-203.
Golder Associates (2007) Landfill Gas Evaluation of the Pitkin County Solid Waste Center, Lakewood, 41 pp., www.golder.com.
Heede, Richard (2009) Aspen QuickTracker: Early detection of major drivers of greenhouse gas emissions, A Manual for the City of Aspen’s Canary Initiative, 16 pp.
Heede, Richard (2008) Emissions Calculator for Private & Business Aircraft Flying into Aspen’s Sardy Field (ASE), commissioned by State of Colorado (Governor’s Energy Office) and City of Aspen’s Canary Initiative; www.aspenzgreen.com/offsets_calculator_air.cfm
Heede, Richard (2008) Carbon in Our Daily Lives: an exploration of everyday climate impacts, commissioned by Sopris Foundation, Aspen, 8 pp., www.soprisfoundation.org & www.climatemitigation.com
Heede, Richard (2008) Town of Frisco Inventory of Greenhouse Gas Emissions in 2006, commissioned by Town of Frisco, 56 pp., www.climatemitigation.com
Heede, Richard (2007) Anybody Home? Energy Consumption and Carbon Emissions from Second Homes in Aspen, commissioned by Sopris Foundation, 21 pp.
Heede, Richard (2006) Aspen Greenhouse Gas Emissions 2004, for the City of Aspen’s Canary Initiative, commissioned by the City of Aspen, Climate Mitigation Services, 96 pp, 14 spreadsheets.
Heede, Richard, Marta Darby, & Kim Peterson (2009) Aspen Greenhouse Gas Emissions Inventory, 2007: An update to the 2004 baseline, for the City of Aspen’s Canary Initiative, commissioned by the City of Aspen, Climate Mitigation Services, 64 pp, 14 worksheets, www.climatemitigation.com.
Heede, Richard, & David Houghton (2004) Town of Telluride: Energy and Cost Savings Report: Municipal Buildings and Facilities, Climate Mitigation Services (Snowmass) and Resource Engineering Group (Crested Butte), 46 pp.
Heede, Richard (2002) Cool Citizens: Everyday Solutions to Climate Change: Household Solutions Brief, Rocky Mountain Institute, 18 pp, www.rmi.org/sitepages/pid173.php & www.climatemitigation.com
Hewett, Chris, & Julie Foley (2000) Plane Trading: Policies for reducing the climate change effects of international aviation, Institute for Public Policy Research, London, 57 pp.
Holy Cross Energy (2009) Reducing Colorado’s Electric Sector Greenhouse Gas Emissions: The Difficulty of “Running Down an Up Escalator”, HCE White Paper, Del Worley, Chris Hildred, and Diana Golis, with the assistance of independent consultant Randy Udall, Feb09, 16 pp.
Houghton, David (2003) Aspen City Hall: HVAC Opportunities Report, Resource Engineering Group, Crested Butte, CO, 8 pp.
International Civil Aviation Organization (2007) Voluntary Emissions Trading for Aviation (VETS Report), ICAO, Apr07, 33 pp.
Intergovernmental Panel on Climate Change (1999) Aviation and the Atmosphere, Joyce Penner, David Lister, David Griggs, & Mack McFarland, www.grida.no/climate/ipcc/aviation
Kirchgessner, David A, Stephen D. Piccot, & Sushma S. Masemore (~1997) An Improved Inventory Of Methane Emissions From Coal Mining In The United States, U.S. Environmental Protection Agency Office of Research and Development Research, Triangle Park, NC, 48 pp., www.epa.gov/ttn/chief/ap42/ch14/related/mine.pdf

C I T Y O F A S P E N · C A N A R Y I N I T I A T I V E65
Kirchgessner, David A., Robert A. Lott, R. Michael Cowgill, Matthew R. Harrison, & Theresa M. Shires (~2000) Estimate Of Methane Emissions From The U.S. Natural Gas Industry, US EPA: AP 42, Fifth Edition, vol. 1 chapter 14: Greenhouse Gas Biogenic Sources; www.epa.gov/ttn/chief/ap42/ch14/
Kollmuss, Anja, & Benjamin Bowell (2006 & 2007) Voluntary Offsets For Air-Travel Carbon Emissions Evaluations and Recommendations of Voluntary Offset Companies, Tufts Climate Initiative, 53 pp., www.tufts.edu/tie/tci/pdf/TCI_Carbon_Offsets_Paper_April-2-07.pdf
Krueger, John D. (2008) Traffic Counts at the Castle Creek Bridge, memorandum to Mayor and Council, 15Jan08, 9 pp.
Leisure Trends Group (2004) Aspen Chamber Resort Association Summer Survey Program: Understanding the Aspen Summer Visitor, prepared for ACRA by Leisure Trends Group, Boulder, www.leisuretrends.com, MS PowerPoint slides.
Massachusetts Institute of Technology Global Airline Industry Program Airline Data Project, web.mit.edu/airlinedata/www/Revenue&Related.html
Mount Sopris Project Team (1993) 1992 Origin and Destination Summer Survey and Selected Traffic Count Information: Final Report, 273 pp.
National Renewable Energy Laboratory (1998) Life Cycle Inventory of Biodiesel and Petroleum Diesel for Use in an Urban Bus, May1998, 314 pp.
Patterson, Judith (2005) Aviation Emission Inventory Methodologies, Report Prepared For Environment Canada, Concordia University, 44 pp.
Peeters, P. M., J. Middel, & A. Hoolhirst (2005) Fuel Efficiency of Commercial Aircraft: An overview of historical and future trends, NLR, Ede, The Netherlands, 37 pp., www.transportenvironment.org/
Peters, Glen P., & Edgar G. Hertwich (2008) “Post-Kyoto greenhouse gas inventories: production versus consumption,” Climatic Change, vol. 86:51-66.
Pitkin County (2008) Aspen-Pitkin County Airport Greenhouse Gas Emissions Inventory - 2006, prepared by: Barnard Dunkelberg & Co, Synergy Consultants, BridgeNet Int’l, 73 pp.
Roaring Fork Transit Agency (2003) RFTA Boarding and Alighting Survey, spreadsheets, data from Phil Schultz, Aug05.
Roaring Fork Transit Agency (2003) West Glenwood Springs to Aspen Corridor Investment Study, prepared for RFTA by TBD, May 2003.
Ross, Davide (2007) Greenhouse Gas Emissions Resulting from Aircraft Travel, Carbon Planet, Adelaide, 10 pp., www.carbonplanet.com/downloads/ghg_emission_factors_for_flights.pdf
RRC Associates, Charlier Associates, & Healthy Mountain Communities (2004) Local & Regional Travel Patterns Study: Examining how, why, when, and where people travel in the Roaring Fork and Colorado River Valleys, www.hmccolorado.org, 112 pp.
Sausen, R., I. Isaksen, V. Grewe, D. Hauglustaine, D.S. Lee, G. Myhre, M.O. Köhler, G. Pitari, U. Schumann, F. Stordal and C. Zerefos (2005) “Aviation radiative forcing in 2000: An update on IPCC (1999),” Meteorol. Zeitung, vol. 14:555-561.
Sheng-Chen Alex Huang (2000) An Analysis of Air Passenger Average Trip Lengths and Fare Levels in US Domestic Markets. Institute for Transportation Studies Univ. of California, Davis, 62 pp. http://repositories.cdlib.org/cgi/viewcontent.cgi?article=1005&context=its

C I T Y O F A S P E N · C A N A R Y I N I T I A T I V E66
Spokas, K., J. Bogner, J.P. Chanton, M. Morcet, C. Aran d, C. Graff, Y. Moreau-Le Golvan, I. Hebe (in press) “Methane mass balance at three landfill sites: What is the efficiency of capture by gas collection systems?” Waste Management, draft by Jean Bogner, personal communication, 20Sep05.
TRX (2007) CO2 Emissions Model for Air Travel: Public Documentation, Scott Gillespie, 38 pp.
U.K. DEFRA (2007) Passenger transport emissions factors: Methodology paper, London, 17 pp.
United Nations Food and Agriculture Organization (2006) Livestock’s Long Shadow – Environmental Issues and Options, UN FAO Livestock Information and Policy Branch, 403 pp. www.fao.org
U.S. Dept of Energy (2005) Voluntary Reporting of Greenhouse Gases (1605b) Program: Draft Technical Guidelines, DOE Office of Policy and International Affairs, p. 105.
U.S. Energy Information Administration (2008) Annual Energy Review 2007, U.S. DOE, www.eia.doe.gov
U.S. Energy Information Administration (2008) Emissions of Greenhouse Gases in the United States 2007, U.S. DOE, 64 pp., www.eia.doe.gov
U.S. Energy Information Administration (2003) Residential Energy Consumption Survey 2001, U.S. DOE.
U.S. Environmental Protection Agency (2008) Emissions & Generation Resource Integrated Database (eGRID), electric utility emissions database, 2004 data, www.epa.gov/cleanenergy/egrid/index.html
U.S. Environmental Protection Agency (2008) Optional Emissions from Commuting, Business Travel, & Product Transport, GHG Inventory Protocol Core Module Guidance, 17 pp. www.epa.gov/climateleaders/documents/resources/commute_travel_product.pdf
U.S. Environmental Protection Agency (2008) Inventory of U.S. Emissions and Sinks: 1990-2006, Main report, & Annex B: Methodology for Estimating the Carbon Content of Fossil Fuels, www.epa.gov
U.S. Environmental Protection Agency (1998) Greenhouse Gas Emissions from Management of Selected Materials in Municipal Solid Waste, EPA 530-R-98-013. Cited in Ackerman.
Urbitran Associates, Inc. (2004) Efficiency Review of the Roaring Fork Transportation Authority, prepared for RFTA, October 2004.
Venturoni, Linda (2004) Pitkin County Community Survey, Northwest Colorado Council of Governments, www.nwc.cog.co.us.
Venturoni, Linda (2005) Basalt Community Survey, Northwest Colorado Council of Governments, www.nwc.cog.co.us.
Wang, Michael Q. (2001) Well-to-Tank Energy Use and Greenhouse Gas Emissions of Transportation Fuels: North American Analysis, vol. 3, Argonne National Laboratory; www.transportation.anl.gov/.
Wilson, Alex, & Jesssica Boehland (2005) “Small is Beautiful: U.S. House Size, Resource Use, and the Environment,” Journal of Industrial Ecology, vol. 9:277-287.
Wuebbles, Don, M. Gupta, & M. Ko (2007) “Evaluating the Impacts of Aviation on Climate Change,” EOS, 3Apr07:157-160.
Wuebbles, Donald (editor) (2006) Workshop on the Impacts of Aviation on Climate Change: A Report of Findings and Recommendations, Jun06, Cambridge, MA, 64 pp.

C I T Y O F A S P E N · C A N A R Y I N I T I A T I V E67
Energy CO2e CO2e (Btu per unit) (lb. per unit) (lb. per million Btu)
NATURAL GAS
Natural gas (pipeline) 1,027 Btu/ft3 12.059/ccf 117.08
Natural gas (Aspen) 823 Btu/ft3 10.996/ccf 133.57
Liquid petroleum gas 12.805/gallon 139.04
Propane (incl. associated methane) 91,333 Btu/gallon 13.358/gallon 146.25
ELECTRICITY1
Holy Cross Energy (generation, CO2) (CO2 only) 1.580/kWh 463.07
Holy Cross Energy (delivered, w/CH4) (with fugitive methane) 1.720/kWh 504.02
Aspen Electric (generation, CO2 only) (CO2 only) 0.551/kWh 161.47
Aspen Electric (delivered, w/CH4) (with fugitive methane) 0.597/kWh 174.85
TRANSPORTATION FUEL
Aviation: Jet fuel (Jet-A) 135,000 Btu/gallon 21.088/gallon 156.21
Aviation Gasoline (AvGas) 120,190 Btu/gallon 18.355/gallon 152.72
Gasoline: motor 125,071 Btu/gallon 19.594/gallon 156.43
Diesel fuel 138,700 Btu/gallon 22.384/gallon 161.39
Residual fuel (#5,6) 138,700 Btu/gallon 26.033/gallon 173.91
HEATING (OTHER)
Kerosene 135,000 Btu/gallon 21.537/gallon 159.54
Heating oil (#1,2,4) 138,700 Btu/gallon 22.384/gallon 161.39
COAL
Bituminous coal BC 4,931.3/ton 205.30
Average utility coal 10,183 Btu/lb. 4,276.9/ton 210.00
OTHER
Methane 11.638/ccf 115.26
Municipal solid waste MS 1,999/ton 199.85
Wood & wood waste WW 3,814/ton 221.94
1 These factors are for emissions of carbon dioxide and associated methane from coal mining and natural gas systems (production to delivered gas) on the end-use value of electricity (3,412 Btu/kWh). If based on primary energy inputs (~10,200), emissions per million Btu would be two-thirds lower.
CARBON FACTORS AND COEFFICIENTS
C I T Y O F A S P E N · C A N A R Y I N I T I A T I V E68
CONVERSION FACTORS
1 Q (quad) = 1015 Btu (British thermal unit) = 1.055 EJ (exajoule) = 1018 J (joule)
1 kg (kilogram) = 2.2046 lb (pound), 1 megagram (MG) = 106 g = 1 t (metric tone) = 1.1023 ST (short ton)
1 km (kilometer) = 1,000 m (meter) = 0.62 mi (mile) = 3,281 ft (feet)
1 m3 = 264.17 gal (gallon) = 35.31 ft3
1 HP (horsepower) = 0.986 metric HP = 0.7068 Btu/s = 0.7457 kW (kilowatt)
1 kWh (kilowatt-hour) = 3,412 Btu; 1 Btu = 29.31 x 10⁻⁵ kWh
1 year = 8,766 hours = 365.25 days = 31,557,600 seconds = ~ x 107 seconds
NOTES
2 per passenger-mile flown.67
2 per gallon / 21.4 mpg = 0.916 lb CO2/mile.
Aspen get an average fuel economy of 18.6 mpg, or 1.052 lb CO2 per mile.68
credits” section of the Boundary chapter and the RFTA worksheet in Appendix C.
67 Calculated from Davis (2004) Transportation Energy Data Book, ORNL, US DOE, using US domestic commercial carrier fleet performance and capacity data.
68 See the Transportation chapter and the worksheets in Appendix C for details.

C I T Y O F A S P E N · C A N A R Y I N I T I A T I V E69
CITY OF ASPENCity of Aspen Canary Initiative: Kim Peterson, Global Warming Project Manager, 970-920-5071,
[email protected]; Marta Darby, Global Warming Data Analyst, 970-920-5072, [email protected], www.aspenglobalwarming.com
Aspen Parks Department, Brian Flynn, Open Space Projects Manager, 970-429-2035, [email protected]; Steve Aitken, Director of Golf, 970-920-5719, [email protected]
Aspen Public Works and Environmental Initiatives Director Phil Overeynder, 970-920-5111, [email protected]
Aspen Transportation Department, John Krueger, Director, 970-920-5042, [email protected]; Lynn Rumbaugh, Transportation Systems Manager, 970-920-5038, [email protected], www.aspenpitkin.com
ENERGY PROVIDERSAM Gas, Aspen, Bart Levin, President, 970-925-2901
AmeriGas Propane, Carbondale, Tad Peed, Manager, 970-963-3113, [email protected], www.amerigas.com
Cross Prone & Supply Propane Services, Tom McBrayer, 970-927-4757, [email protected]
Ferrellgas, Inc. Glenwood Springs, 970-945-8611, www.ferrellgas.com
Holy Cross Energy, Glenwood Springs, Bob Gardner, VP Op’s, 970-945-6414, [email protected]; Steve Casey, Member Svcs Supervisor, 970-947-5430, [email protected], www.holycross.com
Municipal Energy Agency of Nebraska, Lincoln, Jill Jones, 402-474-4759, [email protected], www.nmppenergy.org
Roaring Fork Valley Coop, Carbondale, Bill Brensman, fuel sales; Ellie Nieslanik, accts, 970-963-2220
SourceGas, Natalie Shelbourn, 970-250-0379, [email protected]; Jerrad Hammer, Regulatory Affairs Manager, 303-243-3496, [email protected]
SPECIAL DISTRICTSAspen Ambulance, Pitkin County Emergency Management, Ellen Andersen, 970-920-5243 www.aspenpitkin.com
Aspen Consolidated Sanitation District, Tracy Dillingham, Wastewater Facility Superintendent, 970-925-7262, x101, [email protected]
Aspen School District, Fred Brooks, Bus Fleet Mngr., 970-925-3760, x4010; Mark McKeller, Bookkeeper/Purchasing, 970-925-3760 x4012, [email protected]; Diana Sirko, Superintendent, 970-925-3760 x4008, [email protected]
Aspen Valley Hospital, John Schied, Director of Operations, 970-544-1149, [email protected], www.avhaspen.org
Roaring Fork Transit Authority, Dan Blankenship, CEO, 970-945-7380, [email protected]; Kenny Osier, Dir. of Maintenance, 970-384-4959, [email protected]

C I T Y O F A S P E N · C A N A R Y I N I T I A T I V E70
PITKIN COUNTY
Pitkin County Airport, Dave Ulane, Assistant Aviation Director, 970-429-2853 [email protected], www.aspenairport.com
Pitkin County, Dylan Hoffman, Energy Manager, 970-920-5393, [email protected]; Timothy Knight, Fleet Manager, 970-920-5393, [email protected]
Pitkin County Solid Waste Center, Chris Hoofnagle, Solid Waste Manager, 970-923-3487, [email protected], www.aspenpitkin.com
OTHER PRIVATE SECTORAspen Skiing Company, Matt Hamilton, 970-300-7153, [email protected],
www.skiaspen.com/environment
Maroon Creek Club, Scott Miller, Superintendent, 970-544-1666
MecTric Engineering, Glenwood Springs, Jeff Grebe, President, 970-928-9687, [email protected]
Landfills + Inc., Dr. Jean Bogner, 630-665-0872
ORGANIZATIONS
Aspen Global Change Institute, John Katzenberger, Director, 970-925-7376, [email protected]
EMISSIONS RESEARCH & REPORTINGClimate Mitigation Services, Snowmass, Richard Heede, Principal, 970-927-9511, [email protected],
www.climatemitigation.com

C I T Y O F A S P E N · C A N A R Y I N I T I A T I V E71
This section reproduces in full the 16 primary Excel worksheets developed for the Aspen Emissions Inventory,
2007. All of the data sources, assumptions, caveats, calculations, and methodologies employed in each worksheet
are documented in cell notes — also reproduced in the folio of worksheets. See the chapter on “Purpose, scope,
and boundary definition” for a discussion of the inventory protocol.
For copyright reasons, Excel worksheets are distributed as PDFs. For inquiries, please contact the consultant:
Richard Heede, Climate Mitigation Services
1626 Gateway Road · Snowmass, CO 81654 USA
970-927-9511 · [email protected]
CORE WORKSHEETS
Worksheet 1: Summary
Worksheet 2: Comparing 2004 and 2007
Worksheet 3: Electricity
Worksheet 4: Electricity carbon factor
Worksheet 5: Natural gas
Worksheet 6: Propane
Worksheet 7: Commuting, around town, and tourist driving
Worksheet 8: Roaring Fork Transportation Agency
Worksheet 9: Other fuel: City, County, school buses, Aspen Skiing Company, and misc.
Worksheet 10: Landfill: energy and fugitive methane
Worksheet 11: Fertilizers
Worksheet 12: Commercial air travel via Aspen and regional airports
Worksheet 13: General aviation via Aspen
SUPPORTING DATA AND ANCILLARY WORKSHEETS
Worksheet 14: Aspen passenger enplanement & deplanement data 1998 – 2008
Worksheet 15: Air travel emission factors: short-haul, domestic, and international
Worksheet 16: Aspen general aviation operations 2007
Worksheet 17: Aspen general aviation operations 2004
Worksheet 18: General aviation fleet fuel performance
Worksheet 19: Gas data 2007: SourceGas
Worksheet 20: Electricity data 2007: Holy Cross Energy
Worksheet 21: Heating Degree Days (Aspen)
Worksheet 22: Traffic: vehicle survey, August 08
Worksheet 23: Aspen Recreation Center
Worksheet 24: Aspen School District
Worksheet 25: Aspen Valley Hospital
Worksheet 26: Wheeler Opera House

Summary 2007
1
2
3
4
5
6
7
8
9
10
11
12
13
14
15
16
17
18
19
20
21
22
23
24
25
26
27
28
29
30
31
32
33
34
35
36
37
38
39
40
41
42
43
44
45
46
47
48
49
50
51
52
53
54
55
56
57
58
59
60
61
62
63
64
65
66
67
68
69
70
71
72
73
74
75
76
77
78
A B C D E F G H I J K L M
City of Aspen / Canary Initiative SummaryGreenhouse Gas Emissions Inventory, year 2007 Last Modified: 13 April 2009 Rick Heede Climate Mitigation Services
Physical Units Energy UnitsPercent of
Total
Buildings: electricity Million Btu
Electricity: Aspen Municipal Utility 64,693,191 kWh 659,871 10^6 Btu 19,091 tons CO2 19,091 tons CO2 2.51%
Electricity (MEAN fugitive methane - coal mining) 8 tons CH4 322 10^6 Btu 8 tons CH4 207 tons CO2e 0.03%
Electricity: Holy Cross Energy 159,436,793 kWh 1,626,255 10^6 Btu 134,929 tons CO2 134,929 tons CO2 17.75%
Electricity (Xcel fugitive methane - coal mining) 87 tons CH4 3,365 10^6 Btu 87 tons CH4 2,165 tons CO2e 0.28%
Total electricity 224,129,984 kWh 2,289,812 10^6 Btu na 156,392 tons CO2e 20.57%
Buildings: natural gas and propane
Natural Gas (SourceGas) 1,497,844 Mcf 1,233,025 10^6 Btu 72,064 tons CO2 72,064 tons CO2 9.48%
Natural Gas (SourceGas - fugitive methane) 411 tons CH4 15,988 10^6 Btu 411 tons CH4 10,286 tons CO2e 1.35%
Natural Gas (AM Gas) 385,848 Mcf 317,630 10^6 Btu 18,564 tons CO2 18,564 tons CO2 2.44%
Natural Gas (AM Gas - fugitive methane) 106 tons CH4 4,119 10^6 Btu 106 tons CH4 2,650 tons CO2e 0.35%
Propane (AmeriGas, Ferrellgas, Cross, and Propane Svcs) 375,191 gallons 34,267 10^6 Btu 2,377 tons CO2 2,377 tons CO2 0.31%
Propane (fugitive methane) 5 tons CH4 201 10^6 Btu 5 tons CH4 129 tons CO2e 0.02%
Total natural gas & propane 1,883,692 Mcf 1,605,230 10^6 Btu na 106,070 tons CO2e 13.95%
Buildings: other
AVH Hospital (diesel generator) 1,200 gallons 166 10^6 Btu 13 tons CO2 13 tons CO2 0.002%
Refrigerants, halocarbons, CFCs, etc. na na 10^6 Btu lbs CO2e na tons CO2e
Total buildings 376,391 gallons 3,895,209 10^6 Btu na lbs CO2e 262,475 tons CO2e 34.52%
Transportation: highway, around town, buses
Commuting via Hwy 82 11,778,838 gallons 1,473,191 10^6 Btu 117,242 tons CO2 117,242 tons CO2 15.42%
Driving around town 3,804,498 gallons 475,832 10^6 Btu 37,713 tons CO2 37,713 tons CO2 4.96%
Tourist road travel to & from Aspen 4,002,349 gallons 500,578 10^6 Btu 39,211 tons CO2 39,211 tons CO2 5.16%
Transit Buses (RFTA) 439,040 gallons 60,895 10^6 Btu 4,395 tons CO2 4,395 tons CO2 0.58%
School Buses (Aspen School District - diesel) 17,500 gallons 2,427 10^6 Btu 196 tons CO2 196 tons CO2 0.03%
Other School District vehicles - gasoline 12,500 gallons 1,563 10^6 Btu 122 tons CO2 122 tons CO2 0.02%
Out-of-school-district fuel (ExEd trips, away games, gasoline) 5,000 gallons 625 10^6 Btu 52 tons CO2 52 tons CO2 0.01%
Pitkin County Public Works heavy vehicles (diesel) 8,865 gals (*0.2) 1,230 10^6 Btu 99 tons CO2 99 tons CO2 0.01%
Pitkin County Public Works - sheriff etc. (gasoline) 8,812 gals (*0.2) 1,102 10^6 Btu 86 tons CO2 86 tons CO2 0.01%
City of Aspen equipment (diesel fuel) 57,611 gallons 7,991 10^6 Btu 645 tons CO2 645 tons CO2 0.08%
City of Aspen vehicles (gasoline) 37,823 gallons 4,731 10^6 Btu 371 tons CO2 371 tons CO2 0.05%
Aspen Skiing Company (diesel and gasoline consumption) 237,350 gallons 29,686 10^6 Btu 2,263 tons CO2 2,263 tons CO2 0.30%
Off-road fuel (construction, snowmobiles, lawn & snow widgets) 101,633 gallons 12,711 10^6 Btu 1,047 tons CO2 1,047 tons CO2 0.14%
Ambulances 2,588 gallons 324 10^6 Btu 29 tons CO2 29 tons CO2 0.00%
Total highway vehicles, around town, buses, & misc 20,514,406 gallons 2,572,885 10^6 Btu 203,471 tons CO2 203,471 tons CO2 26.76%
Transportation: commercial and private aviation
Air Travel - Commercial via Pitkin County Airport 10,022,903 gallons 1,353,092 10^6 Btu 105,681 tons CO2e 105,681 tons CO2e 13.90%
Air Travel - Commercial at other airports 3,953,858 gallons 533,771 10^6 Btu 41,689 tons CO2e 41,689 tons CO2e 5.48%
Air Travel - General Aviation (jets) 11,598,066 gallons 1,565,739 10^6 Btu 122,289 tons CO2e 122,289 tons CO2e 16.09%
Air Travel - General Aviation (turboprops) 582,952 gallons 78,699 10^6 Btu 6,147 tons CO2e 6,147 tons CO2e 0.81%
Air Travel - General Aviation (piston aircraft) 112,489 gallons 13,520 10^6 Btu 1,032 tons CO2 1,032 tons CO2 0.14%
Air Travel - General Aviation (Air Ambulance flights) 6,909 gallons 830 10^6 Btu 69 tons CO2 69 tons CO2 0.01%
Total commercial and private aviation 26,277,176 gallons 3,545,650 10^6 Btu 276,907 tons CO2 276,907 tons CO2e 36.42%
Total transportation 46,791,582 gallons 6,118,536 10^6 Btu 480,378 tons CO2 480,378 tons CO2 63.19%
Landfill
Landfill & Materials Recovery: electricity 153,511 kWh 1,566 10^6 Btu 66 tons CO2 66 tons CO2 0.01%
Landfill & Materials Recovery: diesel & gasoline fuel 6,826 gallons 947 10^6 Btu 38 tons CO2 38 tons CO2 0.00%
Landfill: fugitive methane 679 tons CH4 32,904 10^6 Btu 679 tons CH4 16,969 tons CO2e 2.23%
Total landfill various 35,416 10^6 Btu na 17,072 tons CO2e 2.25%
Nitrous Oxide sources
Maroon Creek Club 3,458 kg N na 108 kg N2O 35 tons CO2e 0.005%
Aspen Golf Course 4,051 kg N na 126 kg N2O 41 tons CO2e 0.005%
City of Aspen parks and greenspaces 1,502 kg N na 47 kg N2O 15 tons CO2e 0.002%
City of Aspen athletic fields 2,687 kg N na 84 kg N2O 27 tons CO2e 0.004%
Private greenspace within city limits 15,078 kg N na 470 kg N2O 153 tons CO2e 0.020%
Private greenspace within Urban Growth Boundary 6,883 kg N na 215 kg N2O 70 tons CO2e 0.009%
Total nitrous oxide sources 33,659 kg N na 1,050 kg N2O 343 tons CO2e 0.05%
Total various units 10,049,161 10^6 Btu various units 760,268 tons CO2e 100%
Methane and nitrous oxide of total emissions 1,291 tons CH4 32,619 tons CO2e 4.29%
Carbon dioxide of total emissions 727,649 tons CO2 95.71%
Total emissions 2004 (original estimate) 840,875 tons CO2e Difference 80,607 tons CO2e Percent -9.59%Total emissions 2004 (revised Feb09 estimate) 828,648 tons CO2e Difference 68,381 tons CO2e Percent -8.25%
CO2 EquivalentGHG Emissions
AspenSum2007.xls

Summary 2007
F8Cell:
Rick Heede:Comment:
CMS estimates the energy value of fugitive methane, although using Aspen’s Btu value of 823.2 Btu per cubic foot rather than the standard value of 1,027 Btu per cf (standard temperature and pressure).
See th Natural gas worksheet for details.
G8Cell:
Rick Heede:Comment:
Energy Information Administration (2008) Emissions of Greenhouse Gases in the United States 2007. GWP, methodolgoy, p 12: Methane. In its Fourth Assessment Report, the IPCC developed revised global
warming potential factors (GWPs) for selected gases. The GWP for methane was revised from the previous value of 23 in the IPCC’s Third Assessment Report to 25 in the Fourth Assessment Report. The
revisedGWPfor methane is used in this report. In addition, this report incorporates an increase in the density of methane from 42.28 to 42.37 pounds per thousand cubic feet, in order to provide consistent
temperature and pressure values for methane in all EIA data. Nitrous Oxide. The IPCC also updated the GWP for nitrous oxide in its Fourth Assessment Report, to 298, up from 296 in the IPCC’s Third
Assessment Report.”
AspenSum2007.xls

Compare 2004 & 2007
1
2
3
4
5
67
8
9
10
11
12
13
14
15
16
17
18
19
20
21
22
23
24
25
26
27
28
29
30
31
32
33
34
35
36
37
38
39
40
41
42
43
44
45
46
47
48
49
50
51
52
53
54
55
56
57
58
59
60
61
62
63
64
65
66
67
68
69
70
71
72
73
74
75
76
77
78
79
80
81
A B C D E F G H I J K L M N
Greenhouse Gas Emissions Inventory 2004Revised Apr09 Last modified: 15 April 2009
Physical Units Energy
Units
GHG
Emissions
CO2
Equivalent
Percent of
Total
lb CO2e
per million
Btu
Million Btu
Buildings: electricity
Electricity (Aspen Municipal Utility/Aspen Elec Dpt) 62,872,609 kWh 641,301 10^6 Btu 39,571 tons CO2 39,571 tons CO2 4.8% 123
Electricity (MEAN fugitive methane - coal mines) 8 tons CH4 391 10^6 Btu 8 tons CH4 185 tons CO2e 0.0% 947
Electricity (Holy Cross) 141,283,859 kWh 1,441,095 10^6 Btu 125,036 tons CO2 125,036 tons CO2 15.1% 174
Electricity (Xcel fugitive methane - coal mines) 77 tons CH4 3,727 10^6 Btu 77 tons CH4 1,764 tons CO2e 0.2% 947
Total electricity 204,156,553 kWh 2,086,514 10^6 Btu na 166,557 tons CO2e 20.1% 160
Buildings: natural gas and propane
Natural Gas (Kinder Morgan) 14,527,438 ccf 1,252,365 10^6 Btu 73,194 tons CO2 73,194 tons CO2 8.8% 117
Natural Gas (Kinder Morgan - fugitive methane) 415 tons CH4 20,170 10^6 Btu 415 tons CH4 9,549 tons CO2e 1.2% 947
Natural Gas (AM Gas) 3,631,860 ccf 313,091 10^6 Btu 18,299 tons CO2 18,299 tons CO2 2.2% 117
Natural Gas (AM Gas - fugitive methane) 104 tons CH4 5,043 10^6 Btu 104 tons CH4 2,387 tons CO2e 0.3% 947
Propane (AmeriGas) 250,137 gallons 22,846 10^6 Btu 1,662 tons CO2 1,662 tons CO2 0.2% 146
Propane (Ferrellgas) 250,137 gallons 22,846 10^6 Btu 1,662 tons CO2 1,662 tons CO2 0.2% 146
Total natural gas & propane 1,815,930 Mcf 1,636,361 10^6 Btu na 106,754 tons CO2e 12.9% 130
Buildings: other
AVH Hospital (diesel generator) 1,200 gallons 166 10^6 Btu 13 tons CO2 0.0% 161
Refrigerants, halocarbons, CFCs, etc. na na 10^6 Btu lbs CO2-e na tons CO2e
Total buildings 501,474 gallons 3,723,041 10^6 Btu na 273,324 tons CO2e 33.0% 147
Transportation: highway, around town, buses
Highway vehicles, driving Hwy 82 12,635,963 gallons 1,580,393 10^6 Btu 125,714 tons CO2 125,714 tons CO2 15.2% 159
Highway vehicles, around town 3,698,454 gallons 462,569 10^6 Btu 36,720 tons CO2 36,720 tons CO2 4.4% 159
Tourist road travel to & from Aspen 4,117,548 gallons 514,986 10^6 Btu 40,340 tons CO2 40,340 tons CO2 4.9% 157
Transit Buses (RFTA) 291,989 gallons 40,499 10^6 Btu 3,139 tons CO2 3,139 tons CO2 0.4% 155
School Buses (Aspen School District) 17,420 gallons 2,416 10^6 Btu 195 tons CO2 195 tons CO2 0.0% 161
Other School District vehicles 13,380 gallons 1,673 10^6 Btu 131 tons CO2 131 tons CO2 0.0% 157
Out-of-school-district fuel (ExEd trips, away games) 5,352 gallons 669 10^6 Btu 56 tons CO2 56 tons CO2 0.0% 168
Pitkin County Public Works - sheriff etc. (gasoline) 11,870 gals (*0.2) 1,485 10^6 Btu 116 tons CO2 116 tons CO2 0.0% 157
Pitkin County Public Works heavy vehicles (diesel) 7,581 gals (*0.2) 1,051 10^6 Btu 85 tons CO2 85 tons CO2 0.0% 161
City of Aspen equipment (diesel fuel) 33,588 gallons 4,659 10^6 Btu 376 tons CO2 376 tons CO2 0.0% 161
City of Aspen vehicles (gasoline) 62,590 gallons 7,828 10^6 Btu 613 tons CO2 613 tons CO2 0.1% 157
Aspen Skiing Company (diesel and gasoline consumption) 210,468 gallons 26,323 10^6 Btu 2,007 tons CO2 2,007 tons CO2 0.2% 152
Off-road (construction equip., snowmobiles, gas widgets) 150,440 gallons 18,816 10^6 Btu 1,654 tons CO2 1,654 tons CO2 0.2% 176
Ambulances 2,588 gallons 324 10^6 Btu 29 tons CO2 29 tons CO2 0.0% 179
Total highway vehicles, around town, buses, & misc 21,259,230 gallons 2,663,691 10^6 Btu 211,175 tons CO2 211,175 tons CO2 25.5% 159
Transportation: commercial and private aviation
Air Travel - Commercial at Pitkin County Airport 12,983,681 gallons 1,752,797 10^6 Btu 195,637 tons CO2 136,946 tons CO2 16.5% 156
Air Travel - Commercial at other airports 4,710,566 gallons 635,926 10^6 Btu 70,978 tons CO2 49,685 tons CO2 6.0% 156
Air Travel - General Aviation (jets) 13,027,830 gallons 1,758,757 10^6 Btu 196,301 tons CO2 137,411 tons CO2 16.6% 156
Air Travel - General Aviation (turboprops) 662,942 gallons 89,497 10^6 Btu 9,989 tons CO2 6,992 tons CO2 0.8% 156
Air Travel - General Aviation (piston aircraft) 123,648 gallons 14,861 10^6 Btu 1,621 tons CO2 1,135 tons CO2 0.1% 153
Air Travel - General Aviation (Air Ambulance flights) 7,413 gallons 891 10^6 Btu 112 tons CO2 78 tons CO2 0.0% 176
Total commercial and private aviation 31,516,080 gallons 4,252,730 10^6 Btu 474,638 tons CO2 332,247 tons CO2 40.1% 156
Total transportation 53,276,784 gallons 6,916,421 10^6 Btu tons CO2 543,422 tons CO2 65.6% 157
Landfill
Landfill & Materials Recovery: electricity 110,476 kWh 1,127 10^6 Btu 50 tons CO2 50 tons CO2 0.0% 88
Landfill & Materials Recovery: diesel fuel 4,849 gallons 673 10^6 Btu tons CO2 27 tons CO2 0.0% 81
Landfill: fugitive methane 500 tons CH4 24,291 10^6 Btu 500 tons CH4 11,500 tons CO2e 1.4% 947
Total landfill various 26,090 10^6 Btu na 11,577 tons CO2e 1.4% 887
Nitrous Oxide sources
Maroon Creek Club 3,285 kg N na 102 kg N2O 33 tons CO2e 0.0%
Aspen Golf Course 4,888 kg N na 153 kg N2O 50 tons CO2e 0.0%
City of Aspen Parks & athletic fields 1,806 kg N na 56 kg N2O 18 tons CO2e 0.0%
Private greenspace within city limits 15,078 kg N na 470 kg N2O 153 tons CO2e 0.0%
Private greenspace within Urban Growth Boundary 6,888 kg N na 215 kg N2O 70 tons CO2e 0.0%
Total nitrous oxide sources 31,945 kg N na 997 kg N2O 325 tons CO2e 0.0%
Total various units 10,665,552 10^6 Btu various units 828,648 tons CO2e 100.0% 155
Methane and nitrous oxide of total emissions 1,104 tons CH4 25,711 tons CO2e 3.1%
Carbon dioxide of total emissions 802,937 tons CO2 96.9%
Original total: 840,888 12,240 tons, net revision GA jets
2004
AspenSum2007.xls

Compare 2004 & 2007
1
2
3
4
5
67
8
9
10
11
12
13
14
15
16
17
18
19
20
21
22
23
24
25
26
27
28
29
30
31
32
33
34
35
36
37
38
39
40
41
42
43
44
45
46
47
48
49
50
51
52
53
54
55
56
57
58
59
60
61
62
63
64
65
66
67
68
69
70
71
72
73
74
75
76
77
78
79
80
81
O P Q R S T U V W X Y Z AA AB
Greenhouse Gas Emissions Inventory 2007Last modified: 15 April 2009
Physical Units Energy
Units
GHG
Emissions
CO2
Equivalent
Percent of
Total
lb CO2e
per million
Btu
Buildings: electricity Million Btu
Electricity: Aspen Municipal Utility 64,693,191 kWh 659,871 10^6 Btu 19,091 tons CO2 19,091 tons CO2 2.5% 58
Electricity (MEAN fugitive methane - coal mining) 8 tons CH4 322 10^6 Btu 8 tons CH4 207 tons CO2e 0.0% 1,287
Electricity: Holy Cross Energy 159,436,793 kWh 1,626,255 10^6 Btu 134,929 tons CO2 134,929 tons CO2 17.7% 166
Electricity (Xcel fugitive methane - coal mining) 87 tons CH4 3,365 10^6 Btu 87 tons CH4 2,165 tons CO2e 0.3% 1,287
Total electricity 224,129,984 kWh 2,289,812 10^6 Btu na 156,392 tons CO2e 20.6% 137
Buildings: natural gas and propane
Natural Gas (SourceGas) 1,497,844 Mcf 1,233,025 10^6 Btu 72,064 tons CO2 72,064 tons CO2 9.5% 117
Natural Gas (SourceGas - fugitive methane) 411 tons CH4 15,988 10^6 Btu 411 tons CH4 10,286 tons CO2e 1.4% 1,287
Natural Gas (AM Gas) 385,848 Mcf 317,630 10^6 Btu 18,564 tons CO2 18,564 tons CO2 2.4% 117
Natural Gas (AM Gas - fugitive methane) 106 tons CH4 4,119 10^6 Btu 106 tons CH4 2,650 tons CO2e 0.3% 1,287
Propane (AmeriGas, Ferrellgas, Cross, and Propane Svcs) 375,191 gallons 34,267 10^6 Btu 2,377 tons CO2 2,377 tons CO2 0.3% 139
Propane (fugitive methane) 5 tons CH4 201 10^6 Btu 5 tons CH4 129 tons CO2e 0.0% 1,287
Total natural gas & propane 1,883,692 Mcf 1,605,230 10^6 Btu na 106,070 tons CO2e 14.0% 132
Buildings: other
AVH Hospital (diesel generator) 1,200 gallons 166 10^6 Btu 13 tons CO2 13 tons CO2 0.0% 161
Refrigerants, halocarbons, CFCs, etc. na na 10^6 Btu lbs CO2e na tons CO2e 0.0%
Total buildings 376,391 gallons 3,895,209 10^6 Btu lbs CO2e 262,475 tons CO2e 34.5% 135
Transportation: highway, around town, buses
Commuting via Hwy 82 11,778,838 gallons 1,473,191 10^6 Btu 117,242 tons CO2 117,242 tons CO2 15.4% 159
Driving around town 3,804,498 gallons 475,832 10^6 Btu 37,713 tons CO2 37,713 tons CO2 5.0% 159
Tourist road travel to & from Aspen 4,002,349 gallons 500,578 10^6 Btu 39,211 tons CO2 39,211 tons CO2 5.2% 157
Transit Buses (RFTA) 439,040 gallons 60,895 10^6 Btu 4,395 tons CO2 4,395 tons CO2 0.6% 144
School Buses (Aspen School District - diesel) 17,500 gallons 2,427 10^6 Btu 196 tons CO2 196 tons CO2 0.0% 161
Other School District vehicles - gasoline 12,500 gallons 1,563 10^6 Btu 122 tons CO2 122 tons CO2 0.0% 157
Out-of-school-district fuel (ExEd trips, away games, gasoline)5,000 gallons 625 10^6 Btu 52 tons CO2 52 tons CO2 0.0% 168
Pitkin County Public Works heavy vehicles (diesel) 8,865 gals (*0.2) 1,230 10^6 Btu 99 tons CO2 99 tons CO2 0.0% 161
Pitkin County Public Works - sheriff etc. (gasoline) 8,812 gals (*0.2) 1,102 10^6 Btu 86 tons CO2 86 tons CO2 0.0% 157
City of Aspen equipment (diesel fuel) 57,611 gallons 7,991 10^6 Btu 645 tons CO2 645 tons CO2 0.1% 161
City of Aspen vehicles (gasoline) 37,823 gallons 4,731 10^6 Btu 371 tons CO2 371 tons CO2 0.0% 157
Aspen Skiing Company (diesel and gasoline consumption) 237,350 gallons 29,686 10^6 Btu 2,263 tons CO2 2,263 tons CO2 0.3% 152
Off-road fuel (construction, snowmobiles, lawn & snow widgets)101,633 gallons 12,711 10^6 Btu 1,047 tons CO2 1,047 tons CO2 0.1% 165
Ambulances 2,588 gallons 324 10^6 Btu 29 tons CO2 29 tons CO2 0.0% 179
Total highway vehicles, around town, buses, & misc 20,514,406 gallons 2,572,885 10^6 Btu 203,471 tons CO2 203,471 tons CO2 26.8% 158
Transportation: commercial and private aviation
Air Travel - Commercial via Pitkin County Airport 10,022,903 gallons 1,353,092 10^6 Btu 105,681 tons CO2e 105,681 tons CO2e 13.9% 156
Air Travel - Commercial at other airports 3,953,858 gallons 533,771 10^6 Btu 41,689 tons CO2e 41,689 tons CO2e 5.5% 156
Air Travel - General Aviation (jets) 11,598,066 gallons 1,565,739 10^6 Btu 122,289 tons CO2e 122,289 tons CO2e 16.1% 156
Air Travel - General Aviation (turboprops) 582,952 gallons 78,699 10^6 Btu 6,147 tons CO2e 6,147 tons CO2e 0.8% 156
Air Travel - General Aviation (piston aircraft) 112,489 gallons 13,520 10^6 Btu 1,032 tons CO2 1,032 tons CO2 0.1% 153
Air Travel - General Aviation (Air Ambulance flights) 6,909 gallons 830 10^6 Btu 69 tons CO2 69 tons CO2 0.0% 166
Total commercial and private aviation 26,277,176 gallons 3,545,650 10^6 Btu 276,907 tons CO2 276,907 tons CO2e 36.4% 156
Total transportation 46,791,582 gallons 6,118,536 10^6 Btu 480,378 tons CO2 480,378 tons CO2 63.2% 157
Landfill
Landfill & Materials Recovery: electricity 153,511 kWh 1,566 10^6 Btu 66 tons CO2 66 tons CO2 0.0% 84
Landfill & Materials Recovery: diesel & gasoline fuel 6,826 gallons 947 10^6 Btu 38 tons CO2 38 tons CO2 0.0% 79
Landfill: fugitive methane 679 tons CH4 32,904 10^6 Btu 679 tons CH4 16,969 tons CO2e 2.2% 1,031
Total landfill various 35,416 10^6 Btu na 17,072 tons CO2e 2.2% 964
Nitrous Oxide sources
Maroon Creek Club 3,458 kg N na 108 kg N2O 35 tons CO2e 0.0%
Aspen Golf Course 4,051 kg N na 126 kg N2O 41 tons CO2e 0.0%
City of Aspen parks and greenspaces 1,502 kg N na 47 kg N2O 15 tons CO2e 0.0%
City of Aspen athletic fields 2,687 kg N na 84 kg N2O 27 tons CO2e 0.0%
Private greenspace within city limits 15,078 kg N na 470 kg N2O 153 tons CO2e 0.0%
Private greenspace within Urban Growth Boundary 6,883 kg N na 215 kg N2O 70 tons CO2e 0.0%
Total nitrous oxide sources 33,659 kg N na 1,050 kg N2O 343 tons CO2e 0.0%
Total various units 10,049,161 10^6 Btu various units 760,268 tons CO2e 100.0% 151
Methane and nitrous oxide of total emissions 1,291 tons CH4 32,619 tons CO2e 4.3%
Carbon dioxide of total emissions 727,649 tons CO2 95.7%
2007
AspenSum2007.xls

Compare 2004 & 2007
1
2
3
4
5
67
8
9
10
11
12
13
14
15
16
17
18
19
20
21
22
23
24
25
26
27
28
29
30
31
32
33
34
35
36
37
38
39
40
41
42
43
44
45
46
47
48
49
50
51
52
53
54
55
56
57
58
59
60
61
62
63
64
65
66
67
68
69
70
71
72
73
74
75
76
77
78
79
80
81
AC AD AE AF AG AH AI AJ AK AL AM AN AO
Comparing 2004 and 2007: Fuel & EnergyLast modified: 15 April 2009
Fuel and energy comparisons Btu comparisons
2004 2007 Change 2004 2007 Change
Table 1 title: Electricity: comparing 2004 to 2007 Table 8 title: Building energy sources: comparing 2004 to 2007
x-axis legend items: kWh kWh Change x-axis legend items: million Btu million Btu Change
Aspen Electric 62,872,609 64,693,191 2.90% Aspen Electric 641,301 659,871 2.90%
Holy Cross 141,283,859 159,436,793 12.8% Holy Cross 1,441,095 1,626,255 12.85%
Total 204,156,553 224,129,984 9.78% SourceGas 1,252,365 1,233,025 -1.54%
AM Gas 313,091 317,630 1.45%Table 2 title: Natural gas: comparing 2004 to 2007 Propane vendors 45,692 34,267 -25.00%
x-axis legend items: Mcf Mcf Change Total energy in buildings 3,693,544 3,871,048 4.81%
SourceGas 1,452,744 1,497,844 3.10%
AM Gas 363,186 385,848 6.24% Table 9 title: Total building energy: comparing 2004 to 2007
Total 1,815,930 1,883,692 3.73% x-axis legend items: million Btu million Btu Change
Electricity 2,082,396 2,286,126 9.78%Table 3 title: Propane: comparing 2004 to 2007 Natural gas 1,565,457 1,550,655 -0.95%
x-axis legend items: gallons gallons Change Propane 45,692 34,267 -25.00%
Propane vendors 1,815,930 375,191 -79.34% Methane: elec, gas, & propane 29,330 23,994 -18.19%
AVH diesel 166 166 0.00%
12 Total buildings 3,723,041 3,895,209 4.62%
2004 2007
2004 2007Table 4 title: Ground transportation: comparing 2004 to 2007 Table 10 title: Ground transportation: comparing 2004 to 2007
x-axis legend items: gallons gallons Change x-axis legend items: million Btu million Btu Change
Commuting 12,635,963 11,778,838 -6.78% Commuting 1,580,393 1,473,191 -6.78%
Around town 3,698,454 3,804,498 2.87% Around town 462,569 475,832 2.87%
Tourist driving 4,117,548 4,002,349 -2.80% Tourist driving 514,986 500,578 -2.80%
RFTA 291,989 439,040 50.36% RFTA 40,499 60,895 50.36%
School buses 17,420 17,500 0.46% School buses 2,416 2,427 0.46%
ASD vehicles 13,380 12,500 -6.58% ASD vehicles 1,673 1,563 -6.58%
Out-of-town ASD 5,352 5,000 -6.58% Out-of-town ASD 669 625 -6.58%
Pitkin County diesel 11,870 8,865 -25.32% Pitkin County diesel 1,485 1,230 -17.18%
Pitkin County gasoline 7,581 8,812 16.24% Pitkin County gasoline 1,051 1,102 4.82%
City of Aspen diesel 33,588 57,611 71.52% City of Aspen diesel 4,659 7,991 71.52%
City of Aspen gasoline 62,590 37,823 -39.57% City of Aspen gasoline 7,828 4,731 -39.57%
SkiCo diesel & gasoline 210,468 237,350 12.77% SkiCo diesel & gasoline 26,323 29,686 12.77%
Off-road fuel 150,440 101,633 -32.44% Off-road fuel 18,816 12,711 -32.44%
Ambulances 2,588 2,588 0.00% Ambulances 324 324 0.00%
Total ground fuel 21,259,230 20,514,406 -3.50% Total ground fuel 2,663,691 2,572,885 -3.41%
RFTA (147,051) gallons RFTA
Total ground 744,825 gallons Total groundTable 5 title: Air travel & aviation: comparing 2004 to 2007 Table 11 title: Air travel & aviation: comparing 2004 to 2007
x-axis legend items: gallons gallons Change x-axis legend items: million Btu million Btu Change
Air travel via Aspen 12,983,681 10,022,903 -22.80% Air travel via Aspen 1,752,797 1,353,092 -22.80%
Air travel via other airports 4,710,566 3,953,858 -16.06% Air travel via other airports 635,926 533,771 -16.06%
GA: jets 13,027,830 11,598,066 -10.97% GA: jets 1,758,757 1,565,739 -10.97%
GA: turboprops 662,942 582,952 -12.07% GA: turboprops 89,497 78,699 -12.07%
GA: piston 123,648 112,489 -9.03% GA: piston 14,861 13,520 -9.03%
GA: air ambulance 7,413 6,909 -6.80% GA: air ambulance 891 830 -6.80%
Total air travel & aviation 31,516,080 26,277,176 -16.62% Total air travel & aviation 4,252,730 3,545,650 -16.63%
GA fuel 13,821,833 12,300,415 -11.01%
Total transportation 53,276,784 46,791,582 -12.17% Table 11b Total transportation 6,916,421 6,118,536 -11.54%
6,485,203 gallons
Table 6 title: Landfill energy & methane: comparing 2004 to 2007 Table 12 title: Landfill energy & methane: comparing 2004 to 2007
x-axis legend items: various various Change x-axis legend items: million Btu million Btu Change
Electricity 110,476 153,511 38.95% Electricity 1,127 1,566 38.95%
Diesel & gasoline 4,849 6,826 40.77% Diesel & gasoline 673 947 40.77%
Fugitive methane 500 679 35.75% Fugitive methane 24,291 32,904 35.46%
Table 7 title: Nitrous oxide: comparing 2004 to 2007 Table 13 title: Nitrous oxide: comparing 2004 to 2007
x-axis legend items: kg N kg N Change x-axis legend items: million Btu million Btu Change
Golf courses 8,173 7,509 -8.13% Golf courses
City parks & fields 1,806 4,189 131.94% City parks & fields not applicable
Private greenspaces 21,966 21,961 -0.02% Private greenspaces
Total nitrous oxide 31,945 33,659 5.36% Total nitrous oxide
Total various various na Table 14 title: Total energy (in Btu): comparing 2004 to 2007
x-axis legend items: million Btu million Btu Change
Table 4.2 Commuting 12,635,963 11,778,838 Total 10,665,552 10,049,161 -5.78%
Around town 3,698,454 3,804,498
Tourist driving 4,117,548 4,002,349
RFTA 291,989 439,040
SkiCo diesel & gasoline 210,468 237,350
Off-road fuel 150,440 101,633
AspenSum2007.xls

Compare 2004 & 2007
1
2
3
4
5
67
8
9
10
11
12
13
14
15
16
17
18
19
20
21
22
23
24
25
26
27
28
29
30
31
32
33
34
35
36
37
38
39
40
41
42
43
44
45
46
47
48
49
50
51
52
53
54
55
56
57
58
59
60
61
62
63
64
65
66
67
68
69
70
71
72
73
74
75
76
77
78
79
80
81
AP AQ AR AS AT AU AV AW AX AY AZ BA BB
Comparing 2004 and 2007: Greenhouse Gas EmissionsLast modified: 15 April 2009
GHG emissions comparisons GHG emissions comparisons
2004 2007 Change 2004 2007 Change
Table 15 title: Electricity, natural gas, and propane emissions: comparing 2004 to 2007Table 23 title: Major emissions sources: comparing 2004 to 2007
x-axis legend items: tons CO2e tons CO2e Change x-axis legend items: tons CO2e tons CO2e Change
Aspen Electric 39,756 19,298 -51.46% Electricity 166,557 156,392 -6.10%
Holy Cross 126,801 137,094 8.12% Natural gas 103,430 103,564 0.13%
SourceGas 82,744 82,350 -0.48% Commuting 125,714 117,242 -6.74%
AM Gas 20,686 21,214 2.55% Around town 36,720 37,713 2.70%
Propane vendors 3,325 2,506 -24.63% Tourist driving 40,340 39,211 -2.80%
Total energy in buildings 273,324 262,475 -3.97% Air travel via Aspen 136,946 105,681 -22.83%
Total Gas & Propane (& AVH) 106,768 106,083 -0.64% Air travel via other airports 49,685 41,689 -16.09%Table 16 title: Total building emissions: comparing 2004 to 2007 GA: jets 137,411 122,289 -11.00%
x-axis legend items: tons CO2e tons CO2e Change Landfill methane 11,500 16,969 47.55%
Electricity 166,557 156,392 -6.10%
Natural gas 103,430 103,564 0.13% Subtotal, 9 major sources 808,302 740,749 -8.36%
Propane 3,325 2,506 -24.63% Major sources, percent of total 97.54% 97.43%
Methane: elec, gas, & propane incl above incl above Natural Gas (alt adjust NOT made) 103,430 107,429 3,865 tons
AVH diesel 13 13 0.00%
Total buildings 273,324 262,475 -3.97% Table 24 title: Building, ground travel, and air travel emissions: comparing 2004 to 2007
10,849 tons CO2 x-axis legend items: tons CO2e tons CO2e Change
2004 2007 Total buildings 273,324 262,475 -3.97%Table 17 title: Ground transportation emissions: comparing 2004 to 2007 Ground transportation 211,175 203,471 -3.65%
x-axis legend items: tons CO2e tons CO2e Change Total air travel & aviation 332,247 276,907 -16.66%
Commuting 125,714 117,242 -6.74%
Around town 36,720 37,713 2.70% Subtotal, 3 major sources 816,746 742,853 -9.05%
Tourist driving 40,340 39,211 -2.80% Major sources, percent of total 98.56% 97.71%
RFTA 3,139 4,395 40.01%
School buses 195 196 0.46% Table 17.2 title: Major ground transportation: comparing 2004 to 2007
ASD vehicles 131 122 -6.58% x-axis legend items: tons CO2e tons CO2e Change
Out-of-town ASD 56 52 -6.58% Commuting 125,714 117,242 -6.74%
Pitkin County diesel 116 99 -14.69% Around town 36,720 37,713 2.70%
Pitkin County gasoline 85 86 1.75% Tourist driving 40,340 39,211 -2.80%
City of Aspen diesel 376 645 71.52% RFTA 3,139 4,395 40.01%
City of Aspen gasoline 613 371 -39.57% SkiCo diesel & gasoline 2,007 2,263 12.75%
SkiCo diesel & gasoline 2,007 2,263 12.75% Off-road fuel 1,654 1,047 -36.69%
Off-road fuel 1,654 1,047 -36.69%
Ambulances 29 29 0.00% Table 25 title: Major sources: comparing 2004 to 2007
Ground transportation 211,175 203,471 -3.6% x-axis legend items: tons CO2e tons CO2e Change
7,704 tons CO2 Buildings 273,324 262,475 -3.97%
RFTA (1,256) Transportation 543,422 480,378 -11.60%Table 18 title: Air Travel & General Aviation: Comparing 2004 to 2007 Other sources 11,902 17,414 46.31%
x-axis legend items: tons CO2e tons CO2e Change Total 828,648 760,268 correct sum
2004 Air Travel Air travel via Aspen 136,946 105,681 -22.83% 38%
186,631 Air travel via other airports 49,685 41,689 -16.09% 15% Table 26 title: Major sources: comparing 2004 to 2007
GA: jets 137,411 122,289 -11.00% 44% x-axis legend items: tons CO2e tons CO2e Change
2007 Air Travel GA: turboprops 6,992 6,147 -12.10% 2% 53.2% Electricity 166,557 156,392 -6.10%
147,370 GA: piston 1,135 1,032 -9.03% 0% Natural gas & propane 106,754 106,070 -0.64%
Change GA: air ambulance 78 69 -12.01% 0% Ground transportation 211,175 203,471 -3.65%
21.0% Total air travel & aviation 332,247 276,907 -16.66% Air travel & aviation 332,247 276,907 -16.66%
55,340 change, tons Landfill 11,577 17,072 47.46%Table 18.2 Total transportation 543,422 480,378 -11.60% Nitrous oxide 325 343 5.36%
63,044 2,471 Aspen homes @25.51 tons Total 828,635 760,254 only excl AVH diesel
Table 19 title: Landfill energy & methane emissions: comparing 2004 to 2007
x-axis legend items: tons CO2e tons CO2e Change Table 27 title: Major air and ground transportation emissions: comparing 2004 to 2007
Electricity 50 66 32.16% x-axis legend items: tons CO2e tons CO2e Change
Diesel & gasoline 27 38 38.53% Commuting 125,714 117,242 -6.74%
Fugitive methane 11,500 16,969 47.55% Around town 36,720 37,713 2.70%
(5,495) Total landfill 11,577 17,072 47.46% Tourist driving 40,340 39,211 -2.80%Table 20 title: Nitrous oxide emissions: comparing 2004 to 2007 Air travel via Aspen 136,946 105,681 -22.83%
x-axis legend items: tons CO2e tons CO2e Change Air travel via other airports 49,685 41,689 -16.09%
Golf courses 83 76 -8.13% GA: jets 137,411 122,289 -11.00%
City parks & fields 18 43 131.94%
Private greenspaces 224 224 -0.02% Table 28 title: GA Jets & Turboprops: comparing 2004 to 2007
Total nitrous oxide 325 343 5.36% x-axis legend items: tons CO2e tons CO2e Change
11,902 17,414 46.31% General Aviation: Jets 137,411 122,289 -11.00%Table 21 title: Total Aspen emissions: comparing 2004 to 2007 General Aviation: Turboprops 6,992 6,147 -12.10%
x-axis legend items: tons CO2e tons CO2e Change Total 144,403 128,436 -11.06%
Total 828,648 760,268 -8.25% All GA Total 145,616 129,537 -11.04%
Table 22 title: Emissions by GHG gas: comparing 2004 to 2007
x-axis legend items: tons CO2e tons CO2e Change Table 29 title: GA Jets & Turboprops: comparing 2004 to 2007
Carbon dioxide 802,937 727,649 -9.38% x-axis legend items: tons CO2e tons CO2e Change
Methane 25,386 32,276 27.14% Air travel via Aspen 136,946 105,681 -22.83%
Nitrous Oxide 325 343 5.36% Air travel via other airports 49,685 41,689 -16.09%
Total GHG 828,648 760,268 -8.25% Total commercial Air Travel 186,631 147,370 -21.04%
68,381 2,680.54 homes
AspenSum2007.xls

Compare 2004 & 2007
1
2
3
4
5
67
8
9
10
11
12
13
14
15
16
17
18
19
20
21
22
23
24
25
26
27
28
29
30
31
32
33
34
35
36
37
38
39
40
41
42
43
44
45
46
47
48
49
50
51
52
53
54
55
56
57
58
59
60
61
62
63
64
65
66
67
68
69
70
71
72
73
74
75
76
77
78
79
80
81
BC BD BE BF BG BH BI BJ BK BL BM BN BO BP
Comparing 2004 and 2007: Energy Costs, & MiscellaneousLast modified: 15 April 2009
Emissions, Energy Cost, and electricity EF comparisons
2004 2007 2004 2007linked to “ElectricityCarbon2007.xls”
Table 30 title: Electricity consumption & emissions: comparing 2004 to 2007 Aspen Muni Holy Cross Energy
tons CO2e kWh kWh tons CO2e tons CO2e CO2 per kWh generated 0.5509 1.5800
Aspen Electric 62,872,609 64,693,191 39,756 19,298 CO2 per kWh delivered 0.5902 1.6926
Holy Cross 141,283,859 159,436,793 126,801 137,094 Methane (as CO2e) 0.0064 0.0272
Total CO2e/kWh 0.5966 1.7197
Compare 2004: 1.2646 1.7950
2004 2007 Percent change: 52.8% 4.2%Table 31 title: Highway 82 & commuting emissions: comparing 2004 to 2007
x-axis legend items: tons CO2e tons CO2e Change 2004 2007Passenger cars (sedans, cabriolets, etc) 24,542 24,491 -0.21% Table 34 title: Electricity emission factors: comparing 2004 to 2007Small SUVs and small pick-up trucks 13,841 26,446 91.07% x-axis legend items:lb CO2/kWh lb CO2/kWh Change
Medium/Large SUVs and large “light” trucks 66,513 46,463 -30.14% Aspen Electric Dept 1.2646 0.5966 52.8%2-axle medium-duty trucks, RVs 5,357 4,967 -7.27% Holy Cross Energy 1.7950 1.7197 4.2%3-axle trucks, dump trucks, etc 11,927 7,613 -36.17% Sales weighted average 1.3955 Semis, combination trucks 3,474 7,185 106.85% Simple average 1.5298 1.1582 Motorcycles 61 77 24.59%
Building, ground travel, and air travel emissions: comparing 2004 to 2007 excludes
RFTA 3,139 4,395 Table 35 RFTA Air Travel & General Aviation: Comparing 2004 to 2007
School buses 195 196 x-axis legend items: tons CO2e tons CO2e Change
Total Air Travel 186,631 147,370 -21.04%Table 32 Total General Aviation 145,616 129,537 -11.04%
Vehicle type survey, August 2008 Total 332,247 276,907 -16.66%
# of vehicles Percent Air Travel change 39,260 1,539 homes
Passenger cars 1,844 26.8% GA change 16,079 630 homes
Light trucks & SUVs 1,820 26.5%
Med&Hvy trucks/SUVs 2,691 39.1%
Large 2-axle trucks 176 2.6%
Large 3-axle trucks 168 2.4%
Semis 50 0.7%
Buses (RFTA) 88 1.3%
Motor cycles * 0.5 44 0.6%
Total 6,881 100.0%
2004 2007Table 33 title: Cost of energy: comparing 2004 to 2007 Cost of energy: comparing 2004 to 2007
x-axis legend items: commodity units cost per unit cost commodity units cost per unit cost
Aspen Electric 62,872,609 kWh 0.08$ 4,715,446$ 64,693,191 kWh 0.09$ 5,822,387$
Holy Cross 141,283,859 kWh 0.08$ 11,302,709$ 159,436,793 kWh 0.08$ 13,233,254$
SourceGas 1,452,744 Mcf 10.75$ 15,616,996$ 1,497,844 Mcf 13.06$ 19,561,838$
AM Gas 363,186 Mcf 9.43$ 3,424,844$ 385,848 Mcf 11.32$ 4,367,802$
Propane vendors 1,815,930 gallons 1.31$ 2,373,420$ 375,191 gallons 1.89$ 709,110$
Commuting 12,635,963 gallons 1.42$ 17,980,975$ 11,778,838 gallons 2.34$ 27,527,144$
Around town 3,698,454 gallons 1.43$ 5,288,789$ 3,804,498 gallons 2.34$ 8,891,112$
Tourist driving 4,117,548 gallons 1.43$ 5,888,093$ 4,002,349 gallons 2.34$ 9,353,489$
RFTA 291,989 gallons 1.32$ 384,257$ 439,040 gallons 2.35$ 1,030,865$
School buses 17,420 gallons 1.32$ 22,925$ 17,500 gallons 2.35$ 41,090$
ASD vehicles 13,380 gallons 1.32$ 17,608$ 12,500 gallons 2.35$ 29,350$
Out-of-town ASD 5,352 gallons 1.32$ 7,043$ 5,000 gallons 2.35$ 11,740$
Pitkin County diesel 11,870 gallons 1.32$ 15,621$ 8,865 gallons 2.35$ 20,814$
Pitkin County gasoline 7,581 gallons 1.32$ 9,977$ 8,812 gallons 2.35$ 20,691$
City of Aspen diesel 33,588 gallons 1.32$ 44,202$ 57,611 gallons 2.35$ 135,271$
Major air and ground transportation emissions: comparing 2004 to 2007 City of Aspen gasoline 62,590 gallons 1.32$ 82,368$ 37,823 gallons 2.35$ 88,808$
SkiCo diesel & gasoline 210,468 gallons 1.32$ 276,976$ 237,350 gallons 2.35$ 557,298$
Off-road fuel 150,440 gallons 1.32$ 197,979$ 101,633 gallons 2.35$ 238,634$
Ambulances 2,588 gallons 1.32$ 3,406$ 2,588 gallons 2.35$ 6,077$
Air travel via Aspen 12,983,681 gallons 1.21$ 15,671,303$ 10,022,903 gallons 2.00$ 20,045,806$
Air travel via other airports 4,710,566 gallons 1.21$ 5,685,653$ 3,953,858 gallons 2.00$ 7,907,715$
GA: jets 13,027,830 gallons 2.83$ 36,874,166$ 11,598,066 gallons 4.69$ 54,394,928$
GA: turboprops 662,942 gallons 2.83$ 1,876,401$ 582,952 gallons 4.69$ 2,734,045$
GA: piston 123,648 gallons 2.83$ 349,975$ 112,489 gallons 4.69$ 527,572$
GA: air ambulance 7,413 gallons 2.83$ 20,982$ 6,909 gallons 4.69$ 32,403$
Total 2004 128,132,114$ Total 2007 177,289,243$
2004 2007Table 33.2 title: Cost of energy: comparing 2004 to 2007 Cost of energy: comparing 2004 to 2007
x-axis legend items: commodity units cost per unit cost commodity units cost per unit cost Change
Electricity 204,156,468 kWh 16,018,154$ 224,129,984 kWh 19,055,641$ 19.0%
Natural gas 1,815,930 Mcf 19,041,840$ 1,883,692 Mcf 23,929,640$ 25.7%
Propane 1,815,930 gallons 2,373,420$ 375,191 gallons 709,110$ -70.1%
Ground transportation 21,259,230 gallons 30,220,220$ 20,514,406 gallons 47,952,382$ 58.7%
Aviation 31,516,080 gallons 60,478,480$ 26,277,176 gallons 85,642,469$ 41.6%
Total 2004 128,132,114$ Total 2007 177,289,243$ 38.4%
AspenSum2007.xls

Compare 2004 & 2007
BE38Cell:
Rick Heede:Comment:
CMS reduces the number of motorcycles in the survey (done in Aug08) by half to better reflect annual averages.
BM44Cell:
Rick Heede:Comment:
Cost for residential customers. Coml customers paid 14.5 cents per kWh; not reflected in costs.
BH46Cell:
Rick Heede:Comment:
EIA natuarl gas, 2004, resl & coml.
BM46Cell:
Rick Heede:Comment:
EIA, Natural Gas Prices, 2007, Residential $13.06 and commercial $11.32.
http://tonto.eia.doe.gov/dnav/ng/ng_pri_sum_dcu_nus_a.htm
BH48Cell:
Rick Heede:Comment:
EIA (2008) AER 2007, Table 5.23: Sales Prices to End Users (for motor gasoline, diesel fuel, and propane).
BH63Cell:
Rick Heede:Comment:
EIA (2005) AER 2004, Table 5.22: Sales prices to end users; lists Jet fuel, motor gasoline, diesel, and propane prices.
BH65Cell:
Rick Heede:Comment:
CMS uses the 2007 multiple for Jet Fuel (air carrier) in AER to BC&A nationwide average Jet Fuel costs for private and business aviation for 2004.
BM65Cell:
Rick Heede:Comment:
Business & Commercial Aviation 2007 Operations Planning Guide, Aug07, p. 84: $4.69 average nationwide.
J78Cell:
Rick Heede:Comment:
The original 2004 summary worksheet missed adding in the 13 tons of diesel emissions from AVH. The 2004 total should therefore have been 840,888 tons CO2.
AspenSum2007.xls

Electricity
1
2
3
4
5
6
7
8
9
10
11
12
13
14
15
16
17
18
19
20
21
22
2324
25
26
27
28
29
30
31
32
33
34
35
36
37
38
39
40
41
42
4344
45
46
47
48
49
50
51
52
53
54
55
56
57
58
59
60
A B C D E F G H I J K
Aspen Emissions Inventory: Electricity, 2007Richard Heede
Climate Mitigation ServicesSnowmass, Colorado
File Started: 2 October 2008
Last Modified: 13 April 2009
Data provided by: Data provided by:
Phil Overeynder Steve Casey
Director Member Svcs Supervisor
City of Aspen Electric Dept. Holy Cross Energy City of Aspen Electric Dept if 2004 factors
970-920-5111 970-947-5430 2004 EF: 1.2646 lb CO2/kWh
[email protected] [email protected] tons CO2 Methane, tons CO2e Total, tons
40,907 443 41,350 Savings w. 2007 EF 22,053
2007 Electricity Carbon dioxide EmissionsConsumption Consumption Emission factor Carbon Dioxide Methane Methane Total Total
kWh MWh CO2/kWh tons CO2 tons CH4 tons CO2e tons CO2+CH4 tonnes C-eq
lb CO2/kWh (delivered) lb CH4/MWh 25xCO2 lb CO2-equiv/kWh kg C-eq/kWh
City of Aspen Electric Dept. 0.5902 0.2558 25 0.5966 0.074
Residential: single-family households 17,401,131 17,401 5,135 2.2 56 5,191 1,285
Residential: multi-family 2-4 households 1,812,227 1,812 535 0.2 6 541 134
Residential: multi-family 5+ households 5,079,241 5,079 1,499 0.6 16 1,515 375
Residential: Total 24,292,599 24,293 7,169 3.1 78 7,246 1,794
Commercial 36,063,009 36,063 10,642 4.6 115 10,757 2,663
Industrial - - - - - - -
Municipal 4,249,339 4,249 1,254 0.5 14 1,268 314
Other (irrigation pumps) 88,244 88 26 0.0 0 26 7
Total, Aspen Electric Dept. 64,693,191 64,693 19,091 8.3 207 19,298 4,778
City Electric + Holy Cross Energy, sectors Residential usage 113,201,055 kWh Commercial usage 106,587,946 kWh Irrigation 91,644
Muncipal usage 4,249,339 kWh Total 224,129,984
Consumption Consumption Emission factor Carbon Dioxide Methane Methane Total TotalkWh MWh CO2/kWh tons CO2 tons CH4 tons CO2e tons CO2+CH4 tonnes C-eq
Holy Cross Energy lb CO2/kWh (delivered) lb CH4/MWh 25xCO2 lb CO2-equiv/kWh kg C-eq/kWh
1.6926 1.086 25 1.7197 0.213
Residential 88,908,456 88,908 75,242 48.3 1,207 76,449 18,929
Commercial 70,524,937 70,525 59,684 38.3 958 60,642 15,015
Irrigation 3,400 3 3 0.0 0 3 1
Municipal - - - - - -
Total, Holy Cross Energy 159,436,793 159,437 134,929 87 2,165 137,094 33,944
Residential emissions 83,696 tons CO2e Commercial emissions 71,399 tons CO2e Municipal & Other 1,297
Total 156,392
Consumption Weighted factor Weighted factor Carbon Dioxide Methane Methane Total TotalkWh CO2/kWh CO2e/kWh tons CO2 tons CH4 tons CO2e tons CO2+CH4 tonnes C-eq
Total, Aspen Electric + Holy Cross Energy 224,129,984 1.374 1.396 154,020 95 2,372 156,392 38,722
Future inventorists need to update electricity sales by
each utility and to check the carbon dioxide and
methane emissions factors for each utility’s sources of
purchased electricity. Note: this is calculated at the
“ElectricityCarbon.xls” worksheet. All calculations are
linked and automatically updated all the way to the
AspenSum2007.xls worksheet and its derived charts.
Emissions of carbon dioxide from the combustion of fossil fuels at power
plants supplying electricity to Xcel Energy (via Holy Cross Energy) and to
Municipal Energy Agency of Nebraska (MEAN, via Aspen Electric Dept). Zero-
carbon renewable sources are accounted for (see note under “Emission
factor”). Methane emissions from coal mines supplying power plant fuel are
also included (see note under “Methane” below and the
“ElectricityCarbon.xls” worksheet).
Electricity2007.xls
Electricity
E19Cell:
Rick Heede (Feb09):Comment:
Aspen’s own generation at Ruedi increased from 11 to 17 million kWh (2004 vs 2007), new wind resources, and other low-carbon inititatives lowered Aspen’s estimated carbon factor from 1.26 lb CO2 per kWh delivered in 2004 to
0.588 lb CO2 per kWh delivered in 2007. See “ElectricityCarbon2007.xls” for details.
Rick Heede (2005):
The carbon factors -- the amount of carbon dioxide per average kWh delivered to customers -- varies depending on the fuel mix of each of the electricity providers serving Aspen. *
Aspen Electric Dept purchased two-thirds of its power from the Nebraska Municipal Power Pool (NMPP) in Lincoln, Nebraska in 2004. Data from NMPP on the amount of fossil generation by type (coal- or gas-fired) are used to
calculate the average emission of carbon dioxide per kWh generated. NMPP’s own renewable generation (~4 percent) is factored in, as was a factor for the electricity lost in the transmission grid from Nebraska to Aspen (4.6
percent).
Holy Cross Energy estimated the carbon factor for its electricity based on data from Xcel Energy (from which Holy Cross buys most its power). A small grid-loss factor is also applied in order to estimate the amount of carbon dioxide
associated with the CONSUMPTION of an average kWh of electricity, and, conversely, how much CO2 is avoided per kWh saved. The Holy Cross/Xcel datum of 1.67 lb CO2/kWh x 1.06 = 1.77 lb CO2/kWh consumed. **
* This simplified version excludes the complexities of power generation and delivery in the United States, such as the time of day, electricity “wheeled in” from other generators, peak power times, base loads, availability of hydro and
wind power, maintenance schedules, and so forth. Nonetheless, an average carbon factor can be estimated for each utility. For carbon reduction purposes, the argument can be made that a kWh of electricity saved at night, when
coal-fired power plants are providing base load capacity, keeps more carbon in the ground than during peak times (which is roughly breakfast and dinner time in Aspen), when more of the natural gas plants are supplying a larger
proportion of the power generated.
** The Energy Information Administration estimates average US T&D losses “between the point of generation and delivery to the customer” at nine percent of gross generation EIA 2005, Annual Energy Review 2004, p. 223. We
have reduced this factor to six percent (1.06) to account for the relative proximity of Xcel’s power plants to Holy Cross’s service area. Losses also occur in local grids, powerlines, and transformers.
G20Cell:
Rick Heede (Dec08):Comment:
Prelim: If we take “MEAN’s resource mix (of own generation plus WAPA power purchases) was 82.9 percent coal-fired in 2004, this means a methane factor of 0.3086 lb CH4/MWh x 0.829 = 0.25583 lb CH4/MWh, or 0.25583 x 25
= 6.39574 lb CO2-equivalent per MWh, or 0.00639574 lb CO2e/kWh” and apply it to 2007.
Rick Heede (2005):
We develop a fugitive methane emissions factors for Holy Cross and MEAN-supplied electricity (each utility uses coal from different regions with varying methane emissions factors).
MEAN purchases and/or generates most of its power from plants burning coal from the Great Northern Plains coal basin. These are typically surface mines with methane emissions factors of 14 ft^3 per short ton produced. Since the
net generation of electricity requires -- on average (power plants have widely different heat rates or conversion efficiencies) -- 1.04 lbs of coal per kWh (or 0.96 kWh per lb), then one ton of coal generates 1.92 MWh, or 0.521 tons
of coal required per MWh. Great Northern Plains coal emits 14 ft^3 of methane per ton mined, thus for each MWh of electricity supplied by MEAN 0.521x 14 ft^3 CH4 = 7.3 ft^3 of methane for its coal-based generation. To convert
to lb of methane: 7.3 ft^3 methane x 0.04228 lb/ft^3 = 0.3086 lb methane per MWh.
A similar calculation for Holy Cross electricity -- supplied by Xcel Energy, which uses Piceance Basin coals. These are primarily surface mines generating 77 ft^3 of methane per ton of coal (if underground mines, then 196 ft^3 per
ton in situ), which equals 40.15 ft^3 per MWh of coal-based electricity supplied. To convert to lb of methane: 40.15 ft^3 methane x 0.04228 lb/ft^3 = 1.698 lb methane per MWh.
Note 1: we dilute the above factors by gas-fired generation in the resource mix of both MEAN and Xcel.
In the case of Xcel, 63.97 percent of its generation is by coal, hence we multiply 1.698 lb CH4/MWh x 0.6397 = 1.0862 lb CH4 per MWh of total Xcel generation. Since methane is 25 times as powerful a greenhouse gas as carbon
dioxide, this equals 27.155 lb CO2-equivalent per MWh, or 0.027155 lb CO2-equiv per kWh.
MEAN’s resource mix (of own generation plus WAPA power purchases) was 82.9 percent coal-fired in 2004, this means a methane factor of 0.3086 lb CH/MWh x 0.829 = 0.25583 lb CH4/MWh, or 0.25583 x 25 = 6.3957 lb CO2-
equivalent per MWh, or 0.0063957 lb CO2e/kWh (updated to 25xCO2 in Feb09).
Principal sources (2005):
US Dept of Energy (2005) Voluntary Reporting of Greenhouse Gases (1605b Program: Draft Technical Guidelines, DOE Office of Policy and International Affairs, section 1.E.4.2.1. Coal mining, p. 105-106. The above source reports
(on p. 105) an erroneous conversion factor for lb methane per cubic foot (now corrected in this comment and all fugitive methane calculations from 0.418 to 0.04228 lb/cf). This error was confirmed with DOE VRGG technical staff,
personal communication, 26Sep05.
Personal communication with MEAN and WAPA staff.
EPA eGRID web-accessible database on utility carbon/MWh; www.epa.gov/cleanenergy/egrid
Note 2: Calculation of Methane emissions per ton of coal consumed (national average method, not used)
Electricity2007.xls

Electricity
Methane emitted from surface mining plus underground mining plus post-mining activities plus CH4 vented less CH4 recovered in 2003 equals 2.87 million tonnes CH4 = 6,327 million lb CH4 (EIA Emissions 2003, p. 43);
Coal production in 2003 totaled 1,071.8 million tons (AER 2003, p. 205);
US national average methane emissions: 5.77879 lb CH4 per ton produced.
This method is not used, since the emissions from the coal mining regions of MEAN and Xcel production is more relevant to our emissions survey and affords greater opportunities for credits and savings than does a national average.
H20Cell:
Rick Heede:Comment:
Fugitive methane emissions of coals mined for each utility’s coal-fired power plants diluted by coal-fired percentage of total generation and specific to each utility’s coal-mining regions. This column converts tons of methane into
tons of CO2-equivalent by multiplying by methane’s conversion factor of 25xCO2 (100 hundred year horizon, mole basis), per IPCC Fourth Assessment Report.
E22Cell:
Rick Heede (27Feb09:Comment:
CMS finalized Aspen’s total resource, including MEAN’s (and WAPA’s Upper Great Plains gas-fired spot market purchases of 48 percent gas-fired power & 52 percent hydro from federal dams). See “ElectricityCarbon2007.xls” for
details.
Marta Darby:
14Nov08: Aspen Electric’s carbon factor “verified via letter dated 4/1/08 from Phil Overeynder, City of Aspen Public Works Director.”
I22Cell:
Rick Heede:Comment:
This value calculates the CO2-equivalent factor for each utility’s carbon dioxide and methane emissions per average kWh and accounts for all carbon and non-carbon inputs to its resource mix. This factor also accounts for T&D losses
from generation to delivery. While the factor has accounted for coal and natural gas fuel inputs (chiefly coal with respect to Aspen’s non-renewable sources) as well as fugitve methane from coal mining, this estimate stops at the
mine and power plant gates and does not include the energy and emissions arising from transportation of coal, nor the manufacture of loaders and draglines nor the diesel fuel to run the mining and transportation modes. See the
Boundary definition in the final report for details.
B23Cell:
Rick Heede:Comment:
2004 summary of sales by sector and purchased electricity (WAPA, MEAN) plus generation sources from Phil Overeynder, Director City of Aspen Electric Dept, 15Aug05.
B42Cell:
Rick Heede:Comment:
HCE electricity sales within the inventory geographic area in 2004 provided by Bob Gardner and Steve Casey of Holy Cross Energy. Holy Cross supplies electricity within City Limits (outside the City Electric Dept’s service territory) as
well as buildings and facilities outside City Limits yet within our defined geographic areas-- chiefly contiguous to city limits.
Holy Cross intends to develop a data acquisition protocol based upon the regions within the utility’s Township and Range maps. The relevant sectors were identified in a meeting between Bob Gardner and Steve Casey of HCE and Rick
Heede of Climate Mitigation Services in Aug05.
Holy Cross Energy supplied data for residential and commercial sales only. We have assumed that “commercial” includes sales to the City of Aspen’s buildings, pumps, and facilities and have deducted the 4.57 million kWh from the
HCE provided for this study in order to avoid double-counting. See “Municipal” below.
E42Cell:
Rick Heede:Comment:
Marta Darby:
According to HC letter dated April 17, 2008. HCE carbon factor verified via letter dated 4/17/08 from Stephen Casey, HCE Member Services and Marketing Administrator.
See note under “Carbon factor” above. In sum, we have adjusted Holy Cross/Xcel Energy’s estimated carbon factor up from 1.67 lb CO2/kWh generated to 1.77 lb CO2/kWh consumed by accounting for T&D losses of six percent
(although averages nine percent in US).
G42Cell:
Rick Heede:Comment:
See discussion of fugitive methane per ton of coal mined in Xcel’s service territory (chiefly Piceance Creek Basin) at cell G15 above.
Electricity2007.xls

Electricity
B48Cell:
Rick Heede:Comment:
Holy Cross Energy did not disagggregate electricity sales to the City of Aspen’s buildings, facilities, street lights, and miscellaneous. HCE did supply Lee Cassin of the City Env Health Dept for a separate accounting, in which a total of
4.57 million kWh supplied by Holy Cross Energy for the City’s buildings and facilities outside its own utility’s service territory such as Truscott Place, the ARC (1.74 million kWh), the golf course pumps and buildings (404,600 kWh).
Thus, in our account, we DEDUCT the 4.57 million kWh listed under municipal uses herein from the HCE data supplied for this study listed under “Commercial” above so as to avoid double-counting these sales.
Our purpose is simply to more fully account for all municipal energy uses.
Electricity2007.xls

Electricity carbon factor
1
2
3
4
5
6
7
8
9
10
11
12
13
14
15
16
17
18
19
20
2122
23
24
25
26
27
28
29
30
31
32
33
34
35
36
37
38
39
40
41
42
43
44
45
46
47
48
49
50
51
52
53
54
55
56
57
58
59
60
61
62
63
6465
A B C D E F G H I J K
Aspen Emissions Inventory: Electricity carbon factors, 2007Richard Heede
Climate Mitigation Services Data supplied by
Snowmass, Colorado Phil Overeynder, City of Aspen Electric Dept
File Started 10 September 2008 [email protected], 970-920-5111
Last Modified: 3 March 2009 Jill Jones, [email protected], 402-474-4759
Municipal Energy Agency of Nebraska, MEAN/NMPPRandy Wilkerson, Public Affairs, Western Area Power Administration US EPA eGRID database Steve Casey, Holy Cross EIA Annual Energy Review
720-962-7056, <[email protected]> epa.gov/cleanenergy/egrid [email protected] www.eia.doe.gov970-947-5430
Table 1: Calculation of MEAN carbon factor for electricity sold to Aspen Electric Dept.
2007 MEAN US power sector US power sector US power sector US power sector MEAN MEAN MEANMEAN GenMix 2007 Emissions by source Emissions by source Electric generation Elec emissions rate Total emissions Emissions rate Generation by source
MWh Million tonnes CO2 Million sh tons CO2 Billion kWh lb CO2/kWh gen short tons CO2 lb CO2/kWh (gen) percentCoal 15,730 1,918 2,115 1,970 2.147 16,887 2.147 58.63%Wind 529 1.97%WAPA (2007: 1/2 UGP + 1/2 LAP) 4,341 0.521 1,131 0.521 16.18%Oil & Natural Gas (50/50 per MEAN) 1,416 196 216 397 1.516 1,073 1.516 5.28%Nuclear 4,813 17.94%
Total, and average 26,829 3,721 19,091 1.4231 100.00%
Table 1B. WAPA fossil vs hydro, 2007 market purchases (MWh) total sales (MWh) Percent market (fossil) Average MEAN factor/deliv. kWh MEAN fossil percentageWAPA Upper Great Plains (UGP) 48.0% 40.4% 1.5245 70.45%
WAPA Loveland Area Projects (LAP) 829,139 2,527,072 32.8% 50% UGP & 50% LAP
Table 2: Aspen Electric Dept carbon factor 2007 Table 3. Aspen Muni: Renewables and non-carbon fractionsSources Generation sources Emissions rate Total emissions Emissions rate 2007 Renewables fraction Non-carbon fraction
kWh (2007) lb CO2/kWh (gen) short tons CO2 lb CO2/kWh (del) Renewables source Aspen Electric, kWh Aspen Electric, kWhMEAN 26,829,000 1.4231 19,091 MEAN wind, hydro /nuclear 3,116,013 7,929,013 WAPA (direct) 4,992,000 near zero near zero WAPA/CRSP direct hydro 4,992,000 4,992,000 Ruedi Hydro 17,145,000 zero zero Ruedi hydro 17,145,000 17,145,000 Maroon Creek 2,262,000 zero zero Maroon hydro 2,262,000 2,262,000 Windpower 18,074,534 zero zero Aspen wind contract 18,074,534 18,074,534 Total Gen/Gross Purch. 69,302,534 0.55094 CO2/kWh generated Total renewables 45,589,547 50,402,547 Total Sold 64,693,191 19,091 0.59019 CO2/kWh delivered Total generation 69,302,534 69,302,534 T&D losses & unacc 4,609,343 Percent renew/non-carbon 65.78% 72.73%Percent losses & unacc 6.65%
Table 4: US emissions by generating source 2006 (EIA Annual Energy Review) Table 5. Emissions factors (CO2e/kWh consumed), 2007
2006 Emissions Emissions Generation Elec emissions rate Aspen Muni Holy Cross Energymillion tonnes CO2 million tons CO2 billion kWh lb CO2/kWh gen CO2 per kWh generated 0.5509 1.5800
Table 12.7a All Sectors Table 12.7a Table 8.2a CO2 per kWh delivered 0.5902 1.6926 Gas 403.0 444.2 813.0 1.093 Methane (as CO2e) 0.0064 0.0272 Coal 1,974.1 2,176.1 1,990.9 2.186 Total CO2e/kWh 0.5966 1.7197 Total fossil 2,444.4 2,694.5 2,884.4 1.868 Compare 2004: 1.2646 1.7950 Nuclear & renewables 15.4 17.0 1,180.3 0.029 Percent change: 52.8% 4.2%Total Generation 2,459.8 2,711.4 4,064.7 1.334
Electric Power Sector Table 12.7b Table 8.2b Table 6. Holy Cross carbon emissions (system-wide)Gas 337.9 372.5 734.4 1.014 2007 Percent of generation Tons CO2Coal 1,918.4 2,114.7 1,969.8 2.147 Coal 63.97% 728,586 Petroleum 54.8 60.4 59.9 2.017 Natural Gas 25.18% 117,338 Total fossil 2,322.9 2,560.5 2,768.1 1.850 Renewables 7.51% - Nuclear & renewables na na 1,140.0 “Imported - unknown” 3.34% 20,769 Total Generation 2,322.9 2,560.5 3,908.1 1.310 Percent renew/non-carbon 100% 866,694
Commercial & Industrial Sectors Table 12.7c Table 8.2d Gas 65.1 71.8 78.6 1.826
Coal 55.7 61.4 21.2 5.792 Table 7: US EPA data on utility emissions (generation)Total fossil 137.0 151.0 116.3 2.597 eGRID: US ave, 2005 Colorado average 2005 Xcel Energy 2005Nuclear & renewables na na 40.4 lb CO2/kWh lb CO2/kWh lb CO2/kWhTotal Generation 137.0 151.0 156.7 1.927 1.329 1.911 1.692
MEAN’s resource mix must updated for future inventories; average
emissions rates per MWh from coal and natural gas power plants should be
updated with EIA data; Aspen Electric Dept’s electricity supply by source
must also be updated. Aspen’s Phil Overeynder calculates carbon emissions
from its generation sources, plus total procurement and total sales. Holy
Cross also estimates its carbon factor each year.
ElectricityCarbon2007.xls

Electricity carbon factor
B13Cell:
Rick Heede:Comment:
Jill Jones sent account of MEAN Overall Mix and Aspen procurement, in MWh, for 2008.
C13Cell:
:Comment:
KP sent email to Jill Jones on 9/10/08 asking for data
C14Cell:
Rick Heede:Comment:
MEAN’s resource mix by fuel type for 2004 from Jill Jones, MEAN Planning Analyst, 22Aug05. Jones data column in kWh -- which is an error and must mean MWh.
Overall, MEAN data suggest a renewable fract on 3.79 to 4.22 percent for its three Service Schedules. In FY 2004/05, 56.50 GWh were classified as renewable (“includes WAPA hydro, Kimball Wind, and NPPD Wind”) of total sales of
1,337.54 GWh. This agrees with our finding that WAPA is far less than 100 percent hydro generation, or the cited mix would be WAPA 169 GWh of 1,981 GWh total, or 8.6 percent, plus the 31.6 GWh wind line item = 1.6 percent.
D14Cell:
Rick Heede:Comment:
U.S. emissions from the electric power sector in EIA (2005) Annual Energy Review 2004, Table 12.7b. Emissions from commercial or industrial CHP units are not included.
F14Cell:
Rick Heede:Comment:
EIA (2005) Annual Energy Review 2004, Table 8.2b Electricity Net Generation: Electric Power Sector, p. 229. Utility-owned plants only (no industrial or commercial CHPs). Data for 2003.
B18Cell:
Rick Heede (2Mar09):Comment:
Randy Wilkerson (WAPA Loveland Area Projects) provided hydro generation by WAPA (BuRec dams) and market power from steam generators to cover shortage of own generation. CMS assumes that the market purchases from LAP
have Xcel Energy’s emission factor (1.692 lb CO2/kWh [gen]), and that LAP and UGP each contribute 50 percent of MEAN’s total WAPA procurement in 2007. UGP (see note below) 52% hydro + 48% gas-fired. For LAP the percent
market purchase was 32.8 percent in 2007 (829,139 MWh / 2,527,072 MWh).
Wilkerson provided Loveland Area Projects data for WAPA via MEAN to Aspen for 2007 inventory:
FY 2004 Total Energy Sales - 2,717,357 MWh Total Purchased Power - 1,212,754 MWh;
FY 2007 Total Energy Sales - 2,527,072 MWh Total Purchased Power - 829,139 MWh.
3March09 note: CMS formula is “0.5*(F53*E24)+0.5*(J64*E25)”, which accounts (a) for WAPA being mostly hydro from federal dams, (b) the CMS assumption that WAPA buys its purchased power half from LAP and half from UGP,
and (c) that LAP’s 32.8 percent purchased power has an emission factor equal to Xcel Energy’s EF (1,692 lb CO2/MWh) and UGP’s 48 percent purchased power has an emission factor equal to gas-fired generation (see Table 4
below) of 1,014 lb CO2/MWh.
Rick Heede (Feb09):
Jill Jones: “MEAN’s overall mix of WAPA is a combination of LAP, SLCA and UGP. LAP is Loveland Area Projects (also referred to as RMR-Rocky Mountain Region), and SLCA is Salt Lake Area City Area Projects (also referred to as
CRSP-Colorado River Storage Projects).” CMS called WAPA Upper Great Plains (UGP: Radecki & Stonebarger) and RMR in Montrose (Otto) for resource mix. As Radecki confirmed, “we know it isn’t zero” carbon, but don’t know what it
is. Stonebarger for UGP: 52% hydro + 48% gas-fired in 2007. Need RMR data, since UGP only provides some or none of power wired to Aspen.
Tentatively (27Feb): CMS calculates MEAN’s WAPA component as 52 percent hydro (zero carbon) and 48 percent gas-fired generation. May be revised with RMR resource mix. The result (0.487 lb CO2/kWh) compares to BuRec’s
own generation in 2005 (eGRID PRCO05: 0.222 lb CO2/kWh), and WAPA UGP (eGRID PCAL05: 1.840 lb CO2/kWh), and WAPA Lower Colorado (eGRID PCAL05: 0.883 lb CO2/kWh).
Rick Heede (2005):
Western Area Power Administration (WAPA) is typically hydro-power, but WAPA Upper Great Plains (eastern) region is ~70 percent coal and ~30 percent gas; zero hydro is shown. This power has a carbon content of 1,594.96 lb
CO2/MWh generated.
Note 1: WAPA carbon content varies by region: Upper Great Plains (west) is all hydro, hence no carbon/kWh. WAPA Rocky Mountain region emitted 1,884.23 lb CO2/MWh generated.
Source: EPA eGRID emissions database; www.epa.gov/cleanenergy/egrid/index.html (See Owner-Based Power Control Area file, worksheet “EGRDPCAO00”.)
Note 2: a telephone conversation with John Stonebarger, WAPA Energy Mgmt and Marketing official, tel 605-882-7560 (ref from Sam Miller, WAPA in Billings, 406-247-7466, [email protected]): WAPA owns hydro generation
assets along the Missouri River (with zero carbon), but does market power generated by several privately-owned steam plants. We estimate MEAN’s emissions (and thus Aspen Electric Dept’s) on the basis of carbon-content of
purchased power, which in this case includes the fossil plants not owned but marketed with WAPA’s own generation, i.e., 1.595 lb CO2/kWh.
ElectricityCarbon2007.xls

Electricity carbon factor
B19Cell:
Rick Heede:Comment:
Jones, 24Feb09: “Assumes market purchases are 50% natural gas, 50% coal.” CMS therefore averages the Electric Power Sector emission factors of natural gas and petroleum generation, US 2006.
B23Cell:
Rick Heede (2Mar09):Comment:
CMS gathered this data for 2007 from MEAN/NMPP (Jill Jones), Stonebarger and Radecki at WAPA UGP and Wilkerson at WAPA LAP in order to trace fossil-fueled carbon emissions back to WAPA market power purchases. See WAPA
note above for details and sources.
Wilkerson sent details on the sources of LAP 2007 power purchases, e.g., total of 828 GWh, of which 204 GWh from Cargill-Alliant LLC, 144 GWh from Platte River Power Authority (mostly coal-fired gen), 119 GWh from Xcel Energy
(also coal and gas, ave 1.692 lb CO2/kWh), Aquila Inc, etc. While CMS has not reviewed the portfolios of every power source, CMS’ assumption that LAP purchased power averages Xcel Energy’s gas and coal-fired generation seems
reasonable. See note above, under MEAN’s WAPA, for details.
I29Cell:
Rick Heede:Comment:
CMS estimates the Aspen Electric Dept renewables fraction as follows:
MEAN is 4 percent renewable (ie, 4 percent of 44.141 GWh). Source: Jill Jones, MEAN, Aug05, to CMS via Phil Overeynder; this renewables fraction combines MEAN’s Service Schedules J, K, and M (individual breakdowns were not
listed; Aspen gets class M).
.
Aspen Muni purchases power from Colorado River Storage Project via WAPA and/or US Bureau of Recretion’s mostly hydropower facilities on the Colorado and the Colorado Plateau, e.g., Flaming Gorge on the Green River. “WAPA
direct” is 0.986 lb CO2/kWh CRSP emissions divided by coal generation emissions (US average) of 2.15 lb CO2/kWh = 45.86 percent “non-fossil”. This equivalence assigns (100. percent - 45.86 percent) 54.14 percent of “WAPA
direct” to Aspen Muni’s renewable power column, or 5.08 GWh times 0.5414 = 2.751 GWh renewable. This formula may be followed in future years in which Aspen Muni may opt in to additional (non-hydro) power purchases.
Correction, 16Dec05: CMS has determined that WAPA’s CRSP delivered only hydropower to Aspen Muni in 2004; Muni opted out of additional power purchases from coal-fired plants in 2004 that were made available via WAPA/CSRP
to make up for hydropower shortfalls in drought years.
Ruedi, Maroon Creek, and Windpower are, of course, all renewable.
MEAN’s nuclear generation is not entered in this renewable electricity column, even though some proponents and government agencies do preposterously consider nuclear to be a renewable electricity source. The column on the right
estimates “non-carbon fraction,” and does include MEAN’s nuclear generation.
J29Cell:
Rick Heede:Comment:
This is the same calculation as the “renewable fraction” column, but adds MEAN’s nuclear generation as follows:
MEAN’s nuclear generation is factored into this column, as nuclear is typically considered a zero-carbon source of electricity.** MEAN’s nuclear component can be considered non-fossil but not renewable. Then Aspen could add 12.63
percent of MEAN’s power supply, or 44.141 GWh times 0.1263 = 5.575 GWh, which would bump Aspen’s “non-fossil” from 32.15 percent to 40.61 percent. The nuclear generation does, of course, reduce Aspen’s emissions through
nuclear’s dilution of fossil generation by MEAN, and thus reduces Aspen’s average carbon emissions per kWh sold to its customers.
** Zero-carbon electric generation only if one ignores the relatively small but non-zero emissions from uranium mining, coal-fired enrichment services, plant construction, decommissioning, waste storage, transportation, and ultimate
waste disposal: Nuclear Energy Agency (2002) estimates 2.5 to 5.7 gC-e/kWh.
Heede (2004) “Black Hydrogen: An Assessement of the U.S. Department of Energy’s Plans for Nucler Hydrogen Production,” p. 24.
B31Cell:
Rick Heede:Comment:
MEAN’s 2004 generation mix is listed in Table 1.
H31Cell:
Rick Heede:Comment:
CMS calculates MEAN’s resource mix in Table 1. MEAN’s net renewable (accounting for MEAN’s WAPA UGP and LAP purchased power fossil-fuel generation in Table 1B) plus wind. MEAN’s Non-Carbon fraction adds nuclear to its
renewable portfolio.
B32Cell:
Heede (Feb09):Comment:
CMS again adopts the 2004 decision to not count WAPA’s CRSP emission rate (eGRID suggests 883.5 lb CO2/MWh for Lower Colorado; no data for CRSP only) in lieu of the City of Aspen’s non-participation in optional power
purchases.
Rick Heede:
ElectricityCarbon2007.xls

Electricity carbon factor
16Dec05 note: Phil Overeynder to Rick Heede, CMS: “It is true that in aggregate, WAPA purchased coal fired energy to make up part of the difference between their contract obligations and available hydropower. These purchases
were at the request of individual CRSP customers and are tracked and billed separately. Each quarter we are given the choice of whether or not to participate in these additional purchases and generally we decline in favor of making
up the difference in the contract by purchasing MEAN’s available resources. I can quantify this by looking back at the records if you wish to pursue. At any rate, I would argue that close to 100% of our WAPA-CRSP resources are
hydroelectric power since Aspen does not generally participate in these optional purchases.” CMS has thus eliminated carbon emissions from Aspen Muni’s direct power contract with WAPA; that is, from 0.9857 lb CO2/kWh (gen) to
0.0 lb, reducing emissions for the Muni’s procurement of 5.08 GWh from 2,504 tons CO2 to zero tons.
Pre-Dec05 comments:
CMS initially considered Aspen Muni’s direct WAPA contract to be with WAPA’s Rocky Mountain Region (1,884.23 lb CO2/MWh) or with WAPA’s Phoenix PCA (690.427 lb/MWh). Phil Overeynder says the Aspen contract is with
WAPA’s Colorado River Storage Project, NOT the Rocky Mountain region.
CSRP is either US Bureau of Reclamationa (BuRec) Upper Colorado or Lower Colorado Region. The latter is most likely: BuRec Upper Colorado is primarily hydro through its many large and medium-sized dams and powerplants such as
Glen Canyon, Flaming Gorge, Blue Mesa, Collbran, etc. However, according to the EPA power plant emissions database, EGRID lists BuRec’s Upper Colorado as 985.653 lb CO2 per MWh. Source: EPA eGRID2000 EGRDECO worksheet
line #1795, parent name = BuRec, power control area = WAPA - Rocky Mtn Region. www.epa.gov/cleanenergy/egrid/index.html
F43Cell:
Rick Heede:Comment:
This analysis uses US average carbon emissions per kWh generated by source (gas and coal, re: MEAN’s two fossil sources). We calculate emissions for three classes of power plants (utility-owned “power sector”, CHP owned by
commercial and industrial sectors), and combined power sector + CHP). Since MEAN procures power from utility-owned power plants, we use the utility only carbon factor for each gas and coal-fired plants, which are highlighted in red
on the worksheet. These factors are then used in Table 1 to estimate MEAN’s total carbon emissions.
C44Cell:
Rick Heede:Comment:
Energy information Administration (2008) Annual Energy Review 2007. Tables as cited below.
J44Cell:
Rick Heede (13Feb09):Comment:
Steve Casey provided the 2007 carbon intensity: 1.58 lb CO2 per kWh.
Rick Heede (2005):
Holy Cross Energy’s carbon coefficient is taken from HCE published data (“New Carbon Report Card,” Consumer Connection, Sep04. That datum -- 1.67 lb CO2/kWh -- is adjusted upwards by 6 percent to account for transmission
and distribution losses. This US average T&D factor is 9 percent, which CMS arbitrarily reduced to 6 percent in view of Xcel’s generation assets being located in Colorado and not requiring long transmissions distances.
J53Cell:
Rick Heede:Comment:
Holy Cross data for system-wide power procurement, chiefly from Xcel Energy, in 2004. Source: Holy Cross Energy (2004) The Consumer Connection, vol 19(3), September.
Note: CMS has relied on HCE data and has not independently calculated the utility’s carbon emissions.
H54Cell:
Rick Heede:Comment:
Four percent of MEAN’s total resource mix is renewable. In 2004, Aspen Muni’s purchase of 44.1 GWh * 0.04 = 1.77 GWh.
H57Cell:
Rick Heede:Comment:
Holy Cross appears to have used a carbon factor for this unknown generation source at 75 percent of the natural gas emissions rate -- ~0.675 lb CO2/kWh. Estimated from HCA data.
J61Cell:
Rick Heede:Comment:
US EPA eGRID database for 2005 (Jan09), US average emission rate: 1,329.3 lb CO2/MWh. CMS also lists State of Colorado, and Xcel Energy emission rates. Additional emissions from methane and nitrous oxide; see eGRID.
www.epa.gov/cleanenergy/egrid/index.html
J62Cell:
Rick Heede:Comment:
EPA eGRID shows Xcel as 1,763 lb CO2/MWh. CMS instead uses Xcel Energy’s 2006 emission factor (direct from Xcel staff for CMS’ Town of Frisco project) at 1,692 lb CO2/MWh (gen).
ElectricityCarbon2007.xls

Natural Gas
1
2
3
4
5
6
7
8
9
10
11
12
13
14
15
16
17
18
19
20
21
22
23
24
25
26
27
28
29
30
31
32
33
34
35
36
37
38
39
40
41
42
43
44
45
46
47
48
49
50
51
52
53
54
55
A B C D E F G H I J K
Aspen Emissions Inventory for 2007: Natural GasRichard Heede
Climate Mitigation Services Data provided by: Data provided by:
Snowmass, Colorado Jerrad Hammer Bart Levine, President
File Started 11 August 2005 Manager, Regulatory Affairs AM Gas, 970-925-2901
Last Modified: 6 January 2009 Source Gas Jeff Grebe, President
303-243-3496 MechTric Engineering
[email protected] 970-928-9687
Natural Gas Emissions EmissionsConsumption Consumption factor Carbon Dioxide Methane Methane Total Total
2007 Thousand cf (Mcf) Billion Btu (10^9) carbon per btu short tons CO2 short tons CH4 tons CO2e tons CO2e tonnes C-eq
cubic feet/million btu Btu per cubic foot (adj) tonnes C/billion Btu tons CO2/billion Btu tons CH4/ton CO2 tons CO2e/ton CO2 tons CO2e/billlion Btu tonnes C-e/billlion Btu
SourceGas 1,215 823.20 14.47 58.44 0.00571 0.14274 66.79 16.54
Residential 956,705 788 46,029 262.8 6,570 52,599 13,023
Commercial 541,138 445 26,035 148.7 3,716 29,751 7,366
Municipal (included above) - - - - -
Total, SourceGas 1,497,844 1,233 72,064 411 10,286 82,350 20,389
Consumption Consumption Emissions factor Carbon Dioxide Methane Methane Total TotalMcf Billion Btu (10^9) carbon per btu short tons CO2 short tons CH4 tons CO2-eq tons CO2-e tonnes C-eq
AM Gas, Inc. 1,215
Residential - - - - -
Commercial & Institutional 385,848 318 18,564 106.0 2,650 21,214 5,252
Total, AM Gas 385,848 318 18,564 106 2,650 21,214 5,252
Consumption Consumption Emissions factor Carbon Dioxide Methane Methane Total Total
2007 Mcf Billion Btu (10^9) carbon per btu short tons CO2 short tons CH4 tons CO2-eq tons CO2-e tonnes C-eq
SourceGas + AM Gas 1,883,692 1,551 90,628 517 12,936 103,564 25,641
Residential emissions 52,599 tons CO2e Commercial & Institutional emissions 50,965 tons CO2e
50.79% 49.21%
Table 2 Table 3 Table 4 Calculation of methane emissions rate for the natural gas industry Carbon factors (Aspen) Standard conversions Carbon factors (Standard sea level) Methane from natural gas industry: 7.1 million tonnes CH4 116.89 lb CO2/million Btu 1 tonne = 1.1023 tons 117.08 lb CO2/million Btu (sea level)
CO2 from natural gas consumption: 1,237 million tonnes CO2 EIA 2008, methane GWP 133.57 lb CO2e/million Btu 1 tonne = 1,000 kg
Methane emissions rate as CH4 0.00571 kg CH4/kg CO2 25xCO2 0.0962 lb CO2/cf 1 kg = 2.2046 lb 0.121 lb CO2/cf (sea level)
Methane emissions rate as CO2e 0.14274 kg CO2e/kg CO2 0.1100 lb CO2e/cf
CO2 plus methane emissions rate (short tons) 66.787 tons CO2e/billlion Btu 9.622 lb CO2/ccf 120.59 lb CO2/Mcf (sea level)
Carbon plus methane emissions rate (metric) 16.535 tonnes C-e/billlion Btu 10.996 lb CO2e/ccf
96.22 lb CO2/Mcf 973.7 cubic feet/million Btu (sea level)
109.96 lb CO2e/Mcf 1,027.0 Btu/cubic foot
1,215 cubic feet/million Btu 58.44 tons CO2/billion Btu
823.2 Btu/cubic foot
58.44 tons CO2/billion Btu
Table 1
Table 2
Future inventorists must update annual sales from SourceGas.
SourceGas data include natural gas transported for AM Gas.
SourceGas started reporting “Aspen,” “Snowmass Village,” and
“Woody Creek” separately based on billing address zip code of each
jurisdiction. SourceGas also provided a conversion factor based on
altitude of each jurisdiction. CMS adopts this local billing pressure
adjustment and Btu to colume conversion.
NaturalGas2007.xls

Natural Gas
J7Cell:
Rick Heede:Comment:
Jeff Grebe reviewed our pressure altitude adjustments, informed our research on Kinder Morgan’s PUC filings, and provided helpful background the natural gas measurement protocols at altitude.
E14Cell:
Rick Heede:Comment:
Kinder Morgan supplied natural gas sales data in million Btus per month. Emissions from the combustion of natural gas varies slightly (+/- 3 percent) by its heating value. We use the national average heating value of 14.47 milligrams/Btu
or, as it is usually reported, Tg/QBtu (teragrams/quadrillion Btu); in normal parlance this factor equals 14.47 kg of carbon per million Btu, which, at average heating value, equals ~974 cubic feet of gas. Our calculation sidesteps the issue
of how many ccf Kinder Morgan sold in 2004 since the data is reported in units of million Btu. Low-heating value natural gas (say below 950 Btu/cf) is typically due to high CO2 content in the supplied gas.
Factors reported in this column include:
14.47 kg C per million Btu.
Source: U.S. Environmental Protection Agency (2005) Inventory of U.S. Emissions and Sinks: 1990-2003, Annex B: Methodology for Estimating the Carbon Content of Fossil Fuels,
http://yosemite.epa.gov/oar/globalwarming.nsf/content/ResourceCenterPublicationsGHGEmissionsUSEmissionsInventory2003.html
Tonnes CO2 per billion Btu simply multiplies C by 3.664191 -- the isotopically accurate conversion factor -- to convert carbon to CO2, assuming full combustion of the natural gas.
* While the energy content of a cubic foot of natural gas is highly dependent on the pressure altitude at which it is delivered, the carbon content per million Btu, which is the method we employ here, only varies slightly, as mentioned
above. At normal sea level pressure and energy value, one cubic foot of natural gas has a heating value of 1,027 Btu (but can vary from 950 - 1,100 Btu/cf).
At sea level, one hundred cubic feet (ccf) emits 12.0953 lb CO2 upon combustion. At altitude, both the energy content and the carbon emissions will far less per ccf. A controversy over the tariffs charged Aspen customers has arisen
between the City of Aspen and Kinder Morgan: the City contends that the altitude adjustment made by the gas suppliers over-charges local customers for the lowered energy content of the gas supplied. The argument is over a fair price
for the energy rather than the volume of gas delivered: it’s as if popcorn buyers are being charged extra for the inflated air in the bag rather than the weight of popcorn, or electric customers are charged for a kilowatt-hour but only get
930 watt-hours.
See the cell comment at C15 for our calculation of conversion factor (1,160 cubic feet per million Btu, = 862 Btu per cubic foot). This also means: 14.47 kg of C per million Btu = 116.89 lb CO2 per million Btu also equals (per my
calculation) 1,160 cf, then 100 cf = 116.89/11.6 = 10.077 lb CO2 per 100 cf, or 16.44 percent less CO2/cf than at sea level.
Also, the Btu content varies by contract and even by season. Kinder Morgan is required by the Colorado Public Utilities Commission (PUC) to deliver gas with a minimum Btu content of 950 Btu/cf (national average is 1,027 Bt/cf).
F15Cell:
Rick Heede:Comment:
Carbon dioxide emissions are a product of natural gas sales in billion Btu times the carbon emissions factor in column “E.”
G15Cell:
Rick Heede:Comment:
See notes in Table 2 below for methodology used to estimate fugitive methane emissions rate applied to Aspen’s consumption of natural gas.
C17Cell:
John Eisler (Sep08) & Heede (Dec08): Jerrad Hammer (Source Gas Manager of Regulatory Affairs, 303-243-3496, [email protected]), the Pressure Base for the volumes supplied are at 14.73 psia. The gas averaged 1,070 Comment:
Btu/cf for the period of time.
SourceGas calculated a thermal conversion factor in its 2008 Rate Case of 823.2 Btu per cf, or 1,215 cf per million Btu, in Aspen. Woody Creek: 1,198 cf/million Btu, adn Snowmass Village: 1,232 cf/million Btu.
Rick Heede:
At sea level 1 cubic foot (cf) of natural gas contains, on average, 1,027 Btu. Kinder Morgan’s gas averaged 1,070 Btu/cf in 2004.(*) Kinder Morgan’s “local billing pressure” (LBP) is 11.87 psi (vs 14.73 at sea level); 11.87/14.73 =
0.80584 altitude adjustment factor. Therefore, 1 cf at 1,070 Btu*0.80584 = 862.3 Btu; conversely, 1 million Btu = 1,160 cf. This is the conversion factor used here.
However, the City of Aspen has pointed out that Aspen’s pressure altitude is 11.04 psi, not KMI’s LBP of 11.87 psi. If so, then 11.04/14.73 = 0.7495, or: 1 cf at 1,070 Btu*0.7495 = 802 Btu; conversely, 1 million Btu = 1,247 cf. The
City of Aspen argues that Aspen consumers are paying for 862.3 Btu when the actual Btu content of 1 cubic foot is 802 Btu, which means an excess charge of 862.3/802 = 1.0752, or 7.52 percent.
Regardless of the merits of this argument vs KMI’s zonal pressure adjustments, we apply Kinder Morgan’s altitude cubic foot (ACF) factor: 1 million Btu = 1,160 ACF, and 1 ACF = 862.3 Btu.
(*) Brad Van Dyke, KMI, personal communication, 4Oct05.
NaturalGas2007.xls
Natural Gas
B18Cell:
John: Information on the worksheet “2007 Natural Gas Volume Totals for Aspen.xls” seperated gas flows by Aspen, Snowmass and Woody Creek. Therefore all numbers here reflect only the values provided for Aspen and surrounding Comment:
areas, not Woody Creek or Snowmass. 9/16/08
Rick Heede:
Data from Brad Van Dyke and Scott Emerson of Kinder Morgan, 29Sep05.
Van Dyke: “Attached is a file that provides the total amount of gas that flowed through the Aspen/Snowmass and Woody Creek town border stations in 2004. As noted in the file the estimated portion of the gas related to the Aspen area
that flows through the Aspen/Snowmass town border station is about two-thirds. The estimated portion of gas related to residential and commercial in the Aspen area is approximately 50/50. There are no customers classified as
industrial.”
Emerson is Dir of Retail Business Development & Transportation Svcs., KM, PO Box 281304, Lakewood, CO 80228-8304, [email protected], 303-763-3597
Note 1: CMS apportioned KMI sales to Aspen plus Snowmass Village at the Woody Creek TBS on the relative populations of each area rather than on KMI’s estimated “about two-thirds.” Our methodology is as follows: Aspen population
plus Urban Growth Boundary population plus ToSV plus ToSV UGB factor: Aspen 6,455 pop plus 1,186 UGB = 7,641 total Aspen area population with the emissions boundary as a fractoin of ToSV 2,317 pop plus ToSV UGB pop of 426:
Aspen / Aspen plus ToSV = 7,641 / (7,641 + 2,743) = 7,641/10,384 = 73.6 percent. This percentage is applied to KM’s total sales (excluding Woody Creek itself) as measured at the Woody Creek TBS, namely 2,127 billion Btu x 0.736
= 1,565 billion Btu, of which 80 percent is estimated as KM sales (1,251 billion Btu) and 20 percent as transported AM Gas (313 billion Btu).
Note 2: KMI could not provide specific data on natural gas transported for AM Gas, and we use AM Gas’ estimated 20 percent datum. We did confirm that KMI data includes AM Gas.
D19Cell:
Rick Heede:Comment:
CMS reviewed the SourceGas worksheet but found no Bcf to billion Btu conversion, nor an allocation of residential and commercial. Hammer does specify percentage allocations. Check all this work carefully.
johnei:
see worksheet 2007 Natural Gas Volume Totals for Aspen.xls for formula. Pretty sure I didn’t do it right.
B27Cell:
Rick Heede:Comment:
AM Gas supplies natural gas transmitted through KinderMorgan pipelines to several large commercial customers in Aspen. According to AM president Bart Levine, AM delivers ~20 percent of the natural gas consumed in Aspen.
1Oct05: CMS confirmed that Kinder Morgan gas data includes gas transmitted for AM Gas; KMI did not respond to request for specific transported gas quantities or fractional data.
D29Cell:
johnei:Comment:
See comment in box D17
D43Cell:
Rick Heede (Jan09, updated from 2005):Comment:
We estimate the upstream fugitive emissions of methane from the natural gas system from production through delivery. In 2007, U.S. methane emissions from natural gas systems totaled 7.063 million (metric) tonnes; in the same year,
natural gas consumption was 23.055 trillion cubic feet (Tcf; US dry gas production totaled 19.278 Tcf), which equals 0.6754 lb of methane per thousand cubic feet (Mcf) of gas consumed. Thus, (0.6754 lb CH4/Mcf) / 42.37 lb/Mcf
(standard conversion factor, revised by EIA in 2008) = 15.94 cf of methane lost per Mcf of delivered natural gas = 1.594 percent fugitive emission rate; that is, a system loss rate relative to delivered natural gas. This is prior to
accounting for the GWP value of methane, done below and in Table 2. *
We are NOT attributing this additional emissions source to SourceGas or AM Gas. We are, however, allocating such additional systemic emissions to consumers for whom the production occurs.
The result is that an amount equivalent to 14.27 percent of the CO2 emitted by burning natural gas is emitted as fugitive methane by the natural gas industry. That is, a 0.571 percent fugitive methane rate times methane as 25xCO2 =
14.27 percent as CO2e.
* Production (2.03 million tonnes CH4), Gas Processing (0.66 million tonnes), Transmission and Storage (2.41 million tonnes), Distribution (1.97 million tonnes CH4), Total (7.06 million tonnes CH4). We are not including the small
quantities of methane released from end-use equipment in the residential and commercial sectors (0.01 million tonnes CH4). EIA 2008.
Sources: Energy Information Administration (2008) Annual Energy Review 2007; Energy Information Administration (2008) Emissions of Greenhouse Gases in the United States 2007. Note: EIA has adopted the IPCC FAR GWP value of
methane = 25xCO2, EIA 2008, page 12: “Methane. In its Fourth Assessment Report, the IPCC developed revised global warming potential factors (GWPs) for selected gases. The GWP for methane was revised from the previously published
value of 23 in the IPCC’s Third Assessment Report to 25 in the Fourth Assessment Report. The revised GWP for methane is used in this report. In addition, this report incorporates an increase in the density of methane from 42.28 to
NaturalGas2007.xls
Natural Gas
42.37 pounds per thousand cubic feet, in order to provide consistent temperature and pressure values for methane in all EIA data.”
See also Kirchgessner, David A., Robert A. Lott, R. Michael Cowgill, Matthew R. Harrison, & Theresa M. Shires (~2000) Estimate Of Methane Emissions From The U.S. Natural Gas Industry, US EPA: AP 42, Fifth Edition, vol. 1 chapter 14,
www.epa.gov/ttn/chief/ap42/index.h
G43Cell:
Rick Heede:Comment:
These factors are for easy visibility and are derived from the factors calculated in the main worksheet.
The main factors are 19.7 percent lower than at sea level, eg, 96.22 lb CO2/Mcf vs 120.593 lb CO2/Mcf at sea level.
I44Cell:
Rick Heede:Comment:
lb CO2 per million Btu should be the same in Aspen as at sea level at STP. The minor difference derives from the factors supplied by SourceGas. This factor is from the DOE.
E45Cell:
Rick Heede:Comment:
Energy Information Administration (2008) Annual Energy Review 2007; Energy Information Administration (2008) Emissions of Greenhouse Gases in the United States 2007. Note: EIA has adopted the IPCC FAR GWP value of methane =
25xCO2, EIA 2008, page 12: “Methane. In its Fourth Assessment Report, the IPCC developed revised global warming potential factors (GWPs) for selected gases. The GWP for methane was revised from the previously published value of
23 in the IPCC’s Third Assessment Report to 25 in the Fourth Assessment Report. The revised GWP for methane is used in this report. In addition, this report incorporates an increase in the density of methane from 42.28 to 42.37 pounds
per thousand cubic feet, in order to provide consistent temperature and pressure values for methane in all EIA data.”
NaturalGas2007.xls

Propane
1
2
3
4
5
6
7
8
9
10
11
12
13
14
15
16
17
18
19
20
21
22
23
24
25
26
27
28
29
30
31
32
33
34
35
36
37
38
39
40
41
42
43
44
45
46
47
48
A B C D E F G H I J
Aspen Emissions Inventory for 2007: PropaneRichard Heede
Climate Mitigation ServicesSnowmass, Colorado
File Started 7 August 2008
Last Modified: 2 February 2009
Data supplied by: Data supplied by: Data supplied by: Data supplied by: Data not supplied by:
Cross Propane & Supply Propane Services Tad Peed, Mngr. Brian Mater Ferrellgas, Inc.
Tom McBrayer Basalt, 970-927-4757 AmeriGas Corp Comm, HQ, Kansas 970-945-8611
GWS, 970-384-2222 970-963-3113 913-661-1873 970-243-2720
[email protected] [email protected] [email protected]
2007 Propane SalesApproximate
consumptionCarbon Factor Carbon Dioxide Methane Total Emissions Total Emissions
gallons Million Btu lb CO2/gallon tons CO2 tons CO2e tons CO2e tonnes C-e
Propane vendor 12.669 tons CO2e/ton CO2
0.0544
AmeriGas 220,000 20,093 1,394 76 1,469 364 -
Ferrellgas 36,233 3,309 230 12 242 60
Cross Propane & Supply (residential sales) 51,226 4,679 324 18 342 85
Cross Propane & Supply (commercial sales) 17,732 1,620 112 6 118 29
Propane Services, Basalt 50,000 4,567 317 17 334 83
Total propane sold in the Aspen area 375,191 34,267 2,377 129 2,506 620
Methane, tons, @25xCO2 5.17 tons CH4
Methane, percent of total 5.16%
AmeriGas estimate Gallons Sold Percent Percent Aspen & TOSV Conversions
Aspen Area 220,000 64.7% 78.0% 1 gallon propane 91,333 Btu
Woody Creek Area 58,000 17.1% 1 bbl of propane 3.84 million Btu
Snowmass Village Area 62,000 18.2% 22.0% 1 million Btu 10.95 gallons
Total 340,000 100.0% 1 million Btu 138.71 lb CO2
1 million Btu 146.25 lb CO2e
1 gallon propane 12.669 lb CO2
1 gallon propane 0.028 lb CH4
1 gallon propane 13.358 lb CO2e
Future inventorists must request updated propane
sales figures from AmeriGas, Ferrellgas, Cross
Propane, and Propane Services (and any new
propane vendors serving Aspen).
Propane2007.xls
Propane
E17Cell:
Marta Darby:Comment:
2007 factor from CCX - 0.006 metric tons CO2/gallon (conversion to lbs. : 1 metric ton = 2204.6 pounds). CMS corrected this calculation (12Dec08) -- converting from 0.006 tonnes CO2 to lb per gallon is far too inaccurate. CMS
uses standard EF of 12.669 lb CO2 per gallon from DOE, EPA, etc.
Rick Heede:
Carbon factor from Environmental Protection Agency (2005) Inventory of U.S. Emissions and Sinks: 1990-2001 Annex B: Methodology for Estimating the Carbon Content of Fossil Fuels,
http://yosemite.epa.gov/oar/globalwarming.nsf/content/ResourceCenterPublicationsGHGEmissionsUSEmissionsInventory2003.html
F17Cell:
Rick Heede:Comment:
Propane sales times carbon factor of 12.669 lb CO2 per gallon at full combustion / 2000 lb per ton.
G17Cell:
Rick Heede:Comment:
A fugitive methane rate is applied to the propane production and processing infrastructure. See “methane” comments on the “Natural Gas” worksheet, in which production through delivery methane emissions are allocated to Aspen’s
consumption of natural gas. In the case of propane, we allocate the US national fugitive emissions rate for natural gas (from which most propane is processed) in the production and gas processing stages: 2.03 million tonnes CH4
plus 0.66 million tonnes CH4 of total natural gas system methane emissions of 7.06 million tonnes CH4, or 2.69 of 7.06 million tonnes CH4 = 38.102 percent of the natural gas rate -- which is 0.14274 tons CO2e per ton CO2 (see
Natural Gas worksheet, table 2) -- from the propane’s combustion. * Hence, the propane fugitive methane rate is 0.14274 x 0.38102 = 0.05439 tons CO2e per ton of propane delivered to and combusted by Aspen customers.
* Production (2.03 million tonnes CH4), Gas Processing (0.66 million tonnes), Transmission and Storage (2.41 million tonnes), Distribution (1.97 million tonnes CH4), Total (7.06 million tonnes CH4). We are not including the small
quantities of methane released from end-use equipment in the residential and commercial sectors (0.01 million tonnes CH4). EIA 2008.
Sources: Energy Information Administration (2008) Annual Energy Review 2007; Energy Information Administration (2008) Emissions of Greenhouse Gases in the United States 2007.
B22Cell:
Rick Heede (Nov08):Comment:
Peed provided revised data (220,000 gallons in Aspen in 2007); see AmeriGas table below.
Marta Darby:
AmeriGas provides 500k to 625k gallons to Aspen, Woody Creek and Snowmass area.
-- Tadd Peed was unable to provide a more precise value. (per email 9/29/08)
Rick Heede:
2004 propane sales data for the Aspen area (by Township) from Tadd Peed, Manager (Carbondale office), 970-963-3113, [email protected]; personal communication, 7Sep05.
B24Cell:
Rick HeedeComment:
9Oct08, Rick contacted Scott Brockelmeyer at Ferrellgas HQ in Kansas ([email protected], 913-661-1830) for assistance in acquiring propane sales data for Aspen, by zip code. 17Nov08 update: Ferrellgas’ Brian
Mater will get 2007 propane sales for zipcodes 81611 and 81612. Data received 25Nov08, sorted by delivery zip codes 81611 and 81612 or calendar year 2007. Largest delivery totaled 3,960 gallons, smallest 156 gallons, 33 of
67 customers took delivery in 2007, average delivery for all 67 customers was 541 gallons (1,097 gallons for 33 deliveries in 2007).
Marta
8/19/08: FerrellGas declined to provide data. {Spoke with Karen Kraft on the phone who said her boss told her to not work with us on this.}
Rick Heede:
Several requests for data have yielded unmet promises to provide Aspen area propane sales for 2004 (most easily by sorting for zip code).
Contact Karen Kraft, 970-945-8611, [email protected].
B26Cell:
Rick Heede:Comment:
Tom McBrayer, mngr., provided estimates of total propane sales to Aspen-area residential customers based on delivery zip code 81611 and 81612. While this is not an exact match to the Aspen inventory physical boundary, the
modified UGB, since it might include some customers up Independence Pass and Castle Creek Road, it is very close and probably exceeds the accuracy of SourceGas estimates for natural gas delivery to Aspen.
B28Cell:
Rick Heede:Comment:
Propane2007.xls

Propane
Tom McBrayer, mngr., provided estimates of total propane sales to Aspen-area commercial customers based on delivery zip code 81611 and 81612. The deliveries are chiefly of construction cylinders to job sites, including the
Aspen recreation Center, the Aspen Skiing Company, ACES, and private builders.
B30Cell:
Rick Heede (Oct08):Comment:
Bob, owner, estimated a small portion of his RFV sales of 600,000 gallons per year is delivered to Aspen and UGB, and most of this as “construction cylinders” to heat homes during construction. Total estimated Aspen-area sales in
2007 of ~50,000 gallons.
B39Cell:
Rick Heede:Comment:
Tadd Peed provided a revised estimate for Aspen, Snowmass, and Woody Creek regions, 24Nov08. Total of 340,000 gallons (of which 220,000 gallons to Aspen) is significantly lower than the 562,500 gallons estimated in Oct08.
Marta Darby:
Rough estimate:
30% Aspen
50% Snowmass
20% Woody Creek
email from T. Peed 9/30/08
Rick Heede:
2004 propane sales data for the Aspen area (by Township) from Tadd Peed, Manager (Carbondale office), 970-963-3113, [email protected]; personal communication, 7Sep05.
H39Cell:
Rick Heede:Comment:
Basic data from EIA Emission Coefficients (1605b Program), e.g., 532.085 lb CO2 per bbl, 139.178 lb CO2 per million Btu, and 3.836 million Btu per bbl (AER 1995).
Propane2007.xls

Road Vehicles
1
2
3
4
5
6
7
8
9
10
11
1213
1415
16
17
18
19
20
21
22
23
24
25
26
27
28
29
30
31
32
33
34
35
3637
38
39
40
41
42
43
44
45
46
47
48
49
50
51
52
53
54
5556
57
58
A B C D E F G H I J K L M
Aspen Emissions Inventory for 2007: Commuting, Driving Around Town, and Tourist DrivingRichard Heede
Climate Mitigation Services Data from:Snowmass, Colorado John Krueger, Dir.
File Started 11 August 2005 Aspen Transportation Dept.Last Modified: 19 November 2008 970-920-5042
Table 1
Commuting and Hwy 82, 2007 Vehicle by typeAverage daily
traffic, 2007
Annual traffic,
2007Miles per trip Miles driven (VMT) Fuel economy Fuel consumed Carbon factor Carbon dioxide Carbon
28-Aug-08 (both directions) (both directions) miles mpg gallons/yr CO2/gallon tons CO2/yr tonnes carbon7 am - 1 pm
Valley traffic across Castle Creek Bridge 6,793 22,320 8,146,800 (22,180 and 8.096 million vehicles in Krueger’s DailyCount.xls)
Passenger cars (sedans, cabriolets, etc) 27.1% 6,059 2,211,660 25 55,291,495 22.1 2,501,878 19.59 24,511 6,068
Small SUVs and small pick-up trucks 26.8% 5,980 2,182,875 25 54,571,866 20.2 2,701,578 19.59 26,467 6,553
Medium/Large SUVs and large “light” trucks 39.6% 8,843 3,227,536 25 80,688,402 17.0 4,746,377 19.59 46,500 11,513
2-axle medium-duty trucks, RVs 2.6% 578 211,091 25 5,277,279 10.4 507,431 19.59 4,971 1,231
3-axle trucks, dump trucks, etc 2.5% 552 201,496 25 5,037,403 7.4 680,730 22.38 7,619 1,886
Semis, combination trucks 0.7% 164 59,969 60 3,598,145 5.6 642,526 22.38 7,191 1,780
Motorcycles 0.6% 143 52,173 7.5 391,298 50.0 7,826 19.59 77 19
Total 100% 22,320 8,146,800 na 204,855,889 17.4 11,788,344 19.91 117,336 29,051
Table 2
Tourist travel to & from Aspen Vehicle by typeAverage daily
visitor traffic
Aveage annual
visitor traffic
Miles per visitor
tripMiles driven (VMT) Fuel economy Fuel consumed Carbon factor Carbon dioxide Carbon
arrivals arrivals round trip miles mpg gallons/yr CO2/gallon tons CO2/yr tonnes carbon
Visitor vehicle arrivals and departures composite 350 127,750 600 76,650,000 19.15 4,002,349 19.59 39,211 9,708
Total composite 350 127,750 600 76,650,000 19.2 4,002,349 19.59 39,211 9,708
Composite fuel economy of passenger cars, small, medium, and large SUVs and pick-ups: 19.151
Table 3
Driving around town, 2007 Vehicle by typeIn-town driving
VMTArterial roads VMT Local roads VMT Total Aspen VMT Fuel economy Fuel consumed Carbon factor Carbon dioxide Carbon
percent miles miles miles miles mpg gallons/yr CO2/gallon tons CO2/yr tonnes carbon
Daily VMT in 1997, Aspen Area, by road type 117,706 23,157 14,617 155,480
Estimated compound growth rate per year 2.57% 2.57% 2.57%
2004 daily VMT, estimated 140,586 27,658 17,458 185,702
2004 Annual Aspen VMT, estimated 51,313,774 10,095,263 6,372,262 67,781,299
Passenger cars (sedans, cabriolets, etc) 27.1% 13,930,453 2,740,621 1,729,915 18,400,989 22.1 832,624 19.59 8,157 2,020
Small SUVs and light trucks 26.8% 13,749,145 2,704,951 1,707,400 18,161,496 20.2 899,084 19.59 8,808 2,181
Large SUVs and “light” trucks 39.6% 20,329,093 3,999,463 2,524,513 26,853,069 17.0 1,579,592 19.59 15,475 3,831
2-axle medium-duty trucks, RVs 2.6% 1,329,588 261,578 165,111 1,756,277 10.4 168,873 19.59 1,654 410
3-axle trucks, dump trucks, etc 2.5% 1,269,152 249,688 157,606 1,676,446 7.4 226,547 22.38 2,536 628
Semis, combination trucks 0.7% 377,724 74,312 46,907 498,942 5.6 89,097 22.38 997 247
Motorcycles 0.6% 328,620 64,651 40,809 434,080 50.0 8,682 19.59 85 21
Total 100% 51,313,774 10,095,263 6,372,262 67,781,299 17.8 3,804,498 19.83 37,713 9,337
Table 4
All commuting, tourist travel, & driving Total Aspen VMT Fuel economy Fuel consumed Carbon factor Carbon dioxide Carbon
miles mpg gallons/yr CO2/gallon short tons CO2/yr tonnes carbon
Total of Commuting on Hwy 82, Tourist Travel, & Driving Around Town 349,287,187 17.8 19,595,191 19.83 194,260 48,096
The principal variables that need to be updated in future fuel and
emissions inventories are: (a) traffic count at Castle Creek Bridge, (b)
update future VMT within Aspen, and © fuel consumption for each
vehicle type (if needed).
Commuting&Town&Tourism2007.xls

Road Vehicles
B11Cell:
Rick Heede(Mar09):Comment:
CMS updated the calculation chiefly through a revised vehicle type survey done by City staff in Aug08 that re-distrubuted the proportion of vehicles entering town at the Entrance to Aspen. The largest shift was in lowering the percentage
of “Medium and Large SUVs and light trucks” from 53.8 percent in 2004 to 39.6 percent in 2007 -- and a comcomitant increase in
C11Cell:
Rick Heede:Comment:
Kim Petersen and Marta Darba and John Eisler of the City of Aspen Canary Initiative plus several staffers of the Env Health Dept and John Krueger of the City Transportation Dept surveyed vehicle types on 28 August 2008 from 7 am to 1
pm. Vehicle numbers for the two locations -- at Truscott Place and Hwy 82, inbound lane, and Cemetery Lane and Powerplant Road -- were totaled and averaged for this commuting fuel and emissions computation for2007.
The survey counted 6,793 vehicles, for which the distribution by type is shown below. (We exclude 88 RFTA and school buses from this survey, since fuel consumption by RFTA and school buses is estimated elsewhere.) Finally, CMS
annualized the motorcycle percentage by halving the number of motorcycles since bike riding drops to near zero during the winter.
D11Cell:
Rick Heede:Comment:
Final AADT data from Krueger shows 22,320 vehicles per day, Mar09.
Krueger, John D. (2008) Traffic Counts on SH 82 at the Castle Creek Bridge (memo to Mayor and City Council), dated 20 March 2008, 8 pages.
Rick called Krueger to confirm that AADT for 2007 remains 23,013 vehicles per day (JK: yes). Also asked Krueger to reconcile his other data from TrafficDailyCounts2007.xls, which shows AADT of 22,180 vehicles per day (and
8,095,716 vehicles crossing Castle Creek Bridge) in 2007. Kruger will review and respond.
Update 19Nov08: “Rick, It looks like 22,302 is the number. I have not been able to totally reconcile everything but, I am very close. John D. Krueger Director of Transportation.” CMS updated AADT from 23,013 vehicles per day to JK’s
22,302 vehicles per day. This change reduced fial commuting emissions from 120,979 tons CO2 to 117,242 tons CO2, or by 3,737 tons CO2. The 2004 emissions estimate was 125,714 tons CO2.
E11Cell:
Rick Heede:Comment:
“Average Daily Traffic” times 365 days/yr.
F11Cell:
Rick Heede:Comment:
The typical commute to work is assumed to be 25 miles each direction.# We assume that 2-axle trucks (such as FedEx, UPS,* and other working vehicles) travel 20 miles per trip. Heavier 3-axle trucks are also assumed to travel 25 miles
per trip (e.g., an average of originating in El Jebel, Carbondale, or on waste-collection trips between the City and the County Landfill).
Nov08 update: CMS considered reducing the average typical commuting distance from 25 to 20 miles (to better agree with the average RFTA passenger trip length of 16 miles (Dan Blankenship)), but rejected the change in order to
preserve comparability between 2004 and subsequent years.
H11Cell:
Rick Heede:Comment:
New vehicle fuel economy data are used in combination with average fleet fuel economy data. This leads to two conservatisms: 1. older vehicles may get poorer fuel economy, and 2. actual driving experience suggests that fuel economy is
~10 percent worse than EPA’s fuel economy tests. Furthermore, snowy roads increase fuel consumption. Data from ORNL and Federal Highway Administration (see below).
Passenger cars in use average 22.1 mpg. TEDB Table 4.1 (average fuel economy of passenger automobiles in use, 2002 datum from US DOT/Federal Highway Administation (2002) Highway Statistics 2002, Table VM-1;
www.fhwa.dot.gov). New passenger cars average 28.7 mpg (TEDB, Table 4.7).
New small SUVs (25.4 mpg) and small pick up trucks (21.7 mpg) averaged to 23.55 mpg. (Table 4.8); in order to reflect actual vehicle stock mpg and the average in-use fuel economy, the new vehicle average of 23.55 is factored by the
average new truck mpg of 20.5 (table 4.8) divided by average in-use truck of 17.6 mpg: 17.6/20.5 = 0.8585. Thus the Aspen vehicle population of small SUVs/light trucks is 23.55 mpg times 0.8585 = 20.22.
New large and medium SUVs (17.6 mpg and 21.3) and new large pick up trucks (18.3 mpg) and new small and large vans (23.5 and 18.3 mmpg) are averaged to 19.8 mpg. As above, this new SUV/truck fuel economy is adjusted to
reflect the lower mpg of the average vehicle population in use: 19.8 mpg * 0.8585 = 17.0 mpg. Note: propably conservative, considering the weight driven around by the typical SUV and pick-up truck and work van in Aspen. This
category also contains Hummers (10-13 mpg, practical experience is closer to 8 mpg), Suburbans, Ford 350s, and similar brontomobiles.
2-axle medium-duty trucks (10-14,000 lb) average 10.4 mpg (Table 5.4).
3-axle trucks single-unit trucks (dump trucks, garbage trucks, etc) average 7.4 mpg (TEDB Table 5.1).
Commuting&Town&Tourism2007.xls

Road Vehicles
Semis or combination trucks (33,000 lb +) average 6.1 mpg (Table 5.4), 5.2 mpg in Table 5.2, and 5.5 mpg (Table 5.5); we use 5.6 mpg as the average.
Davis & Diegel (2004) Transportation Energy Data Book 2004, Tables 4.1, 4.8, and 5.4, Oak Ridge National Laboratory, USDOE.
Motorcycles: EIA uses 50 mpg (Energy Information Administration/2001 National Household Travel Survey, p. K-37).
I11Cell:
Rick Heede:Comment:
Miles driven / fuel economy. Conservative estimates.
B14Cell:
Rick Heede:Comment:
CMS uses vehicle counts from this site since it counts nearly all traffic entering Aspen from downvalley, Highlands, and Cemetery Lane. Some traffic circumvents the congested Hwy 82 entrance to Aspen by taking McLain Flats
Road/Cemetery Lane and Powerplant Road under Castle Creek Bridge. There is no traffic counter on this access road, which fairly heavily used during congested times on Hwy 82, and CMS is thus underestimating total average traffic flow
in and out of Aspen by an unknown quantity (but probably less than 10 percent?).
H23Cell:
Rick Heede:Comment:
Average of all vehicle types: VMT / estimated fuel consumption.
D27Cell:
Rick Heede:Comment:
Visitors arriving in private vehicles varies greatly by season. Of Aspen’s 7,000 tourist “pillows,” average occupancy in the summer is ~70 percent, or 4,900 visitors per night. Average occupancy per room is ~2.0 (to account for visitors
who arrived in the same vehicle), and average length of stay varies (in summer) from 1.9 in May to 2.7 nights in July. Assuming 2.3 nights per visit and 2 persons per room and 4,900 occupied pillows and 67 percent arrivals by car
means, on average, that 710 tourist vehicles arrive per summer day. (Of course, visitors may do a lot of driving whilst here; we are merely estimating new arrivals per day. Their daily driving is reflected in “Hwy 82” and/or “Driving around
town”.)
Off-season and winter season arrivals by car are lower than in summer: approximately 2/3 of summer visitors vs 20 percent of winter visitors arrive in personal vehicles. Winter visitors also stay longer: on average about 4.4 days (ranging
from 3.2 in Nov to 4.9 in Dec). While occupancy is somewhat higher in winter, the stays are longer and the driving population is smaller. Finally, the 20 percent of winter arrivals by car are typically from the front range or elsewhere in
Colorado, thus tending to reduce the average distance driven.
All in all, this estimate assumes that 350 personal vehicles arrive in Aspen every day, on average, throughout the year.
Most of this data was kindly provided by Bill Tomcich of Stay Aspen Snowmass, 920-7120. The derived fuel consumption estimates are the author’s.
Note: there is little hard data on which to base a more accurate estimate. The ACRA summer visitor study does not elucidate mode of travel by visitors (nor does it mention any international visitorship). An accurate estimate would
estimate visitors by month and with a better sense of the home state or country of visitors who arrive by personal vehicle. Note also that we have not included visitors who drive to Aspen as part of their camping trips to the area, nor
drivers who are visiting friends and relatives, nor second home owners who drive here.
F27Cell:
Rick Heede:Comment:
32 percent of Aspen summer visitors are from Colorado -- chiefly the Front range, which is 400 miles round-trip. Californians comprise 8 percent, Texans 6 percent, Floridians (5 percent, Illini 4 percent, and New Yorkers 3 percent. THE
ACRA data does not, unfortunately, give the number of summer visitors (percentages are shown instead). However, ACRA data show “four in ten lodging visitors indicate that they flew to get to Aspen.”
ACRA (2004) Summer Survey: Understanding the Aspen Summer Visitor, slide #8.
It is probably conservative to use an average distance driven of 600 miles (round-trip) considering the longer distances driven by the substantial number of out-of-state visitors.
Note: we have not diluted the distances driven by tourists arriving in Aspen by allocating a portion of their driving emissions to other destinations also visited en route. Whether Aspen is or is not the principal reason for the visitors’
itineraries, it is our purpose to estimate fuel consumption and emissions for visitors arriving in Aspen, regardless of where else they may have visited on their way here.
H27Cell:
Rick Heede:Comment:
We use the composite fuel economy developed for personal vehicle types driven around Aspen. See below (cell K35) for details.
K32Cell:
Rick Heede:Comment:
Commuting&Town&Tourism2007.xls

Road Vehicles
This is a composite average of fuel consumed and miles driven by passenger cars plus small SUVs/pick-up trucks plus large SUVs/pick-up trucks. This number is also used to estimate saved fuel from RFTA bus services (a calculation that
uses 1.63 persons per vehicle).
Note: this number is driven by data and does not have to be revised. Its revision depends on fuel economy by individual mpg data in the body of the worksheet. The result for 2007 (19.15 mpg) is a substantial improvement over the
2004 result (18.6 mpg), due to the shifting vehicle type survey conducted in each year.
C35Cell:
Rick Heede:Comment:
The traffic counters do register vehicle classes at both the Castle Creek and Mill & Main Streets:
Class 1: Less than 18 feet,
Class 2: 18-25 feet in length,
Class 3: greater than 25 feet.
However, these sizes are not detailed enough for our fuel consumption purposes. We engaged Lee Cassin and the Env Health Dept staff, plus John Krueger of the City Transportation Dept, to survey vehicle types during several mornings
during mid-August 2005. The main data set we use was taken on 25Aug05, from 7 am to 1 pm. (Thanks, everybody.) The survey counted 8,003 vehicles, for which the distribution by type is shown below. (We exclude 104 RFTA buses
and 20 school buses from this survey; fuel consumption by RFTA and school buses is estimated elsewhere.)
Note: A high fraction of the semis serving Aspen’s markets, hardware stores, lumber yards, etc arrive at night and depart before dawn. Our survey may, therefore, have underestimated the number of semis, since the principal vehicle type
survey was done from 7am to 1 pm.
H35Cell:
Rick Heede:Comment:
See cell note in Table 1 above.
B38Cell:
Rick Heede:Comment:
VMT estimates for 1997 from Colorado Department of Public Health (2000) Technical Support Document for the PM10 Redesignation Request and Maintenance Plan for the Aspen Area, Air Pollution Control Division, Denver, p. 6.
B39Cell:
Rick Heede:Comment:
Estimated annual compound VMT growth rate from Technical Support Document (cited above, p. 2). Original source: CDOT Entrance to Aspen Environmental Impact Statement. The factor was used to estimate Aspen-area PM10 emissions
in 2015; we apply the same growth rate to estimate VMT in 2004.
B41Cell:
Rick Heede:Comment:
Daily VMT times 365.
H50Cell:
Rick Heede:Comment:
Average of all vehicle types: VMT / estimated fuel consumption.
H54Cell:
Rick Heede:Comment:
See cell note in Table 1 above.
H57Cell:
Rick Heede:Comment:
Average of all vehicle types: VMT / estimated fuel consumption.
Commuting&Town&Tourism2007.xls

RFTA 2007
1
2
3
4
5
6
7
8
9
10
11
12
13
14
15
16
17
18
19
20
21
22
23
24
25
26
27
28
29
30
31
32
33
34
35
36
37
38
39
40
41
42
43
44
45
46
47
48
49
50
51
52
53
54
55
56
57
58
59
60
61
A B C D E F G H I J K L
Aspen emissions inventory for 2007: Roaring Fork Transit Authority (RFTA)Richard Heede
Climate Mitigation Services Data provided by: Data provided by:
Snowmass, Colorado Kenny Osier Dan Blankenship, CEO
File Started 5 August 2008 RFTA Dir Maintenance [email protected]
Last Modified: 6 December 2008 [email protected] 970-945-7380
970-384-4959
RFTA fuel consumption and emissions, 2007
Table 1Allocated to Aspen
inventory
Vehicle miles per
route, 2007Fuel economy
Fuel consumed per
route
Fuel allocated to
Aspen inventoryEmission factor Carbon dioxide Carbon
percent mpg gallons gallons CO2/gallon tons CO2/yr tonnes carbon
22.384 lb CO2/gallon * (1.0 - (0.134 * 0.7845)) = 22.384 * 0.8949 = 20.031 lb CO2/gallon 22.384 lb CO2/gal
Roaring Fork Transit Agency 1-(0.134*0.7845) (excluding I-70 corridor, Woody Creek) biodiesel credit
City shuttles 100.0% 360,815 5.17 69,790 69,790 20.031 699 173
Galena Street shuttle 100.0% 29,659 6.40 4,634 4,634 19.594 45 11
Crosstown shuttle 100.0% 28,499 7.20 3,958 3,958 19.594 39 10
Burlingame ABC 100.0% 19,640 5.10 3,851 3,851 20.031 39 10
Valley routes 71.6% 2,223,772 5.25 423,576 303,280 20.031 3,037 752
Burlingame 100.0% 13,018 5.10 2,553 2,553 20.031 26 6
Maroon Bells 50.0% 34,989 5.07 6,901 3,451 20.031 35 9
Aspen Skiing Company contract 66.7% 271,678 5.18 52,447 34,967 20.031 350 87
Music Festival contract 100.0% 21,192 5.10 4,155 4,155 20.031 42 10
Maroon Creek Road 100.0% 38,783 5.20 7,458 7,458 20.031 75 18
Senior Van 50.0% 15,080 8.00 1,885 943 19.594 9 2
Total na 3,057,125 5.26 581,209 439,040 20.021 4,395 1,088
1 metric tonne = 1.1023 short ton; CO2/C = 3.664 2004 (revised) 417,212 5.2% 4,486 (90) tons CO2e-2.0%
RFTA: Saved Fuel and Emissions
Table 2Allocated to Aspen
inventoryTotal Ridership
Avoided trips
allocated to RFTA
Miles per avoided
trip
Passenger-miles
saved by RFTA
Vehicle-miles saved
by RFTAFuel saved Carbon dioxide Carbon
percent riders riders miles miles miles gallons sh tons CO2/yr tonnes carbonoccupancy of:
Roaring Fork Transit Agency 1.63 (excl. I-70, Woody Creek, GWS, TOSV) persons/vehicle
City shuttles
Cemetery Lane 100% 102,096 102,096 2 204,192 125,271 6,541 64 16
Hunter Creek 100% 277,752 277,752 1 277,752 170,400 8,898 87 22
Castle/Maroon 100% 478,275 478,275 2 956,550 586,840 30,642 300 74
Burlingame ABC 100% 11,767 11,767 3 35,301 21,657 1,131 11 3
East End Dial-A-Ride 100% 48,537 48,537 2 97,074 59,555 3,110 30 8
Seasonal shuttles
Galena Street shuttle 100% 53,718 53,718 1 53,718 32,956 1,721 17 4
Crosstown shuttle 100% 34,393 34,393 1 34,393 21,100 1,102 11 3
Maroon Creek Road 100% 77,268 77,268 2 154,536 94,807 4,950 48 12
Valley routes 71.6% 1,629,234 1,166,532 20 23,330,631 14,313,270 747,380 7,322 1,813
Burlingame 100% 49,998 49,998 5 249,990 153,368 8,008 78 19
Maroon Bells 50% 67,950 33,975 10 339,750 208,436 10,884 107 26
Aspen Skiing Company contract 66.7% 553,571 369,066 10 3,690,658 2,264,207 118,228 1,158 287
MAA campus 100% 55,759 55,759 5 278,795 171,040 8,931 87 22
RFTA charters 50% 58,506 29,253 10 292,530 179,466 9,371 92 23
Senior Van 50% 3,647 1,824 4 7,294 4,475 234 2 1
Total na 3,502,471 2,790,212 11 30,003,164 18,406,849 961,130 9,416 2,331 Average passengers per vehicle-mile in 2007 (D53/D27) 1.15 (average of all routes)
Percent change 2004 gallons 2004 tons CO2
2,565,462 ridership 2004 8.8% 924,660 9,045
Composite fuel economy of passenger cars, small, medium, and large SUVs and pick-ups: 19.15
Future inventories must update: (a) fuel consumption by RFTA route served (or
total RFTA fuel consumption), (b) check future Aspen ridership as a percentage
of total “on/offs”, (c) update biodiesel percentage (13.4 percent in 2007), and
update average fuel economy by route served.
RFTA2007.xls

RFTA 2007
H11Cell:
Rick Heede:Comment:
In this worksheet we estimate those of RFTA's emissions attributable to Aspen's emissions boundary: i.e., RFTA riders in town routes, riders originating or arriving in Aspen (Ruby Park to Airport/AABC/North Forty or stops between) on the Valley Routes, and
special service routes (Aspen Skiing Company, Music Festival, etc).
Energy and emissions from electricity and natural gas consumption used at RFTA's main bus barn across from the Airport is not specifically estimated here, but is included in the Electricity and Natural Gas worksheets. Energy used in downvalley facilities is not
included.
C12Cell:
Rick Heede:Comment:
Update Sep08: Asked Kenny and Dan for update to the Boarding and Alighting Survey, and whether 35.8 percent is reasonable.
Rick Heede:
Most of these routes are fully allocated to the City of Aspen emissions boundary. We ascribe one-half of the fuel consumed on the Maroon Bells and the senior van routes to Aspen. Two-thirds of the ASC fuel consumption is allocated to Aspen (since these routes
service Buttermilk, Highlands, and Snowmass Ski Areas, and only Snowmass is outside the boundary.
The 2003 Boarding and Alighting Survey asked 45 thousand RFTA riders where they got on and got off. 35.81 percent (8,062 of 22,511) indicated Aspen.
Note: "Aspen", in RFTA's survey, includes Ruby Park terminal to the Truscott bus stop. The fuel and emissions inventory boundary includes riders to Country Inn, AABC, and the Airport. We thus add one-half of the riders from Aspen who alight from Country Inn
through Brush Creek (that is, half of 1,502 surveyed riders, or an additional 751). Thus, 8,062 plus 751 = 8,813 of 22,511 equals 39.15 percent of all RFTA's riders are attributable to Aspen and its immediate community.
Even though every RFTA bus serving the Hwy 82 corridor drive into or out of Aspen, we allocate 39.15 percent of the fuel used by RFTA on Valley routes to serving Aspen. Estimated "on/offs" for RFTA's Valley routes in 2003 total 3,109,148, of which 1,217,222
represents Aspen's share.
D12Cell:
Rick Heede:Comment:
Vehicle miles data updated to 2007 by Kenny Osier, RFTA Director of Maintenance, 9Sep08.
E12Cell:
Rick Heede:Comment:
Revised from data supplied by Kenny Osier, RFTA Director of Maintenance, personal communication, Sep08.
F12Cell:
Rick Heede:Comment:
Fuel consumption per route is computed from vehicle miles per route divided by each route's average fuel economy (both updated by Kenny Osier, Sep08).
G12Cell:
Rick Heede:Comment:
Fuel consumed per RFTA route multiplied by the percent allocated to Aspen and its emissions boundary.
H12Cell:
Rick Heede:Comment:
Updated by Osier Sep08 to B20 fuel during most of the year. Averaged over the year, the biodiesel factor is 13.4 percent of total diesel fuel. Heede updated the calculations in the "Emission Factor" column.
Rick Heede:
Carbon emissions per gallon of diesel and gasoline from EIA data. Diesel emissions are reduced by the fuel's biodiesel component. In RFTA's case (2004), B5 is used, which is 5 percent biodiesel mixed with conventional diesel.
While life-cycle net carbon savings estimates vary widely (see below), we use a net savings of 78.45 percent based on the NREL report cited below. The emissions benefit of using B5 fuel is thus petroleum diesel times 0.95 plus an adjustment for the net carbon
savings of biodiesel fuel: the carbon coefficient is 22.384 lb CO2 per gallon * (1.0 - (0.05 * 0.7845)) = 22.384 * 0.9608 = 21.506 lb CO2 per gallon.
The upstream carbon emissions from biodiesel production are not analyzed here. Such an analysis would include fuel inputs to growing, fertlizing, harvesting, transporting soy or other organic feedstocks, processing electricity and fuels, and storage and delivery
fuel inputs. The net carbon savings from biodiesel is certainly less than the carbon absorbed from the atmosphere in the carbon fixation phase of the feedstock. Note that upstream emissions from conventional fuels are not attributed to diesel and gasoline
consumption by RFTA or other consumers in Aspen. Estimates of "wells-to-tank" energy inputs range from 20 to 30+ percent above the emissions from the fuels' combustion, depending on the bondary definitions used. See Wang (2001).
Net carbon savings estimates vary widely: from zero to 80+ percent; some organizations assume 100 percent carbon neutrality. National Renewable Energy Laboratory (1998) "Life Cycle Inventory of Biodiesel and Petroleum Diesel for Use in an Urban Bus,"
May1998, 314 pp., which concluded that biodiesel reduces net emissions of CO2 by 78.45% compared to petroleum diesel. Mark Delucchi of Institute for Transportation Studies University of California, Davis suggests that the use of biofuels would increase
greenhouse gas emissions as land is converted from forests, wetland and conservation reserve acres to grow more corn and soybeans. European research suggests a range of 40 to 56 percent carbon savings.
13aug07 Note: US DOE (2006) Technical Guidelines: Voluntary Reporting of Greenhouse Gases (1605(b)) Program, p. 64. CMS has not reviewed DOE's net carbon calculations in detail, but DOE's calculations presumably use a lower net carbon savings factor,
as illustrated by their datum of 21.04 lb CO2 per gallon of B20 vs CMS' 21.506 lb CO2 per gallon (DOE does not appear to account for carbon inputs to the biodiesel cycle, as CMS does by using NREL's estimates).
DOE's 1605 factors: B100: zero carbon, B20: 17.71 lb CO2, B10: 19.93, B5: 21.04.
E100: zero carbon, E85: 2.9 lb CO2 per gallon, E10 (Gasohol): 17.41 lb CO2.
I12Cell:
Rick Heede:Comment:
Gallons per route times CO2 per gallon / 2000 lb per ton.
RFTA2007.xls

RFTA 2007
B21Cell:
Rick Heede:Comment:
CMS discussed Boarding & Alighting Survey results and its interpretation for the Aspen emissions inventory. Valley Routes are now attributed 71.6 percent to Aspen (up from 36.15 percent in 2004).
Dan's approval of changing from 36 to 71.6 percent of total Valley Route miles and fuel and emissions to the Aspen emissions inventory, 8Oct08: "Rick: I think your methodology is sound. Also think that dropping the average miles per trip to 20 is a good idea. I
think our calculation was something closer to 16, although it is difficult to get a precise bead on the average passenger trip length because we track boardings and alightings by jurisdictions and not by specific bus stops. Dan"
CMS, 7Oct08: "Thanks, that helps. It seems to me that I misinterpreted the data in 2004. Since we are measuring energy use and emissions for commuters and tourists on a round trip basis -- just as we do for air travel and driving -- it would behoove us to count
both sides of a bus ride and the energy used in between, not simply riders crossing Castle Creek Bridge as a percentage of total boarding and alightings. This way we would be estimating emissions for RFTA's comings and goings for all bus travel that transects
Aspen's emissions boundary. To be clear: I'd use 35.8 * 2 = 71.6 percent of Valley Route fuel and emissions."
Dan's explanation, 6Oct08: "I believe the reason why the Aspen percentage of boarding and alightings is only 36% whereas your estimate indicates that 72% of valley riders cross the Castle Creek Bridge is that boardings and alightings take into account where
someone is getting on and off the bus, and there is one boarding and one alighting for each passenger. So, when a passenger is on a bus crossing the Castle Creek Bridge he/she may be included in the 72% of total valley passengers who are doing that on any
given day. However, in terms of boardings and alightings, on the day the survey is conducted, half of that individual's boarding and alighting was ascribed to the community in which he/she boarded the bus and half was ascribed to the community in which they
alighted from the bus.
Let's say 5,000 commuters crossed the Castle Creek Bridge on valley buses, either inbound or outbound on a given day, and that number represented 72% of the 6,944 total valley bus riders for that day. However, those 5,000 commuters crossing the Castle
Creek Bridge translate into 10,000 boardings and alightings, out of a total of 13,888 valley bus boarding alightings, with only half of the 10,000 (or 5,000) ascribed to getting on or off in Aspen. So 5,000 divided by 13,888 = 36% of the total valley bus boardings
and alightings for that day which were ascribed to Aspen and the other 36% was ascribed to the down valley communities where the passengers either got on or off a bus that had a trip beginning or ending in Aspen."
C33Cell:
Rick Heede:Comment:
Most of these routes are fully allocated to the City of Aspen emissions boundary. We attribute one-half of the fuel consumed on the Maroon Bells and the senior van routes to Aspen. Two-thirds of the ASC fuel consumption is allocated to Aspen (since these
routes service Buttermilk, Highlands, and Snowmass Ski Areas, and only Snowmass is outside the boundary).
D33Cell:
Rick HeedeComment:
Ridership data updated to 2007 by Kenny Osier, Sep08.
Rick Heede:
Ridership data for 2004 from Phil Schultz, RFTA's Information Technologist and data-hound, personal communication, 29Aug05. We exclude Glenwood Springs "Ride" (151,212 riders), I-70 corridor service to Silt, New Castle, and Rifle (49,349 riders), and ADA in
Aspen and GWS (294 riders). Total RFTA 2004 ridership: 3.51 million.
In-town shuttles, Burlingame, and MAA shuttles are fully allocated to within the inventory boundary. The Valley routes are allocated 39.1 percent to within the boundary, based on "on/offs" from Ruby Park to AABC (see RFTA fuel consumption comment for detail).
Two-thirds of Ski Co ridership is allocated to Aspen (since Aspen Mtn, Highlands, and Buttermilk bases are both within the boundary, and the buses serving Snowmass Mountain are transporting Aspen locals and visitors to Snowmass more than the other way
around).
E33Cell:
Rick Heede:Comment:
"Avoided trips" estimates the ridership carried by RFTA's transit services on a route-by-route basis. Most routes are fully allocated to Aspen, such as the City and Seasonal shuttles. The Valley routes carried 1.629 million riders, of which 39.1 percent is attributed
to Aspen and its emissions boundary (out to Airport/AABC/North Forty). Note that we use a vehicle occupancy of 1.63 persons per vehicle in the fuel savings estimate in this table and do NOT assume that each rider would drive a single-occupancy vehicle.
F33Cell:
Rick Heede:Comment:
CMS changed the "miles avoided per trip" of Valley route riders from 25 miles to 20 miles, Oct08. Blankenship concurs, 8Oct08: "Rick: I think your methodology is sound. Also think that dropping the average miles per trip to 20 is a good idea. I think our
calculation was something closer to 16, although it is difficult to get a precise bead on the average passenger trip length because we track boardings and alightings by jurisdictions and not by specific bus stops. Dan."
Rick Heede:
This column assumes average distance ridden per route based on interviews with RFTA staff and this report's reviewers. The Valley routes comprise the main component. Aspen to Snowmass Village is ~14 route miles, Basalt is ~20 route miles, El Jebel is 24
route miles, Carbondale is 32 route miles, and Glenwood Springs ~44 route miles, with relatively minor ridership to Aspen from the I-70 corridor. No definitive estimate can be made with respect to average distance ridden over several valley routes, and CMS
assumes that 20 miles is a reasonable estimate of average distance travelled by riders to and from Aspen.
RFTA provided transportation to 3.1 million riders on the Hwy 82 corridor in 2003, based on a series of ridership surveys conducted in 2003. The same survey also estimated average miles traveled on Valley routes at 15.0 miles per passenger (15.7 miles if
Snowmass Village is included, and 28.7 miles if the I-70 riders are included). These averages include the larger proportions (60.9 percent) of Valley route riders who travel between major stops outside of the Aspen emissions boundary. Thus, of the 39.1 percent
of Valley passengers that boarded or alighted in Aspen (or out to the Airport), we estimate saved fuel from 25 miles of avoided driving attributable to RFTA's bus service. This savings estimate also factors in occupancy per vehicle of 1.63. See note below.
Shorter route miles and average distance ridden are estimated and checked with RFTA staff, 21Nov05.
G33Cell:
Rick Heede:Comment:
"Passenger-miles" is "avoided trips" times estimated average miles per trip/route.
H33Cell:
Rick Heede:Comment:
The fuel and emissions savings estimate factors in occupancy per vehicle of 1.63; meaning that we estimate the fuel consumed on the basis of 1.63 RFTA riders would drive one vehicle to or from Aspen in the absence of RFTA services.
Occupancy data from Mt. Sopris Project Team (1993) Origin and Destination Summer Survey, Mt. Sopris Transportation Project Final Report, p. 65. The Survey logged 15,180 person-trips in 9,303 vehicle-trips (Aspen, eastbound, workday). Recreational trips
RFTA2007.xls

RFTA 2007
logged a higher occupancy of 2.43 persons/vehicle, whereas work trips logged 1.22 persons/vehicle.
I33Cell:
Rick Heede:Comment:
Fuel saved is a function of vehicle-miles saved times the fuel economy of the average vehicle presumptively used to get people where they want to go in the absence of RFTA bus service. Some riders would hitchhike, or carpool, or bicycle, or move closer to
work, or not go. This study assumes none of these alternatives, and estimates fuel savings as if all riders would need access to a car, or a shared car (hence the 1.63 occupancy rate). The calculation is based on the same composite fuel economy of vehicles
entering Aspen in August 2004 (see worksheet on "Road Vehicles").
B38Cell:
Rick Heede:Comment:
RFTA's Year Round City Service includes (for 2004): Cemetery Lane (82,217), Hunter Creek (249,139), Castle/Maroon (427,622), and East End Dial-a-ride (50,016); total 812,994 riders.
RFTA 2004 Ridership data from Phil Schultz, RFTA Dir IT, 29Aug05.
B48Cell:
Rick Heede:Comment:
Total Valley Service (1,597,038 riders) less Woody Creek (9,184 riders) and Town of Snowmass Village (59,300 riders). Valley Service to Snowmass Village is included, since that proportion of total ridership has been accounted for in the percentage allocation to
Aspen (39.1 percent of total riders).
F58Cell:
Rick Heede:Comment:
CMS reviewed the Valley Route ridership allocation with Dan Blankenship in Oct08 (see cell note in Table 1).
For the purposes of comparing ridership and avoided gasoline and emissions between 2004 and 2007, CMS enters the revised 2004 ridership allocated to Aspen here.
J60Cell:
Rick Heede:Comment:
Composite fuel economy for the vehicle types assumed to be used for commuting -- passenger cars, small SUVs/small pick-up trucks, and large SUVs/large pick-up trucks -- is derived in the "Road Vehicles" worksheet. Note that we also apply a commuter
occupancy of 1.63 persons per vehicle.
RFTA2007.xls

OtherFuel2007.xls
1
2
3
4
5
6
7
8
9
10
11
12
13
14
15
16
17
18
19
20
21
22
23
24
25
26
27
28
29
30
31
32
33
34
35
36
37
38
39
40
41
42
43
44
45
46
47
48
A B C D E F G H I J K L
Aspen Emissions Inventory, fuel use: Aspen Schools, City, County, SkiCo, & misc.Richard Heede
Climate Mitigation Services Data provided by:
Snowmass, Colorado Fred Brooks, ASD Bus Fleet Mngr Ellie Nieslanik, Valley Co-op
File Started 14 August 2008 925-3760, x4010 970-704-4210
Last Modified: 6 February 2009 Dylan Hoffman, County Energy Manager Matt Hamilton, Aspen Skiing Co
920-5393 970-300-7153
Landon Dean National Vehicle & Fuel Emissions Lab., EPA
T-Lazy-Seven Ranch Craig Harvey
970-925-4614 [email protected]
Vehicle miles
traveled (VMT)Fuel consumed Fuel consumed Fuel economy Carbon factor
Attributed to
AspenCarbon dioxide Carbon
(if known) Diesel Gasoline mpg CO2/gallon Percent sh tons CO2/yr tonnes carbon
Aspen School District diesel / gasoline
School buses 122,457 17,500 7.0 22.38 100% 196 48
Other School District vehicles 124,857 12,500 10.0 19.59 100% 122 30
Out-of-district fuel (ExEd trips, away games) 5,000 - 20.99 100% 52 13
Total School vehicles 17,500 17,500 371 92
Pitkin County Public Works Dept.
Trucks, plows, etc. (diesel fuel) 44,323 22.38 20% 99 25
Sheriff and other vehicles (gasoline) 44,061 19.59 20% 86 21
Total Pitkin County vehicles 44,323 44,061 186 46
City of Aspen
Trucks, plows, etc. (diesel fuel) 57,611 22.38 100% 645 160
Sheriff and other vehicles (gasoline) 37,823 19.59 100% 371 92
Total Pitkin County vehicles 57,611 37,823 1,015 251
Construction and off-road equipment
Fuel deliveries by Roaring Fork Coop na 36,841 22.38 100% 412 102
Snowmobiles (T-Lazy-Seven Ranch only) na 7,355 19.59 72 18
Misc off-road equip. (mowers, blowers, etc) na 57,437 19.59 563 139
Total off-road vehicles 36,841 64,792 1,047 259
Aspen Skiing Company (Aspen, Highlands, & Buttermilk) Biodiesel credit
Snow groomers, other diesel vehicles (B20 biodiesel) 173,807 18.87 100% 1,640 406 Aspen, Buttermilk, and
Snowmobiles, misc vehicles (gasoline) 63,543 19.59 100% 623 154 Highlands (Snowmass excl)
Total Aspen Skiing Company fuel use 173,807 63,543 2,263 560
Total School District, City, County, ASC, & misc. na 330,082 227,719 na na na 4,881 1,209
Future inventorists should update each of the fuel-consumption categories
by contacting the entities listed on this worksheet and in the comments to
each section. The specific data required and the methodology used to make
estimates are discussed in the cell comments.
School buses, County, City, ASC

OtherFuel2007.xls
D13Cell:
Rick Heede:Comment:
Fuel consumption data sources are listed for each entity included.
F13Cell:
Rick Heede:Comment:
Fuel economy is derivd from VMT and fuel consumption data provided by Aspen School District fleet manager. Newer school buses use less fuel per mile.
B15Cell:
Marta:Comment:
12/4/08: Spoke with Fred Brooks re: fuel consumption
2007-08 school year (July-July): Diesel: 17,500 gallons; Unleaded: 12,500 gallons
2006-2007: Diesel: 17,600 gallons; Unleaded: 12,400 gallons
**Five of the 18 school bus routes are within the City limits. The district extends from Independence Pass to roughly 40 yards west of Watson Divide Road.
**Of the unleaded fuel usage, Fred estimated that roughly 12,000 gallons were used for “activity” and “away” trips, outside the City of Aspen. The roughly 500 gallons used within the City were primarily consumed by a maintanence truck
and two snowplows.
Marta:
9/16/08: Spoke with Fred Brooks re: mileage of buses and other small vehicles. He did not have fuel consumption data. The data period runs from “July-July of 2007-2008”
School Buses:
Bus mileage: 122,457 miles
Route mileage: 74,315 miles
Activity mileage (sports games, etc., on a bus): 46,367 miles
Fleet of 20 small vehicles: 124,367 miles.
B16Cell:
Rick Heede:Comment:
The Aspen School District operated 18 buses in the 2004/2005 school year on 14 routes. The fleet drives 73,222 miles in the 176-day school year. The average bus route (though it varies greatly) is 29.7 miles and the fleet drives an
average of 416 miles per school day.
B17Cell:
Rick Heede:Comment:
The District also operates 25 other vehicles -- such as Suburbans for field trips, maintenance vehicles, and snowplows that were driven 43,385 miles in 2004 and consumed 13,380 gallons of (chiefly) gasoline.
B18Cell:
Rick Heede:Comment:
The fuel consumed by “other school district vehicles” above do not include fuel purchased on the road for the two dozen long-distance Experiential Education outings (as far as South Dakota, for example, or to Moab in a fleet of Navigators
and the like); nor are the several trips by the Varsity and other sports teams beyond range of the fuel in the vehicles’ tanks.
In lieu of having an accounting of these fuel purchases we assume such out-of-district fuel consumption at 40 percent of the consumption by “other school district vehicles.”
Note: the fuel economy is the average of diesel fuel and gasoline.
B22Cell:
Marta (data updated 14Aug08):Comment:
Rego no longer w/PitCo. Data from Dylan Hoffman, PitCo Energy Manager.
Rick Heede:
Fuel data for 2004 from Rego Omerigic, Pitkin County Public Works Fleet Manager, 8Aug05. Tel 970-920-5393; [email protected]
B28Cell:
Rick Heede:Comment:
Fuel data for 2004 from Chicago Climate Exchange “City of Aspen - CCX Preliminary Emissions Analysis,” based on data supplied by Lee Cassin, City Env Health Dept.
Data for fuel purchased for City-owned vehicles in 2004. We assign 100 percent of such fuel use to the emissions inventory (unlike County fuel purchases, of which we assign twenty percent to Aspen).
School buses, County, City, ASC

OtherFuel2007.xls
D29Cell:
martad:Comment:
Updated from CCX
E30Cell:
martad:Comment:
Updated from CCX
B35Cell:
Marta:Comment:
Email from Ellie 9/17/08: I ran my reports again for 2007 and added them up and I did miss one person, but it doesn’t make a huge difference so total gallons=36841 and $=110,393 and then Rafta was the same gallons=706,445 and
$=1,902,696.
Then curiosity got me because there is really only one way to get this info quickly so I went back to 2004 and added that up again and I did come up with about the same figure (within 500 gallons), but I can tell you that there were about 7
regular accounts that we used to deliver to that we didn’t in 2007 in Aspen due to selling, retirement, or they just don’t buy from us anymore. I went next to our transport business and found the huge difference and that is that there were 2
construction companies buying diesel from us that were working, I believe on Hwy 82 project and of course they are gone now also. They were big consumers.
Also, Rafta started buying biodiesel from us in November 2004 but before that, they did buy some clear diesel from us. I cannot be specific with the date because they used to be right here behind us and so they would fill up here at our
station and not purchase fuel by the tanker, and I go back to 2002 with that and it’s possible to be even before that. I just don’t have the time to research anymore today.
The one biggest consumer on the hwy project used alone about 90,000 gallons in 2004.
9/17/08: Spoke with Ellie at the Coop.
Within Aspen billing addresses with 81611 & 81612 ZIP codes
Total Diesel sales = 32,841 gallons
RFTA sales = 706,445 gallons (mainly biodiesel)
Total diesel sales = 738,748 gallons
In 2004, RFTA purchased 300 gallons of diesel, which Ellie believes were included in the 2004 values.
Rick Heede:
Fuel data of diesel fuel sales to Aspen zip codes in 2004 from Ellie Nieslanik, accounting, and Bill Bransman, fuel sales, Roaring Fork Valley Coop, personal communication, 9Aug05. Tel 970-704-4210.
While such deliveries are chiefly fuel for construction equipment, a variety of other end-users also receive diesel fuel for off-road equipment such as tractors and backhoes.
A complete assessment of such uses has not been made, however, and we use the Coop fuel deliveries as a proxy for construction and off-road equipment. It is likely a conservative estimate considering that many contractors and excavators
purchase their own fuel..
B36Cell:
Heede (Feb09):Comment:
T Lazy Seven contact (Landon Dean, 925-4614) estimated total fuel consumption for snowmobile rental fleet of 7,355 gallons of unleaded gasoline in 2007.
Rick Heede (Dec08):
National Vehicle and Fuel Emissions Laboratory US Environmental Protection Agency. CMS data from Craig Harvey, [email protected]: 1.571 million snowmobiles used 395.7 million gallons in 89.5 million hrs (2000). CMS calc: 395.7/89.5 =
4.42 gallons per hour; assuming gasoline EF of 19.594 lb CO2 = 86.63 lb CO2 per hour.
CMS will call T-Lazy-Seven forestimated snowmachine rental hours in 2007. Preliminary assumption of 20 hrs per day * 140 days (20-week season) = 2,800 hrs; times 4.42 gallons/hr = 12,376 gallons.
Rick Heede (2005):
We have not estimated fuel purchased for snowmobiles. 2,000 gallons is probably conservative for T-Lazy-7 Ranch at Maroon Creek. Snowmobile use by the Aspen Skiing Company is not included here, but such fuel use (as well as for
groomers) is estimated in SkiCo’s emissions inventory.
B37Cell:
Rick Heede (Dec08:Comment:
ORNL’s (2007) Transportation Energy Data Book, 26th edition, Table 2.10, shows US fuel consumption for mowing equipment (1.261 billion gallons), Soil & Turf equipment (0.799 billion gallons), Wood cutting equipment (0.270 billion
gallons), Leaf blowers (0.220 billion gallons), Snowblowers (0.047 billion gallons), and Trimming equipment (0.134 billion gallons). Total equals 2.731 billion gallons, and includes both commercial and residential uses. The average annual fuel
School buses, County, City, ASC

OtherFuel2007.xls
consumption in the US is thus (mid-2006 population of 299 million) 2,731 million gallons / 299 = 9.13 gallons per capita.
CMS uses the ORNL datum of 9.13 gallons per household per year. Aspen households totaled 6,291 hh in the 2004 inventory, whcih CMS assumes has not changed significantly to 2007: 6,291 hh * 9.13 gallons/hh = 57,437 gallons of fuel for
gas-powered widgets in 2007.
Rick Heede:
There is no accurate way to estimate fuel used by mowers, trimmers, blowers, snow-removal equipment and generators and fuel-burning widgets around Aspen. We assume 4 gallons per household for lawn mowers and similar noise-generators
per year as a minimal estimate of widget fuel consumption. Aspen housing units is estimated at 6,439 population in 2002 / Pitkin County’s persons per household of 1.325 = 4,860 housing units. 4,860 hh x 4 gallons/hh-yr = 19,440 gallons
per year. The real number, if professional gardening or contract snowplowing services are included, could easily be ten times higher.
Housing data from Venturoni (2004) 2004 Pitkin County Community Survey, slide #4, NW Colorado Council of Govts.
B41Cell:
Heede, 15Nov08: Comment:
Marta sent and CMS verified original data: diesel (B20) consumption CY2007 at Highlands, Buttermilk, and Aspen Mtn: 44,499, 63,215, and 66,093 gallons, respectively.
Gasoline: 4,249, 50,396, and 8,898 gallons, respectively.
Snowmass is not included (325,007 gallons of diesel and 105,167 gallons of gasoline), nor “SMC” (Snowmass Center?): 2,699 and 21,210 gallons.
Marta:
8/14/08: Data from Matt Hamilton @ SkiCo.
Rick Heede:
Fuel data from Aspen Skiing Company, Auden Schendler, 23Nov05. Diesel and gasoline consumption is reported by ski area; we include Aspen Mtn, Highlands, and Buttermilk, and exclude Snowmass Ski Area.
G41Cell:
Rick Heede, 17Nov08:Comment:
As noted in the cell below, CMS applies the emission factor based on NREL’s study, which accounts for fossil carbon inputs to biodiesel, and ignores EIA’s 1605b factor.
Marta:
In 2007, “pretty much all of the diesel” was B20 [from email correspondence with Matt Hamilton on 8/14/08]. Factor from www.eia.doe.gov/oiaf/1605/excełFuel%20Emission%20Factors.xls
Auden Schendler, 14Aug08: “We’re scrapping biodiesel this year b/c of new federal diesel standards that, as far as we can tell, obviate the value of the bio.”
Rick Heede:
20 percent of SkiCo’s diesel consumption is 100 percent biodiesel. While life-cycle net carbon savings estimates vary widely (see below), we use a net savings of 78.45 percent based on the NREL report cited below. The emissions benefit of
using B5 fuel is thus petroleum diesel times 0.95 plus an adjustment for the net carbon savings of biodiesel fuel: the carbon coefficient is 22.384 lb CO2 per gallon * (1.0 - (0.20 * 0.7845)) = 22.384 * 0.8431 = 18.872 lb CO2 per gallon.
Also see the notes under RFTA’s biodiesel calculation.
National Renewable Energy Laboratory (1998) “Life Cycle Inventory of Biodiesel and Petroleum Diesel for Use in an Urban Bus,” May1998, 314 pp., which concluded that biodiesel reduces net emissions of CO2 by 78.45% compared to
petroleum diesel.
G42Cell:
Rick Heede, 15Nov08:Comment:
Marta ignored the net carbon calculation of B20 emission factor in the above cell note and simply used the DOE factor that does not account for carbon inputs to biodiesel production, processing, and transportation. CMS applies the corrected
factor for B20 fuel cited in the cell note above based on NREL’s study and that accounts for carbon inputs and other biodiesel emission sources such as fertilizer inputs.
Marta Darby, 13Nov08:
From EIA DOE spreadsheet regarding factors. Carbon factor is for B20. The spreadsheet is located in the 2007 Inventory Worksheet folder.
School buses, County, City, ASC

Commercial Air Travel 2007
1
2
3
4
5678910
1112
1314
15
16
17181920
21
22
232425
26
2728
29
3031
32
33
34353637
3839
40
41
42434445
46
47
484950
51
5253
54
5556
57
58
59606162
A B C D E F G H I J K L M N O P Q R
Aspen Emissions Inventory: Commercial Air Travel, 2007Richard Heede
Climate Mitigation Services Data from: Other sources:
Snowmass, Colorado David Ulane ORNL Transportation Energy Data BookFile Started: 19 November 2008 ASE Ops Mngr. http://cta.ornl.gov/data/index.shtmlFile last modified: 2 March 2009 970-429-2853 MIT Global Airline Industry Program Airline Data Project
[email protected] web.mit.edu/airlinedata/www/Revenue&Related.html
red data require updating in future inventories Fuel factor: 21.09 lb CO2e per gallon of jet fuel (Table 2c)
Table 1a Fuel and Emissions from passengers flying to and/or out of Aspen Pitkin Airport (ASE), 2007
Aspen/Denver leg US domestic legs International legs
65.5 % use
ASE
Aspen
enplanementsUS origin
Miles flown
per legTotal miles Fuel Emissions
Miles flown
per legTotal miles Fuel Emissions
International
origin
Miles flown
per legTotal miles Fuel Emissions
passengers passengers miles passenger-miles gallons tons CO2e miles passenger-miles gallons tons CO2e passengers miles passenger-miles gallons tons CO2e
82% short haul fuel rate: 0.0462 gallons/pax-mileUS domestic fuel rate: 0.0242 gallons/pax-mile 18% international fuel rate: 0.0178 gallons/pax-mileshort haul emission factor: 0.9735 lb CO2/pax-mileUS domestic emission factor: 0.5094 lb CO2/pax-mile international emission factor: 0.3747 lb CO2/pax-mile
Deplanements 177,630 145,657 125 18,207,075 840,532 8,863 975 142,015,185 3,430,421 36,170 31,973 4,875 155,870,325 2,769,320 29,200
Enplanements 183,632 150,578 125 18,822,280 868,933 9,162 975 146,813,784 3,546,333 37,392 33,054 4,875 161,137,080 2,862,893 30,186
Totals 361,262 296,235 na 37,029,355 1,709,466 18,025 na 288,828,969 6,976,754 73,562 65,027 na 317,007,405 5,632,213 59,386
Table 1b Fuel and emissions for commercial air travel via ASE: all travelers Table 1c Fuel and emissions for coml air travel via ASE: allocated to Aspen InventoryAll air travelers using the Aspen Pitkin County Airport All air travelers using the Aspen Pitkin County Airport: allocated to Aspen inventory
70 percent of Table 1b
Total miles Fuel Emissions Total miles Fuel Emissionspassenger-miles gallons tons CO2e passenger-miles gallons tons CO2e
allocation factor 70%
Inbound 316,092,585 7,040,273 74,232 Inbound 221,264,810 4,928,191 51,963
Outbound 326,773,144 7,278,160 76,740 Outbound 228,741,201 5,094,712 53,718
Totals 642,865,729 14,318,433 150,973 Totals 450,006,010 10,022,903 105,681
Table 2a Fuel and emissions for Aspen residents & visitors using other regional airports, 2007
no Aspen/Denver legs Domestic legs to Denver, Eagle, Grand Junction International legs to Denver, Eagle, Grand Junction
34.5 % use
other airports
DIA , EGE,
GJT US origin
Miles flown
per legTotal miles Fuel Emissions
International
origin
Miles flown
per legTotal miles Fuel Emissions
passengers passengers miles passenger-miles gallons tons CO2e passengers miles passenger-miles gallons tons CO2e
95% US domestic fuel rate: 0.0242 gallons/pax-mile 5% international fuel rate: 0.0178 gallons/pax-mileUS domestic emission factor: 0.5094 lb CO2/pax-mile international emission factor: 0.3747 lb CO2/pax-mile
Deplanements 93,561 88,883 1,100 97,771,160 2,361,693 24,902 4,678 5,000 23,390,230 415,570 4,382
Enplanements 96,722 91,886 1,100 101,074,782 2,441,493 25,743 4,836 5,000 24,180,570 429,612 4,530
Totals 190,283 180,769 na 198,845,942 4,803,186 50,645 9,514 na 47,570,800 845,182 8,912
Table 2b Fuel and emissions for commercial air travel via regional airports: all travelers Table 2c Fuel and emissions for coml air travel via regional airports: allocated to Aspen InventoryAll air travelers using the Aspen Pitkin County Airport All air travelers using the Aspen Pitkin County Airport: allocated to Aspen inventory
70 percent of Table 1b
Total miles Fuel Emissions Total miles Fuel Emissionspassenger-miles gallons tons CO2e passenger-miles gallons tons CO2e
allocation factor 70%
Inbound 121,161,389 2,777,263 29,283 Inbound 84,812,972 1,944,084 20,498
Outbound 125,255,352 2,871,105 30,273 Outbound 87,678,747 2,009,773 21,191
Totals 246,416,742 5,648,368 59,556 Totals 172,491,719 3,953,858 41,689
Note 1: we have not included the related global warming impacts of high-altitude aircraft operations such as vapor trail formation, NOx, particulates, etc.www.aspenzgreen.com/offsets_calculator_air.cfm
This worksheet estimates gallons of jet fuel consumed and carbon dioxide emissions
attributable to revenue-passengers flying into and out of Aspen in 2007. Future emissions
inventorists need to update enplanement & deplanement data from the Aspen Pitkin Airport
staff.
CMS has updated the emission factors for short haul (DEN-ASE), other domestic flights, and
international flights based on 2006 or 2007 data. These factors change only slightly from year
to year, and future inventorists may elect to not update these factors (see worksheet “US
Coml Ave 2006”).
AviationComl&GA2007.xls

Commercial Air Travel 2007
C16Cell:
Rick Heede (2Mar09):Comment:
Ulane: website PDF data is incorrect. CMS corrects 2007 entries to: 183,632 enplanements & 177,630 deplanements.
Rick Heede (27Feb09):
Revised data from Ulane (via 11Feb09 ASE Passenger Report as PDF from website) shows increase in 2007 enplanements (192,917 pax) and deplanements (187,072, total 379,989. (Previous data totals 361,262 pax.)
FYI: 2008 enplanements (185,711 pax) and deplanements (179,315), total 365,026 pax.
Rick Heede (23Dec08):
Passengers deplaning and enplaning at Aspen are nearly identical in 2004 vs 2007 (respective totals are 362,105 vs 361,262 passengers). However, 2006 was substantially higher at 401,303 passengers, and 2008 is also ahead of 2007
at 387,799 passengers through October; if Nov08 & Dec08 equal same months in 2007, total 2008 would reach 440,252.
ASE data from www.aspenairport.com/pdf/passenger_report.pdf
D16Cell:
Rick Heede:Comment:
(2005): The 80/20 split between domestic and international originations is based on winter visitors flying into Aspen. Data from Aspen Skiing Company.
Jan09 update with ASC (Bob Bayless, 970-300-7040): international origins slightly up to estimated 82 percent domestic and 18 percent international.
E16Cell:
Rick Heede:Comment:
The direct air distance between Aspen and Denver is 125 miles (great circle distance as calculated by the Canary air travel calculator at www.aspenzgreen.com/offsets_calculator_air.cfm). In practice, the actual flight path over Red Table
VOR en route to ASE is closer to 140 miles. CMS uses the direct distance.
F16Cell:
Rick Heede:Comment:
Passengers in both direction times miles flown for the Denver to Aspen leg equals total passenger-miles.
G16Cell:
Rick Heede:Comment:
Fuel rate is calculated for each type of flight. See the worksheet “US Coml Ave 2006” for details.
The calculation is total passenger-miles for enplanements and deplanements times the fuel rate for each type of flight (in gallons per passenger-mile flown) divided by 2000 lb/ton.
H16Cell:
Rick Heede:Comment:
CO2 emissions are calculated for each type of flight -- ASE-DEN, other US domestic flights, and international flights. See the worksheet “US Coml Ave 2006” for details.
The calculation is total passenger-miles for enplanements and deplanements times the emission factor for each type of flight (in lb CO2 per passenger-mile flown) divided by 2000 lb/ton.
I16Cell:
Rick Heede:Comment:
2005: The average “passenger trip” in 2002 was 850 miles. Davis, Stacy C. (2004) Transportation Energy Data Book 2004, Oak Ridge National Laboratory, Oak Ridge, TN, Table 9.2. We assume 1,100 miles per trip in lieu of the longer
distance traveled by domestic visitors to Aspen.
LAX to Aspen (via DEN, 730 + 130 miles) 860 miles, LGA to ASE is 1,770 miles, MIA to ASE is 1,800 miles, Chicago ORD to ASE is 1,010 miles, Houston is 914 miles, Washington DC is 1,570 miles. Since NY/NJ/PA, Chicago, and LA are
the three most important originations for winter visitors, we use 1,100 miles as a reasonable average flying distance for year-round travel distances.
Based on a conversation with Kris McKinnon, ASC Mng Dir Worldwide Marketing. Air travel distances from www.webflyer.com
Jan09 update: MIT data * shows average stage length for US domestic commercial aircraft was 1,095 miles in 2007. While this does equal average trip distance flown -- which is presumably longer than stage distance -- it does support
CMS use of 1,100 miles to estimate average domestic air travel distance for Aspen in 2007.
* Massachusetts Institute of Technology, Global Airline Industry Program, Airline Data Project, web.mit.edu/airlinedata/www/Revenue&Related.html
M16Cell:
AviationComl&GA2007.xls

Commercial Air Travel 2007
Rick Heede:Comment:
Jan09: International visitors comprise roughly 18 percent of winter visitors, according to Aspen Skiing Company data (personal communication, 2Jan09). The precise fraction is proprietary to ASC. This does NOT equal year-round aveage
of visitors to Aspen or Valley resident travel, hence this percentage may be adjusted. This is a slght change from the 2004 estimated value of 20 percent international.
N16Cell:
Rick Heede:Comment:
We estimate that the average international visitor (and international travel by outbound residents) is ~5,000 miles, which is likely conservative. This is equivalent to a flight from London to Aspen (4,770 miles) or Paris (4,980 miles). Rio
de Janeiro is 5,930 miles, Sydney is 8,220 miles, and Tokyo is 5,720 miles. Of course, a number of visitors fly in from Canada, Mexico, Venezuela, and other closer countries to average out the number of visitors from Australia and
elsewhere in Asia.
The three most important international markets for the Aspen Skiing Company (personal communication 17Aug05) are the UK, Australia, and Brazil.
N38Cell:
Rick Heede (Jan09):Comment:
CMS analyzed the Pitkin County air travel results. First, when business owners, voters, and assessors list of homeowners were asked “What airport do you use most often to fly in and out of this area?” the respondents often selected more
than one airport, and thus the sum totaled more than 100 percent. CMS harmomized the responses to 100 percent to calculate the relative values of the responses for each group as follows:
On average, Aspen Pitkin Airport was used by 56.76 percent of respondents, 28.72 percent used Denver International, and 14.51 percent used GJT or EGE or other regional airports.
CMS note, Jan09: We do not change the proportion between Aspen and other airports in the 2007 emissions inventory so as to keep the basic metrics comparable; that is, CMS uses the 2004 percentage of 65.5 percent ASE and 34.5
percent non-ASE. If future inventorists determine that a larger proportion of Aspen visitors use non-ASE airports, perhaps based on a future travel survey, this proportion should be revised.
Rick Heede:
2005: An average of 65.5 percent of visitors and residents of Aspen who do fly do so in and out of the Aspen Airport, according to the Pitkin County Survey. 31.8 percent travel to DIA for flights, although GJT, EGE, and other airports are
also used.
In other words, we estimate that an additional amount of travelers and miles flown depart from other airports. The number of travellers using other airports is thus (1-0.655)/0.655 times = 0.526718 times the respective deplanements
and enplanements at Aspen Pitkin Airport.
This datum averages respondents from the business surveys, voter surveys, and assessor surveys collected by Linda Venturoni (2004) 2004 Pitkin County Community Survey, Northwest Colorado Council of Governments, slide 21;
www.nwc.cog.co.us
D41Cell:
Rick Heede:Comment:
CMS assumes that the proportion between US and international origins shifts for non-Aspen airports. CMS assumes that 95 percent of non-Aspen visitors originate in the U.S., and 5 percent originate internationally.
B61Cell:
Rick Heede:Comment:
Such impacts have been estimated to range between two to 3.5 times the impact of converting jet fuel to carbon dioxide in the atmosphere.
IPCC (1999) Aviation and the Global Atmosphere - Summary for Policymakers.
CMS investigated the state of the art of non-CO2 radiative forcing (RF), and concluded -- chiefly on the basis of Wuebbles (2006) and Sausen et al (2007) -- that RF contributes 1.83 times the RF of CO2 alone. Aspen’s canary Initiative air
travel calculator (see www.aspenzgreen.com/offsets_calculator_air.cfm) makes RF calculations and offset costs voluntary.
AviationComl&GA2007.xls

General Aviation 2007
1
2
3
4
5
6
7
8
9
10
11
12
13
14
15
16
17
18
1920
21
22
23
24
25
26
27
28
29
3031
32
33
34
35
36
37
38
39
4041
42
43
44
45
46
47
48
49
5051
52
53
54
55
56
57
58
59
60
61
62
63
64
65
66
67
68
69
A B C D E F G H I J K L M N
Aspen Emissions Inventory: General Aviation, 2007Richard Heede
See comment E4 Climate Mitigation Services Data from: Data from:
Snowmass, Colorado David Ulane Ellen AndersonFile Started 11 August 2008 ASE Ops Mngr. Pitkin County Emergency Mngt Coordinator
Last Modified: 27 January 2009 970-429-2853 [email protected]
Average 1,000 nm flight: 6.94 tons CO2e
Table 1 Jet Turbine Aicraft OperationsTotal Jet aircraft Jet Fuel consumption Total jet fuel Fuel emission factor CO2e emissions Allocated to Aspen CO2e emissions Carbon
GA Operations (percent) operations 1,000 nm trip (gal) (gallons) lb per gallon tons CO2e percent tons CO2e metric tonnes C
Total general aviation operations: 22,039 75% 16,529 658 10,875,012 21.088 114,665 70% 80,266 21,905
Total Air Taxi operations: 9,578 90% 8,620 658 5,671,448 21.088 59,799 70% 41,860 11,424
Total military operations 45 75% 34 658 22,205 21.088 234 70% 164 45
Total GA plus Air Taxi operations: 31,662 na 25,183 na 16,568,665 21.088 174,699 122,289 33,374
Total jet fuel & CO2e emissions 16,568,665 21.088 174,699 122,289 33,374
Table 2 Turbo Prop Aircraft OperationsTotal Turboprops Turboprop Fuel consumption Total jet fuel Fuel emission factor CO2e emissions Allocated to Aspen CO2e emissions Carbon
GA Operations (percent) operations 600 nm trip (gal) (gallons) lb per gallon tons CO2e percent tons CO2e metric tonnes C
Total GA operations: 22,039 15% 3,306 195 644,009 21.088 6,790 70% 4,753 1,297
Total Air Taxi ops: 9,578 10% 958 195 186,588 21.088 1,967 70% 1,377 376
Total military operations 45 25% 11 195 2,192 21.088 23 70% 16 4
Total GA plus AT ops: 31,662 na 4,275 na 832,789 21.088 8,781 6,147 1,677
Total jet fuel & CO2e emissions 832,789 21.088 8,781 6,147 1,677
Table 3 Air Ambulance Flights (helicopters & fixed-wing)
Total Trip distance Fuel rate Fuel consumption Fuel emission factor CO2e emissions Allocated to Aspen CO2e emissions CarbonOperations Roundtrip (hrs) (gallons/hr) gallons lb per gallon tons CO2e percent tons CO2e metric tonnes C
Air ambi fixed-wing flights: 47 1.50 60 4,230 18.355 39 70% 27 7
Air ambi helicopter flights: 47 1.50 80 5,640 21.088 59 70% 42 11
Total Air Amulance operations: 94 na 140 9,870 98 69 19
Total avgas & jet fuel & emissions 9,870 98 69 19
Table 4 Civil, Local, & Itinerant Flights (piston aircraft)
Total Trip distance Fuel rate Fuel consumption Fuel emission factor CO2e emissions Allocated to Aspen CO2e emissions CarbonOperations (hrs) (gallons/hr) gallons lb per gallon tons CO2e percent tons CO2e metric tonnes C
Gen’l Aviation - piston aircraft 2,204 3.00 20 132,234 18.355 1,214 70% 850 232
Local sightseeing, T&Gs, training 1,186 1.50 16 28,464 18.355 261 70% 183 50
Total GA piston + “Civil” ops: 3,390 na na 160,698 1,475 1,032 282
Total AvGas & emissions 160,698 1,475 1,032 282
Table 5 Total fuel and emissions from General Aviation using Aspen Pitkin County Airport and attributed to Aspen inventoryFuel consumption CO2e emissions Carbon
gallons tons CO2e metric tonnes C
Total fuel and emissions by GA aircraft using the Aspen Pitkin Airport: 12,300,415 129,537 35,352
Table 6 Allocation of total fuel and emissions to communities in the Roaring Fork ValleyFuel consumption CO2e emissions Carbon
Roaring Fork Valley community gallons tons CO2e metric tonnes CCity of Aspen emission boundary (modified UGB) 70% 12,300,415 129,537 35,352
Average private jet Town of Snowmass Village & Brush Creek & Wildcat 20% 3,514,404 37,011 10,101 B&CA average jet: 3.40 tons CO2/hr Rest of Pitkin County 6% 1,054,321 11,103 3,030 CMS calculation, ave jet: 2.98 tons CO2/hr Garfield and Eagle County 4% 702,881 7,402 2,020
Total fuel and emissions by GA aircraft using the Aspen Pitkin Airport 17,572,022 185,053 50,503
The Aspen Pitkin Airport handled 32,848 general aviation &
military arrivals and departures in 2007. This worksheet develops
a profile of the typical aircraft and missions flown, ie, size,
performance, fuel flow, distance flown, and total carbon dioxide
emissions for the flights into and out of Aspen in 2007. See
comment at B4. Air line operations totalled 9,500 arrivals and
departures (see Commercial Aviation worksheet for details).
Future emissions inventories may simply update operational data from (available from the Airport
staff) and Air Ambulance operations (available from Pitkin County Emergency Services). Future
inventories may also change fuel consumption rates, aircraft performance, and other factors.
AviationComl&GA2007.xls

General Aviation 2007E4Cell:
Rick Heede (Jan09):Comment:
CMS has revised the average fuel performance by relying on the average fuel flow for all 141 production and in-service but out-of-production aircraft published in Business & Commercial Aviation’s Operations Planning Guide (see cell note
at G 14). The average 1,000 nm mission consumes 658 gallons of jet fuel.
Rick Heede (2005):
A survey of jet turbine aircraft parked at Aspen Base Operations and Airport ramps totaled 38 on 30Jul05 in size ranging from light Cessna Citations and LearJets to large Gulfstream and Challenger aircraft with ramp weights from 10,800
to 91,400 lb.
The preponderance of aircraft were of the heavier, longer-range, larger-capacity variety of personal or corporate jets. We averaged the fuel consumption for a basket of business jets from the Citation Bravo up to the Gulfstream 550.* The
eleven jets sampled average 674 gallons (4,517 lb) of jet fuel for a 1,000 nautical mile trip, which is a standard operational and cost estimation mission in the jet fleet management business. This also equals the performance of a
Bombardier Challenger 604 and 1.11 times the fuel consumption of a Raytheon Hawker 800 XP -- both typical of the variety of aircraft flying into Aspen. **
It is likely that the selected baseline trip of 1,000 nm is conservative relative to the origins and destinations of the “average” flight to Aspen. It is, however, a standard industry measure, and fuel consumption data will be published
annually for a variety of production aircraft.
Another conservatism in the 2004 fuel and carbon emissions estimate is that we have used the fuel performance of mostly new production models, and the fleet average is somewhat lower fuel performance than the new aircraft. Specific
fuel consumption for each type of aircraft has (and will continue to) improve.
Finally, we have not accounted for the other atmospheric impacts of burning jet fuel at high altitudes, namely vapor trail formation, particulates such as sulfur dioxide, NOx, and other impacts on the radiative balance of the atmosphere.
Some researchers estimate such impacts are approximately 1.5 to 3.5 times the direct impact of the carbon emissions. See IPCC 1999.
* Citation Bravo (371 gallons) up to the Gulfstream III (1,069 gallons). Other aircraft performance in our review (all fuel consumption per 1,000 nm mission): Lear 45 (433 gallons); Lera 60 (477 gallons); Hawker 800XP (604 gallons);
Citation X (576 gallons); Falcon 2000 (540 gallons); Challenger 604 (674 gallons); Gulfstream 550 (834 gallons), Gulfstream G-III (1,069 gallons); Gulfstream G-IV (972 gallons); and Gulfstream G-V (865 gallons). See Business &
Commerical Aviation (2004) Operations Planning Guide, pp. 56-85. A “mission” includes fuel consumed for a typical sequence from start, taxi, clearance, take-off, climb, cruise, descent, landing, and taxi to stop.
** The Hawker 800XP specification sheet (www.raytheonaircraft.com/hawker/) lists trip fuel used for a 1,000 nm trip (with 4 passengers) as 4,069 lb. The flight time is 2 hrs 25 minutes, or 4,069 lb / 6.7 lb/gallon = 607 gallons; 607
gallons / 145 minutes = 4.19 gallons per minute. This means an average fuel rate 1.90 “miles per gallon” for the whole trip, with better cruise performance once the aircraft is at altitude. With six passengers, this equates to 1.85 lb CO2
per passenger-mile (compare to air carriers’ average of 0.574 lb CO2 per passenger-mile).
A Gulfstream G-IV will use ~0.97 gallons fuel per nm, or 1.18 statute mpg, and a 1,000 nm trip would emit 10.25 tons of carbon dioxide (2.54 tonnes carbon). With eight passengers this means an emissions rate of 2.23 lb CO2 per
passenger mile. This “Hummer of the Sky” is outperformed (in terms of fuel, not time efficiency) by a street Hummer H2 at ~9 mpg and four on-board: 0.54 lb CO2 per pax-mile. Or rouhly equivalent if the Hummer is transporting only the
driver (2.17 lb CO2/pax-mile).
However, “the larger the aircraft the fewer the passengers” seems to hold true at Aspen’s GA operations. Gulfstream aircraft -- often configured for eight or nine passengers -- typically carry one or two passengers. With two passengers, a
1,000 nm trip in a G-II would consume about 1,220 gallons of fuel and emit 12.84 tons of CO2 or 11.2 lb CO2 per passenger-mile (25,680 lb CO2 / 1,151 miles / 2 pax).
The G-IV will use an average of 7.1 gallons per minute, or 7.6 ounces per second. On take-off, however, the older G-II will consume 12,000 lb/hr at full thrust (three times cruise fuel consumption of 4,000 lb/hr). 12,000 lb/hr = 200
lb/min = 3.33 lb/sec = 0.5 gallons/sec = 10.5 lb CO2/sec = 1.3 kgC/sec.
E14Cell:
Rick Heede:Comment:
As in 2004, CMS estimates that 75 percent of GA LTO operations at Aspen are by jet aircraft. While this may be conservative (see Brad Rolf’s work for the Airport inventory that suggests 65 percent are jets (if single and twin internal
combustion engine [ICE} aircraft are included), and as high as 89.7 percent of jets + turboprops (11,361 jets of 12,659 jet + turbo-prop total). However, Rolf’s data has not been verified (e.g., allegedly from FAA data, but only
documents 17,487 LTOs in an undocumented year, and ASE logs ~34,000 LTOs in recent years. See worksheet “GA Chart 2007” for Aspen LTO data.
G14Cell:
Rick Heede:Comment:
CMS modified the fuel rate calculation as follows (fuel rate is linked to the worksheet on “GA fuel performance data” in this workbook) but uses the same average flight distance of 1,000 nautical miles for aircraft arriving and departing
from Aspen in 2007 as in the 2004 inventory:
The 2004 rate (see comment Cell B4 in the 2004 worksheet) was 674 gallons for a 1,000 nm trip by the average jet operating out of Aspen based on a CSM aircraft type survey of Aspen aircraft;
The CMS worksheet (JetCalculatorAspen2008.xls) on all production and operating out-of-production jet aircraft averaged 658 gallons for a 1,000 nm mission; this is based on mission fuel consumption rates for 112 in-service private jets
(thus not including performance data for 35 turbo-prop aircraft in the section below) based in turn on 2007 fuel data in the Aug07 issue of Business & Commercial Aviation magazine;
Brad Rolf’s background work on the Aspen Pitkin Airport emissions inventory detailed LTOs by aircraft type (collected by the FAA Control Tower at Aspen). CMS did a weighted calculation of average fuel consumption weighted for LTO by
aircraft type (by using BC&A data on fuel consumption by AC type) that estimated average fuel consumption for jets only of 0.556 gallons per statute mile, 1.797 mpg, and 640 gallons per 1,000 nm flight. However, Rolf did not respond
to requests for confirmation of data source, year, FAA’s alleged categorization of aircraft types (all single engine ICE ac were called Cesssna 182 or Beech Baron 58). Hence CMS does not rely on the data.
CMS applies the CMS / B&CA mission fuel consumption data for all jets for a 1,000 nm flight: 658 gallons per 1,000 nm mission. Note: “mission” includes start-up, taxi and ground operations, take-off and climb, cruise, descent, and AviationComl&GA2007.xls
General Aviation 2007landing. Note: CMS has calculated fuel performance for light to extended range jet aircraft, categories 2-6 in the attached worksheet “GA fuel performance data.”
I14Cell:
Rick Heede:Comment:
Jet fuel factor is typically cited (e.g., by EPA and EIA) as 21.095 lb CO2 per gallon (based on 19.33 kg carbon per million Btu). CMS -- in the attached worksheet “US Coml Ave 2006” -- accounts for 1 percent of liquid fuel not combusted
to CO2 (per EPA and IPCC) and also accounts for associated methane and nitrous oxide emissions (EIA fuel factors for Jet fuel). The net result is 21.088 lb CO2e per gallon of jet fuel.
M15Cell:
Rick Heede:Comment:
We convert short tons (2000 lb) of carbon dioxide to metric tonnes of carbon at CO2/C = 3.664191. From Kevin Baumert, World Resources Institute, May05: “CO2 conversion is, precisely: C=12.0107 + O=15.9994 x 2 =
44.0095/12.0107 = 3.664191”
G25Cell:
Rick Heede (Jan09):Comment:
CMS uses the same average flight distance of 600 nm for turboprop aircraft as in the 2004 inventory.
Rick Heede (2004):
A 600 n-mile mission in a turboprop averages ~2.5 hours at a fuel burn of ~80 gallons per hour (range for production aircraft is on the order of 58 gallons per hour for a Cessna Grand caravan to Beech King Air 350 at 112 gallons per
hour).
Source: Business & Commercial Aviation (2004) “2004 Operations Planning Guide,” pp. 60 & 78.
I25Cell:
Rick Heede:Comment:
Turboprop aircraft use jet fuel. See note above.
E36Cell:
Rick Heede:Comment:
John Eisler: Info from Ellen Anderson, Pitkin County Emergency Management Coordinator 920-5234 on 5Aug08. Most of fixed were props.
I36Cell:
Rick Heede:Comment:
Turboprop aircraft use jet fuel. See note above.
C39Cell:
Rick Heede:Comment:
Flight for Life data from Pitkin County Emergency Services (Rich Walker, Director), 20July2005.
Total helicopter flights in 2004: 47;
Total fixed-wing flights in 2004: 55.
We assume that each flight is 120 miles each way, 240 miles roundtrip (and represent an average of a flight to Grand Junction and a flight to the Front Range; in 2004, flights to each area were roughly fifty-fifty).
We use the Eurocopter BK-117 helicopter to estimate fuel consumption rate for emergency choppers (the BK-117 is frequently used in such service). It is an 8 passenger helicopter originally designed in 1977. In the EMS configuration it is
capable of carrying a pilot, patient and 5 other passengers or a pilot, two patients and three other passengers. It is powered by two 700 horsepower Lycoming LTS 101-750-B1 engines. The craft uses 80 gallons of jet fuel per hour of
operation, max speed in 150 knots (173 mph). www.flightforlife.net/aircraft.htm
Thus, a typical flight from Grand Junction or the Front Range of 120 miles takes approximately 45 minutes each way and would consume an estimated 120 gallons round trip.
E46Cell:
Rick Heede:Comment:
The FAA data on Landing and TakeOffs (LTOs) lacks detail about type of aircraft using Aspen. The majority are itinerant (non-local), and CMS has allocated 10 percent of all itinerant LTOs as piston-powered single and twin aircraft using
Aviation Gasoline (AvGas). Plus CMS adds all local civilian aircraft LTOs as piston-powered. In 2007, this equals 2,204 LTO plus 1,186 LTO = 3,390 LTO.
I46Cell:
Rick Heede:Comment:
Aviation gasoline (AvGas) has an emission factor of 18.355 lb CO2 per gallon; source EIA 1605 program.
C48Cell:
Rick Heede:Comment:
CMS allocates 10 percent of total GA operations in 2007 to single-engine and twin piston aircraft. Note: same fraction as in the 2004 inventory.
C49Cell:AviationComl&GA2007.xls

General Aviation 2007Rick Heede:Comment:
Data for total Civil operations (“CI”) is from the FAA via David Ulane of the Aspen Pitkin Airport and tracked yearly by airport operations staff.
The FAA-designated and recorded “Civil” flights are typically locally-based aircraft and Flights for Life (EMS). The locally-based flights are air training, sightseeing, touch-and-goes (TGs), and similar flights that originate and return to Aspen.
We subtract Pitkin Emergency Services “Flight for Life” operations for 2004 (see above) and allocate the remained to such local flights, which we estimate are of 1.5 hr duration and of an aircraft mix of piston twins and singles buring 16
gallons per hour.
B66Cell:
Rick Heede:Comment:
Bus & Coml Aviation, July 2008, page 34: FSI quoted that simulators use ~0.07 metric tonnes CO2 per hour compared to the average business aircraft emits ~3.08 tCO2 per hour. Converts to 3.4 tons CO2 per hour.
Alternate CMS calculation, based on guesstimate average speed of 1,000 nm and 2h+20m equals 493 mph and 429 kn, tehn average fuel consumption is 283 gallons per hour, 5,966 lb CO2/hr, and 2.98 tons CO2/hr.
AviationComl&GA2007.xls

Aspen Pax 1998-2008
1
2
3
4
5
6
7
8
910
11
12
13
14
15
16
17
18
19
20
21
22
23
24
25
26
27
28
29
30
31
3233
3435
3637
3839
40
41
42
43
44
45
46
47
4849
50
5152
53
5455
56
57
58
59
A B C D E F G H I J K L M N O P Q R
Aspen/Pitkin County Airport
Total Passenger EnplanementsFrom David Ulane to Heede/CMS
7-Jan-09
Last modified: 18 April 2009
Enplanement and deplanement data for Aspen Pitkin County Airport, commercial aviation, 2003 - 2009
2003 2004 2005 2006 2007 2008 2009
Enplaned Deplaned Enplaned Deplaned Enplaned Deplaned Enplaned Deplaned Enplaned Deplaned Enplaned Deplaned Enplaned Deplaned
January 28,646 25,724 25,831 23,385 26,765 24,990 29,096 26,488 26,419 24,238 29,124 26,305
February 27,898 29,246 25,051 24,505 26,224 24,321 27,294 27,412 25,494 25,132 28,732 28,941
March 32,940 31,333 29,728 28,332 30,030 28,751 31,657 29,637 29,106 26,509 32,801 30,188
April* 12,011 7,521 10,574 7,959 10,908 7,020 11,122 7,976 7,372 3,966 12,346 7,847
May* 6,190 7,165 6,695 6,472 6,540 7,456 7,370 7,678 - - 9,343 9,605
June* 11,702 14,101 12,227 14,348 12,590 11,874 12,075 14,071 10,722 13,791 15,772 18,298
July 16,590 17,728 16,067 16,257 16,259 16,963 18,548 18,467 19,401 18,776 22,726 22,576
August 17,835 16,564 18,671 14,879 17,987 16,460 20,144 18,504 19,774 18,062 24,343 22,226
September 10,306 8,537 8,590 7,747 12,824 12,295 13,473 11,672 12,286 10,490 14,416 12,405
October 6,727 5,424 8,430 7,112 9,377 5,911 9,279 8,006 9,239 8,032 10,456 9,349
November 5,549 6,017 6,857 7,555 7,170 7,399 7,521 7,871 7,899 8,746 7,637 8,531
December 18,145 12,458 14,998 20,286 17,679 22,554 15,937 20,005 15,920 19,888 16,144 21,178
Total Passengers: 194,539 181,818 183,719 178,837 194,353 185,994 203,516 197,787 183,632 177,630 223,840 217,449
*The Airport was closed from April 9, 2007 through June 7, 2007 for runway rehabilitation
CMS note: 2008 enplanement and deplanement data updated from a file sent by Ulane, 16Jan09.
Historic Revenue Passenger Enplanements & Deplanements, 1998 - 2012
Year 1998 1999 2000 2001 2002 2003 2004 2005 2006 2007 2008 2009 2010 2011 2012
Enplanement 248,510 213,903 214,816 187,622 183,704 194,539 183,719 194,353 203,516 183,632 223,840
Deplanement na na na na na 181,818 178,837 185,994 197,787 177,630 217,449
Total Enp + Depl 376,357 362,556 380,347 401,303 361,262 441,289 - - - -
Analysis of “missing” PAX and “additional” emissions due to runway closure18-Apr-09
Apr-Jun06 Apr-Jun07 Apr-Jun08 Ave 06 & 08
Pax Apr-Jun 60,292 35,851 73,211 66,752
Percent of annual total 15.02% 9.92% 16.59% 15.81%
Total annual Pax 401,303 361,262 441,289 421,296
Additional PAX if ASE not closed Apr-Jun07: 30,901
Total Apr-Jun07 66,752
Percent adder to 2007 total PAX: 8.55%
Total 2007 ASE air travel: 105,750 tons CO2e
“Additional” emissions: 9,045 tons CO2e
AviationComl&GA2007.xls

Aspen Pax 1998-2008
F11Cell:
Rick Heede:Comment:
Data from Ulane, 15Aug05 Aspen Passenger report for 2003 & 2004. This data was used in the CMS inventory for Aspen, year 2004.
N11Cell:
Rick Heede:Comment:
Airport passenger data from Ulane’s “AirportPassengerRpt2008” for 2006 to 2008, received 16Jan09.
H38Cell:
Rick Heede:Comment:
Airport Total, 2005 deplanements, Ulane Aug2005. His datum for enplanements differs slightly: 194,539 pax.
AviationComl&GA2007.xls

US emission factor 2006
1
2
3
4
5
6
7
8
9
10
11
12
13
14
15
16
17
18
19
20
21
22
23
24
25
26
27
28
29
30
31
32
333435
3637
38
39
40
41
42434445464748495051
5253
54
555657585960616263
A B C D E F G H I J K L M N O P Q R S
Aspen Inventory 2007: US commercial fleet average emission factorRichard Heede
Climate Mitigation ServicesSnowmass, Colorado IPCC Global Warming Potential (GWP), FAR 2007
File Started: 22 December 2008 GWP factor methane, FAR: 25 x CO2
File last modified: 2 January 2009 IPCC FAR: Physical Science Basis, Table 2-14.
GWP factor nitrous, FAR: 298 x CO2
Table 1a Data on fuel, energy, and CO2 emissions for U.S. domestic service, 2006 Table 2a Calculation of emission coefficients for Jet FuelTEBD 27th edition, data for 2006 19.33 kgC/million Btu (EPA 2008: Annex 2: Methodology, Table A-30)
Domestic air carriers 1,834 trillion Btu, 2006, Domestic air carriers, TEBD Table 2.5 70.83 kg CO2/million Btu (CMS result above)
International air carriers 406 trillion btu, international air carriers, 2006 42.61 lb C/million Btu
General aviation 221 trillion btu, general aviation, 2006 (jet fuel only) 3.66 CO2/C
156.15 lb CO2 “content”/million Btu
TEBD 27, 2008, Table 2-12: certificated route 135,000 heat content of Jet Fuel (Btu per gallon)
6,003 vehicle miles (millions) ORNL Transportation Energy Data Book 7.41 gallons per million Btu
577,620 passenger-miles (millions) http://cta.ornl.gov/data/index.shtml 21.08 lb CO2 “content”/gallon
96.22 load factor (persons/veh) 0.99 oxydation factor (per IPCC 1997; EPA Annex 2: Methodology)
313,776 Btu per vehicle-mile 20.87 lb CO2 emission factor per gallon of Jet Fuel, 2006
3,261 Btu per passenger-mile
1,884 Total energy use (trillion Btu) Table 2b Methane & nitous oxide emission coefficients (Jet Fuel, per EIA 1605)
135,000 heat content (Btu per gallon) 70.88 kg CO2/million Btu (EIA 2008 Form 1605 Instructions, App’x H: Fuel Emission Factors)
0.27 g CH4/gallon Jet Fuel
Table 1b 0.0242 gallons per pax-mile, 2006 0.01 kg CO2e of methane emissions per gallon Jet
21.09 lb CO2e per gallon of jet fuel (Table 2c) 0.31 g N2O /gallon Jet Fuel
CMS, U.S. domestic service, 2006 0.5094 US average lb CO2e/passenger-mile, 2006 0.09 kg CO2e of nitrous emissions per gallon Jet
0.10 kg CO2e (methane + nitrous) per gallon Jet Fuel
DEFRA, “long-haul” service, 2007 0.3747 lb CO2/passenger-mile (international) 70.98 Final total EIA: kg CO2e per gallon
CMS, ASE-DEN short haul service 0.9735 lb CO2/passenger-mile (DEN-ASE) Table 2c Final CMS-calculated jet fuel coefficient w methane & nitrous & oxidation factor70.93 CMS: kg CO2e per gallon (no methane & nitrous, before oxidation factor)
21.080 lb CO2 “content” per gallon (before oxidation factor)20.869 lb CO2 emission factor per gallon (with oxidation factor applied)
Table 3 Airline Fuel Cost and Consumption (All carriers - Scheduled) 0.219 lb CO2e (methane + nitrous) per gallon Jet Fuel21.299 CMS: lb CO2e per gallon before oxidation factor
Domestic International Total 21.088 Final total CMS: lb CO2e per gallon Jet Fuel with oxidation factorConsumption Cost Cost per Gallon Consumption Cost Cost per Gallon Consumption Cost Cost per Gallon CMS uses this factor in Aspen GHG aviation emissions, 2006, and
(million gallons) (million dollars) (dollars) (million gallons) (million dollars) (dollars) (million gallons) (million dollars) (dollars) includes methane and nitrous oxide emissions & oxidation factor (99 percent)
2000 13,904 10,811$ 0.78$ 5,123 4,388$ 0.86$ 19,026 15,198$ 0.80$ 156.21 lb CO2e per million Btu
2001 13,112 10,025$ 0.76$ 4,956 3,990$ 0.81$ 18,068 14,014$ 0.78$ 2002 12,287 8,603$ 0.70$ 4,572 3,335$ 0.73$ 16,859 11,938$ 0.71$ Table 2d Average per passenger-mile emission factors, various sources & years2003 12,417 10,315$ 0.83$ 4,451 3,838$ 0.86$ 16,868 14,154$ 0.84$ year lb CO2/pax-mile notes2004 13,380 15,141$ 1.13$ 4,765 5,691$ 1.19$ 18,145 20,832$ 1.15$ Sep06-Dec08 0.5452 CMS field research: 37 US flights average2005 13,271 21,658$ 1.63$ 5,040 8,601$ 1.71$ 18,311 30,258$ 1.65$ Sep06-Dec08 0.4279 37 flights: total CO2 / (total miles * ave pax load)2006 12,907 24,881$ 1.93$ 5,221 10,536$ 2.02$ 18,128 35,417$ 1.95$ 2004 (TEBD) 0.5740 CMS: US domestic average (TEBD-25)2007 12,877 26,628$ 2.07$ 5,428 11,684$ 2.15$ 18,304 38,312$ 2.09$ 2005 (TEBD) 0.5048 CMS: US domestic average (TEBD-26)
2008 (Jan-Oct) 10,468 32,611$ 3.12$ 4,671 15,759$ 3.37$ 15,138 48,369$ 3.20$ 2006 (TEBD) 0.5094 CO2e; CMS: US domestic average (TEBD-27)
Table 4 FAA / Bureau of Transportation Statistics Table 2e TEBD 27, 2008, Table 9-2: U.S. domestic & international certificated route
Scheduled Service All Services 8,220 vehicle miles (millions) ORNL Transportation Energy Data Book
Revenue Pax
Enplanements
Revenue Pax
ton-miles
Rev. Freight
ton-miles
Over-all avail
ton-miles
Over-all rev.
load factor
Aircraft Rev.
Departures
Revenue Pax
ton-miles
Rev. Freight
ton-miles
Over-all avail
ton-miles810,098 passenger-miles (millions) http://cta.ornl.gov/data/index.shtml
millions millions millions millions percent millions millions millions millions 3,266 Btu per passenger-mile2000 666 69,250 21,143 158,878 58.4% 9.0 70,800 30,221 172,574 2,646 Total energy use (trillion Btu)2004 703 73,368 26,682 171,650 59.0% 11.4 75,207 37,958 171,650 135,000 heat content (Btu per gallon)2005 739 77,901 26,841 178,969 59.2% 11.6 79,512 39,292 200,282 0.0242 gallons per pax-mile, 20062006 744 79,680 28,233 179,454 60.8% 11.3 80,946 39,754 198,937 21.09 lb CO2e per gallon of jet fuel (Table 2c)2007 769 82,849 28,585 184,759 60.8% 11.4 84,098 39,842 204,328 0.5102 US average lb CO2e/passenger-mile, 2006
Airline Activity, Oct06-Sep07, National Summary, U.S. Flights): 676 million passengers www.transtats.bts.gov/ CMS note: very slight difference btw Table 1 (domestic) and Table 2e (dom & int).
AviationComl&GA2007.xls

US emission factor 2006
M12Cell:
Rick Heede:Comment:
Jet fuel varies slightly in quality from year to year (19.40 kgC in 1990, but at 19.33 kgC since 1996; EPA (2008) Inventory of US GHG 1990-2006, Annex 2: Methodology, Table A-30)
D13Cell:
Rick Heede:Comment:
Domestic air carriers’ domestic consumption only; see below for international air carriers and general aviation.
D14Cell:
Rick Heede:Comment:
“One half of fuel used by domestic carriers in international operation.” Fn C.
E27Cell:
Rick Heede (Jan09):Comment:
CMS re-calculated the emission coefficient for jet fuel in Tables 2a, 2b, and 2c, which is based on EIA and EPA factor of 19.33 kg carbon per million Btu and accounts for both associated methane and nitrous oxide emissions (EIA fuel factors) and
the fuel oxidation factor (99 percent oxidation to CO2). The result is 21.088 lb CO2e per gallon of jet fuel.
The conventional EIA factor is slightly higher, at 21.095 lb CO2 per gallon, since the methane and nitrous adjustment compensates for EIA’s non-consideration of the oxidation factor (although the EPA and IPCC list the oxidation factor as 99
percent, as used here).
E30Cell:
Rick Heede:Comment:
CMS adopts DEFRA emission factor for “long haul” (>6,482 km or 4,028 miles), revised in 2007 to 0.1056 kg CO2 per passenger km, which converts to 0.3747 lb CO2 per passenger-mile. CMS uses this factor for international flights in the Aspen
GHG inventory for 2007.
CMS note: while DEFRA is the oft-cited source (e.g, basis for WRI’s air travel factors), CMS considers this factor on the high side for long haul flights. The reason is personal experience and actual fuel consumption data for longer domestic flights
taken from Sep06-Dec08 with higher load factors and that trended toward ~0.3 lb CO2/pax-mile. Some flights with high load factor were lower (e..g, 0.22 lb CO2/pax-mile). CMS has not taken an international flight in recent years. CMS applies the
DEFRA factor but anticipates further research by DEFRA and other institutions will result in lowered emission factors for long haul flights in the near future. Shorter flights, however, are likely to increase toward 1.0 lb CO2/pax-mile -- up from the
current DEFRA datum of 0.561 lb CO2/pax-mile.
UK DEFRA (2007) Passenger transport emissions factors: Methodology paper, London, 17 pp
E32Cell:
Rick Heede (Jan09):Comment:
CMS has calculated the fuel consumption and emission factor based on CMS acquisition of fuel data and passenger loading for 13 specific flights between Aspen and Denver (ASE & DEN) taken by CMS principal Rick Heede from Sep06 to Dec08.
Emission factors ranged from low of 0.603 lb CO2 per passenger-mile (DASH-8, 750 lb fuel, 32 of 37 pax, Sep08) to a high of of 3.82 lb CO2 per passenger-mile (CRJ700, 2,452 lb fuel, 16 of 66 pax, Dec08). A simple average of all 13 flights is
1.174 lb CO2/pax-mile.
A more reasonable calculation is to divide total emissions for all flights (68,412 lb CO2) by the product of total miles flown (1,704 miles) and average load (41.2 passengers) for an average emission factor of 0.9737 lb CO2/pax-mile. CMS applies
this factor to the Denver to Aspen (and return) portion of each deplaning passenger arriving in Aspen (177,630 pax) or departing Aspen (183,632 pax) in 2007.
Note: CMS will attempt to disaggregate total passenger enplanements heading to Denver vs enplaning on flights with other destinations (e.g., SLC, LAX, CHI, etc).
N45Cell:
Rick Heede (Jan09):Comment:
CMS requested specific fuel consumption data “gate to gate” from the pilot after each of 37 flights taken from Sep06 through Dec08, but excluding 13 legs from Aspen to Denver or vice versa. These flights were chiefly on United Airlines (also
Delta and Continental) in Airbus 320s, Boeing 737 and 777 and 767 and 757, Embraer, and CRJ200 and 700 aircraft on distances ranging from 40 to 2900 nmiles and load factors averaging 88.9 percent. Fuel consumption on all 37 flights totaled
430,700 lb, total distance flown was 28,772 miles (24,997 nm), and emissions of 1.34 million lb CO2. Emissions averaged 0.5452 lb CO2 per passenger mile for this set of flights. Average load factor of 88.9 percent.
See note below for alternate calculation. CMS field research is presented for comparison purposes only, and are not used to calculate emissions for the Aspen inventory -- except for the short haul between Aspen and Denver for which national or
official data is unavailable.
N46Cell:
Rick Heede:Comment:
Instead of averaging the lb CO2/pax-mile for the 37 flights (as done above), this measure calculates the average differently: total emissions for all flights based on fuel data divided by (total miles flown times average passengers onboard). Which,
for the 37 flights Sep-6-Dec08, is 1.34 million lb CO2 / (28,772 miles times 109 pax) = 0.4279 lb CO2/pax-mile. This calculation is a reasonable metric, but is made here for comparison purposes only.
N47Cell:
AviationComl&GA2007.xls

US emission factor 2006
Rick Heede:Comment:
CMS calculated average per passenger mile emissions of 0.5740 lb CO2/pax-mile in 2004 using the same source as the above calculation for 2006: ORNL’s TEBD, various tables.
N48Cell:
Rick Heede:Comment:
CMS calculated average per passenger mile emissions of 0.5048 lb CO2/pax-mile in 2005 using the same source as the above calculation for 2006: ORNL’s TEBD, various tables.
N49Cell:
Rick Heede:Comment:
CMS calculation of ORNL TEBD data for year 2006. Methodology has been revised and improved to account for oxidation factor of 99 percent (ie., non-combustion of 1 percent of the carbon in the fuel) as well as inclusion of methane and nitrous
oxide emissions (data from EIA 1605 emission factors). This revision changes the emission factor from 21.095 lb CO2/pax-mile in 2004 to 21.088 lb CO2e/pax-mile in 2006.
AviationComl&GA2007.xls
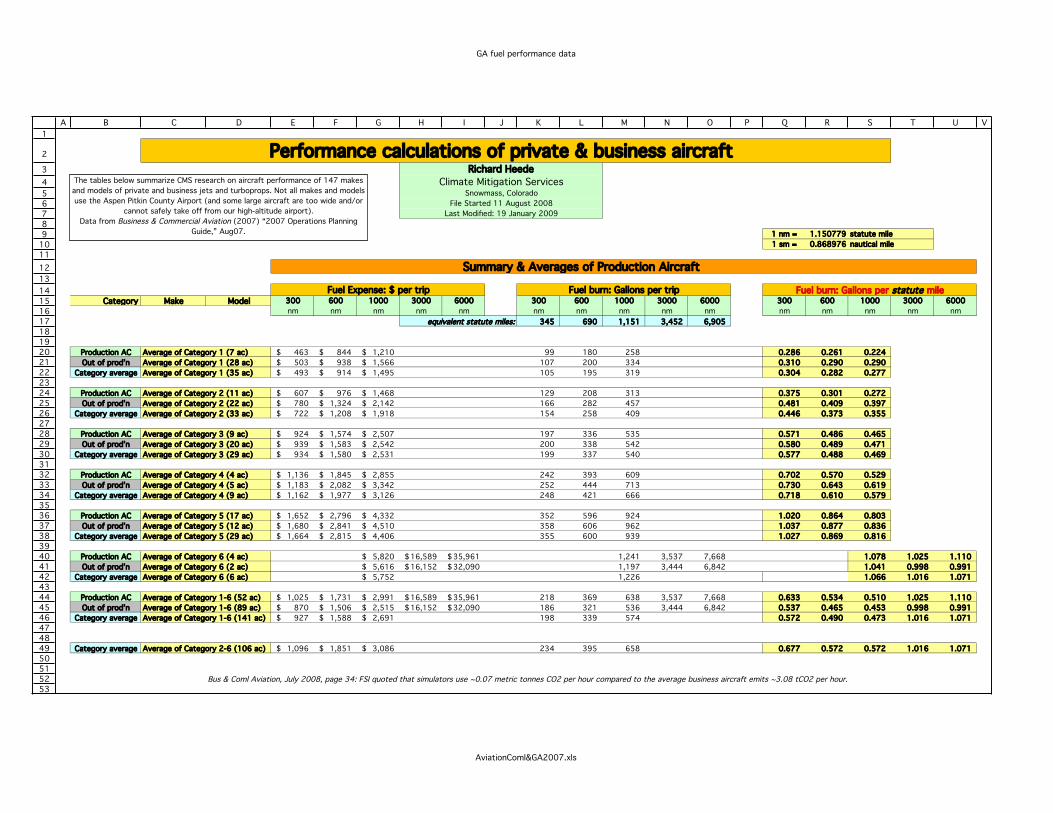
GA fuel performance data
1
2
3
4
5
6
7
8
9
10
11
12
13
14
15
16
17
18
19
20
21
22
23
24
25
26
27
28
29
30
31
32
33
34
35
36
37
38
39
40
41
42
43
44
45
46
47
48
49
50
51
52
53
A B C D E F G H I J K L M N O P Q R S T U V
Performance calculations of private & business aircraftRichard Heede
Climate Mitigation ServicesSnowmass, Colorado
File Started 11 August 2008
Last Modified: 19 January 2009
1 nm = 1.150779 statute mile
1 sm = 0.868976 nautical mile
Summary & Averages of Production Aircraft
Fuel Expense: $ per trip Fuel burn: Gallons per trip Fuel burn: Gallons per statute mileCategory Make Model 300 600 1000 3000 6000 300 600 1000 3000 6000 300 600 1000 3000 6000
nm nm nm nm nm nm nm nm nm nm nm nm nm nm nm
equivalent statute miles: 345 690 1,151 3,452 6,905
Production AC Average of Category 1 (7 ac) 463$ 844$ 1,210$ 99 180 258 0.286 0.261 0.224
Out of prod’n Average of Category 1 (28 ac) 503$ 938$ 1,566$ 107 200 334 0.310 0.290 0.290
Category average Average of Category 1 (35 ac) 493$ 914$ 1,495$ 105 195 319 0.304 0.282 0.277
Production AC Average of Category 2 (11 ac) 607$ 976$ 1,468$ 129 208 313 0.375 0.301 0.272
Out of prod’n Average of Category 2 (22 ac) 780$ 1,324$ 2,142$ 166 282 457 0.481 0.409 0.397
Category average Average of Category 2 (33 ac) 722$ 1,208$ 1,918$ 154 258 409 0.446 0.373 0.355
Production AC Average of Category 3 (9 ac) 924$ 1,574$ 2,507$ 197 336 535 0.571 0.486 0.465
Out of prod’n Average of Category 3 (20 ac) 939$ 1,583$ 2,542$ 200 338 542 0.580 0.489 0.471
Category average Average of Category 3 (29 ac) 934$ 1,580$ 2,531$ 199 337 540 0.577 0.488 0.469
Production AC Average of Category 4 (4 ac) 1,136$ 1,845$ 2,855$ 242 393 609 0.702 0.570 0.529
Out of prod’n Average of Category 4 (5 ac) 1,183$ 2,082$ 3,342$ 252 444 713 0.730 0.643 0.619
Category average Average of Category 4 (9 ac) 1,162$ 1,977$ 3,126$ 248 421 666 0.718 0.610 0.579
Production AC Average of Category 5 (17 ac) 1,652$ 2,796$ 4,332$ 352 596 924 1.020 0.864 0.803
Out of prod’n Average of Category 5 (12 ac) 1,680$ 2,841$ 4,510$ 358 606 962 1.037 0.877 0.836
Category average Average of Category 5 (29 ac) 1,664$ 2,815$ 4,406$ 355 600 939 1.027 0.869 0.816
Production AC Average of Category 6 (4 ac) 5,820$ 16,589$ 35,961$ 1,241 3,537 7,668 1.078 1.025 1.110
Out of prod’n Average of Category 6 (2 ac) 5,616$ 16,152$ 32,090$ 1,197 3,444 6,842 1.041 0.998 0.991
Category average Average of Category 6 (6 ac) 5,752$ 1,226 1.066 1.016 1.071
Production AC Average of Category 1-6 (52 ac) 1,025$ 1,731$ 2,991$ 16,589$ 35,961$ 218 369 638 3,537 7,668 0.633 0.534 0.510 1.025 1.110
Out of prod’n Average of Category 1-6 (89 ac) 870$ 1,506$ 2,515$ 16,152$ 32,090$ 186 321 536 3,444 6,842 0.537 0.465 0.453 0.998 0.991
Category average Average of Category 1-6 (141 ac) 927$ 1,588$ 2,691$ 198 339 574 0.572 0.490 0.473 1.016 1.071
Category average Average of Category 2-6 (106 ac) 1,096$ 1,851$ 3,086$ 234 395 658 0.677 0.572 0.572 1.016 1.071
Bus & Coml Aviation, July 2008, page 34: FSI quoted that simulators use ~0.07 metric tonnes CO2 per hour compared to the average business aircraft emits ~3.08 tCO2 per hour.
The tables below summarize CMS research on aircraft performance of 147 makes
and models of private and business jets and turboprops. Not all makes and models
use the Aspen Pitkin County Airport (and some large aircraft are too wide and/or
cannot safely take off from our high-altitude airport).
Data from Business & Commercial Aviation (2007) “2007 Operations Planning
Guide,” Aug07.
AviationComl&GA2007.xls

GA fuel performance data
U14Cell:
Rick Heede:Comment:
CMS bases its calculations on fuel flow per mission length segments published in B&CA Operations Plannning Guide. These mission distances are expressed in categories such as 300, 600, 1,000 NAUTICAL miles (nm). Thus, in calculating
fuel combustion per statute mile for the Canary/Colorado Governor’s Energy Office -- which will use a distance calculator that gives flying distances in statute miles, CMS converts all fuel burn estimates for all makes and models, as well as
category averages, into fuel burn per mile. This is accomplished by dividing fuel burn per trip (columns L through P) by, for example, 300 nm * 1.1508 m/nm = 345.2 mile; ditto for 600 nm, and so forth.
AviationComl&GA2007.xls

GA Ops Aspen 2007
1
2
3
4
56
7
891011
1213
141516
1718192021
22
232425262728
2930313233
3435
36
3738
39
40
414243
44
45
46
47
48
49
50
51
52
53
54
5556
57
58
5960616263646566676869707172
A B C D E F G H I J K L M N O P Q
General Aviation, Aspen Pitkin Airport (Sardy Field), 2007John Eisler
Aspen Canary Initiative16-Sep-08
Adjustments by Rick HeedeClimate Mitigation Services
20-Jan-09
original FAA dataoriginal FAA data Jan Feb March April May June July August Sept Nov Oct Dec 2007
Air Taxi 1,124 984 1,355 285 - 1,096 2,063 1,874 1,397 791 725 1,006 12,700
General Aviation 2,336 2,054 2,634 620 - 2,070 3,151 3,145 2,080 1,321 1,243 1,385 22,039 Total 34,739
Air Carrier adjustment for Dash-8 flights classified by FAA Aspen CT as Air Taxi opsAir carrier 910 884 1,026 296 - 517 680 666 246 223 221 709 6,378 FAA air carrier data
Dash-8 adjustment 200 188 248 66 - 306 424 412 460 328 290 200 3,122 2xload factor DASH-8s
Total Air Carrier Ops 1,110 1,072 1,274 362 - 823 1,104 1,078 706 551 511 909 9,500
adjusted Air Taxi plus General Aviation results
Itinerant (non-Carrier) Jan Feb March April May June July August Sept Nov Oct Dec 2007Air Taxi (adjusted) 924 796 1,107 219 - 790 1,639 1,462 937 463 435 806 9,578 linked to Table 1 & 2
General Aviation 2,336 2,054 2,634 620 - 2,070 3,151 3,145 2,080 1,321 1,243 1,385 22,039 linked to Table 1 & 2
Military 15 3 - - - 10 - 4 7 2 - 4 45 linked to Table 1 & 2
Total itinerant 3,275 2,853 3,741 839 - 2,870 4,790 4,611 3,024 1,786 1,678 2,195 31,662
LocalCivilian 52 70 165 42 - 84 114 104 248 84 154 40 1,157 Military 8 2 - - - 2 1 10 4 1 1 - 29 Total local 60 72 165 42 - 86 115 114 252 85 155 40 1,186 linked to Table 4
Total air taxi, GA, & local 3,335 2,925 3,906 881 - 2,956 4,905 4,725 3,276 1,871 1,833 2,235 32,848
Total, all airport operations 2007 42,348
2007 FAA data on “Operations” (landing or takeoff) at Aspen Pitkin AirportItinerant Local Totals
Air Carrier + General GAMonth Air Carrier Air Taxi Air Taxi Aviation Vs. 2006 Military Total Itinerant Vs. 2006 Civilian Military Total Local Vs. 2006 2007 Vs. 2006
January 910 1,124 2,034 2,336 15.1% 15 4,385 16.7% 52 8 60 25.0% 4,445 16.8%
February 884 984 1,868 2,054 -6.8% 3 3,925 -3.2% 70 2 72 -10.0% 3,997 -3.3%
March 1,026 1,355 2,381 2,634 8.4% - 5,015 8.8% 165 - 165 166.1% 5,180 10.9%
April* 296 285 581 620 -58.7% - 1,201 -52.8% 42 - 42 -19.2% 1,243 -52.1%
May* - - - - -100.0% - - -100.0% - - - -100.0% - -100.0%
June* 517 1,096 1,613 2,070 -6.6% 10 3,693 -3.5% 84 2 86 -20.4% 3,779 -4.0%
July 680 2,063 2,743 3,151 4.3% - 5,894 7.0% 114 1 115 130.0% 6,009 8.1%
August 666 1,874 2,540 3,145 2.4% 4 5,689 2.1% 104 10 114 442.9% 5,803 3.8%
September 246 1,397 1,643 2,080 -7.5% 7 3,730 -2.0% 248 4 252 769.0% 3,982 3.8%
October 223 791 1,014 1,321 9.4% 2 2,337 9.9% 84 1 85 193.1% 2,422 12.3%
November 221 725 946 1,243 -10.8% - 2,189 -0.5% 154 1 155 496.2% 2,344 5.3%
December 709 1,006 1,715 1,385 -36.8% 4 3,104 -22.9% 40 - 40 90.5% 3,144 -22.3%
Totals 6,378 12,700 19,078 22,039 #DIV/0! 45 41,162 -6.5% 1,157 29 1,186 79.7% 42,348 -5.2%
Historical Aspen Airport operations data from FAA via David Ulane, Jan09
2008 (Jan-Nov) 7,067 12,141 19,208 18,673 74 37,882 3,512 33 3,540 41,422 2007 6,378 12,700 19,078 22,039 45 41,162 1,157 29 1,186 42,348 2006 5,411 13,847 19,258 24,693 68 44,019 609 51 660 44,679 2005 5,130 12,538 17,668 25,159 65 42,892 1,305 28 1,333 44,225 2004 5,233 12,468 17,701 25,020 72 42,793 1,207 22 1,229 44,022 2003 6,580 10,034 16,614 24,504 116 41,234 1,737 8 1,745 42,979 2002 6,902 10,034 16,936 27,335 92 44,363 2,042 36 2,078 46,441 2001 6,988 9,008 15,996 27,978 75 44,049 1,952 46 1,998 46,047 2000 7,632 7,199 14,831 30,016 167 45,014 3,570 72 3,642 48,656 1999 7,363 3,864 11,227 31,724 217 43,168 3,024 50 3,074 46,242 1998 11,475 4,233 15,708 27,546 66 43,320 2,429 42 2,633 45,953
AviationComl&GA2007.xls
GA Ops Aspen 2007K17Cell:
Rick Heede:Comment:
David Ulane pointed out that the FAA classifies some air carrier flights as “Air Taxi” (those aircraft carrying fewer than 60 passengers), and that to get an accurate estimate of air taxi operations in 2007 we need to deduct the total
number of airline flights that arrive with, in our case, DASH-8 aircraft. This is done using airline load factor data provided by David Ulane for 2007, in which 1,561 DASH-8 landed at ASE. Since the FAA control tower counts both arrivals
and landings, we need to count each DASH-8’s departure and deduct the sum from FAA data on Air taxi. Thus, in 2007, commercial “air carrier” aircraft total 6,378 plus 3,122 DASH-8s from air taxi equals 9,500 total arriving and
departing commercial flights.
Note: commercial air travel fuel and emissions are calculated in the “Commercial Aviation 2007” worksheet and are based on total arriving and departing passengers. This is necessitated by the fact that airlines do not share total fuel
consumption for their fleet serving Aspen.
AviationComl&GA2007.xls
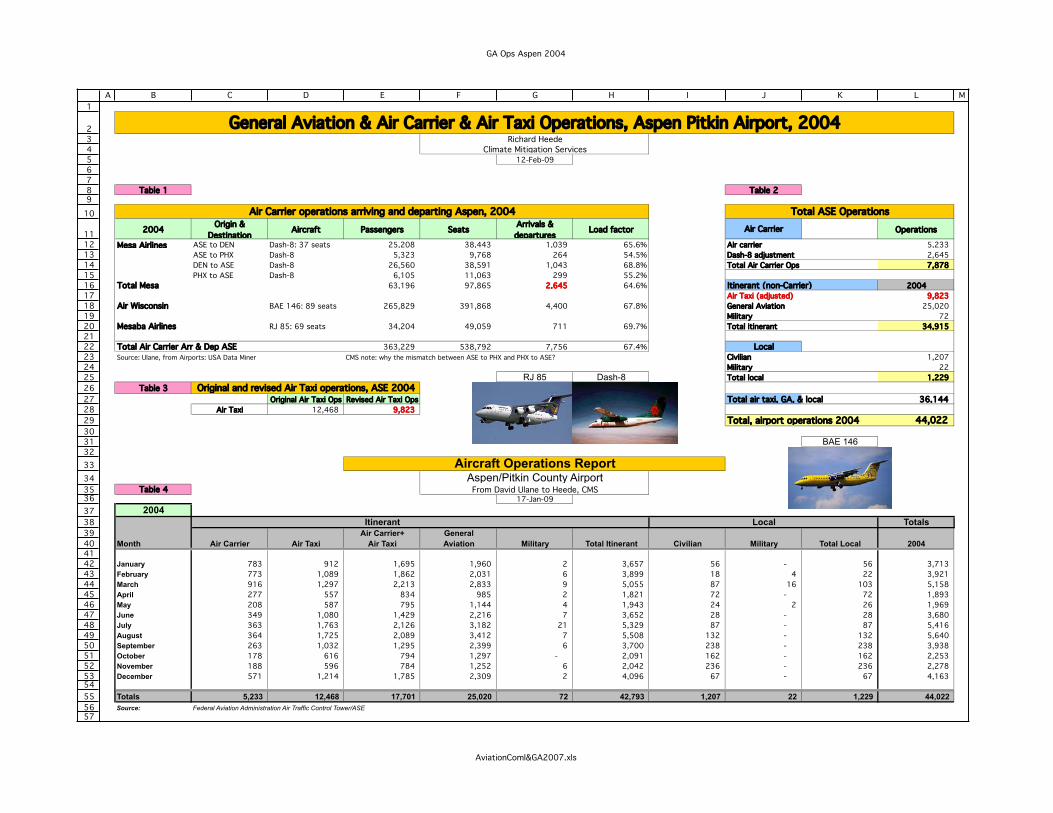
GA Ops Aspen 2004
1
2
3
4
5
6
7
8
9
10
11
12
13
14
15
16
17
18
19
20
21
22
23
24
25
26
27
28
29
30
31
32
33
34
35
36
37
38
39
40
41
42
43
44
45
46
47
48
49
50
51
52
53
54
55
56
57
A B C D E F G H I J K L M
General Aviation & Air Carrier & Air Taxi Operations, Aspen Pitkin Airport, 2004Richard Heede
Climate Mitigation Services12-Feb-09
Table 1 Table 2
Air Carrier operations arriving and departing Aspen, 2004 Total ASE Operations
2004Origin &
DestinationAircraft Passengers Seats
Arrivals &
departuresLoad factor Air Carrier Operations
Mesa Airlines ASE to DEN Dash-8: 37 seats 25,208 38,443 1,039 65.6% Air carrier 5,233
ASE to PHX Dash-8 5,323 9,768 264 54.5% Dash-8 adjustment 2,645
DEN to ASE Dash-8 26,560 38,591 1,043 68.8% Total Air Carrier Ops 7,878
PHX to ASE Dash-8 6,105 11,063 299 55.2%
Total Mesa 63,196 97,865 2,645 64.6% Itinerant (non-Carrier) 2004
Air Taxi (adjusted) 9,823
Air Wisconsin BAE 146: 89 seats 265,829 391,868 4,400 67.8% General Aviation 25,020
Military 72
Mesaba Airlines RJ 85: 69 seats 34,204 49,059 711 69.7% Total itinerant 34,915
Total Air Carrier Arr & Dep ASE 363,229 538,792 7,756 67.4% LocalSource: Ulane, from Airports: USA Data Miner CMS note: why the mismatch between ASE to PHX and PHX to ASE? Civilian 1,207
Military 22
RJ 85 Dash-8 Total local 1,229
Table 3 Original and revised Air Taxi operations, ASE 2004Original Air Taxi Ops Revised Air Taxi Ops Total air taxi, GA, & local 36,144
Air Taxi 12,468 9,823
Total, airport operations 2004 44,022
BAE 146
Aircraft Operations ReportAspen/Pitkin County Airport
Table 4 From David Ulane to Heede, CMS17-Jan-09
2004
Itinerant Local Totals
Air Carrier+ General
Month Air Carrier Air Taxi Air Taxi Aviation Military Total Itinerant Civilian Military Total Local 2004
January 783 912 1,695 1,960 2 3,657 56 - 56 3,713
February 773 1,089 1,862 2,031 6 3,899 18 4 22 3,921
March 916 1,297 2,213 2,833 9 5,055 87 16 103 5,158
April 277 557 834 985 2 1,821 72 - 72 1,893
May 208 587 795 1,144 4 1,943 24 2 26 1,969
June 349 1,080 1,429 2,216 7 3,652 28 - 28 3,680
July 363 1,763 2,126 3,182 21 5,329 87 - 87 5,416
August 364 1,725 2,089 3,412 7 5,508 132 - 132 5,640
September 263 1,032 1,295 2,399 6 3,700 238 - 238 3,938
October 178 616 794 1,297 - 2,091 162 - 162 2,253
November 188 596 784 1,252 6 2,042 236 - 236 2,278
December 571 1,214 1,785 2,309 2 4,096 67 - 67 4,163
Totals 5,233 12,468 17,701 25,020 72 42,793 1,207 22 1,229 44,022
Source: Federal Aviation Administration Air Traffic Control Tower/ASE
AviationComl&GA2007.xls

GA Ops Aspen 2004
G25Cell:
Rick Heede:Comment:
Wikipedia:
Avro RJX series The RJX-70, RJX-85 and RJX-100 aircraft represented advanced variants of the Avro RJ Series. The RJX used Honeywell AS977 turbofans for greater efficiency (15% less fuel-burn, 17% increased range), quieter
performance and 20% less maintenance costs.
H25Cell:
Rick Heede:Comment:
Wikipedia:
The Bombardier Dash 8 (formerly the de Havilland Canada Dash 8, sometimes abbreviated as DHC-8) is a series of twin-engined, medium range, turboprop airliners. Introduced by de Havilland Canada (DHC) in 1984, they are now
produced by Bombardier Aerospace. Since 1996, the aircraft have been known as the Q Series, for “quiet”. Over 900 Dash 8s of all models have been built. Bombardier forecasts a total production run of 1,192 units of all
Dash8/QSeries variants through the year 2016.
Engines: 2 PW120A/PW121 (Series 100) or 2 PW123C/D (Series 200), Typical Passenger Seating: 37 (Single Class), Maximum fuel capacity: 3,160 liters, Maximum takeoff weight: 36,300 lb (16,470 kg).
K31Cell:
Rick Heede:Comment:
Wikipedia:
The BAe 146 is a medium-sized commercial aircraft which was manufactured in the United Kingdom by British Aerospace (which later became part of BAE Systems). Production ran from 1983 until 2002. Manufacture of the
improved version known as the Avro RJ began in 1992. A further-improved version, the Avro RJX – with new engines – was announced in 1997, but only two prototypes and one production aircraft were built before production
ceased in late 2001. With 387 aircraft produced, the Avro RJ/BAe 146 program is the second most successful British civil jet to date. The BAe 146/Avro RJ is a high-wing cantilever monoplane with a T-tail, it has four turbofan jet
engines engines pylon mounted underneath the wings. It has a retractable tricycle landing gear. The aircraft has STOL capabilities and very quiet operation; it has been marketed under the name Whisperjet.
Specifications (BAe 146-200) General characteristics Crew: 4 with 2 flight attendants Capacity: 85-100 passengers Length: 93 ft 8 in (28.55 m) Wingspan: 86 ft 5 in (26.34 m) Height: 28 ft 3 in (8.61 m) Wing area: 832 ft?
(77.30 m?) Empty weight: 73,415 lb (33,300 kg) Max takeoff weight: 93,035 lb (42,200 kg) Powerplant: 4? Honeywell ALF 502R-5 turbofans, 6,970 lbf (31 kN) each Performance Maximum speed: 555 mph (482 knots, 893
km/h) Cruise speed: 465 mph (404 knots, 750 km/h) Range: 1,290 mi (2,075 km) with 25,000 lb (11,000 kg) of payload Service ceiling 31,200 ft (9,500 m)
AviationComl&GA2007.xls

Landfill2007.xls
1
2
3
4
5
6
7
8
9
10
11
12
13
14
15
16
17
18
19
20
21
22
23
24
25
26
27
28
29
30
31
32
33
34
35
36
37
38
39
40
41
42
43
44
45
46
47
48
49
50
51
52
53
A B C D E F G H I J K
Aspen Emissions Inventory: Pitkin County Landfill: Emissions and SavingsRichard Heede
Climate Mitigation ServicesSnowmass, Colorado Data provided by:
File Started 7 August 2008 Chris Hoofnagle
Last Modified: 13 April 2009 Solid Waste Manager
Dr. Jean Bogner Pitkin County Landfill
Landfills +, Inc. 923-3487630-665-0872 [email protected]
Table 1: Emissions Electricity Fuel consumed Carbon factor Methane emissions Methane factor Attributed to AspenCarbon dioxide
(Aspen’s share)
Carbon
(Aspen’s share)
kWh gallons lb CO2/kWh & /gallon tons CH4 tons CO2e Percent tons CO2e tonnes carbon (C-eq)
Pitkin County Landfill Methane GWP: 25xCO2
Electricity 153,511 1.707 50% 66 16
Fuel consumption (diesel) 5,953 22.38 50% 33 8
Fuel consumption (gasoline) 873 19.59 50% 4 1
Fugitive methane (from Table 2) 1,357 33,937 50% 16,969 4,201
Total Pitkin County Landfill 17,072 4,227
Aspen’s share of methane emissions 678.7 tons CH4
Biosolids, tons, 2007: 1,650 0.02 2% tons as methane 33.00 825 100% 825 204
Total Landfill if biosolids methane is included: 17,897
Table 2 Estimated methane generation and emissions, 2007Methane generated (low: 295 cfm) 3,285 tons CH4 1,000 cf methane = 42.37 lb
Methane generated (high: 483 cfm) 5,378 tons CH4
Methane emitted (low: 1,023 tonnes) 1,128 tons CH4 tonne = 1,000 kgMethane emitted (high: 1,440 tonnes) 1,587 tons CH4 ton = 2000 lb
Methane emitted (average of high and low) 1,357 tons CH4 1 tonne = 1.1023 ton
Golder Associates (2007) Landfill Gas Evaluation of the Pitkin County Solid Waste Center, Lakewood CO, 41 p., www.golder.com 1 kg = 2.2046 lb
Table 3: Saved emissions (recycling)Quantities Recycled
and Sold
CO2e savings per
tonne recycled
Total Pitkin County
CO2e savingsAttributed to Aspen
Aspen’s share,
CO2eAspen’s share, Ce
tonnes tonnes CO2-eq/tonne tons CO2e Percent tons CO2e/yr tonnes carbon (C-eq)
Pitkin County Landfill: Savings from Recycling
Office paper 236 5.4 1,404 60% 842 209
Newsprint 1,816 2.5 5,005 60% 3,003 743
Cardboard 1,338 3.0 4,425 60% 2,655 657
Commingled materials 2,112 na na 60% na na
Plastics (10.5 percent of commingled) 222 2.0 489 60% 293 73
Aluminum (6.5 percent of commingled) 137 15.7 2,376 60% 1,425 353
Glass (65 percent of commingled) 1,373 0.4 605 60% 363 90
Steel (18 percent of commingled) 380 2.3 964 60% 578 143
Total Landfill recycling savings 5,502 na 15,268 60% 9,161 2,268
Note: This savings estimate is generic and does not necessarily reflect local collection or disposal energy expenditures vs savings.
Note: Emissions from diesel fuel used by waste and recycled materials haulers are included in the transportation worksheets as a percentage of “3-axle trucks”.
Future inventorists must update electricity and diesel fuel
purchased by the Pitkin County Landfill, update recovered
materials flows, and check commingled materials by weight. The
estimate of methane generation and/or our estimated fraction
emitted to the atmosphere must also be checked.
County Landfill

Landfill2007.xls
F13Cell:
Rick Heede (2005):Comment:
See note under Fugitive methane, in which we allocate a fraction of estimated methane generation as emissions through the landfill’s topsoil as fugitive methane emitted to the atmosphere.
Jan09 update: CMS adopts the IPCC Fourth Assessment Report’s revised GWP factor for methane, up from 23xCO2 to 25xCO2 (one hundred year time horizon).
G13Cell:
Heede (Feb09):Comment:
Energy Information Administration (2008) Emissions of Greenhouse Gases in the United States 2007. GWP, methodolgoy, p 12: Methane. In its Fourth Assessment Report, the IPCC developed revised global warming potential factors
(GWPs) for selected gases. The GWP for methane was revised from the previous value of 23 in the IPCC’s Third Assessment Report to 25 in the Fourth Assessment Report. The revised GWP for methane is used in this report. In
addition, this report incorporates an increase in the density of methane from 42.28 to 42.37 pounds per thousand cubic feet, in order to provide consistent temperature and pressure values for methane in all EIA data.
H13Cell:
Rick Heede:Comment:
Approximately 50 percent of the Landfill waste is generated in Aspen. The other 50 percent is from Basalt and upstream from Basalt in Ptikin County. Estimate from Hoofnagle, personal communication, 19Jul05.
B15Cell:
Rick Heede:Comment:
Fuel and electricity consumption in 2004 from Chris Hoofnagle, Solid Waste Manager, personal communication, 17Aug05. Tel. 923-3487, [email protected].
B16Cell:
Heede (Sep08):Comment:
Marta Darby updated to 2007 electricity consumption. CMS updated to 2007 electricity carbon factor.
Rick Heede (2005):
Hoofnagle: 110,476 kWh in 2004; 50,700 kWh of which is used in recycling operations (balers, crushers, lighting, etc).
B17Cell:
Marta Darby (Sep08):Comment:
Data from Chris Hoofnagle:
5953 gallons of diesel
873 gallons of unleaded
Chris Hoofnagle refered me to James Gilliam with the county Fleet Department [429-5765].
Rick Heede:
4,849 gallons of diesel fuel consumed in 2004 by the Landfill’s compliment of ~dozen loaders, dozers, trucks, graders, and excavators.
B18Cell:
Marta Darby:Comment:
Data from Chris Hoofnagle:
5953 gallons of diesel
873 gallons of unleaded
Chris Hoofnagle refered me to James Gilliam with the county Fleet Department [429-5765].
Rick Heede:
4,849 gallons of diesel fuel consumed in 2004 by the Landfill’s compliment of ~dozen loaders, dozers, trucks, graders, and excavators.
B19Cell:
Heede (Feb09):Comment:
CMS adopts the findings of the Golder Associates report (2007), averaging the high and low estimates of total methane emitted (1,023 to 1,440 tonnes CH4 in 2007), or average of 1,357 (short) tons CH4. CMS also adopts the
IPCC FAR GWP value of methane at 25xCO2. See cell notes to Tables 1 and 2.
Marta Darby:
Hoofnagle (9/3/08): Methane rate likely has not change appreciably in the three years since the estimate.
County Landfill

Landfill2007.xls
Rick Heede:
Methane generation is roughly 150 cubic feet per minute. Hoofnagle, personal communication, 17Aug05: “An estimate of current methane generation rate would be on the order of 150 cubic feet per minute (cfm) for the Pitkin
County Landfill. This estimate is based on design capacity of 2.24 million megagrams, and refuse disposed from 1999 through 2002. This is a very rough estimate.”
150 cfm times 60 x 24 x 365 = 78.84 million cubic feet (Mcf); 1 cf of methane equals 0.04228 lb: thus 78.84 Mcf x 0.04228 lb/cf = 1.6666776 short tons of methane. We assume that 60 percent (1,000 short tons) of this
amount of generated methane is released to the atmosphere annually.
Note: This estimate may be too high for a small landfill in a dry/high altitude climate. Verify with Hoofnagle and other sources.
Methane conversion (lb/cf): U.S. Dept of Energy (2005) Voluntary Reporting of Greenhouse Gases (1605b) Program: Draft Technical Guidelines, DOE Office of Policy and International Affairs, p. 105. (Note: this conversion factor was
off by a factor of 10 too high (said 0.418 lb/cf instead of 0.04228 lb/cf); called VRGG technical staff at 800-803-5182 to correct their draft guidelines.
Note 2: We have not estimated fugitive methane from the Landfill’s receipt of about 10 yards (one truck load) of biosolids from the Aspen Wastewater Treatment Plant every ~3 days. Hoofnagle data: 3.9 million lb of biosolids from
the WTF in 2004. This equals 1,771 metric tonnes. If two percent of this mass is converted to methane = 35.42 tonnes of CH4, times 23 x CO2 = 814.7 tonnes CO2-equivalent.
Note 3: Dr Jean Bogner, Landfill +, Inc (Wheaton, IL) points out that the Pitkin methane generation estimate is probably derived with the EPA LandGEM model and estimation software. As such, it probably over-estimates generation
rates (does not account for chemical interactions, soil oxidation rates, microbial processes). She cannot refine the Pitkin Landfill estimate without carefully evaluating local conditions, landfill content, additions over several years,
decomposition rates, etc. As a precautionary adjustment, CMS reduces the Pitkin estimate by fifty percent (of that allocated to the CIty of Aspen).
B24Cell:
Marta Darby (Sep08):Comment:
The landfill received a total of 2200 tons of biosolids in 2007. “Aspen Consolidated Sanitation District provides the lions share, although we also receive from Basalt and Mid-Vally Metro. I’d put ACSD at 75% of the total 2200 tons,
or 1650” -- Email from Chris Hoofnagle [Aug. 28, 2008]
Rick Heede (2005):
The landfill received a total of 1,953 tons of biosolids from the Aspen Sanitation Wastewater Treatment plant (about 3-4 truck loads per week). We assume in this preliminary estimate that 2 percent is released as methane gas
during its storage and curing period prior to being mixed in with composted wastes, chipped wood fiber, and other soils and sold as various grades of topsoil and compost.
Biosolids delivery data from Chirs Hoofnagle, Solid Waste Manager, Aug05.
This calculation does not estimate the methane emissions that would result from anaerobic digestion of the biosolids in the landfill, that is, if buried.
F29Cell:
Rick Heede:Comment:
Golder Associates (2007) Landfill Gas Evaluation of the Pitkin County Solid Waste Center, Lakewood CO, 41 pp., Table 1.
Golder estimates that between 1,907 and 3,356 tonnes of methane is recoverable (2007), rising to 2,562 to 4,161 tonnes per year at peak in 2021. At $20 per tonne carbon credit, this recovery is worth $128,000 - $245,000
(2007), rising to $171,000 - $ $303,000 in 2021.
C38Cell:
Rick Heede:Comment:
Data updated to 2007 by Marta Darby.
Original data from Hoofnagle to Darby, 2Sep08:
Recycling Tons in 2007
cardboard 1,475 = 1,338 tonnes, etc
newsprint 2,002
office pac 260
co-mingled containers 2,328
carpet pad no data
mixed paper no data
TOTAL 6,065 = 5,502 tonnes.
D38Cell:
Rick Heede:Comment:
County Landfill

Landfill2007.xls
Waste, Recycling, and Climate Change Frank Ackerman, Director or the Research and Policy Division of GDAE, Tufts University, Medford MA, USA. See www.tufts.edu/tuftsrecycles/energy.htm
Abstract: Waste management has at least five types of impacts on climate change, attributable to (1) landfill methane emissions, (2) reduction in industrial energy use and emissions due to recycling and waste reduction, (3) energy
recovery from waste, (4) carbon sequestration in forests due to decreased demand for virgin paper, and (5) energy used in long-distance transport of waste. A recent U.S. EPA study provides estimates of overall per-ton greenhouse
gas reductions due to recycling. Calculations using these estimates suggest that the U.S. could realize substantial greenhouse gas reductions through increased recycling, particularly of paper.
G38Cell:
Rick Heede:Comment:
We allocate 50 percent of the savings from recycled materials to Aspen.
B44Cell:
Heede (Nov08:Comment:
Hoofnagle, Aug08 to Darby, re: breakdown of commingled materials: “I’d say off the top of my head that half the total tonnage is glass. Of the other half, probably half of that is in the aluminum and tin cans. The truth is we don’t
really know that one.” But seemed to agree with the 2004 materials composition in an email 3Sep08: “I think that the recycling breakdown is roughly the same as these numbers.” Consequently, CMS uses the 10.5 percent for
plastics. 6.5 percent aluminum, 65 percent glass, and 18 percent steel used in 2004.
Rick Heede:
Commingled recycled materials sold in 2004: 1,174.7 metric tonnes (2.590 million lb). Data from Hoofnagle, 17Aug05.
Chris Hoofnagle estimated commingled fractions as follows: “Ratios of the commingle pile are probably more like 65% glass, 18% steel, 8% plastic, and 4% aluminum; by weight.” (28Sep05)
B45Cell:
Rick Heede:Comment:
Ackerman (see ref above) estimates savings for HDPE as 1.5 tonne CO2-eq saved per tonne recycled, LDPE as 2.0 tonne CO2-eq saved per tonne recycled, and PET as 2.5 tonne CO2-eq saved per tonne recycled. We average to 2.0
tonne CO2-eq saved per tonne recycled.
B46Cell:
Rick Heede:Comment:
The aluminum recycling rate in Aspen is ~11.2 lb/cap-yr (76 tonnes/yr in commingled recyclables divided by Aspen’s population within the UGB of 8,993 = 5.1 kg/cap-yr). This compares favorably to Seattle (4.1 kg/cap-yr), Bergen
County 6.8 kg/cap-yr) and the U.S. average (3.5 kg/cap-yr); 1996 data from EPA/Ackerman; www.tufts.edu/tuftsrecycles/energy.htm, Table 2.
B47Cell:
Rick Heede:Comment:
Aspen’s glass recycling rate is low compared to Waiheke Island (off Auckland, NZ) whose 8,000 permanent residents recycle 100 tonnes per month vs Aspen’s 8,993 residents (residents within city limits plus within Aspen’s Urban
Growth Boundary) who recycle 763 tonnes in 2004, 60 percent of which is attributed to Aspen UGB. Waiheke Island residents thus recycle 150 kg of glass per capita vs Aspen’s residents 51 kg per year.
Aspen’s glass recycling rate compares better to Seattle (25 kg/cap-yr), Bergen County (26 kg/cap-yr) and the U.S. average (11 kg/cap-yr); 1996 data from EPA/Ackerman; www.tufts.edu/tuftsrecycles/energy.htm, Table 2.
County Landfill

Fertilizers N2O
1
2
3
4
5
6
7
8
9
10
11
12
13
14
15
16
17
18
19
20
21
22
23
24
25
26
27
28
29
30
31
32
33
34
35
36
37
38
39
40
41
42
43
44
45
46
A B C D E F G H I J K
Aspen Emissions Inventory: Nitrous Oxide SourcesRichard Heede
Climate Mitigation Services Data provided by
Snowmass, Colorado Maroon Creek Club Superintendent
File Started 11 August 2005 544-1666, Steve
Last Modified: 29 November 2008
City of Aspen Parks and Golf Depts
Steve Aiken, Aspen Golf Course, 920-5719
Brian Flynn, Aspen Parks Dept.
Table 1: Nitrous oxide emissionsNitrogen in
fertilizer appliedDirect N2O
Indirect N2O
(volatilized)
Indirect N2O (run-
off & leaching)
Total Nitrous
Oxide
Carbon dioxide-
equivalent
emissions
Carbon-equivalent
emissions
kg Nitrogen/yr kg N2O kg N2O kg N2O kg N2O sh tons CO2-eq tonnes C-eq
296 x CO2
Maroon Creek Club (organic) 3,458 55.32 11.06 41.49 107.9 35.2 8.7
City of Aspen Golf Course 4,051 64.82 12.96 48.61 126.4 41.2 10.2
City of Aspen Parks 1,502 24.03 4.81 18.02 46.9 15.3 3.8
City of Aspen athletic fields 2,687 42.99 8.60 32.25 83.8 27.4 6.8
Private greenspace within City limits 15,078 241.25 48.25 180.94 470.4 153.5 38.0
Private greenspace within Urban Growth Boundary 6,883 110.13 22.03 82.60 214.7 70.1 17.3
Total Nitrous Oxide Emissions 33,659 539 108 404 1,050 343 85
Table 2: Organic fertilizer application:kg N variable fixed factor kg N2O
Direct: 1,000 0.8 0.020 16
Indirect (volat.) 1,000 0.2 0.016 3
Indirect (leach) 1,000 0.3 0.040 12
Total N2O emissions for a 1,000 kg N application (example): 31.2
Table 3: Synthetic fertilizer application:Direct emission calculation: kg N variable fixed factor kg N2O
Direct N2O emissions = N applied (kg N) * fractiondirect * 0.02 kg N2O /kg N Direct: 1,000 0.9 0.020 18
Indirect emission calculation: Indirect (volat.) 1,000 0.1 0.016 2
Volatilization N2O = N applied (kg N) * fractionvolatilized * 0.016 kg N2O /kg N Indirect (leach) 1,000 0.3 0.040 12
Run-off/leaching N2O = N applied (kg N) * fractionrunoff * 0.04 kg N2O /kg N Total N2O emissions for a 1,000 kg N application (example): 31.6
Table 1.H.16. Fractions by nitrogen source fraction-direct fraction-volatilized fraction-runoff
Synthetic commercial fertilizers 0.9 0.1 0.3
Organic commercial fertilizers and manure 0.8 0.2 0.3
Update data on fertilizer applications rates at the City
and Maroon Creek Clubs, city parks, city athletic fields,
and privately-owned greenspace.
Fertilizers2007.xls

Fertilizers N2O
D13Cell:
Rick Heede:Comment:
Direct emission calculation: Direct N2O emissions (kg N2O) = N applied (kg N) * fraction(direct) * 0.02 kg N2O /kg N
U.S. Dept of Energy (2005) Voluntary Reporting of Greenhouse Gases (1605b) Program: Draft Technical Guidelines, DOE Office of Policy and International Affairs, pp. 191-92.
E13Cell:
Rick Heede:Comment:
Indirect emission calculation: Volatilization N2O (kg N2O) = N applied (kg N) * fraction(volatilized) * 0.016 kg N2O /kg N.
U.S. Dept of Energy (2005) Voluntary Reporting of Greenhouse Gases (1605b) Program: Draft Technical Guidelines, DOE Office of Policy and International Affairs, pp. 191-92.
F13Cell:
Rick Heede:Comment:
Indirect emission calculation: Run-off/leaching N2O (kg N2O) = N applied (kg N) * fraction(runoff) * 0.04 kg N2O /kg N
U.S. Dept of Energy (2005) Voluntary Reporting of Greenhouse Gases (1605b) Program: Draft Technical Guidelines, DOE Office of Policy and International Affairs, pp. 191-92.
H13Cell:
Rick Heede:Comment:
The Global Warming Potential (GWP) of nitrous oxide is 296 times that of carbon dioxide over a 100-year time horizon. IPCC (2001) Climate Change 2001: The Scientific Basis, Table 6.7, p. 388.
B16Cell:
Rick Heede (17Nov08):Comment:
CMS uses the formula ((70*43560*2.5/1000)/2.2046) to calculate kg of nitrogen from application of 1 + 1.5 lb N per 1,000 sf per year over 70 acres. We do not have area data on greens and tees (application rate of 2 to 3 lb N
per 1,000 sf). and CMS assumes the same 2.5 lb application rate on all 70 acres.
Lauren McDonell (Nov08):
Steve (Maroon Club superintendent) reported that 1.5lbs N/1,000 sq. ft. polybased fertilizer is applied to roughs & fairways in Spring, 1lb N w/ ammonium sulfate/ 1,000 sq. ft in Fall. For greens and tees, approximately 2-3 lbs N is
applied annually. For both, combinations of organic and synthetics and slow and quick release fertilizers are used.
___________
Rick Heede (2005):
Maroon Creek Club uses organic fertilizer applied at a rate of 2.25 to 2.5 lb per 1,000 sq.ft. MCC has 70 acres (@43,560 sq.ft/ac), thus 6,861 to 7,623 lb Nitrogen, which converts to an average of 3,285 kg N.
B17Cell:
Rick Heede (29Nov08):Comment:
Lauren McDonell update:
Greens - 700 lbs quick release 13313 analysis fertilizer, ammonium nitrate and sulfate of potash. Two additional applications of 375 lbs of potash on greens.
Greens: 700 lbs of 13-3-13 equals 91 lbs (41.28 kg) of nitrogen
Fairways, roughs, tees - May 22, 2008 5 tons of 4200 analysis fertilizer - 1/2 urea and 1/2 IBDU (slow release). Aug. 7, 2008 9 tons of 29019 analysis fertilizer, 1/2 urea, 1/2 nitroform, sulfate of potash. Fairways roughs and tees:
10,000lbs 42-0-0 equals 4,200 lbs (1905.09 kg) nitrogen PLUS Fairways roughs and tees: 16,000lbs 29-0-19 equals 4,640 lbs(2104.67 kg) nitrogen
Total Nitrogen in kg for Aspen Golf Course = 4051.04 kg N.
Lauren McDonell (Nov08):
Data from Steve Aiken, Aspen Golf Course, Nov., 5, 2008 (extension 5719).
Greens - 700 lbs quick release 13-3-13 analysis fertilizer, ammonium nitrate and sulfate of potash. Two additional applications of 375 lbs of potash on greens.
Fairways, roughs, tees - May 22, 2008 5 tons of 42-0-0 analysis fertilizer - 1/2 urea and 1/2 IBDU (slow release). 7Aug08: 9 tons of 29-0-19 analysis fertilizer, 1/2 urea, 1/2 nitroform, sulfate of potash.
__________________
Rick Heede (2005):
Data from Aspen Parks and Golf Depts via Lee Cassin, 4Oct05. Original data for golf course: 359 lb on tees, 9,980 lb on fairways + roughs + clubhouse grounds, and 437 lb on greens = 10,776 lb of nitrogen applied = 4,888 kg N.
B18Cell:
Rick Heede (29Nov08):Comment:
Lauren got acreage: 38 acres of City parks, plus 34 acres of sports fields. Verify that parks get 2 lb Nitrogen per 1,000 sf (rather than per acre [very low]) and playing fields get 4 lb N per 1,000 sf. This calculation for Aspen parks
Fertilizers2007.xls

Fertilizers N2O
is: 38 acres * 43,560 sf/ac * 2 lb N/1,000 sf = 3,311 lb N, divided by 2.2046 lb/kg = 1,502 kg N.
Lauren McDonell (Nov08):
I checked with Brian Flynn and fertlizer data for City of Aspen parks is:
For Aspen Parks: coated, time-release organic fertilizer: 2 lbs N, 0.5 lbs P, 1.25 lbs K, and inert material this year.
For Aspen playing sports fields: time release, organic fertilizer, 4 lbs N, 1 lb P, 3.5 lbs K, and inert material this year.
___________________________
Rick Heede (2005):
Data from Aspen Parks and Golf Depts via Lee Cassin, 4Oct05. Original data varies by year, but in 2004 1,081lb in neighborhood parks, 2,700 lb on athletic fields, and 200 lb for landscaping and trees = total of 3,981 lb = 1,806 kg
N.
City application in 1998 = 2,762 lb, 2000 = 2,962 lb, 2002 = 3,281 lb N.
Note: these estimates are not measured application but recommended application rate by type of area times area.
B19Cell:
Rick Heede (29Nov08):Comment:
See cell note above: 34 acres of sports & playing fields get 4 lb N per 1,000 sf. This calculation for Aspen playing fields is: 34 acres * 43,560 sf/ac * 4 lb N/1,000 sf = 5,924 lb N, divided by 2.2046 lb/kg = 2,687 kg N.
B20Cell:
Lauren McDonell (Nov08): Comment:
I checked with Bridget Kelly and land areas changed slightly in 2007. Greenspace within City of Aspen is now 2,545 acres.
If all else stays the same, the new calclulation should be: 2,545 times 0.75 times 0.33 = 630acres (@43,560 sq. ft.) = 27.4 million sq.ft. with 1.2 lb N per 1,000 sq. ft. = 32,925 lb N = 14,935 kg N.
______________
Rick Heede:
We do not have purchase or application date for private yards and commercial properties by owners or contractors, and we (conservatively) assume the following:
That the City of Aspen’s 2,544 acres is 75 percent privately-owned with one-half the application rate of city parks and fields (1.2 rather than ~2.4 lb per 1,000 sq.ft.) on the one-third of privately-owned land that we assume is
fertilized greenspace: 2,544 acres times 0.75 times 0.33 = 636 acres (@43,560 sq.ft.) = 27.7 million sq.ft. with 1.2 lb N per 1,000 sq.ft. = 33,242 lb N = 15,078 kg N.
B21Cell:
Lauren McDonell: Comment:
I checked with Bridget Kelly and land areas have changed slightly for 2007. Land within city limits (2,545) minus land within UGB (4,867) equals 2,322.
If all else stays the same, the new calculations: 2,322 acres times 0.75 times 0.1667 = 290.3 acres (@43,560 sq.ft.) = 12.65 million sq.ft with 1.2 lb N per 1,000 sq.ft = 15,174 lb N = 6,883 kg N
_________________
Rick Heede:
Land within city limits totals 2,544 acres and land within the Urban Growth Boundary totals 4,868 acres. We apply half the application rate of the low rate used within city limits to the additional UGB acreage of 2,324 acres:
That the UGB area outside city limits of 2,324 acres is 75 percent privately-owned with one-half the application rate of city parks and fields (1.2 rather than ~2.4 lb per 1,000 sq.ft.) on the one-sixth of privately-owned land that we
assume is fertilized greenspace: 2,324 acres times 0.75 times 0.1667 = 290.5 acres (@43,560 sq.ft.) = 12.65 million sq.ft. with 1.2 lb N per 1,000 sq.ft. = 15,185 lb N = 6,888 kg N.
UGB area data from Bridgette Kelly, City of Aspen Pitkin County GIS and Mapping Dept., personal communication, 4Oct05.
E26Cell:
Rick Heede:Comment:
These tables are taken from U.S. Dept of Energy (2005) Voluntary Reporting of Greenhouse Gases (1605b) Program: Draft Technical Guidelines, DOE Office of Policy and International Affairs, pp. 191-92.
The DOE/EIA methodology is generally consistent with the IPCC Guidelines and the US EPA’s Annex 3: Methdological Descriptions for Additional Source or Sink Categories (Annex 3 to EPA’s (2005) Inventory of U.S. Greenhouse Gas
Emissions and Sinks, 1990-2003), yosemite.epa.gov/oar/globalwarming.nsf/content/ResourceCenterPublicationsGHGEmissionsUSEmissionsInventory2005.html
Fertilizers2007.xls


