Embed Size (px)
Citation preview
Coal Ash- Understanding a
Valuable CommodityNCC Annual Fall Meeting
October 4-5, 2016
Milwaukee, WI
RCRA 1976 – Energy Goal & Objective• RCRA -42 U.S. Code § 6902 - Objectives and national policy
• Objective “The objectives of this chapter are to promote the protection of health and the environment and to conserve valuable material and energy resources by”… “providing technical and financial assistance to State and local governments and interstate agencies for the development of solid waste management plans (including resource recovery and resource conservation systems) which will promote improved solid waste management techniques (including more effective organizational arrangements), new and improved methods of collection, separation, and recovery of solid waste, and the environmentally safe disposal of non-recoverable residues;”
• “The Congress finds with respect to materials, that ...millions of tons of recoverable material which could be used are needlessly buried each year” and that “the recovery and conservation of such materials can reduce the dependence of the United States on foreign resources and reduce the deficit in its balance of payments.”
CCP Resource Recovery• Coal Ash History Meets The Goal of RCRA- Best
Resource Recovery Story - “Untold”
• 2014 Data - 129.7M Ton Produced; 62.4M Ton Utilized – 48%
• Resource Produced For Construction – Sand & Gravel - 914 Million Ton (up 7.5%%)
– Cement - 89.1 Million Ton (up 9.1%)
– Gypsum - 33.7 Million Ton (up 4.7%)
– CCPs - 129.7 Million Ton (up 13% due to Scrubbers)
• Strategic Material Resource Value- REE
CCR Resource Impacts
• Regulatory Climate & E&P Tech
Have Rapidly Changed The CCR
Resource Markets
• Focus Today Is On Regulatory Impacts– MATS, MACT, CCR, ELG, CPP Etc.
– 2015 & 2016 Hard Hit Years On Plant Closings
– 60 GW Reduction By EOY 2016
– 19.6 GW Announced For Shutdown by 2025
– Compliance Costs & Methods Indirectly Reduce Ash Quality & Resource Recovery
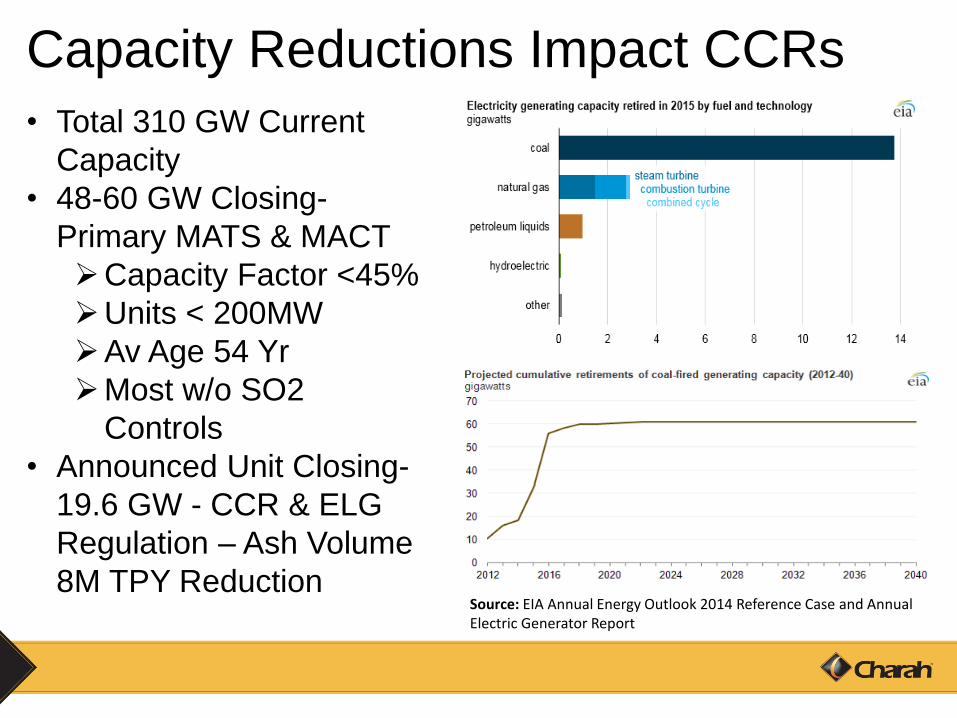
Capacity Reductions Impact CCRs
Source: EIA Annual Energy Outlook 2014 Reference Case and Annual Electric Generator Report
• Total 310 GW Current
Capacity
• 48-60 GW Closing-
Primary MATS & MACT
Capacity Factor <45%
Units < 200MW
Av Age 54 Yr
Most w/o SO2
Controls
• Announced Unit Closing-
19.6 GW - CCR & ELG
Regulation – Ash Volume
8M TPY Reduction
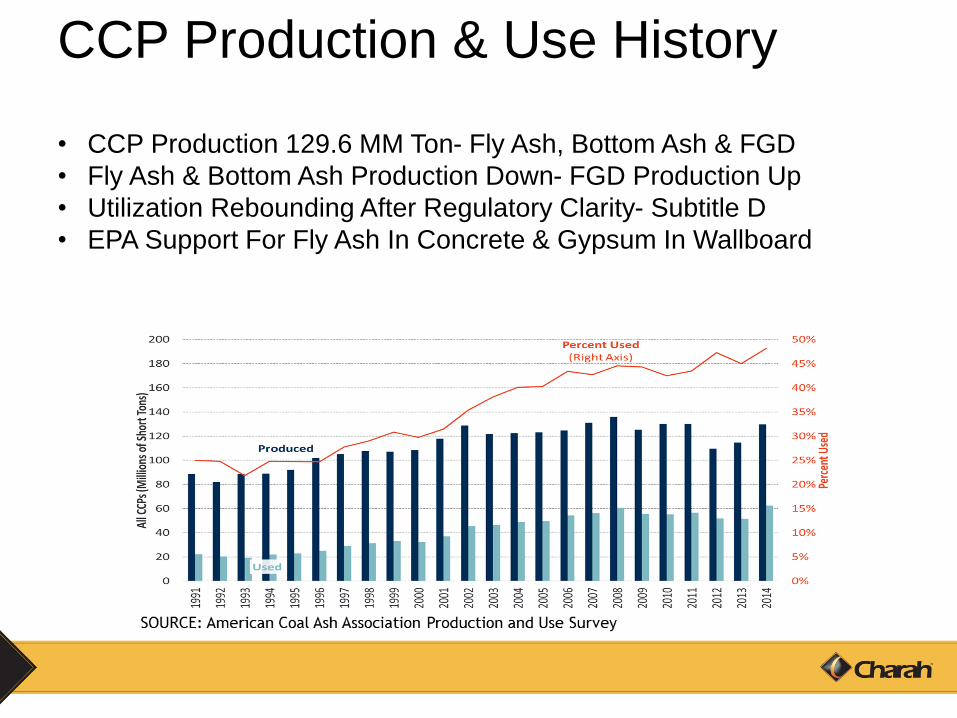
CCP Production & Use History
• CCP Production 129.6 MM Ton- Fly Ash, Bottom Ash & FGD
• Fly Ash & Bottom Ash Production Down- FGD Production Up
• Utilization Rebounding After Regulatory Clarity- Subtitle D
• EPA Support For Fly Ash In Concrete & Gypsum In Wallboard
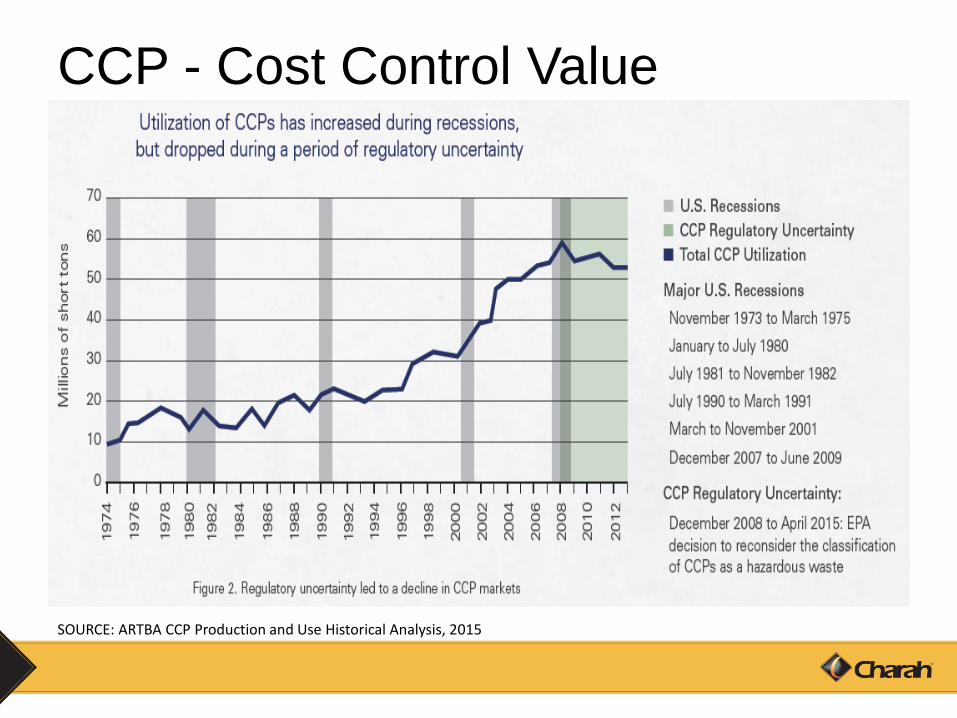
CCP - Cost Control Value
SOURCE: ARTBA CCP Production and Use Historical Analysis, 2015
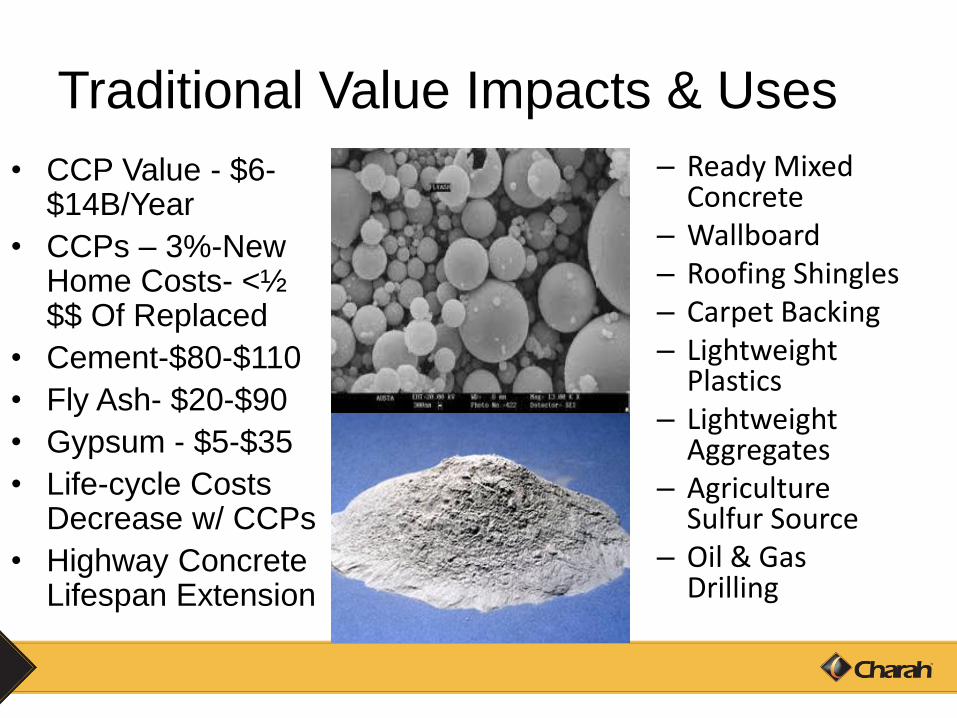
Traditional Value Impacts & Uses
• CCP Value - $6-$14B/Year
• CCPs – 3%-New Home Costs- <½ $$ Of Replaced
• Cement-$80-$110
• Fly Ash- $20-$90
• Gypsum - $5-$35
• Life-cycle Costs Decrease w/ CCPs
• Highway Concrete Lifespan Extension
– Ready Mixed Concrete
– Wallboard– Roofing Shingles– Carpet Backing– Lightweight
Plastics– Lightweight
Aggregates– Agriculture
Sulfur Source– Oil & Gas
Drilling
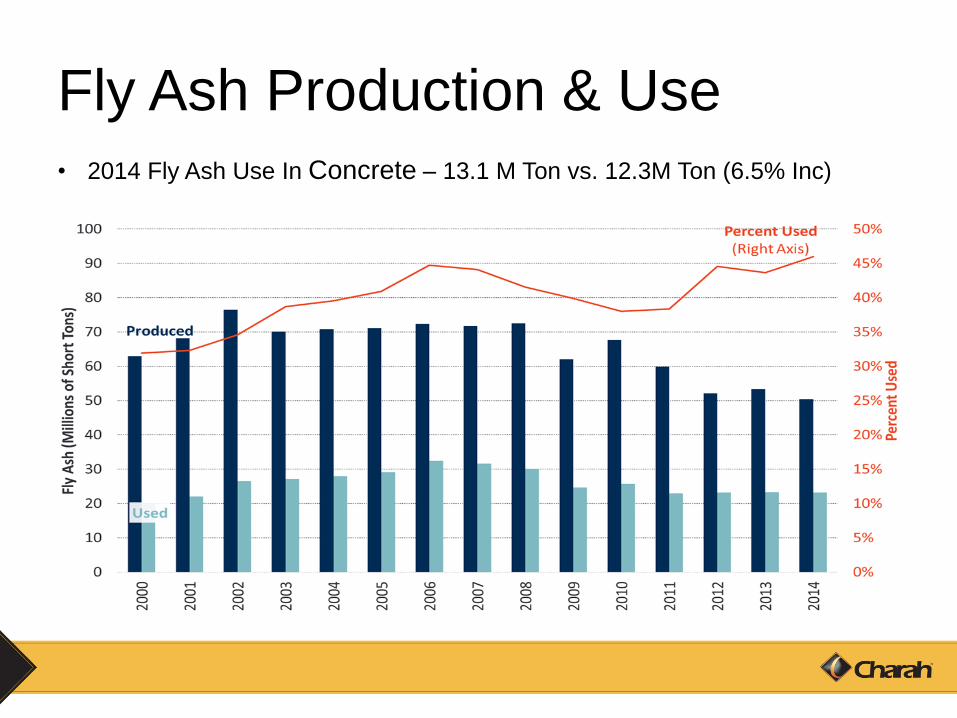
Fly Ash Production & Use• 2014 Fly Ash Use In Concrete – 13.1 M Ton vs. 12.3M Ton (6.5% Inc)
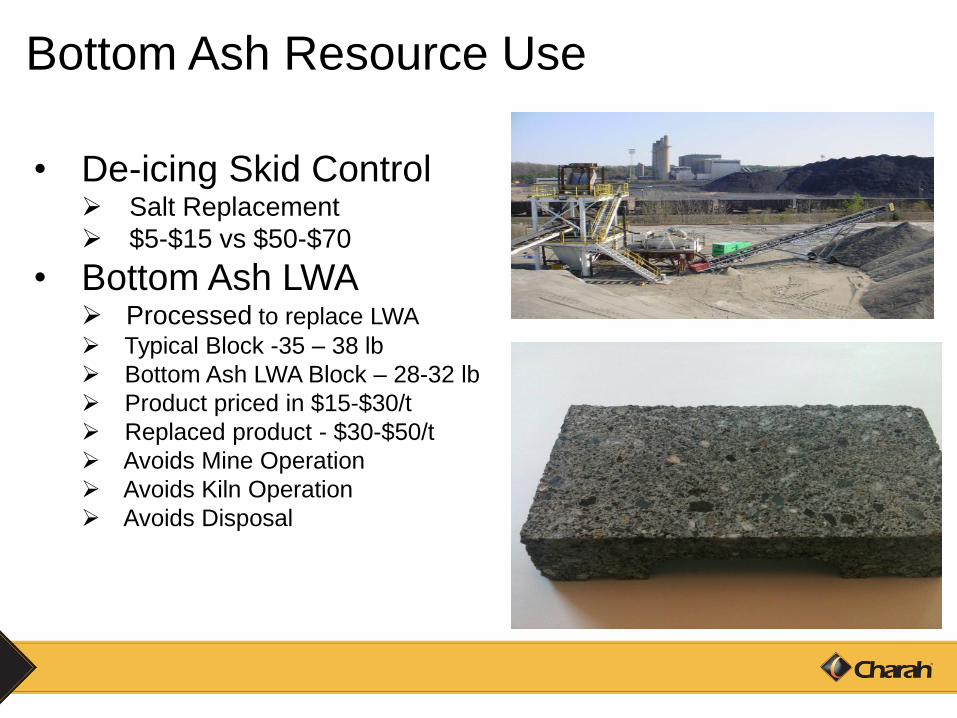
Bottom Ash Resource Use
• De-icing Skid Control Salt Replacement
$5-$15 vs $50-$70
• Bottom Ash LWA Processed to replace LWA
Typical Block -35 – 38 lb
Bottom Ash LWA Block – 28-32 lb
Product priced in $15-$30/t
Replaced product - $30-$50/t
Avoids Mine Operation
Avoids Kiln Operation
Avoids Disposal
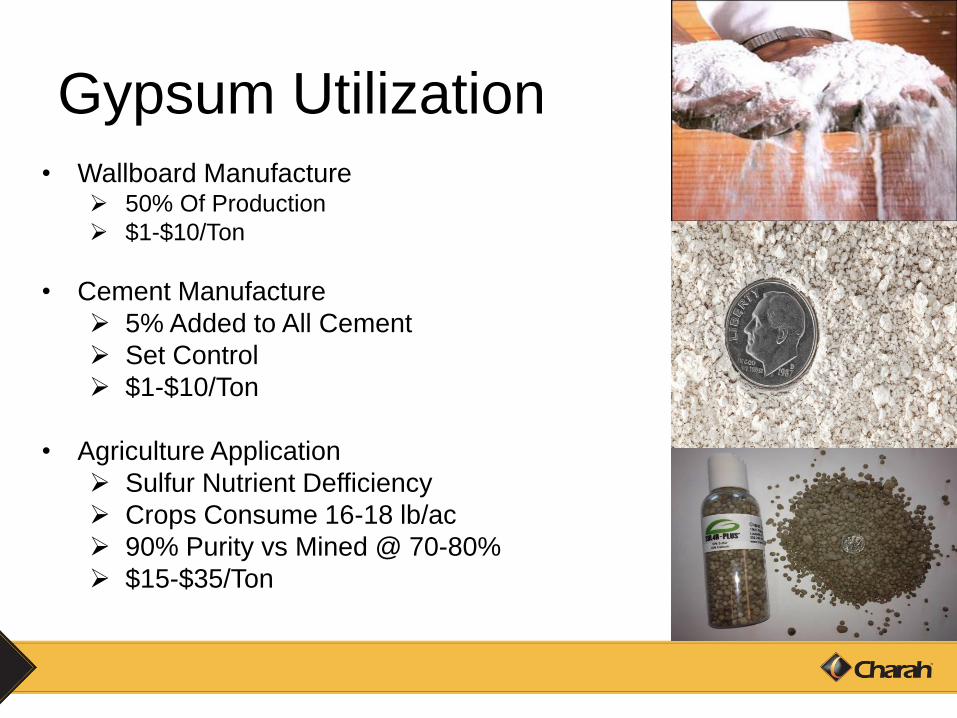
Gypsum Utilization• Wallboard Manufacture
50% Of Production
$1-$10/Ton
• Cement Manufacture
5% Added to All Cement
Set Control
$1-$10/Ton
• Agriculture Application
Sulfur Nutrient Defficiency
Crops Consume 16-18 lb/ac
90% Purity vs Mined @ 70-80%
$15-$35/Ton
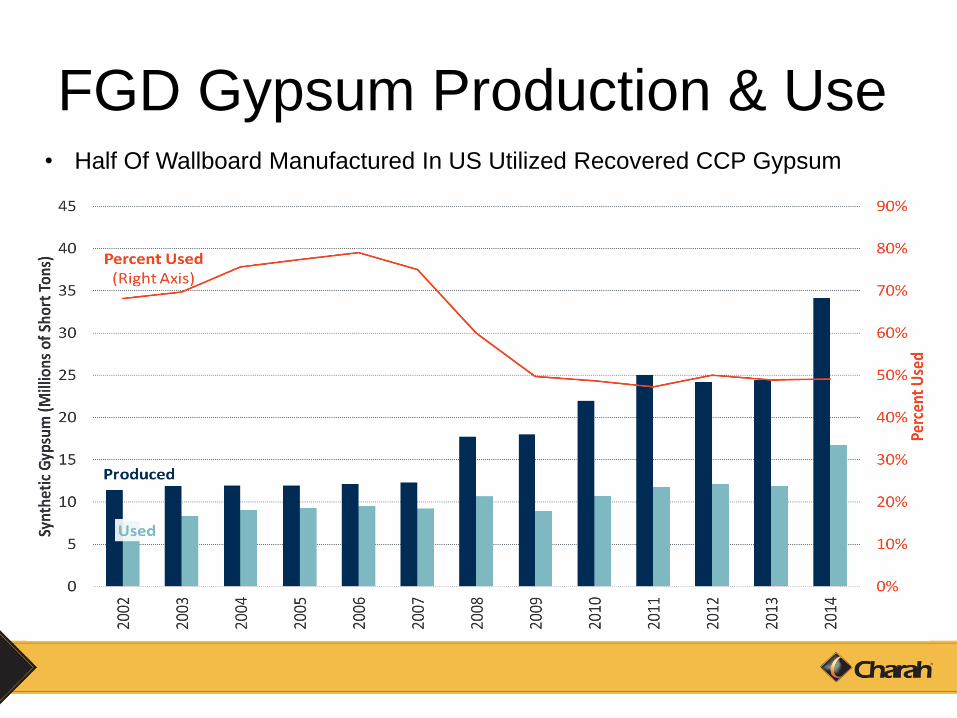
FGD Gypsum Production & Use• Half Of Wallboard Manufactured In US Utilized Recovered CCP Gypsum
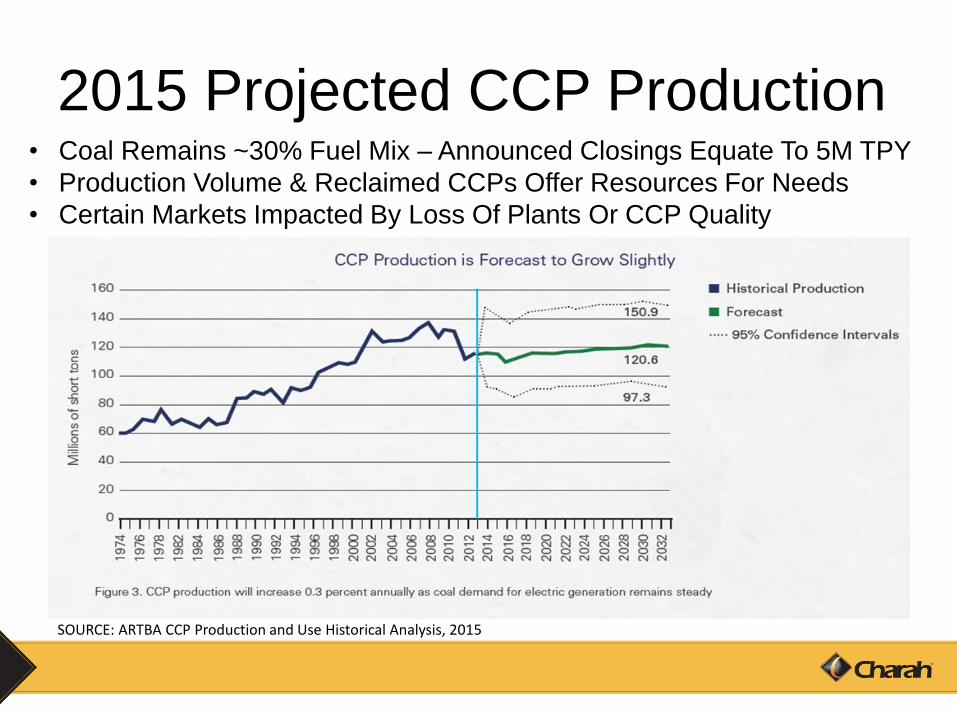
2015 Projected CCP Production
SOURCE: ARTBA CCP Production and Use Historical Analysis, 2015
• Coal Remains ~30% Fuel Mix – Announced Closings Equate To 5M TPY
• Production Volume & Reclaimed CCPs Offer Resources For Needs
• Certain Markets Impacted By Loss Of Plants Or CCP Quality
Future Resource Applications• Beneficiated Ash – Traditional Construction Markets
• Strategic Resource Applications-REE
– REE Demand Within Green Energy & Technology Applications Continues
– China Supplies 80%+ Of World Supply
– Supply Concentration Has Caused Political Related Price Volatility- China 2010 Restrictions On Exports Caused Wild Increases Followed By Innovation And Price Collapse By 2012 – Honda 2016 – Magnets w/o REE @ 10% Cheaper & 8% Lighter
– Long Term-Higher Demand – Supply Concentration Needs Solution- CCRs May Be One Option
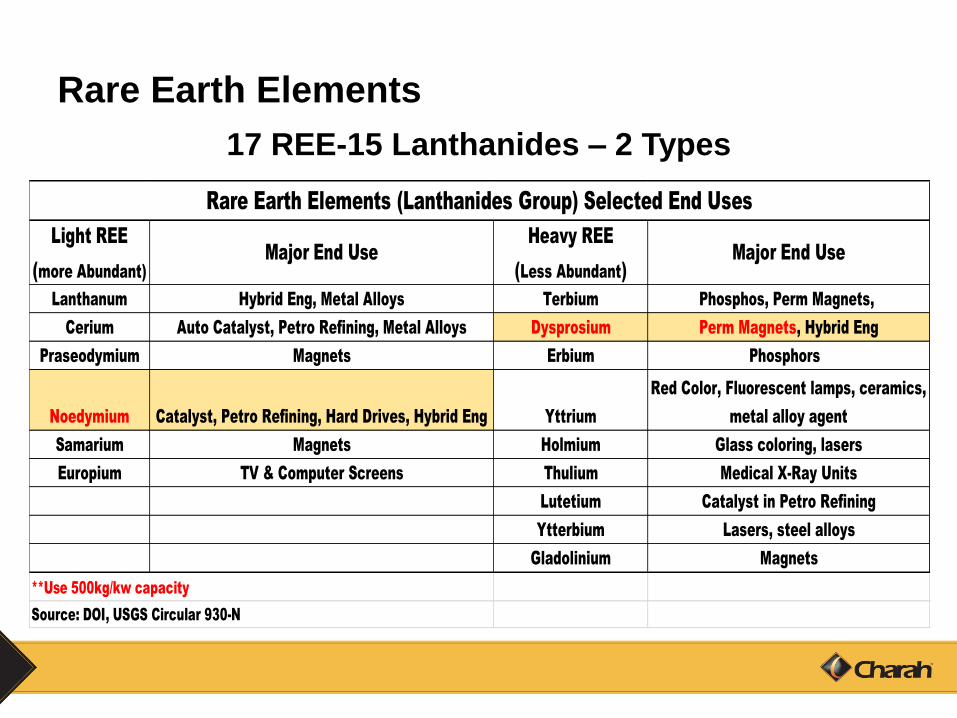
Rare Earth Elements
17 REE-15 Lanthanides – 2 Types
Light REE
(more Abundant)
Major End Use
Heavy REE
(Less Abundant)
Major End Use
Lanthanum Hybrid Eng, Metal Alloys Terbium Phosphos, Perm Magnets,
Cerium Auto Catalyst, Petro Refining, Metal Alloys Dysprosium Perm Magnets, Hybrid Eng
Praseodymium Magnets Erbium Phosphors
Noedymium Catalyst, Petro Refining, Hard Drives, Hybrid Eng Yttrium
Red Color, Fluorescent lamps, ceramics,
metal alloy agent
Samarium Magnets Holmium Glass coloring, lasers
Europium TV & Computer Screens Thulium Medical X-Ray Units
Lutetium Catalyst in Petro Refining
Ytterbium Lasers, steel alloys
Gladolinium Magnets
**Use 500kg/kw capacity
Source: DOI, USGS Circular 930-N
Rare Earth Elements (Lanthanides Group) Selected End Uses
REE – Strategic-Political & Regulatory Risk
– DOE Research - Currently 10 Phase I Projects – 6
Bench Scale & 4 Pilot; Goal 4 Projects Advance
– Enriched REE Concentrations In Ash & Coals- 2X To
4X Crustal; Approach 60% Of Commercial Deposits
(1,000 mg/kg)
– Access To Reserves Required For Both Traditional &
Future Uses
– Policies & Regulations Must Provide Pathway To
Access
– Regulatory Constraints On Access Need Alignment
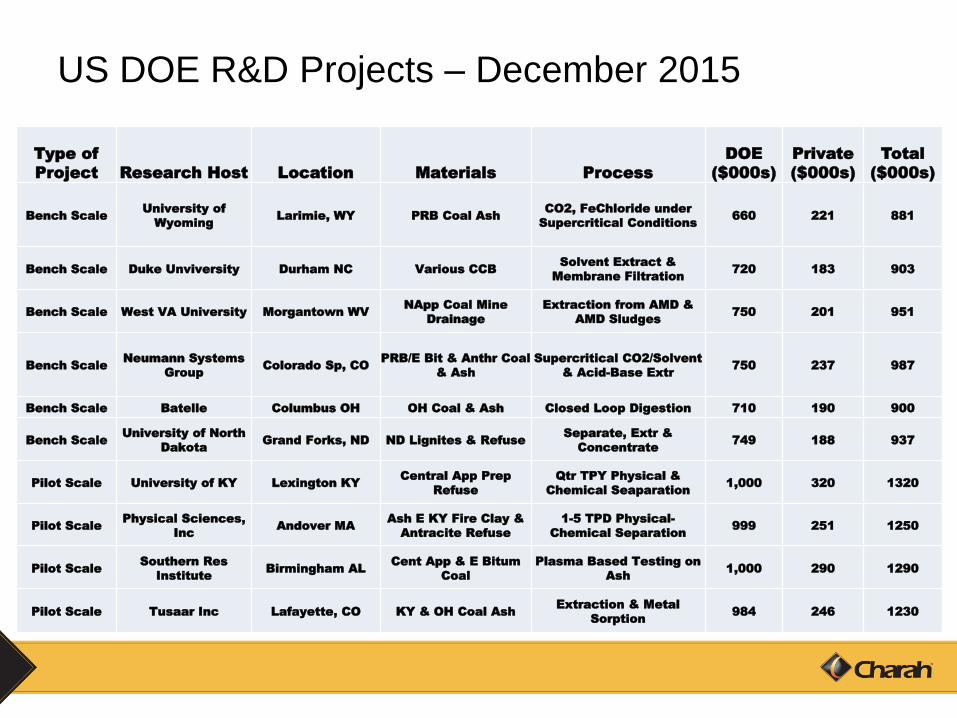
US DOE R&D Projects – December 2015
Type of
Project Research Host Location Materials Process
DOE
($000s)
Private
($000s)
Total
($000s)
Bench ScaleUniversity of
Wyoming Larimie, WY PRB Coal Ash
CO2, FeChloride under
Supercritical Conditions660 221 881
Bench Scale Duke Unviversity Durham NC Various CCBSolvent Extract &
Membrane Filtration720 183 903
Bench Scale West VA University Morgantown WVNApp Coal Mine
Drainage
Extraction from AMD &
AMD Sludges750 201 951
Bench ScaleNeumann Systems
GroupColorado Sp, CO
PRB/E Bit & Anthr Coal
& Ash
Supercritical CO2/Solvent
& Acid-Base Extr750 237 987
Bench Scale Batelle Columbus OH OH Coal & Ash Closed Loop Digestion 710 190 900
Bench ScaleUniversity of North
DakotaGrand Forks, ND ND Lignites & Refuse
Separate, Extr &
Concentrate749 188 937
Pilot Scale University of KY Lexington KYCentral App Prep
Refuse
Qtr TPY Physical &
Chemical Seaparation1,000 320 1320
Pilot ScalePhysical Sciences,
IncAndover MA
Ash E KY Fire Clay &
Antracite Refuse
1-5 TPD Physical-
Chemical Separation 999 251 1250
Pilot ScaleSouthern Res
InstituteBirmingham AL
Cent App & E Bitum
Coal
Plasma Based Testing on
Ash1,000 290 1290
Pilot Scale Tusaar Inc Lafayette, CO KY & OH Coal AshExtraction & Metal
Sorption984 246 1230
Summary Impacts On CCP
• Coal Use Will Be Impacted By Cheap Natural Gas (Capacity Factor) & Regulatory Impacts (Closures)
• CCP Use As A Valued Resource Continues– Volumes Impacted In Certain Markets
– Quality Impacted By Regulation
– Beneficiation Technologies Applied To Reclaim
– Reclaim Of Impoundment & Landfill Ash Ensures Long Term Availability With Beneficiation
– Transportation Longer Distances Required
– At 30% Of Fuel Mix – Volumes Meet Demands
• Future Uses Include REE Options

QUESTIONS
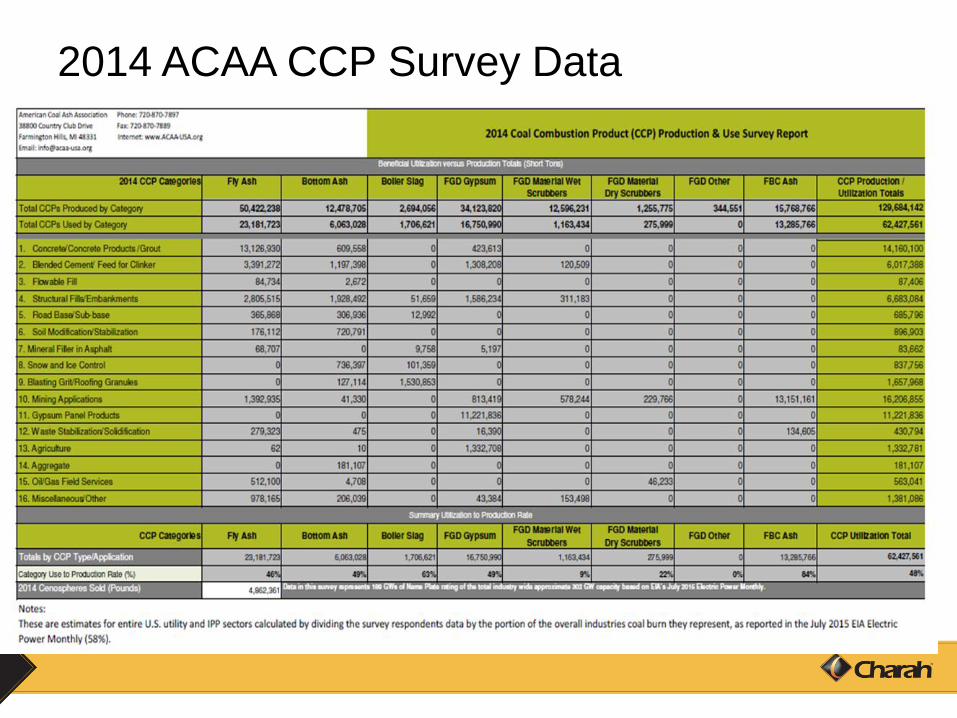
2014 ACAA CCP Survey Data