Embed Size (px)
Citation preview
1Epidemic Intelligence Service Program. Centers for Disease Control and Prevention. Atlanta. Georgia, USA 2Div1sion of Respiratory Disease Stud1es. Nat1onal Institute for Occupational Safety and Health. Morgantown. West Virgima. USA
Correspondence to Dr Eva Suarthana. D1vision of Respiratory Disease Studies. National Institute for Occupational Safety and Health, 1 095 Willowdale Road, Room 2806. Morgantown. West Virginia 26505. USA; [email protected]
Disclaimer The findmgs and conclus1ons in this report are those of the authors and do not necessanly represent the views of the National Institute for Occupational Safety and Health.
Accepted 10 April 2011
Downloaded from oem.bmj.com on May 23, 2011 -Published by group.bmj.com
Coal workers' pneumoconiosis in the United States: regional differences 40 years after implementation of the 1969 Federal Coal Mine Health and Safety Act Eva Suarthana,1.2 A Scott Laney, 2 Eileen Storey,2 Janet M Hale,2 Michael 0 Attfield2
ABSTRACT Objective To assess whether the recent increases in the prevalence of coal workers' pneumoconiosis (CWP) in the USA reflect increased measured exposures over recent decades. and to identity other potential causative factors. Methods The observed CWP prevalence was calculated tor 12 408 underground coal miner participants in the Coal Workers' Health Surveillance Program tor the period 2005-2009, stratified by the Mine Safety and Health Administration (MSHA) geographical districts. The predicted prevalence was estimated using a published exposure-response model from a large epidemiological study among US coal miners using dust exposure. tenure. miner's age and coal rank as predictors. X2 Testing was performed to compare the observed versus predicted CWP prevalence. Results Observed prevalence was significantly higher than predicted prevalence in MSHA districts 4-7 (central Appalachian region) (1 0.1% vs 4.2%; prevalence ratio (PR) 2.4; p<0.001) and significantly lower than predicted in other regions (1 .6% vs 3.6%; PR 0.4; p<0.001). The central Appalachian region had a significantly older workforce with greater mining tenure, a lower proportion of mines with 200 or more employees. and lower seam heights. Significant lower average compliance dust concentrations were reported tor this region. Conclusion The observed CWP prevalence substantially exceeded predicted levels in central Appalachia. However. the increased prevalence was not explained by the measured levels of dust exposures. Likely contributing factors include mine size and low seam mining, which may be associated with higher exposure to silica. Further study is needed to characterise the responsible factors tor the elevated CWP rates in central Appalachia.
INTRODUCTION Prior to 1970, dust concentrations in US underground coal mines averaged 6 mg!m3
, substantially higher than the current federal compliance limit of 2 mg!m3
.1 As a result, and as revealed by a number
of independent epidemiological surveys, the prevalence of coal workers' pneumoconiosis (CWP) in longer-tenured (eg, 30 or more years) miners exceeded 40% in some geographical areas? This, and the safety issues manifested by the coal mine disaster at Farmington, West Virginia in 1968 led to the enactment of the 1969 Federal Coal Mine Health and Safety Act (1969 Act). The act established the current federal exposure limit for respirable coal mine dust , and created the Coal Workers' Health Surveillance Program (CWHSP) administered by the
What this paper adds
.,. Regional differences in the prevalence of coal workers' pneumoconiosis (CWP) were observed that could not be explained by respirable dust concentrations derived from compliance measurements.
.,. In particular, CWP prevalence in central Appalachia (southern West Virginia, western Virginia and eastern Kentucky) was considerably higher than predicted.
.,. Small mine size and low seam height likely contributed to this excess.
.,. Our findings call for better control of dust produced during rock cutting and enhanced training and resources for safety and health in small mines.
National Institute for Occupational Safety and Health (NIOSH), among other provisionsa
The CWHSP is a national worker monitoring program enabling working underground coal miners to obtain free periodic chest x-rays. If certain signs of CWP are seen on their x-ray, the miner is entitled to work in a low dust environment. Data from the CWHSP provide the means to assess national and regional distributions in CWP prevalence, as well as evaluate temporal trends.3
Following passage of the 1969 Act, the overall CWP prevalence among underground coal miners declined from 11.2% for the period 1970-197 4 to 2.0% for 1995-1999. However, since 2000 the prevalence of CWP has increased to 3.3% for 2005-20062 The increasing prevalence of CWP since 2000 has led to enhanced surveillance and epidemiological studies to find explanations for the increasing trend. These studies identified changes in the epidemiology and clinical disease course of pneumoconiosis among coal miners characterised by an increased disease severity, geographical clustering in eastern Kentucky and southwestern Virginia, rapid disease progression and advanced disease in younger miners4
-7
These findings led NIOSH to intensify CWHSP efforts through the introduction of an enhanced surveillance program8 This program sought to increase program participation rates in CWP 'hot spot ' locations by use of a mobile examination unit to obtain radiographs at or near mine sites. The enhanced surveillance combined with the established CWHSP demonstrated that miners in
Su~i!;tftt' Atttaf# atffHb~{ijfEffi'M~Iti~JOY~)1 '2ti16j'~epJZ8~8'Ee<ti by BMJ Publishing Group Ltd under licend~f 6
A !34.4- Co /1 Ill- 73- '-1
Downloaded from oem.bmj.com on May 23, 2011 - Published by group.bmj.com
Original article ·
Kentucky, Virginia and West Virginia had radiographic patterns consistent with excessive silica exposure in more recent years,9
and that miners in mines with fewer than 50 employees are at increased risk of CWP and progressive massive fibrosis (PMF). 10
These findings, that CWP and PMF are more prevalent in small mines and that miners are possibly being exposed to excessive concentrations of crystalline silica, have been further supported by a recent investigation into dust exposures and mining practices in southern West Virginia, eastern Kentucky, southwestern Virgima and elsewhere. 11 Overall, these recent studies have clearly demonstrated that there is a troubling excess of respiratory disease in US coal miners in recent years. However, many questions remain as to what are the most important factors contributing to the recent trends in pneumoconiosis.
In a continued effort to describe and understand the extent and reasons for the current increase in CWP in the USA, we turned to examination of dust exposure data derived from the US Mine Safety and Health Administration's (MSHA's) Standardized Information System (MSIS) in conjunction with the medical data from the CWHSP. The primary objective of this analysis is to assess whether the increases in disease are reflected in increased exposures over recent decades and to examine addit ional factors of potential importance that have previously gone unreported.
METHODS Participation in the CWHSP is voluntary. The methods and procedures for data collection were approved by the NIOSH Human Subjects Review Board, and an approved form is signed by each participant. Detailed information describing the characteristics of the surveillance program, including data collection, institutional review board apfroval and patient consent, have been previously descnbed. 1
·' · 8
Radiograph readings, miner age and tenure, coal type, mine size (ie, the number of underground miners per mine) and mine location data were obtained from the CWHSP, and restricted to radiographs of underground coal miners 16 years of age and older acquired from 1 January 2005 to 31 December 2009 Data on seam height and hours worked per miner per year were obtained from MSIS for the same time period. Inspector-measured coal mine dust concentration data at mine level were obtained from MSIS for the period 1970- 2008. Complete informatiOn for all variables was required for inclusion of an individual's data into the dataset for analysis. We excluded underground coal miners from MSHA district 1 due to the small number of participants (n=55) and difference in coal type (anthracite) compared to the other districts in the analysis (bituminous) . We also excluded one mine with 17 miners with a reported seam height of 1 inch leaving 12 408 underground coal miners for analysis.
The radiographs were classified by NIOSH B readers for the presence of lung parenchymal abnormalities consistent with pneumoconiosis using the ILO Classification of Radiographs of Pneumoconioses. 12 A final determination of the classification of each radiograph was made using a standardised procedure, requiring agreement between at least two of the readers, as previously described 3 8 For the present analysis, presence of CWP was defined as an ILO classification of profusion category 1/0 or greater.
The observed CWP prevalence was calculated and stratified by MSHA district. There are 10 MSHA districts distributed regionally across the bituminous coal fields, essentially from Pennsylvania in the north to Nabama in the south, and to Colorado and Utah in the west. Of particular interest are MSHA districts 4-7, comprising southern West Virginia (district 4); western Virginia (5); eastern Kentucky (6); and central Kentucky,
North Carolina, South Carolina and Tennessee (7). Predicted CWP prevalence was estimated using the Attfield and Marring exposure-response mod el calculated as follows: ( -5.03 + (miner age X 0.0339)) + (1.74 X miner tenure X coal mine dust at mine level X (0.0153 X medium/low volatile bituminous coal) or (0.0078 X high volatile bituminous coal in the Appalachian region) or (0.0053 X high volatile bituminous in the Midwest region) or (0.0031 X high volatile bituminous in the West region)). 13 The original model used mean job-specific dust levels. In the absence of dust level information specific to all jobs, we estimated dust exposure using the mean mine-specific dust level based on MSHA compliance data. These data reflect the exposures of coal face workers, who are the highest exposed.
x2 Testing was performed to compare the observed versus predicted CWP prevalence. Due to non-normal distributions of the continuous variables, we used the Wilcoxon rank-sum test to compare the values for age, tenure, number of employees per mine, coal seam height, measured dust concentration and hours worked per miner in a year.
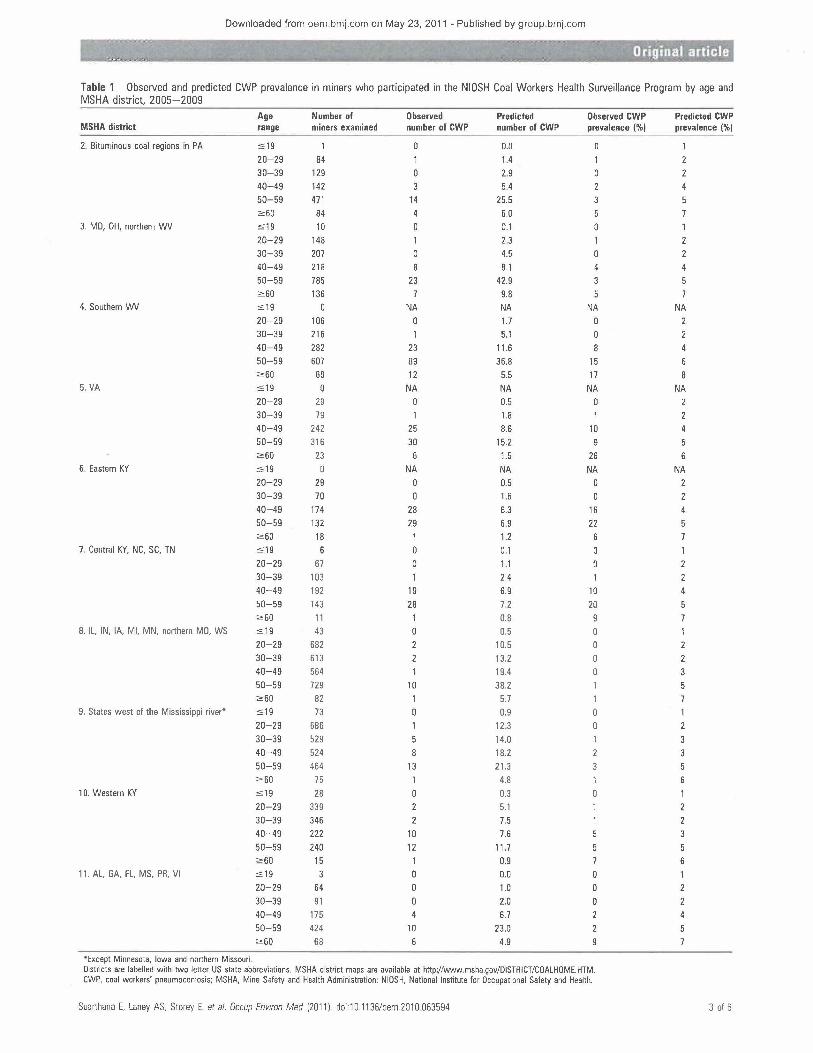
RESULTS The observed and predicted CWP prevalence among miner participants in the CWHSP are presented in table 1 by age group within MSHA district. Of note, the observed CWP prevalence exceeded that predicted in mmers aged 40 years and older in MSHA districts 4-7, while all other districts showed the opposite. Furthermore, high CWP prevalence (2-4-fold higher than predicted) was observed among young miners aged 40-49 years in MSHA districts 4-7 and not in other districts.
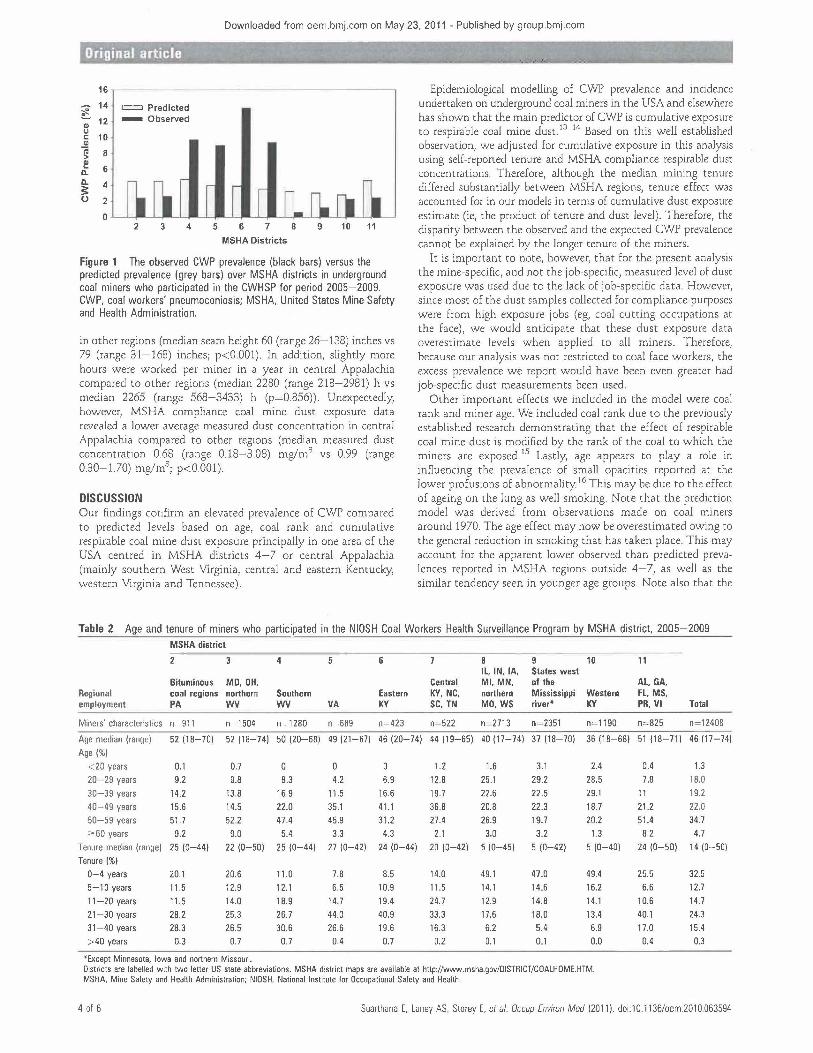
Figure 1 shows the observed CWP prevalence (black bars) versus the predicted CWP prevalence (grey bars) in underground coal miner participants in the CWHSP stratified by MSHA distnct for the period 2005-2009. Observed prevalence was significantly higher than predicted in MSHA districts 4-7 and significantly lower than predicted in other districts. Therefore, for the rest of the analyses we aggregated MSHA districts 4-7 (the central Appalachian region) versus other regions.
The overall observed and predicted CWP prevalences were 10.1% and 4.2% in the central Appalachian region (PR 2.4; p< 0.001) and 1.6% and 3.6%, respectively in other regions (PR 0.4; p<0.001). When the analysiS was restricted to miners with over 20 years of tenure, the same pattern was observed with 14.9% observed prevalence compared to the 5.2% predicted in the central Appalachian region (PR 2.9; p<0.001) in contrast to the other regions where the observed prevalence was 3.4% compared to the 5.4% predicted (PR 0.6; p<O.OOl) . When the analysis was restricted to miners with 20 years or less of tenure, the observed prevalence was 2.7% compared to the 2.8% predicted in central Appalachia (PR 1.0; p= 0.90) in contrast to the other regions where the observed prevalence was 0.6% compared to the predicted 2.6% (PR 0.25; p<0.001).
As shown in table 2, compared to all other regions, central Appalachia had a significantly older workforce (median age 48 (range 19-74) years vs 44 (range 17-74) years; p<0.001) with greater mining tenure (median tenure 25 (range 0-44) years vs 9 (range 0-50) years; p<0.001).
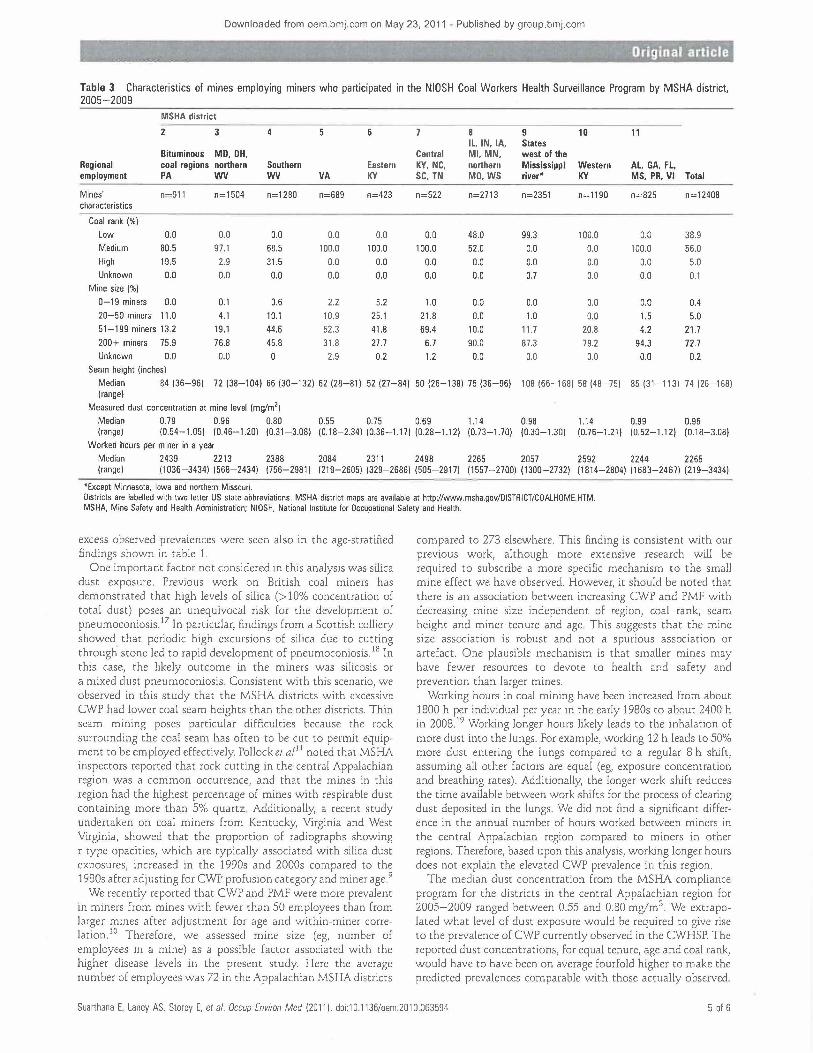
The size of the mine where participating miners worked differed between central Appalachia and the other regions (table 3). The former region had a significantly lower proportion of mines with 200 or more employees compared to other regions. Overall, the median number of employees per mine was 73 (range 1-423) in central Appalachia compared to 273 (range 4-709) workers per mine in the other regions (p<0.001). The average coal seam height was lower in central Appalachia than
2 of 6 Suarthana E. Laney AS, Storey E. et at. Occup Environ Med (2011 ). doi:1 0.11 36/oem.201 0.063594
Downloaded from oem.bmj.com on May 23, 2011 - Published by group.bmj.com
Table 1 Observed and predicted CWP prevalence in miners who participated in the NIOSH Coal Workers Health Surveillance Program by age and MSHA district, 2005- 2009
Age Number of Observed Predicted Observed CWP Predicted CWP MSHA district range miners examined number of CWP number of CWP prevalence (%) prevalence (%)
2. Bituminous coal regions in PA :s19 0.0 20-29 84 1 1.4 30-39 129 0 2.9 2 40-49 142 5.4 4 50-59 471 14 25.5 2:60 84 4 6.0
3. MD, OH, northern WV :s19 10 0 0.1 0 20-29 148 2.3 30-39 207 4.5 40-49 218 8.1 50-59 785 23 42.9 2:60 136 9.8
4. Southern WV :S19 0 NA NA NA NA 20-29 106 0 1.7 30-39 216 5.1 2 40-49 282 23 11.6 4 50-59 607 89 36.8 15 2:60 69 12 5.5 17
5. VA :s19 0 NA NA NA NA 20-29 29 0 0.5 30-39 79 1.8 1 40-49 242 25 8.6 10 50-59 316 30 15.2 9 2:60 23 6 1.5 26 6
6. Eastern KY :S19 NA NA NA NA 20-29 29 0 0.5 0 30-39 70 1.6 40-49 174 28 6.3 16 50-59 132 29 6.9 22 2:60 18 1 1.2 6
7. Central KY, NC, SC, TN :S19 6 0 0.1 20-29 67 1.1 0 2 30-39 103 2.4 1 2 40-49 192 19 6.9 10 4 50-59 143 28 7.2 20 2:60 11 1 0.8
8. IL, IN, lA, Ml, MN, northern MO, WS :S19 43 0 0.5 20-29 682 2 10.5 30-39 613 2 13.2 2 40-49 564 19.4 3 50-59 729 10 38.2 2:60 82 1 5.7 1
9. States west of the Mississippi river• :s 19 73 0 0.9 0 20- 29 686 12.3 0 2 30-39 529 14.0 40-49 524 8 18.2 2 50-59 464 13 21.3 3 2:60 75 4.8
10. Western KY :s19 28 0.3 20-29 339 2 5.1 30-39 346 2 7.5 2 40-49 222 10 7.6 3 50-59 240 12 11.7 5 2:60 15 1 0.9 7 6
11. AL, GA, FL, MS, PR, VI :s19 0 0.0 0 20- 29 64 0 1.0 0 2 30-39 91 0 2.0 0 2 40-49 175 6.7 4 50- 59 424 10 23.0 2 2:60 68 6 4.9
*Except Minnesota, Iowa and northern Missouri. Districts are labelled with two letter US state abbreviations. MSHA d1stnct maps are available at http://ww..v.msha.gov/DISTRICT/COALHOME.HTM. CWP, coal workers' pneumoconiosis; MSHA, Mine Safety and Health Administration; NIOSH, Nat1onal Institute for Occupational Safety and Health.
Suarthana E. Laney AS. Storey E. eta/. Occup Environ Med (2011). doi:1 0.1136/oem.201 0.063594 3 of 6
Downloaded from oem.brnj.com on May 23, 2011 - Published by group.brnj.corn
noma artie e
16
14 =Predicted ~ 12 -Observed Cl) 0 <:: 10 Cl)
iii 8 > f! 6 c.. c.. 4 3: (.) 2
0 2 3 4 5 6 7 8 9 10 11
MSHA Districts
Figure 1 The observed CWP prevalence (black bars) versus the predicted prevalence (grey bars) over MSHA districts in underground coal miners who participated in the CWHSP for period 2005-2009. CWP, coal workers' pneumoconiosis; MSHA, United States Mine Safety and Health Administration.
in other regions (median seam height 60 (range 26-138) inches vs 79 (range 31-168) inches; p<0.001). In addition, slightly more hours were worked per miner in a year in central Appalachia compared to other regions (median 2280 (range 218-2981) h vs median 2265 (range 568-3433) h (p=0.856)). Unexpectedly, however, MSHA compliance coal mine dust exposure data revealed a lower average measured dust concentration in central Appalachia compared to other regions (median measured dust concentration 0.68 (range 0.18-3.08) mglm3 vs 0.99 (range 0.30-1.70) mglm3
; p<0.001).
DISCUSSION Our findings confirm an elevated prevalence of CWP compared to predicted levels based on age, coal rank and cumulative respirable coal mine dust exposure principally in one area of the USA centred in MSHA districts 4-7 or central Appalachia (mainly southern West Virginia, central and eastern Kentucky, western Virginia and Tennessee).
Epidemiological modelling of CWP prevalence and incidence undertaken on underground coal miners in the USA and elsewhere has shown that the main predictor of CWP is cumulative exposure to respirable coal mine dust. 13 14 Based on this well established observation, we adjusted for cumulative exposure in this analysis using self-reported tenure and MSHA compliance respirable dust concentrations. Therefore, although the median mining tenure differed substantially between MSHA regions, tenure effect was accounted for in our models in terms of cumulative dust exposure estimate (ie, the product of tenure and dust level). Therefore, the disparity between the observed and the expected CWP prevalence cannot be explained by the longer tenure of the miners.
It is important to note, however, that for the present analysis the mine-specific, and not the job-specific, measured level of dust exposure was used due to the lack of job-specific data. However, since most of the dust samples collected for compliance purposes were from high exposure jobs (eg, coal cutting occupations at the face), we would anticipate that these dust exposure data overestimate levels when applied to all miners. Therefore, because our analysis was not restricted to coal face workers, the excess prevalence we report would have been even greater had job-specific dust measurements been used.
Other important effects we included in the model were coal rank and miner age. We included coal rank due to the previously established research demonstrating that the effect of respirable coal mine dust is modified by the rank of the coal to which the miners are exposed. 15 Lastly, age appears to play a role in influencing the prevalence of small opacities reported at the lower profusions of abnormality. 16 This may be due to the effect of ageing on the lung as well smoking. Note that the prediction model was derived from observations made on coal miners around 1970. The age effect may now be overestimated owing to the general reduction in smoking that has taken place. This may account for the apparent lower observed than predicted prevalences reported in MSHA regions outside 4-7, as well as the similar tendency seen in younger age groups. Note also that the
Table 2 Age and tenure of miners who participated in the NIOSH Coal Workers Health Surveillance Program by MSHA district, 2005-2009 MSHA district
2 3 4 5 8 9 10 IL, IN, lA, States west
Bituminous MD, OH, Central Ml, MN, of the Regional coal regions northern Southern Eastern KY, NC, northern Mississippi Western employment PA wv wv VA KY SC, TN MO, WS river* KY
Miners' characteristics n=911 n= 1504 n=1280 n=689 n=423 n=522 n-2713 n=2351 n=1190
Age median (range] 52 (18-701 52 (18-74) 50 (20-68) 49 (21-67) 46 (20-74) 44 (19-65) 40 (17-74) 37 (18-70) 36 (18-68)
Age(%) <20 years 0.1 0.7 0 0 1.2 1.6 3.1 2.4 20-29 years 9.2 9.8 8.3 4.2 6.9 12.8 25.1 29.2 28.5 30-39 years 14.2 13.8 16.9 11.5 16.6 19.7 22.6 22.5 29.1 40-49 years 15.6 14.5 22.0 35.1 41.1 36.8 20.8 22.3 18.7 50-59 years 51.7 52.2 47.4 45.9 31.2 27.4 26.9 19.7 20.2 2:60 years 9.2 9.0 5.4 3.3 4.3 2.1 3.0 3.2 1.3
Tenure median (range) 25 (0-44) 22 (0-50) 25 (0-44) 27 (0-42) 24 (0-44) 20 (0-42) 5 (0-451 5 (0-421 5 (0-401 Tenure (%)
0-4 years 20.1 20.6 11.0 7.8 8.5 14.0 49.1 47.0 49.4 5-10 years 11.5 12.9 12.1 6.5 10.9 11.5 14.1 14.6 16.2 11-20 years 11.5 14.0 18.9 14.7 19.4 24.7 12.9 14.8 14.1 21-30 years 28.2 25.3 26.7 44.0 40.9 33.3 17.6 18.0 13.4 31-40 years 28.3 26.5 30.6 26.6 19.6 16.3 6.2 5.4 6.9 >40 years 0.3 0.7 0.7 0.4 0.7 0.2 0.1 0.1 0.0
*Except Minnesota, Iowa and northern Missouri. Districts are labelled with two letter US state abbreviations. MSHA district maps are available at httpJ/www.msha.gov/DISTRICT/COALHOME.HTM. MSHA, Mine Safety and Health Administration; NIOSH, National Institute for Occupational Safety and Health.
11
AL, GA, FL, MS, PR, VI Total
n=825 n= 12408
51 (18-71) 46 (17-74)
0.4 1.3 7.8 18.0
11 19.2 21.2 22.0 51.4 34.7 8.2 4.7
24 (0-501 14 (0-501
25.5 32.5 6.6 12.7
10.6 14.7 40.1 24.3 17.0 15.4 0.4 0.3
4 of 6 Suarthana E. Laney AS, Storey E. eta/. Occup Environ Med (2011). doi:10.1136/oem.201 0 063594
Downloaded from oem bmj.com on May 23, 2011 - Published by group.bmj.com
:-~--.._.,-, ___ ~ ~- --~- -----·-------~-- ----- - --· - . ·- - o'rigirlal article
Table 3 Characteristics of mines employing miners who participated in the NIOSH Coal Workers Health Surveillance Program by MSHA district, 2005-2009
MSHA district
3 6 8 9 10 11 IL,IN, lA, States
Bituminous MD, OH, Central Ml, MN, west of the Regional coal regions northern Southern Eastern KY, NC, northern Mississippi Western AL, GA, FL, employment PA wv wv VA KY SC, TN MO. WS river* KY MS, PR, VI Total
Mines' n-911 n=1504 n=1280 n=689 n=423 n= 522 n=2713 n=2351 n=1190 n=825 n=1 2408 characteristics
Coal rank (%)
Low 0.0 0.0 0.0 0.0 0.0 0.0 48.0 99.3 100.0 0.0 38.9 Medium 80.5 97.1 68.5 100.0 100.0 100.0 52.0 0.0 0.0 100.0 56.0 High 19.5 2.9 31.5 0.0 0.0 0.0 0.0 0.0 0.0 0.0 5.0 Unknown 0.0 0.0 0.0 0.0 0.0 0.0 0.0 0.7 0.0 0.0 0.1
Mine size I%)
0-19 miners 0.0 0.1 0.6 2.2 5.2 1.0 0.0 0.0 0.0 0.0 0.4 20-50 miners 11.0 4.1 10.1 10.9 25.1 21.8 0.0 1.0 0.0 1.5 5.0 51-199 miners 13.2 19.1 44.6 52.3 41.8 69.4 10.0 11.7 20.8 4.2 21.7 200+ miners 75.9 76.8 45.8 31.8 27.7 6.7 90.0 87.3 79.2 94.3 72.7 Unknown 0.0 0.0 2.9 0.2 1.2 0.0 0.0 0.0 0.0 0.2
Seam height (inches) Median 84 (36-96) 72 (38-104) 66 (30-132) 62 (28-81) 52 (27-84) 50 (26-138) 75 (36-96) 108 (66-168) 58 (48-75) 85 (31-113) 74 (26-168) (range)
Measured dust concentration at mine level (mg/m3)
Median 0.79 0.96 0.80 0.55 0.75 0.69 1.14 0.98 1.14 0.99 0.96 (range) (0.54-1.05) (0.46-1.20) (0.31 -3.08) (0.18-2.34) (0.36-1.17) (0.28-1.12) (0.73-1.70) (0.30-1 .30) (0.76-1.21) (0.52-1.12) (0.18-3.08)
Worked hours per miner in a year Median 2439 2213 2388 2084 2311 2498 2265 2057 2592 2244 2265 (range) 11 036-3434) 1568-2434) (756-2981) (219-2605) (329-2686) (505-2917) (1557-2700) (1300-2732) (1814-2804) (1683-2467) (219-3434)
*Except Minnesota, Iowa and northern Missouri. Districts are labelled with two letter US state abbreviations. MSHA d1stnct maps are ava1lable at http://www.msha.gov/DISTRICT/COALHOME.HTM. MSHA, Mine Safety and Health Administration; NIOSH, National Institute for Occupational Safety and Health.
excess observed prevalences were seen also in the age-stratified findings shown in table 1.
One important factor not considered in th1s analysis was s!lica dust exposure. Previous work on British coal miners has demonstrated that high levels of silica (> 10% concentration of total dust) poses an unequivocal risk for the development of pneumoconiosis17 In particular, findings from a Scottish colliery showed that periodic high excursions of silica due to cutting through stone led to rapid development of pneumoconiosis. 18 In this case, the likely outcome in the miners was silicosis or a mixed dust pneumoconiosis. Consistent with this scenario, we observed in this study that the MSHA districts with excessive CWP had lower coal seam heights than the other districts. Thin seam mining poses particular difficulties because the rock surrounding the coal seam has often to be cut to permit equipment to be employed effectively. Pollock et a/ 11 noted that MSHA inspectors reported that rock cutting in the central Appalachian region was a common occurrence, and that the mines in this region had the highest percentage of mines with respirable dust containing more than 5% quartz Additionally, a recent study undertaken on coal miners from Kentucky, Virginia and West Virginia, showed that the proportion of radiographs showing r type opacities, which are typically associated with silica dust exposures, increased in the 1990s and 2000s compared to the 1980s after adjusting for CWP profusion categor; and miner age9
We recently reported that CWP and PMF were more prevalent in miners from mines with fewer than 50 employees than from larger mines after adjustment for age and within-miner correlation.10 Therefore, we assessed mine size (eg, number of employees in a mine) as a possible factor associated with the higher disease levels in the present study. Here the average number of employees was 72 in the Appalachian MSHA districts
compared to 273 elsewhere. This finding is consistent with our previous work, although more extensive research will be required to subscribe a more specific mechanism to the small mine effect we have observed. However, it should be noted that there is an association between increasing CWP and PMF with decreasing mine size independent of region, coal rank, seam height and miner tenure and age. This suggests that the mine size association is robust and not a spurious association or artefact. One plausible mechanism is that smaller mines may have fewer resources to devote to health and safety and prevention than larger mines.
Working hours in coal mining have been increased from about 1800 h per indiv1dual per year in the early 1980s to about 2400 h in 2008. 19 Working longer hours likely leads to the inhalation of more dust into the lungs. For example, working 12 h leads to 50% more dust entering the lungs compared to a regular 8 h shift, assuming all other factors are equal (eg, exposure concentration and breathing rates). Additionally, the longer work shift reduces the time available between work shifts for the process of clearing dust deposited in the lungs. We did not find a significant difference in the annual number of hours worked between miners in the central Appalachian region compared to miners in other regions. Therefore, based upon this analysis, working longer hours does not explain the elevated CWP prevalence in this region.
The median dust concentration from the MSHA compliance program for the districts in the central Appalachian region for 2005-2009 ranged between 0.55 and 0.80 mg!m3
. We extrapolated what level of dust exposure would be required to give rise to the prevalence of CWP currently observed in the CWHSP. The reported dust concentrations, for equal tenure, age and coal rank, would have to have been on average fourfold higher to make the predicted prevalences comparable with those actually observed.
Suarthana E, Laney AS, Storey E. eta/. Occup Environ Med (2011). doi:1 0.1136/oem.201 0.063594 5 of 6
Downloaded from oem bmj.com on May 23, 2011 - Published by group.bmj.com
Original ar.~icl~.
We are unable to determine whether this is due to underreporting of exposure or other factors such as overexposure to silica dust. However, it is plausible that multiple factors are simultaneously influencing the increased prevalence of CWP in the central Appalachian region.
An increase in the prevalence of CWP has been observed in recent years for British coal mmers20 Here, the prevalence of ILO profusion category 1/0 or greater increased from 0.2% for 1994-1997 to 0.8% in 1998-2000. Possible explanations given for this rise were an increase in hours worked and differences in age. However, the authors also indicated that other (unspecified) factors may have been at work. They noted that revised dust limits would take account of the findings.
The validity of any analysts is contingent upon the quality of the data being used. For the present analysis we used selfreported tenure in mining to derive the cumulative exposures. Because this information depends on memory recall, it may not be entirely reliable. However, past epidemiological studies of exposure-response relationships for CWP used similar information and identified clear trends in prevalence with increasing dust exposures. We used MSHA compliance dust concentration data. It is important to note as a limitation that the validtty of these data has been periodically questioned. 11 21 However, if any bias present in the exposure data is systematic and non-differential with respect to MSHA district, the internal associations we present should be unaffected. Lastly, there may be an unmeasured factor responsible affecting prevalence that varies by MSHA district that our models are not accounting for, for example, use of personal protective equipment.
To conclude, the observed prevalence of CWP substantially exceeded predicted levels in central Appalachia. However, the increased prevalence was not explained by the measured levels of dust exposures, reported tenure, age or coal rank. Coal seam height and mine size were likely factors contributing to this observation. While further study is needed to characterise the factors responsible for elevated CWP rates, the results point to a need for greater vigilance in controlling coal mine dust, especially that which arises from rock cutting, and for better training and resources for safety and health in small mines.
Acknowledgements The authors w1sh to thank the National Institute for Occupational Safety and Health Coal Workers' Health Surveillance Program team for making this study possible.
Competing interests None.
Ethics approval This study was conducted with the approval of the National Institute for Occupational Safety and Health (NIOSH) Human Subjects Review Board.
Provenance and peer review Not commissioned; externally peer reviewed.
REFERENCES Attfield MD, Castellan RM Epidemrological data on US coal miners' pneumocomosis, 1960 to 1988. Am J Public Health 1992;82:964-70.
2. National Institute for Occupational Safety and Health Division of Respiratory Disease Studies. Work-Related Lung Disease Surveillance Report 2007. Morgantown National Institute for OccupaliOnal Safety and Health. 2008.
3. National Institute for Occupational Safety and Health. Coal Workers' Health Surveillance Program (CWHSP). 2010. http://www.cdc.gov/niosh/topics/ surveillance/ORDS/CoaiWorkersHealthSurvProgram.html (accessed 15 Mar 2011)
4. Antao VC, Petsonk EL. Sokolow LZ. et a/. Rapidly progressive coal workers' pneumoconiosis in the United States: geographic clustering and other factors. Occup Environ Med 2005;62:670-4
5. Centers for Disease Control and Prevention. Pneumoconiosis prevalence among working coal miners examined in federal chest radiograph surveillance programs-United States, 1996-2002. MMWR Morb Mortal Wkly Rep 2003;52:336-40
6. Centers for Disease Control and Prevention. Advanced cases of coal workers' pneumoconiosis-two counties. Virginia, 2006. MMWR Morb Mortal Wkly Rep 2006;55:909-13.
7. Centers for Disease Control and Prevention. Advanced pneumoconiosis among working underground coal miners-Eastern Kentucky and Southwestern Virginia, 2006. MMWR Morb Mortal Wk/y Rep 2007;56:652-5.
8. National Institute for Occupational Safety and Health. Enhanced Coal Workers' Health Surveillance Program (ECWHSP). 2010. http://www.cdc gov/niosh/topics/ surve!llance/ORDS/ecwhsp html (accessed 15 Mar 2011).
9. Laney AS, Petsonk EL, Attfield MD Pneumoconiosis among underground bituminous coal miners in the United States; rs silicosis becom1ng more frequent? Occup Envtron Med 2010;67:652-6
10. Laney AS, Attfield MD. Coal workers' pneumoconiosis and progressive massive fibrosrs are increasingly more prevalent among workers in small underground coal mines in the United States. Occup Environ Med 201 0;67 428-31.
11. Pollock D, Potts J, Joy G. lnvestrgation tnto dust exposures and mining practices in the southern Appalachian region. Mming Engmeering 201 0;62:44-9.
12. International Labour Office. Guidelines for the use of the /LO International Classification of Radiographs of Pneumoconioses Geneva: International Labour Office, 2002.
13. Attfield MD, Marring K. An investigation into the relationship between coal workers' pneumoconiosis and dust exposure in U S. coal miners. Am lnd Hyg Assoc J 1992;53:486-92.
14. Attfield MD, Seixas NS Prevalence of pneumoconiosis and its relationship to dust exposure in a cohort of U.S. bituminous coal miners and ex-miners Am J lnd Med 1995;27:137-51
15. Page SJ, Organ1scak JA. Suggestion of a cause-and-effect relationshrp among coal rank, airborne dust, and incidence of workers' pneumoconiosis. A/HAJ 2000;61 :785-7.
16. Castalian RM, Sanderson WT, Petersen MR. Prevalence of radiographic appearance of pneumoconiosis in an unexposed blue collar population Am Rev Respir Ots 1985;131 684-6.
17. Soutar CA, Robertson A. Miller BG. et a!. Epidemiological evidence on the carcinogemc1ty of sil1ca: factors in scientific judgement Ann Occup Hyg 2000;44:3-14.
18. Buchanan D, Miller BG, Soutar CA. Quantitative relations between exposure to respirable quartz and risk of silicosis Occup Environ Med 2003;60:159-64.
19. Mine Safety and Health Administration. Number of Hours Worked at Coal Mmes in the United States, by Primary Activity 1978-2008. http://www.msha.gov/STATS/ PART50/W0/1 978/wq78cl04 asp (acsessed 15 Mar 2011).
20. Scarisbrick D, Quinlan R Health surveillance for coal workers' pneumoconiosis in the United Kingdom 1998-2000. Ann Occup Hyg 2002;46(Suppl 1):254-6.
21 Boden Ll, Gold M. The accuracy of self-reported regulatory data: the case of coal mine dust Am J lnd Med 1984;6:427-40
6 of 6 Suarthana E. Laney AS, Storey E. eta/. Occup Environ Med 12011). doi:1 0.1136/oem.201 0.063594
Downloaded from oem.bmj.com on May 23, 2011 - Published by group bmj com
References
P<P
Email alerting service
Topic Collections
Coal workers' pneumoconiosis in the United States: regional differences 40 years after implementation of the 1969 Federal Coal Mine Health and Safety Act Eva Suarthana, A Scott Laney, Eileen Storey, et al.
Occup Environ Med published online May 19, 2011 doi: 1 0.1136/oem.201 0.063594
Updated information and services can be found at: http://oem.bmj.com/content/early/2011/05/19/oem.201 0.063594. fu ll.html
These include:
This article cites 16 articles, 7 of which can be accessed free at: http://oem.bmj.com/contentlearly/2011/05/19/oem.201 0 .063594.fu ll .html#ref-list-1
Published online May 19, 2011 in advance of the print journal.
Receive free email alerts when new articles cite this article. Sign up in the box at the top right corner of the online article.
Articles on similar topics can be found in the following collections
Respiratory (111 articles)
Advance online articles have been peer reviewed and accepted for publication but have not yet appeared in the paper journal (edited, typeset versions may be posted when available prior to final publication). Advance online articles are citable and establish publication priority; they are indexed by PubMed from initial publication. Citations to Advance online articles must include the digital object identifier (DOis) and date of initial publication.
To request permissions go to: http:llgroup.bmj.com/grouplrights-licensing/permissions
To order reprints go to: http:l/journals.bmj.com/cgilreprintform
To subscribe to BMJ go to: http://group.bmj.com/subscribel
Downloaded from oem.bmj.com on May 23, 2011 - Published by group.bmj com
Notes
Advance online articles have been peer reviewed and accepted for publication but have not yet appeared in the paper journal (edited, typeset versions may be posted when available prior to final publication). Advance online articles are citable and establish publication priority; they are indexed by PubMed from initial publication. Citations to Advance online articles must include the digital object identifier (DOis) and date of initial publication .
To request permissions go to: http://group.bmj.com/group/rights-licensinglpermissions
To order reprints go to: http://journals.bmj.com/cgilreprintform
To subscribe to BMJ go to: http://group.bmj.com/subscribe/