Embed Size (px)
Citation preview

1
Coarse-grain Molecular Dynamics Study of Fullerene Transport across a
Cell Membrane
Sridhar Akshay, Bharath Srikanth, Amit Kumar1 and Ashok Kumar Dasmahapatra
2
Department of Chemical Engineering, Indian Institute of Technology Guwahati, Guwahati –
781 039, Assam, India.
PACS number(s): 87.15.hj, 87.14.Cc, 87.10.Tf, 87.15.nr
1 Corresponding author: Phone: +91-361-258-2275; Fax: +91-361-258-2291; Email address:
2 Corresponding author: Phone: +91-361-258-2273; Fax: +91-361-258-2291; Email address: [email protected]

2
ABSTRACT
The study of the ability of drug molecules to enter cells through the membrane is of vital
importance in the field of drug delivery. In cases where the transport of the drug molecules
through the membrane is not easily accomplishable, other carrier molecules are used.
Spherical fullerene molecules have been postulated as potential carriers of highly hydrophilic
drugs across the plasma membrane. Here we report the coarse-grain molecular dynamics
study of the translocation of C60 fullerene and its derivatives across a cell membrane modeled
as a 1, 2-distearoyl-sn-glycero-3-phosphocholine (DSPC) bilayer. Simulation results indicate
that pristine fullerene molecules enter the bilayer quickly and reside within it. The addition of
polar functionalized groups makes the fullerenes less likely to reside within the bilayer but
increases their residence time in bulk water. Addition of polar functional groups to one half
of the fullerene surface, in effect creating a Janus particle, offers the most promise in
developing fullerene models that can achieve complete translocation through the membrane
bilayer.

3
I. INTRODUCTION
Every eukaryotic cell is enclosed within a thin membrane called the plasma
membrane, which is about 5 nm wide and is the sole pathway for the transfer of substances in
and out of the cell1. The plasma membrane is predominantly composed of a bimolecular layer
of amphiphilic lipids, arranged such that the polar head groups face the surrounding aqueous
environment, and the hydrophobic tails face each other2. This lipid backbone is infused with
proteins and carbohydrates which offer structure and functionality to the membrane3. The
current accepted model for the membrane structure is the Singer-Nicholson fluid-mosaic
model4. According to this model, the lipid bilayer is in a fluid state and is free to move
laterally within the plane of the membrane. The membrane proteins that penetrate the lipid
sheet are located at arbitrary positions, like a mosaic pattern. These components of the
membrane are also mobile and are capable of coming into proximity to engage in
transient interactions5.
As the plasma membrane is the sole pathway in and out of the cell, the transfer of
drugs and other bioactive molecules across the membrane has attracted significant research
interest6,7
. The direct trans-membrane delivery of drugs is particularly inefficient if the drug
molecule is too hydrophilic/polar or if the drug is actively pumped out of the cell. A variety
of factors then need to be considered to ensure targeted and effective delivery of drugs to the
cells8.
Drug carrier molecules can generally be classified into four major groups: viral
carriers, cationic compounds, proteins and inorganic nanoparticles9. Low cell toxicity and
ease of availability has made inorganic nanoparticles the focus of much drug research
worldwide10,11
. Fullerene, made up of 60 carbon atoms12
, is one such inorganic nanoparticle
that has been investigated for its ability to deliver drugs to their target sites13–15
. These
fullerene molecules cross the bilayer through a combination of passive diffusion and simple
hydrophobic forces16,17
. However, fullerene molecules have remarkably low solubility in
water and have shown a tendency to aggregate in polar solutions18,19
. The pristine fullerene
molecules have also been postulated to be cytotoxic20
. Hence, functionalization of fullerenes
is an emerging research area with a view towards improving their solubility21
, reducing
cytotoxicity20
and improving their uptake within the cell membrane17,22,23
.

4
Molecular dynamics (MD) simulation has emerged as a popular tool for the study and
analysis of several membrane-related phenomena24,25
. Many atomistic MD simulation studies
of fullerenes interacting with bilayers have been carried out26–28
. However, limitations persist
with model accuracy due to the extremely slow lateral diffusion of individual lipid
molecules within the bilayer. Typical diffusion coefficient for a lipid molecule is around 5
µm2/s, which implies that a lipid molecule would take around 50 ns to diffuse from its
position to that of an immediately adjacent lipid molecule29
. Hence, coarse-grain (CG)
models are gaining popularity as a method of simulating larger systems over longer
timescales. In CG models, small groups of atoms are grouped together as beads and soft-
harmonic potentials are used to maintain bond-lengths and angles. This coarse-graining
method reduces the number of simulated particles and also allows the usage of larger time-
steps. The CG models have been parametrized and used successfully by various groups to
study the interaction of carbon nanoparticles and the lipid bilayer30–32
.
Here, we present the results obtained from a coarse-grain MD simulation study on the
penetration of C60 fullerene molecules and their derivatives into a model 1,2-distearoyl-sn-
glycero-3-phosphocholine (DSPC) bilayer membrane. The next section describes the coarse
grain models used and the simulation parameters employed in this work.
II. MODEL AND SIMULATION TECHNIQUE
A. Coarse-Grain Model
Martini is one of the most popular coarse-grained models for bio-molecular MD
simulations33
. On average, a four-to-one mapping is employed, i.e., four heavy atoms and
their associated hydrogen atoms are mapped to a single interaction center. Four main types of
interaction centers are defined: Polar (P), Non-Polar (N), Apolar (C) and Charged (Q).
Interaction centers P and C are sub-divided into types 1-5, with polarity increasing from 1 to
5. Interaction centers N and Q are sub-divided based on their hydrogen-bonding capability (d
- donor, a - acceptor, da - both, 0 - none).
Marrink et al.34
developed Martini models for the DSPC lipid molecules. The DSPC
molecule is made up of an 18 atom long alkyl chain connected to a positively charged
ammonium group and negatively charged phosphate group. It is modelled using 14 beads

5
with 10 representing the two lipophilic tails. Two beads represent the oxygen linkages and
the charged phosphate and ammonium groups are modelled by one bead each.
The coarse grain model for fullerene used in this work was developed by Monticelli et
al.32,35
by placing 16 beads on the surface of a sphere with a diameter of 0.72 nm and
equilibrating using Monte Carlo simulations. The functionalization of fullerene is carried out
by replacing the CNP bead defined by Monticelli at al.32,35
by the more polar P5 particle
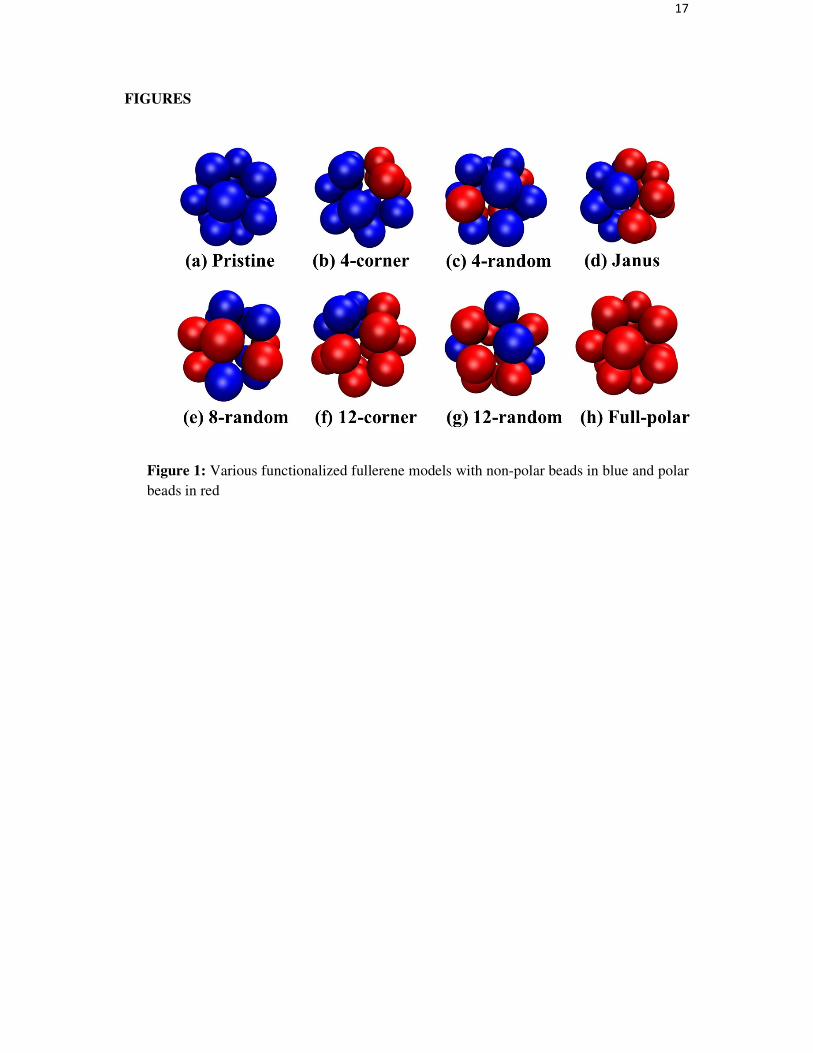
bead. A range of eight functionalized fullerene models was generated by varying the number
and location of the substitutions. Thereby, the dependence of the lipid-fullerene interaction on
the degree of polarity and the spatial orientation of the polarity is studied. The various
fullerene models used are shown in Figure 1.
Traditional Martini water is defined as a four-to-one mapping with four water
molecules represented by a single bead. However, examining the effects of polarity
necessitated the use of polarizable Martini water parameterized by Yesylevskyy et al.36
The
parametrization adds two beads to the original water bead and thereby introduces a dipole
that interacts more realistically with polar or charged particles.
B. Simulation Setup
A random orientation of 128 DSPC molecules was solvated in a cubic box of side 7.5
nm. A 30 ns MD run was then used to self-assemble the bilayer. The water molecules used
for solvation were removed and the bilayer was oriented in the z-direction. This bilayer-
configuration of 128 DSPC molecules was used to represent the membrane in all subsequent
simulations.
The fullerenes were then placed at an appropriate distance from the head-groups of the
bilayer before being solvated in water. The behavior of the fullerenes in water and their
interaction with the bilayer was studied as a function of three different factors - temperature,
concentration and spatial polarity. Table 1 provides a description of the fullerene model,
number of fullerene molecules and temperature of each simulation run.
A total of 62 simulations were carried out with each run repeated four times. All
simulations were carried out for 300 ns with a time step of 30 fs in the NPT ensemble.
Temperature and pressure control was maintained through Berendsen thermostat and

6
barostat37
with constants of 10 ps and 40 ps respectively. The GROMACS simulation
software version 4.6.638
was used to carry out all the simulations listed in Table 1. Visual
Molecular Dynamics (VMD)39
was used to visualize the results and generate the images.
The energetics of fullerene translocation through the lipid membrane was further
studied using a combination of umbrella sampling and weighted-histogram analysis method
(WHAM). The initial configuration was generated by placing fullerene at evenly spaced
distances of 0.1 nm ranging up to 1 nm from the lipid head-groups in either direction. With a
membrane width of 5 nm, this resulted in 70 configurations. The lipid membrane and water
molecules were then packed around the configurations. Atomic overlaps were corrected by
energy minimization up to the point where the maximum force on any atom was below 10 kJ
mol-1
nm-1
. Energy minimization was followed by an NVT equilibration run of 1 ns where the
fullerene and the bilayer were restrained by constraints of 2000 kJ mol-1
nm-1
and 1000 kJ
mol-1
nm-1
respectively. An umbrella potential with a harmonic constant of 1000 kJ mol-1
nm-2
was then applied to the fullerene and simulated for 10 ns in each configuration. Finally, the
GROMACS module g_wham40
was used to perform potential of mean force (PMF)
calculation across the windows. The 1D-PMF provides an energetic description of the
fullerene as it passes through the membrane.
Two atomistic simulations were also performed to check the reliability of the results
obtained by the coarse-grain simulations. Monticelli et al.32,35
have also developed the
atomistic parameters of fullerene for the OPLS all-atom force field41
. A fully equilibrated 128
molecule 1-palmitoyl,2-oleoyl-sn-glycero-3-phosphocholine (POPC) bilayer developed by
Ulmschneider et al.42
was obtained from Lipidbook43
. The first atomistic simulation was
carried out with only one fullerene molecule placed away from the bilayer and solvated in
water. The second atomistic simulation was carried out to verify the fullerene-fullerene
interactions and thus had five C60 molecules placed outside the bilayer. Both models were
simulated for 100 ns in the NVT ensemble with a time-step of 2 fs. The temperature was
maintained using the Berendsen thermostat37
with a constant of 0.1 ps. Figure 2 shows the
initial configuration of the fullerene molecules and the POPC bilayer where water molecules
have been removed for clarity.

7
III. RESULTS AND DISCUSSION
A. Single Fullerene
Single pristine fullerene molecules tend to spend some time in the bulk of the aqueous
phase before diffusing into the bilayer approximately 10 ns into the simulation. The fullerene
quickly traverses the head group of the bilayer and moves more slowly through the tail region
before settling around the center of the membrane. This behavior of fullerene is qualitatively
similar to that observed in simulation studies by D’Rozario et al.31
and Wong-Ekkabut et al.32
1. Effect of Change in Polarity
The functionalization of fullerene causes it to deviate from the ideal behavior
described above. This deviation depends on the number and spatial distribution of the polar
functional groups on the C60 molecule. Figure 3 provides a graph of the variation of the z-
coordinate of the fullerene models over time.
Results indicate that the residence time of the fullerene in the bulk solvent is directly
proportional to the quantum of polarization. The pristine fullerene molecule resides in the
bulk solvent (water) for approximately 10 ns. As the number of polar beads is increased, the
residence time in bulk water also increases. At 12 polar beads, the fullerene molecule does
not permeate into the bilayer even after 300 ns.
An additional trend is observed in the residence location of the fullerenes after
internalization. The pristine fullerene model resides closest to the bilayer center. With
increasing polarity, the intra-bilayer residence position of the fullerene models also shifts
towards the head-groups. The 12-random fullerene model tends to reside close to the
membrane head-groups without permeating. The 12-corner and full-polar models remain
completely in the bulk solvent. A notable exception is the Janus particle, which permeates
quickly across the membrane and resides close to the head-groups of the lower membrane
leaflet. The bulk water residence times and post-internalization residence locations also
indicate that functionalized fullerenes with polar group concentrated together interact more
strongly with water than fullerenes with more dispersed polarization.

8
The 1-D PMF values computed using a combination of umbrella sampling and
WHAM are shown in Figure 4. It gives the energy of the fullerene models as a function of
their position relative to the bilayer center and qualitatively explains the trends observed in
Figure 3. The pristine fullerene model shows a deep well with an energy minimum at the
center of the bilayer. This is consistent with its quick entry and residence at the bilayer center
(as seen in Figure 3). As the quantum of polarization is increased, the depth of the energy
well reduces and the minimum point shifts away from the bilayer center, towards the head-
groups. This can explain the increased internalization time and residence locations shifting
away from the bilayer center in Figure 3. In Figure 3, fullerene models with 12 polar beads or
more did not permeate into the bilayer. A similar cutoff is observed in Figure 4 for fullerenes
with 12 polar beads or more, where the energy well disappears and the fullerene molecules do
not have an ‘incentive’ to enter the bilayer. However, the PMF calculations are unable to
explain the quick diffusion of the Janus particles across the bilayer.
2. Effect of Change in Temperature
The dependence of temperature on the behavior of single fullerene molecules was
studied using three fullerene models (pristine, polar and Janus). The temperature was varied
in intervals of 5ºC from 30°C to 50ºC. As the temperature of the system is increased, the
pristine fullerene molecules exhibit a longer residence time in the bulk-solvent whereas the
semi-polar Janus fullerenes show an opposite trend. The average residence time of the two
fullerene models is depicted graphically in Figure 5. This temperature dependence can
possibly be attributed to the reduction in the dipole moment of water with increasing
temperature44
. However, even increasing the temperature up to 50°C proved insufficient for
the internalization of a fully polar fullerene molecule.
B. Multiple Fullerene Molecules
When the diffusion of multiple pristine fullerenes is simulated, the C60 molecules
show a tendency to agglomerate in the aqueous bulk phase before penetrating the bilayer.
This fullerene aggregate spends greater time in the aqueous bulk before internalization
compared to the single fullerene molecule. This might be due to the smaller surface-to-
volume ratio and lower diffusivity of the aggregate.

9
Post-internalization, the aggregate disperses within the membrane and the fullerene
molecules exist individually. Figure 6 depicts the C60-C60 radial distribution function (RDF)
before internalization (at 5 ns) and after internalization (at 40 ns). Pre-internalization, a
sharper function is seen with a major peak at r = 1 nm. The RDF reaches zero at around 2
nm, which indicates that all the C60 molecules are concentrated together. Post-internalization,
the RDF is more diffuse and does not reach zero even at large r values, which indicates that
the fullerene molecules do not form an aggregated cluster inside the lipid bilayer and are
separated from each other. These agglomeration results are qualitatively similar to the
simulation behavior observed by Wong Ekkabut et al.32
1. Effect of Change in Polarity and Concentration
The behavior of functionalized fullerenes is studied using simulation runs of all
fullerene models at three concentrations of C60 molecules. For pristine fullerene molecules,
the increase in concentration causes no deviation in behavior. Even at 15 C60 molecules, the
fullerenes agglomerate into one or two large particles before transfusing into the bilayer. The
larger particles spend a longer time in the bulk water, which can be attributed to the lower
diffusivity of the larger mass particles.
As the polarity of the fullerenes is increased, their tendency to agglomerate reduces.
Instead of one or two large particles, the functionalized fullerenes form several small
aggregates that enter the bilayer at different times. This is possibly due to the competing
effects of non-functionalized fullerene beads that promote agglomeration and the hydrophilic
polar groups that retard agglomeration. The tendency to form agglomerates reduces with
increase in the number of polar beads owing to more favorable interaction with water.
Functionalized fullerenes having 12 or more polar beads do not agglomerate at all and reside
as individual particles in the bulk water for the duration of the simulation. A similar cut-off in
behavior is observed in Figure 3 and Figure 4.
Figure 7 shows the C60-C60 RDF of the various fullerene models while they reside in
the bulk solvent. For pristine fullerene, the peaks in the function occur at low values of ‘r’
and the function quickly decays to zero (at r < 2 nm). However, as the number of polar
functional groups on the fullerene molecules is increased, the RDF progressively becomes
10
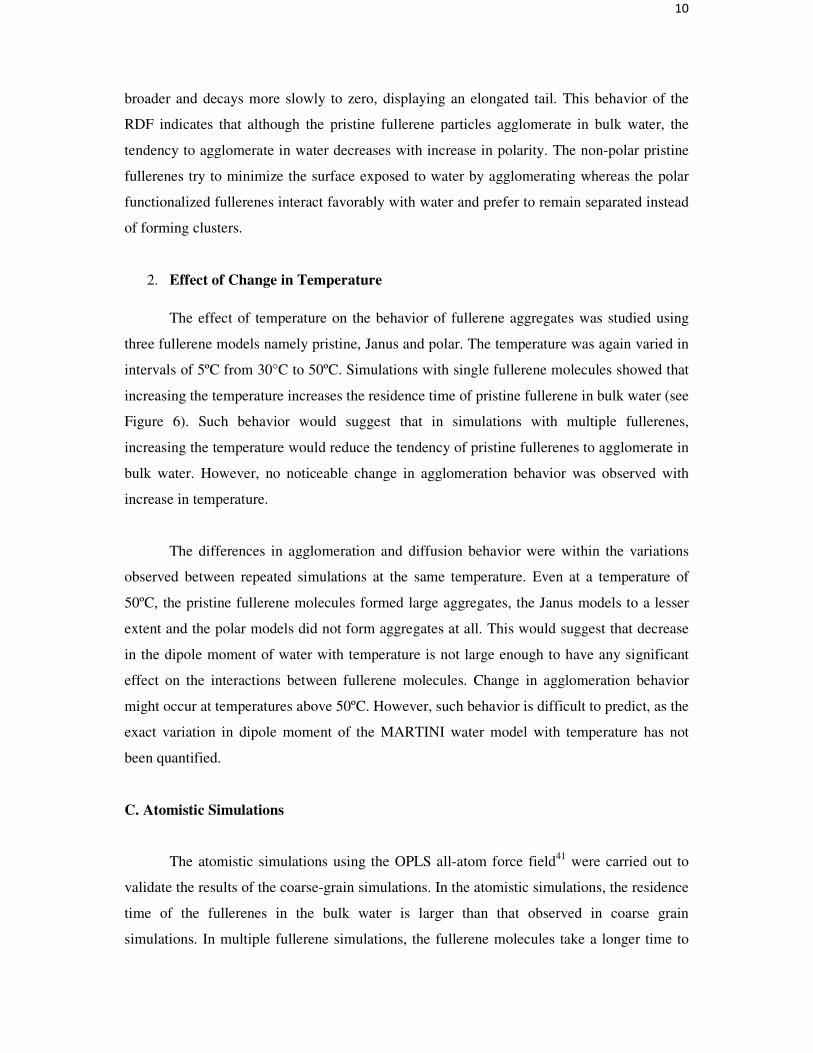
broader and decays more slowly to zero, displaying an elongated tail. This behavior of the
RDF indicates that although the pristine fullerene particles agglomerate in bulk water, the
tendency to agglomerate in water decreases with increase in polarity. The non-polar pristine
fullerenes try to minimize the surface exposed to water by agglomerating whereas the polar
functionalized fullerenes interact favorably with water and prefer to remain separated instead
of forming clusters.
2. Effect of Change in Temperature
The effect of temperature on the behavior of fullerene aggregates was studied using
three fullerene models namely pristine, Janus and polar. The temperature was again varied in
intervals of 5ºC from 30°C to 50ºC. Simulations with single fullerene molecules showed that
increasing the temperature increases the residence time of pristine fullerene in bulk water (see
Figure 6). Such behavior would suggest that in simulations with multiple fullerenes,
increasing the temperature would reduce the tendency of pristine fullerenes to agglomerate in
bulk water. However, no noticeable change in agglomeration behavior was observed with
increase in temperature.
The differences in agglomeration and diffusion behavior were within the variations
observed between repeated simulations at the same temperature. Even at a temperature of
50ºC, the pristine fullerene molecules formed large aggregates, the Janus models to a lesser
extent and the polar models did not form aggregates at all. This would suggest that decrease
in the dipole moment of water with temperature is not large enough to have any significant
effect on the interactions between fullerene molecules. Change in agglomeration behavior
might occur at temperatures above 50ºC. However, such behavior is difficult to predict, as the
exact variation in dipole moment of the MARTINI water model with temperature has not
been quantified.
C. Atomistic Simulations
The atomistic simulations using the OPLS all-atom force field41
were carried out to
validate the results of the coarse-grain simulations. In the atomistic simulations, the residence
time of the fullerenes in the bulk water is larger than that observed in coarse grain
simulations. In multiple fullerene simulations, the fullerene molecules take a longer time to

11
agglomerate and transfuse into the bilayer. This speeding up of dynamic properties is well
known and has been observed extensively in other multi-scale simulations45,46
. This has been
attributed to the softer coarse-grained potentials reducing local friction and energy barriers,
thereby accelerating diffusion47
. However, the trends and behaviors observed in the coarse-
grained simulations were qualitatively reproducible in the atomistic runs. Hence, the coarse-
grained MARTINI parametrization of DSPC34
, fullerene35
and water36
can be considered
reasonably accurate for the purpose of this study.
D. Janus-Particle Diffusion
The translocation of fullerenes from bulk water into the membrane was studied as a
function of fullerene models, temperature and fullerene concentration. For fullerenes to be
effective as drug carriers, they must be able to pass through the membrane. However, the
complete diffusion of fullerenes through the membrane was not observed in any model tested.
The fullerene model that showed the most promise was the Janus particle. In the Janus
particle, one face of the sphere is polar with particle type P5 while the other face is non-polar
with particle type C1. This Janus particle diffuses from the bulk water into the membrane and
rests at the tip of the bilayer. The polar hemisphere faces the lipid head-groups while the non-
polar hemisphere faces the lipid tails. Figure 8 shows the z-coordinate of the fullerene
molecule with membrane head-groups represented by dotted black lines. The total width of
the bilayer is around 5 nm and the fullerene molecule resides at a distance of 2.4 nm from the
bilayer center.
This orientation behavior is similar to that observed by Ding et al.48
and Gao et al.49
in
their experimental studies on Janus particles. The quick diffusion across the membrane and
the residence close to the bilayer head-group makes it the most promising model for
development as a drug carrier. The behavior of Janus fullerenes after their agglomerates
migrate inside the membrane is also interesting. Figure 9 provides a snapshot of the
fullerenes post-internalization. The agglomerate does not break up as pristine models do, but
transforms into a planar form while residing close to the head-groups.

12
IV. CONCLUSIONS
The readiness of the fullerene molecules to leave the aqueous bulk phase and enter the
lipid bilayer suggests that they can be used as drug carriers. However, the hydrophobic nature
of the fullerene molecules makes their escape from within the bilayer energetically
unfavorable. The 1D- PMF calculations in Figure 4 and similar calculations by Bedrov et al.27
and D’Rozario et al.31
offer weight to this argument. Functionalizing the surface of the
fullerene with polar groups can reduce the strength of lipid tail - C60 interactions. However,
polar functionalization can also have the opposite effect of not allowing fullerene to enter the
membrane in the first place. Janus particles50
present the most promising solution to
balancing these opposite forces and achieving complete migration. Further work on Janus
fullerenes can involve conducting atomistic simulations to tune the exact strength and spatial
orientation of polar surface functional groups in order to achieve complete migration.
Merely increasing the concentration of fullerene in the extracellular domain has been
found to be insufficient to cause complete fullerene migration. A larger concentration of
extracellular fullerene might cause complete migration; however, this hypothesis was not
tested above 15 C60 molecules. Work can be aimed at calculating the extracellular
concentration large enough to ensure complete migration by passive diffusion. Further efforts
can also be directed at a comparative study on the effectiveness of fullerene vis-à-vis other
drug carriers such as cell penetrating peptides51,52
. Studies can also include fullerene models
conjugated with the associated drug molecules.

13
REFERENCES
1 G. Karp, Cell and Molecular Biology : Concepts and Experiments, 6th Edt. (John Wiley &
Sons, 2009), pp. 117–119.
2 O. Mouritsen and K. Jørgensen, Pharm. Res. 15, 1507 (1998).
3 M. Bretscher, Science 181, 622 (1973).
4 S.J. Singer and G.L. Nicolson, Science 175, 720 (1972).
5 A. Kusumi and Y. Sako, Curr. Opin. Cell Biol. 8, 566 (1996).
6 R. Langer and N. Peppas, AIChE J. 49, 2990 (2003).
7 G.P.H. Dietz and M. Bähr, Mol. Cell. Neurosci. 27, 85 (2004).
8 P. Pàmies and A. Stoddart, Nat. Mater. 12, 957 (2013).
9 Z.P. Xu, Q.H. Zeng, G.Q. Lu, and A.B. Yu, Chem. Eng. Sci. 61, 1027 (2006).
10 L. Bauer, N. Birenbaum, and G. Meyer, J. Mater. Chem. 14, 517 (2004).
11 C. Barbe, J. Bartlett, L. Kong, K. Finnie, H.Q. Lin, M. Larkin, S. Calleja, A. Bush, and G.
Calleja, Adv. Mater. 16, 1959 (2004).
12 H. Kroto, A. Allaf, and S. Balm, Chem. Rev. 318, 162 (1991).
13 J. Shi, H. Zhang, L. Wang, L. Li, H. Wang, Z. Wang, Z. Li, C. Chen, L. Hou, C. Zhang,
and Z. Zhang, Biomaterials 34, 251 (2013).
14 M.J. Al-Anber, a. H. Al-Mowali, and a. M. Ali, Acta Phys. Pol. A 126, 845 (2014).
15 I. Blazkova, H. Viet Nguyen, M. Kominkova, R. Konecna, D. Chudobova, L. Krejcova, P.
Kopel, D. Hynek, O. Zitka, M. Beklova, V. Adam, and R. Kizek, Electrophoresis 35, 1040
(2014).
16 D. Cai, J. Mataraza, Z. Qin, and Z. Huang, Nat. Methods 2, 449 (2005).
17 D. Pantarotto, R. Singh, D. McCarthy, M. Erhardt, J.-P. Briand, M. Prato, K. Kostarelos,
and A. Bianco, Angew. Chem. Int. Ed. Engl. 43, 5242 (2004).
18 R.S. Ruoff, D.S. Tse, R. Malhotra, and D.C. Lorents, J. Phys. Chem. 97, 3379 (1993).
19 N. Sivaraman and R. Dhamodaran, J. Org. Chem. 57, 6077 (1992).
20 C. Sayes, J. Fortner, W. Guo, and D. Lyon, Nano Lett. 4, 1881 (2004).
21 M. Brettreich and A. Hirsch, Tetrahedron Lett. 39, 2731 (1998).

14
22 R. Partha, L. Mitchell, J. Lyon, P. Joshi, and J. Conyers, ACS Nano 2, 1950 (2008).
23 L. Dugan and D. Turetsky, Proc. Natl. Acad. Sci. U. S. A. 94, 9434 (1997).
24 P. Coppock and J. Kindt, Langmuir 25, 352 (2009).
25 A. Polley, S. Vemparala, and M. Rao, J. Phys. Chem. B 116, 13403 (2012).
26 L. Li and H. Davande, J. Phys. Chem. B 111, 4067 (2007).
27 D. Bedrov and G. Smith, J. Phys. Chem. B 112, 2078 (2008).
28 R. Qiao, A. Roberts, A. Mount, S. Klaine, and P. Ke, Nano Lett. 7, 614 (2007).
29 M.J. Stevens, J. Chem. Phys. 121, 11942 (2004).
30 X. Shi, Y. Kong, and H. Gao, Acta Mech. Sin. 24, 161 (2008).
31 R.S.G. D’Rozario, C.L. Wee, E.J. Wallace, and M.S.P. Sansom, Nanotechnology 20,
115102 (2009).
32 J. Wong-Ekkabut, S. Baoukina, W. Triampo, I.-M. Tang, D.P. Tieleman, and L. Monticelli,
Nat. Nanotechnol. 3, 363 (2008).
33 A.H. De Vries, S.J. Marrink, J. Risselada, D.P. Tieleman, and S. Yefimov, J. Phys. Chem.
B 111, 7812 (2007).
34 S.J. Marrink, A.H. de Vries, and A.E. Mark, J. Phys. Chem. B 108, 750 (2004).
35 L. Monticelli, J. Chem. Theory Comput. 8, 1370 (2012).
36 S.O. Yesylevskyy, L. V. Schäfer, D. Sengupta, and S.J. Marrink, PLoS Comput. Biol. 6, 1
(2010).
37 H.J.C. Berendsen, J.P.M. Postma, W.F. van Gunsteren, a. DiNola, and J.R. Haak, J. Chem.
Phys. 81, 3684 (1984).
38 D. Van Der Spoel, E. Lindahl, B. Hess, G. Groenhof, A.E. Mark, and H.J.C. Berendsen, J.
Comput. Chem. 26, 1701 (2005).
39 W. Humphrey, A. Dalke, and K. Schulten, J. Mol. Graph. 14, 33 (1996).
40 J. Hub, B. de Groot, and D. Van Der Spoel, J. Chem. Theory Comput. 6, 3713 (2010).
41 W. Jorgensen, J. Am. Chem. Soc. 118, 11225 (1996).
42 J. Ulmschneider and M. Ulmschneider, J. Chem. Theory Comput. 108, 16264 (2009).
43 J. Domański, P.J. Stansfeld, M.S.P. Sansom, and O. Beckstein, J. Membr. Biol. 236, 255
(2010).

15
44 D. Kang, J. Dai, and J. Yuan, J. Chem. Phys. 135, (2011).
45 K.R. Prasitnok and M. Wilson, Phys. Chem. Chem. Phys. 15, 17093 (2013).
46 P.K. Depa and J.K. Maranas, J. Chem. Phys. 126, 054903 (2007).
47 P. Depa, C. Chen, and J.K. Maranas, J. Chem. Phys. 134, 014903 (2011).
48 H. Ding and Y. Ma, Nanoscale 4, 1116 (2012).
49 Y. Gao and Y. Yu, J. Am. Chem. Soc. 135, 19091 (2013).
50 S. Granick, S. Jiang, and Q. Chen, Phys. Today 62, 68 (2009).
51 M. Mazel, P. Clair, and C. Rousselle, Anticancer. Drugs 12, 107 (2001).
52 R. Rennert, I. Neundorf, and A.G. Beck-Sickinger, in Methods Mol. Biol. (2009), pp. 389–
403.

16
TABLES
Table I: Details of the unrestrained MD simulations performed
No. of
Fullerene
molecules
Fullerene
Models
Temperature
(°C)
1 Full-polar 30;35;40;45;50
1 Full-nonpolar 30;35;40;45;50
1 Janus 30;35;40;45;50
5 Full-polar 30;35;40;45;50
5 Full-nonpolar 30;35;40;45;50
5 Janus 30;35;40;45;50
5 All 30
10 All 30
15 All 30
1 All 30
17
FIGURES
Figure 1: Various functionalized fullerene models with non-polar beads in blue and polar
beads in red

18
Figure 2: Snapshots of the initial configurations of the membrane with 1 fullerene (left)
and 5 fullerenes (right)

19
Figure 3: Graph detailing the average z-coordinate of the fullerene models as a function
of time. The bilayer head-groups are shown as black dotted lines.

20
Figure 4: Graph showing the 1-dimensional PMF of the fullerene models as a function of
z-coordinate across the membrane. Dashed vertical lines indicate the head-groups of the
membrane. The dotted line indicates the bilayer center.

21
Figure 5: Average residence time of single fullerene molecules in bulk water as a
function of temperature

22
Figure 6: C60 - C60 RDF graphs of pristine fullerenes at 5 ns (left) and at 40 ns (right)

23
Figure 7: C60 - C60 RDF graphs of fullerene models in bulk solvent. (a) Pristine,
(b) 4random, (c) 4corner, (d) 8random, (e) Jauns, (f) 12random, (g) 12corner, (h) fullpolar

24
Figure 8: Graph showing the z-coordinate of Janus fullerene as a function of time with
the membrane head-groups shown as black dotted lines.

25
Figure 9: Snapshot of Janus fullerenes post-internalization. The lipid tails are shown in
cyan and head-groups in green. The polar C60 beads are shown in red and non-polar in
yellow. Water beads are scaled down and shown as pink specks for clarity.