Embed Size (px)
Citation preview
COASTAL HAZARDS, CLIMATE CHANGE AND ADAPTATION,
ROCHES BEACH, LAUDERDALECLARENCE CITY, TASMANIA
James CarleyWater Research Laboratory
University of New South Wales
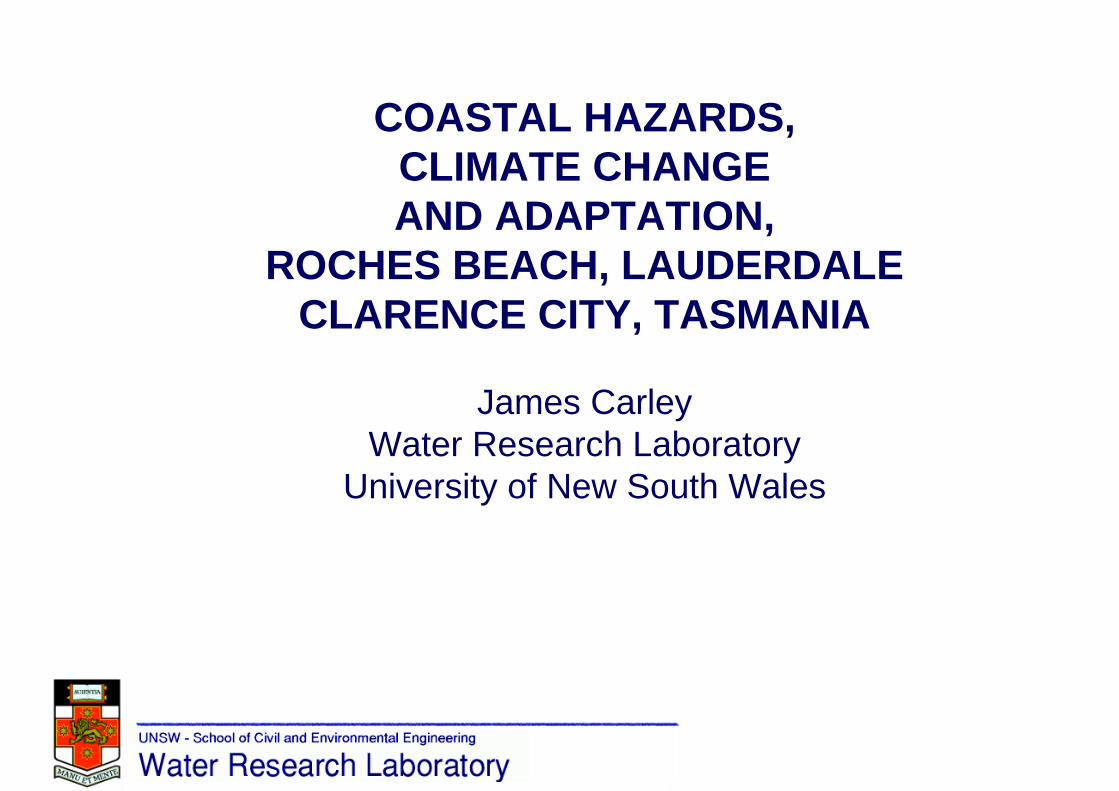
WRL -THE ORGANISATION• Part of UNSW• Established at Manly Vale 1959• Birthplace of coastal engineering in Australia
ACTIVITIES• Teaching• Research• Commercial consulting by full time project staff
PROJECT METHODS• Physical Modelling• Numerical Modelling• Fieldwork• Desktop Design
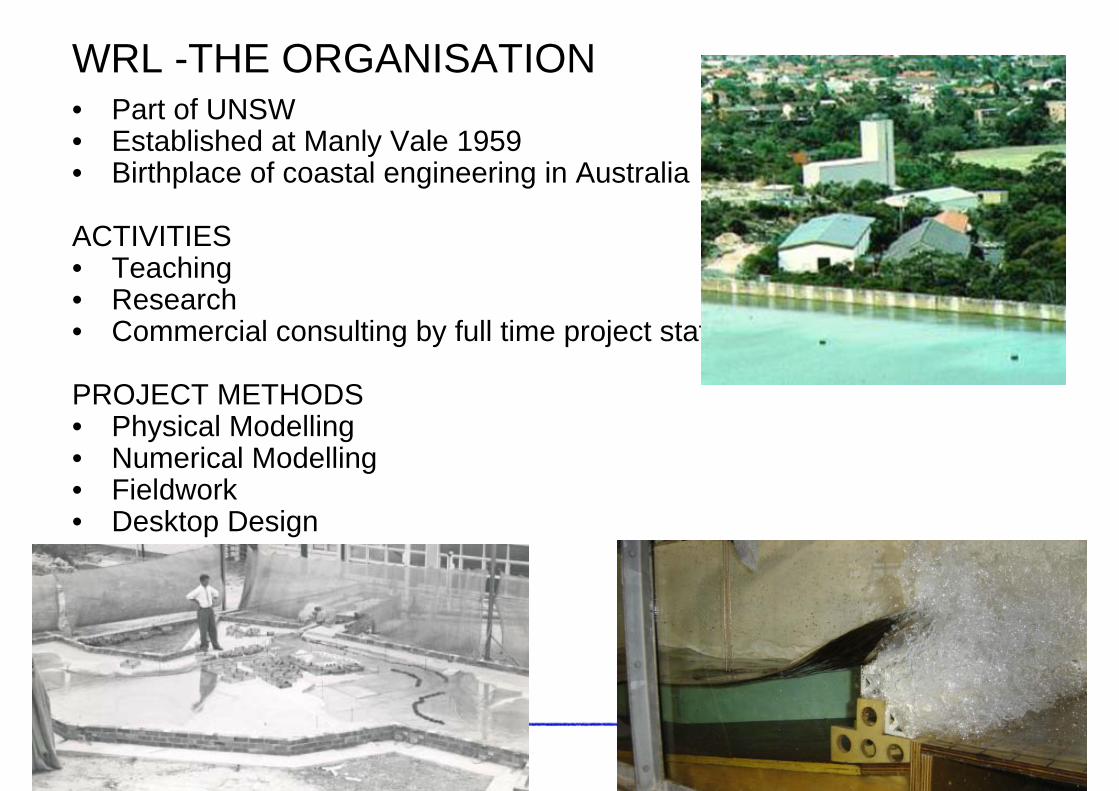
Coastal hazards are not new
Lauderdale CanalEntrance1924 to 2008

Roches Beach Studies
Roches Beach Studies
WRL studies• 1988: Pitt+Sherry and Prof Doug Foster• 2008: Clarence coastal study incl adaptation• 2009: Beach scraping for Cremorne & Roches• 2011: Hazard line reassessment• 2011: Trial groyne investigation• 2011: Storm damage assessment

Roches Beach Studies
Other studies• 1959: Prof J L Davies• 2006: Chris Sharples (Tasmania wide)• 2006: Gerry Byrne• 2006: Bill Cromer• 2007: Chris Sharples (Roches Beach)• 2007: John Hunter (Hobart extreme sea levels)• Ongoing: Chris Sharples UTAS

WRL 2008 studyCoastal hazard lines and options for entire Clarence LGA developed coast
Technical reference group:Mark Hemer (CSIRO)John Hunter (UTAS)Chris Sharples (UTAS)

Key Coastal Hazardsand Processes
Key hazards (out of ~10)• Erosion• Inundation
• Groundwater
Key coastal processes (out of ~10)• Waves• Water levels

9
Wave buoys
CAPESORELLWAVE BUOY
EDENWAVEBUOY
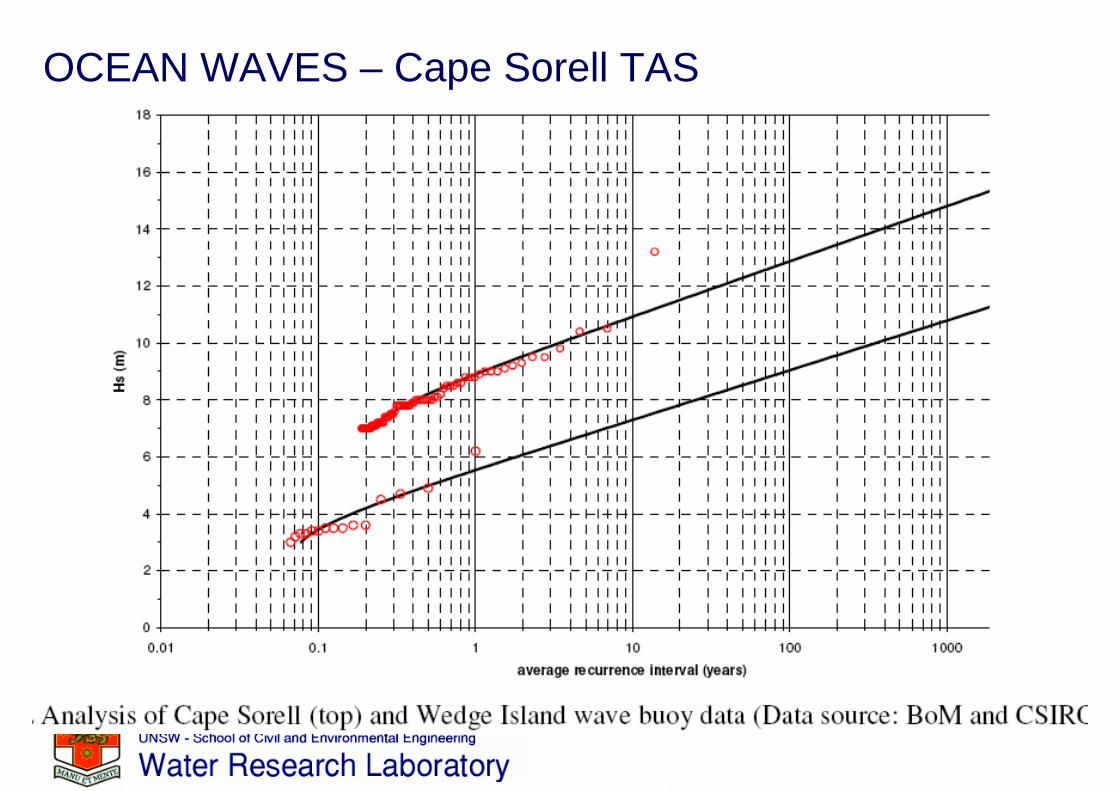
OCEAN WAVES – Cape Sorell TAS

ERA-40 DIRECTIONALWAVE CLIMATE
0
45
90
135
180
225
270
315
WAVE DIRECTION
5 6 7 8 9 10 11 12 13Hs (m)
TASMANIAHs from C-ERA-40DIRECTION from ERA-40ERA40 142.5E 47.5S1957 to 2002 (45 years)
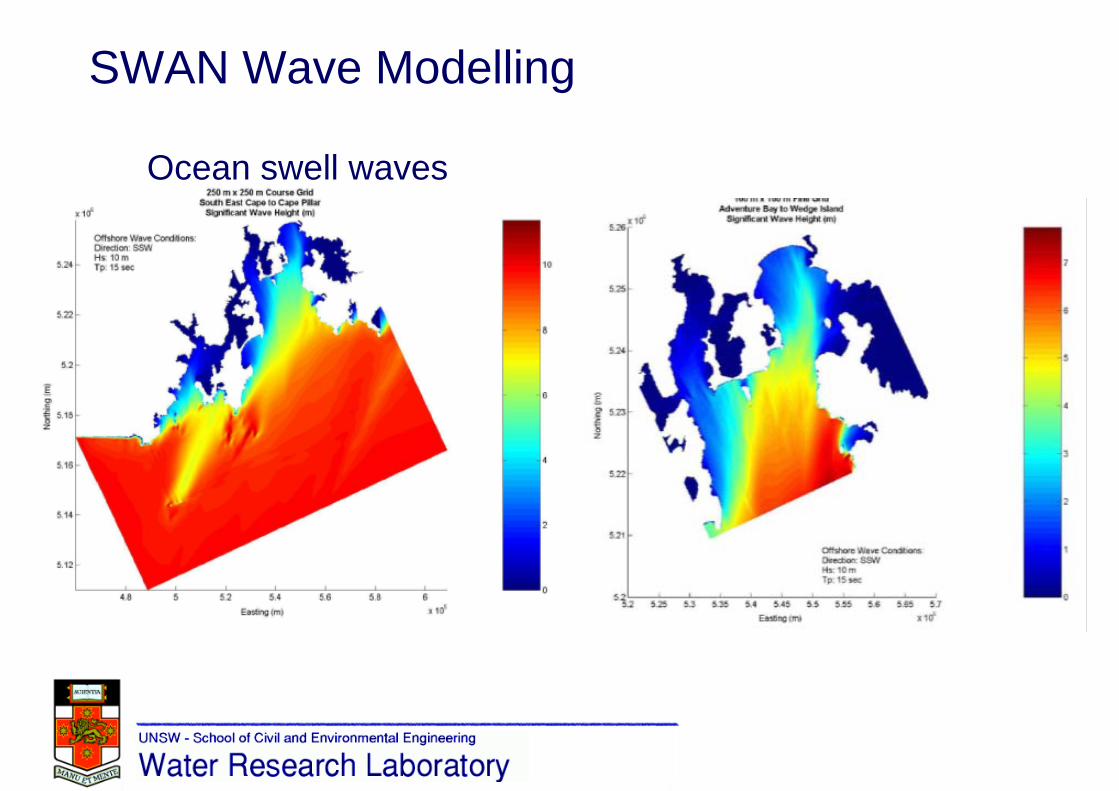
SWAN Wave Modelling
Ocean swell waves
13
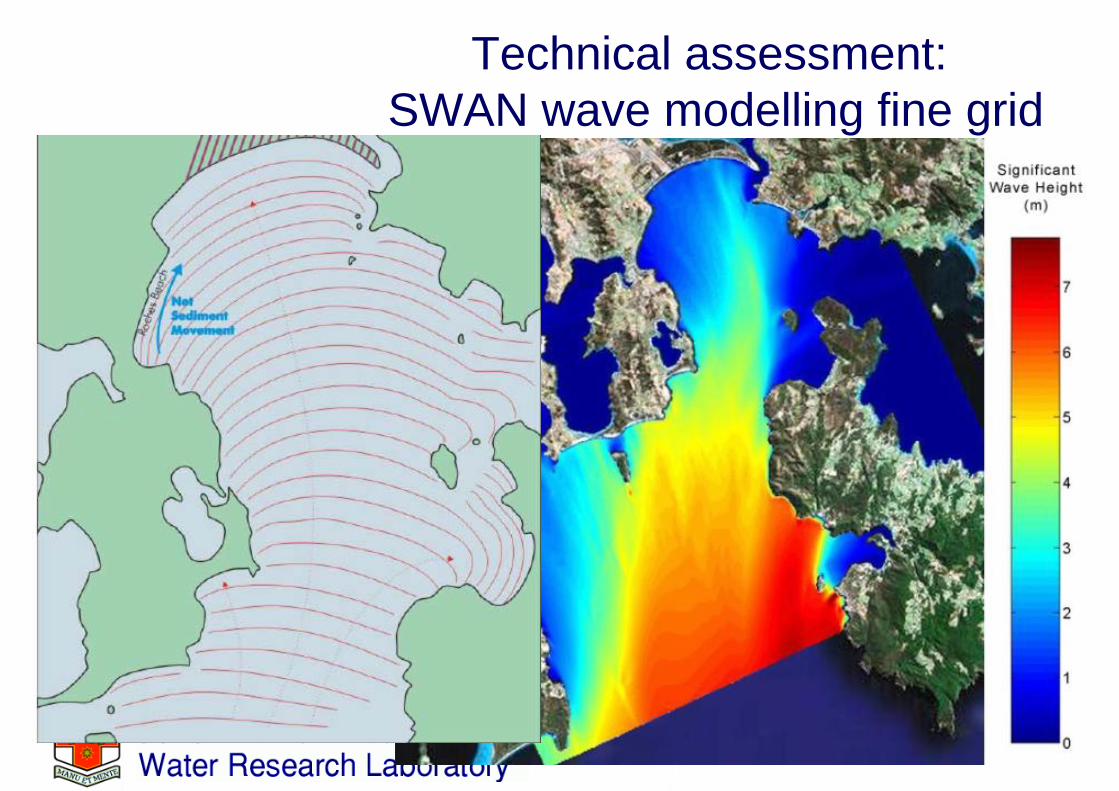
Technical assessment: SWAN wave modelling fine grid

SWAN output

Wind waves
0.1 1 10 100 1000 10000AVERAGE RECURRENCE INTERVAL (years)
0
10
20
30
40
50
60
70
80
90
100
WIN
D S
PE
ED
(m/s
for 3
sec
ond
gust
)
AS 1170-2:2002DIRECTIONAL MULTIPLIER = 1
HOBART REGION A - ANY DIRECTION
0
20
40
60
80
100
120
140
160
180
knot
s

Present day water levelsTide, storm surge, but not local waves
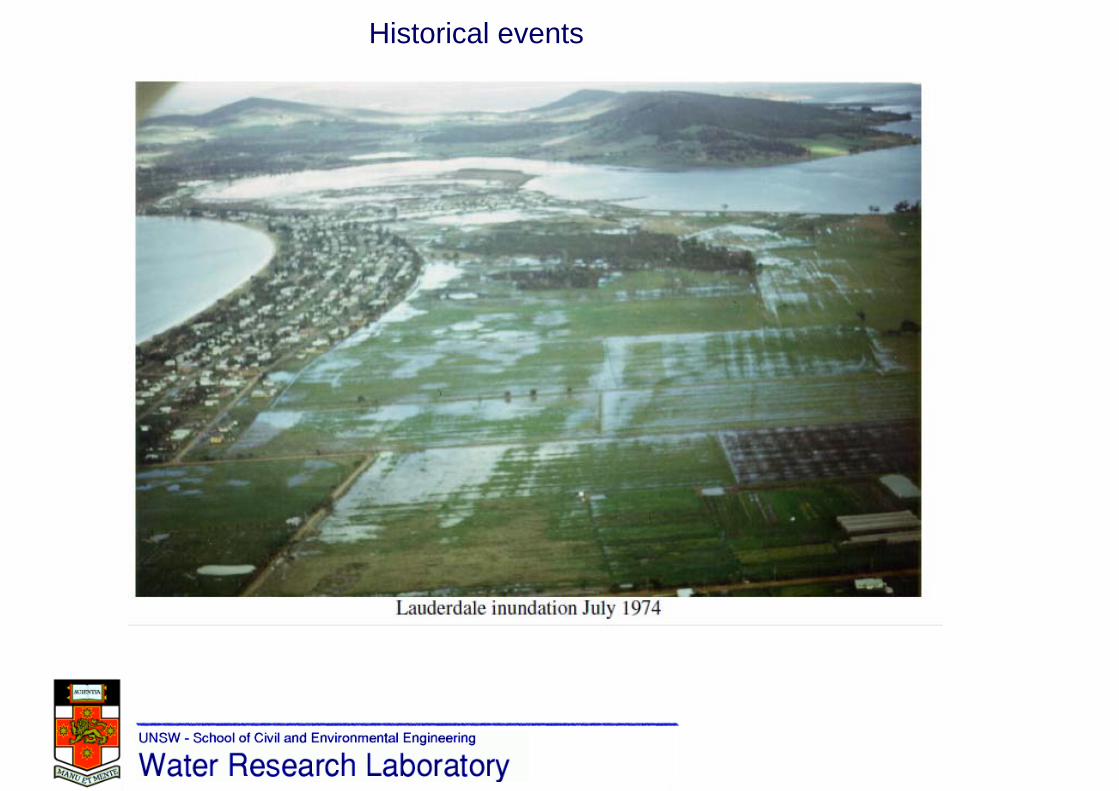
Historical events
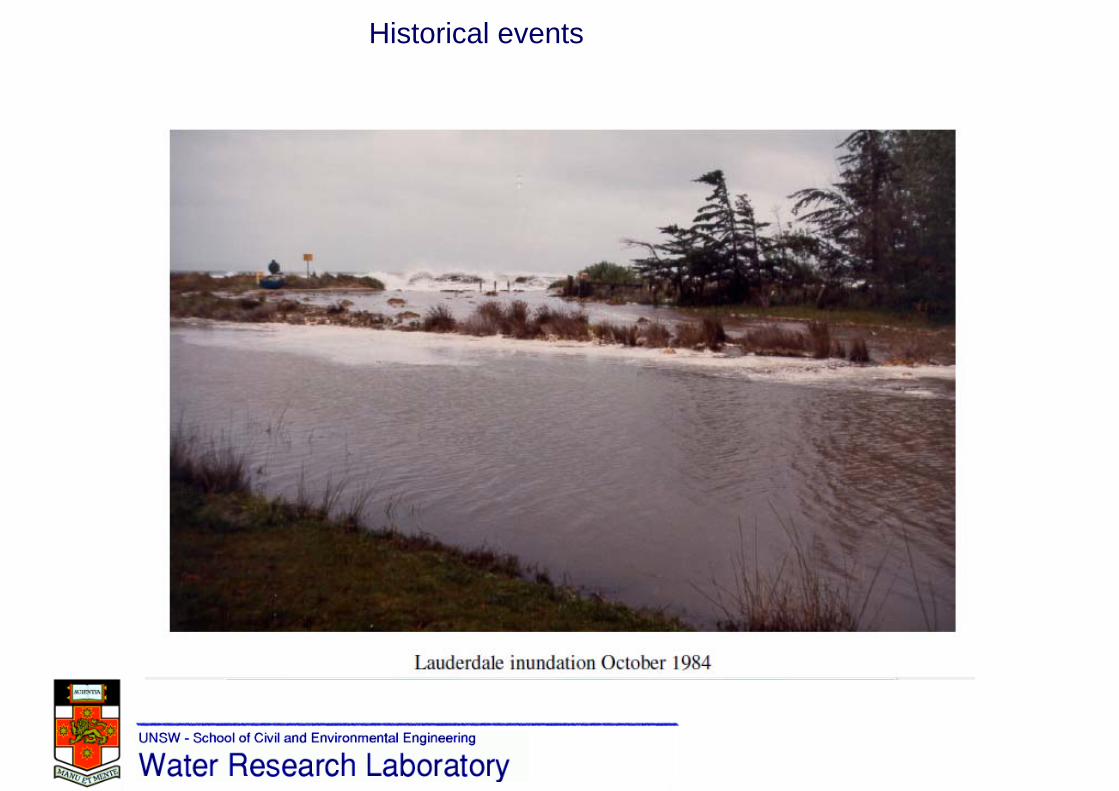
Historical events

IPCC (NCCOE, 2004) Sea level rise projections
SEA LEVEL RISE for ~21000.9 m from NCCOE (2004) SLR curves based on IPCC (2001)7 m IPCC (2007) for total melting of the Greenland ice sheet 70 m if all the world’s ice sheets were to melt (GACGC, 2006)

Sea level rise scenarios adoptedMost states (QLD, NSW, VIC, SA, WA) have adoptedSea level rise for planning to 2100 of 0.8 to 1.0 m
Year and Sea Level Rise relative to 1990 (m)
SLR Scenario 2050 2100
“Mid” range scenario 0.2 0.4
“High” range scenario 0.3 0.9

WRL 2008 coastal hazard lines and areasDue to the study covering most of Clarence coast,Single values were used for setback lines and inundation for Roches Beach
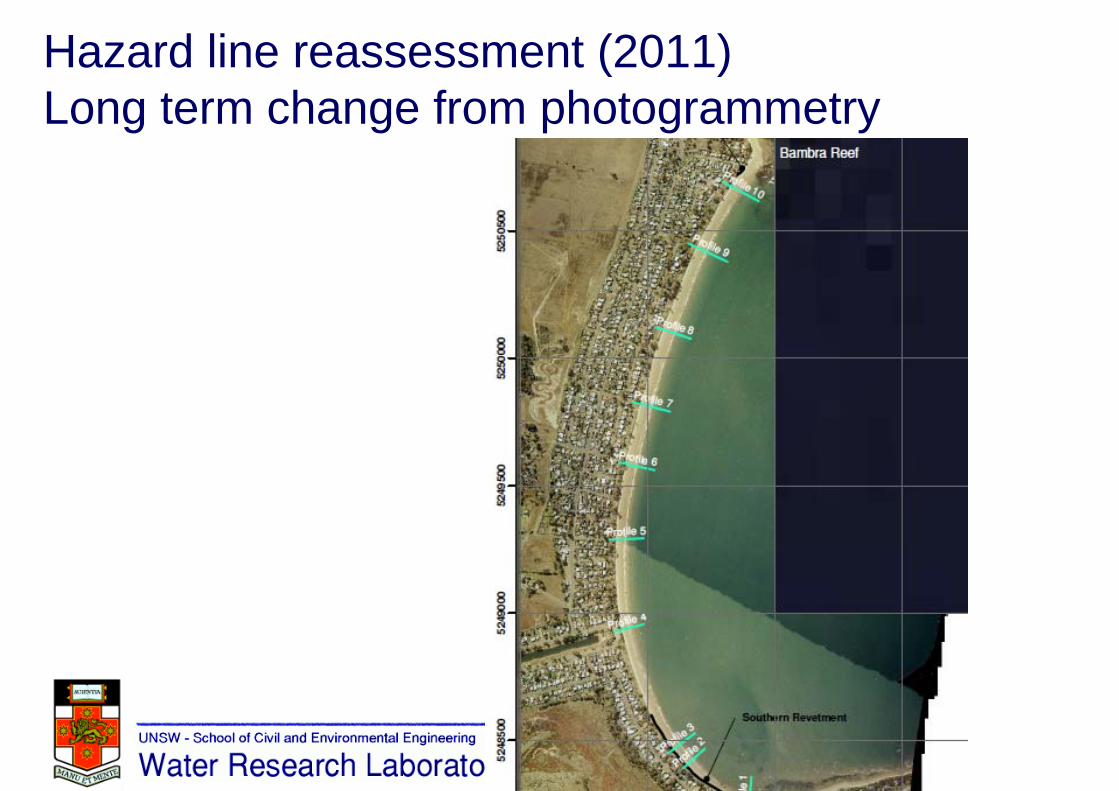
Hazard line reassessment (2011)Long term change from photogrammetry

Wave climate along beach

Sand transport (northward)
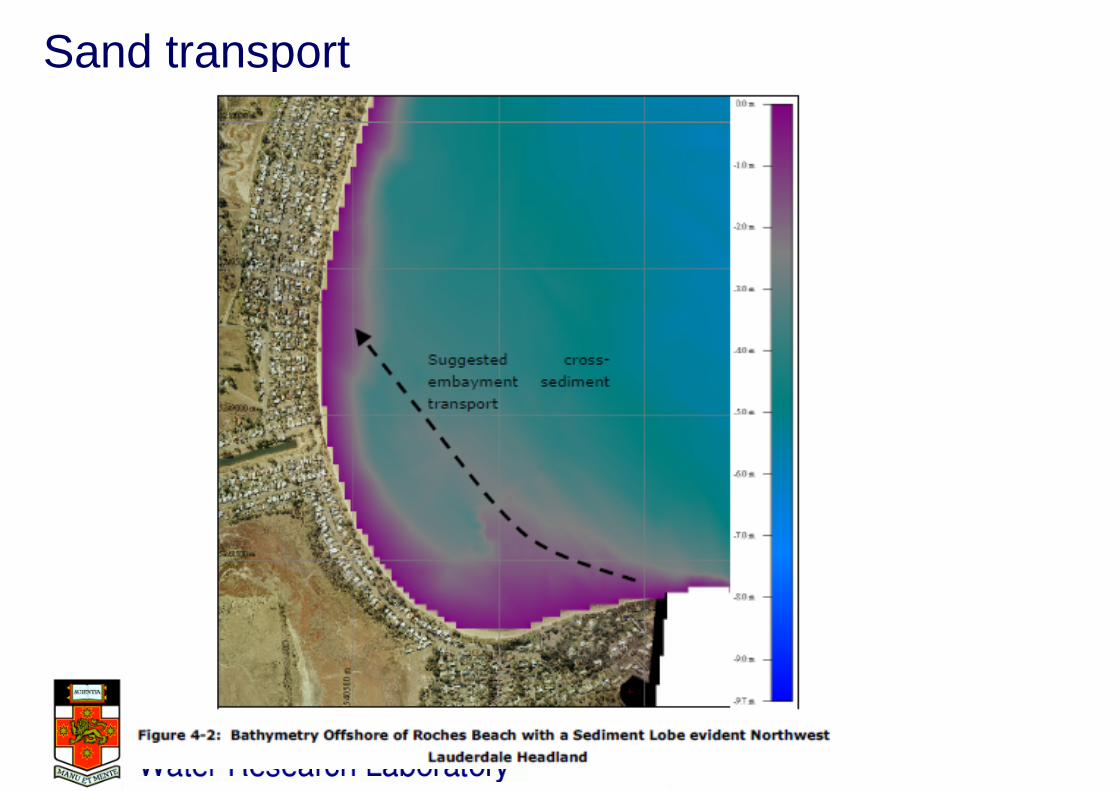
Sand transport

Components of inundation
• Tide• Barometric setup• Wind setup• Wave setup• Wave runup

Inundation components
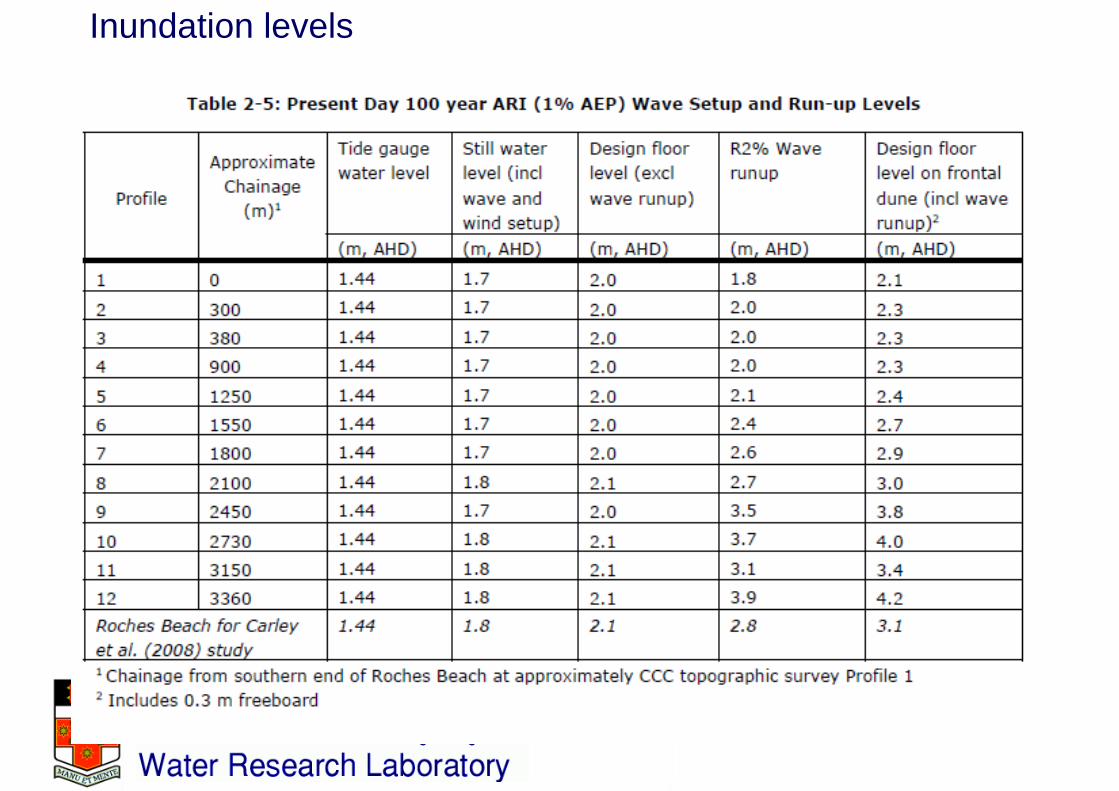
Inundation levels
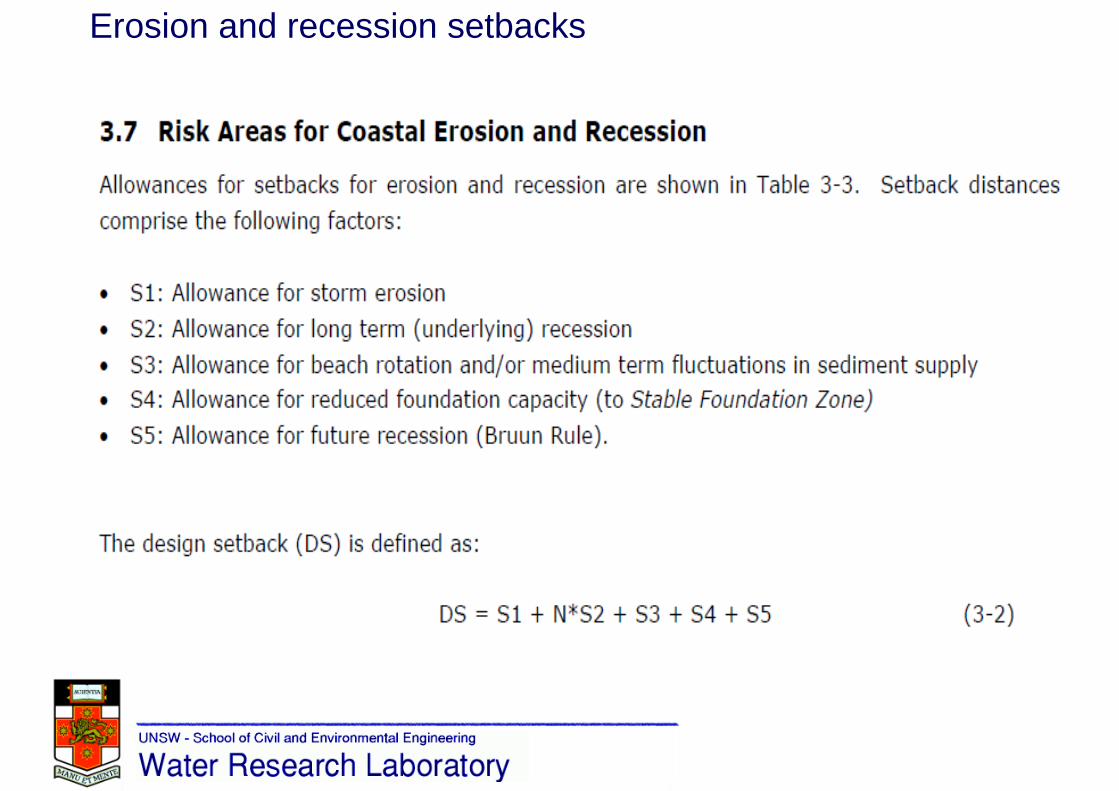
Erosion and recession setbacks
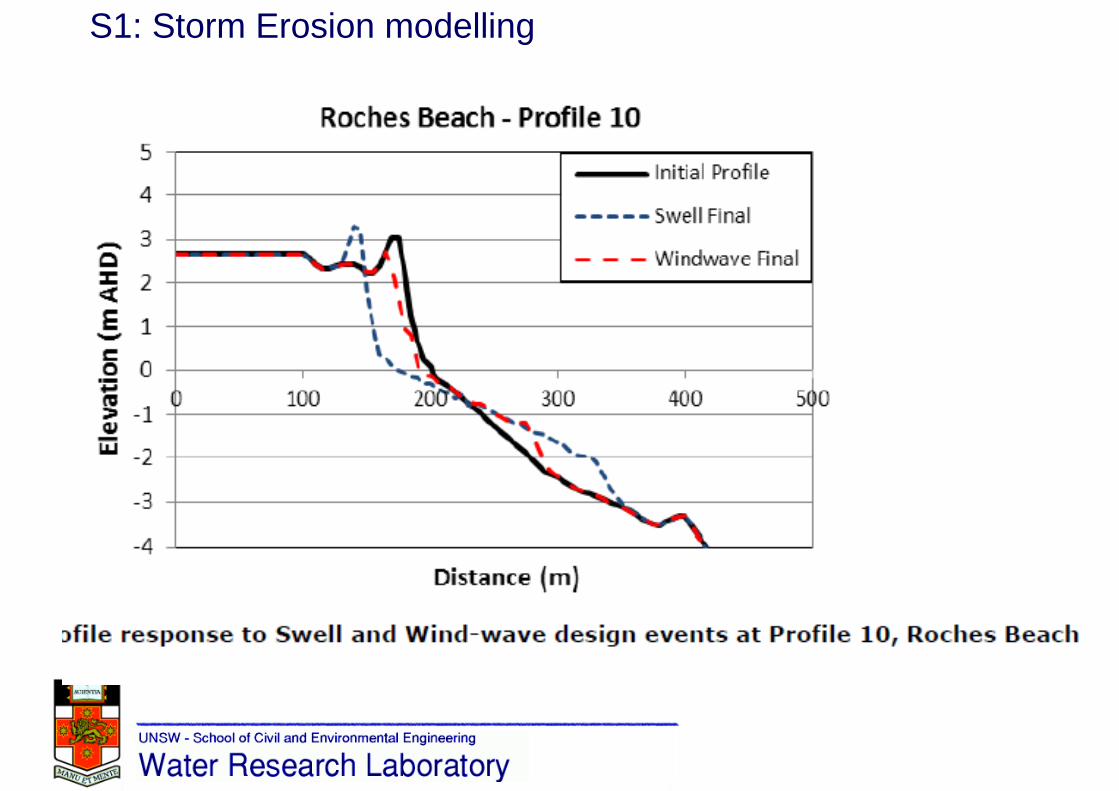
S1: Storm Erosion modelling

S1: Erosion modelling
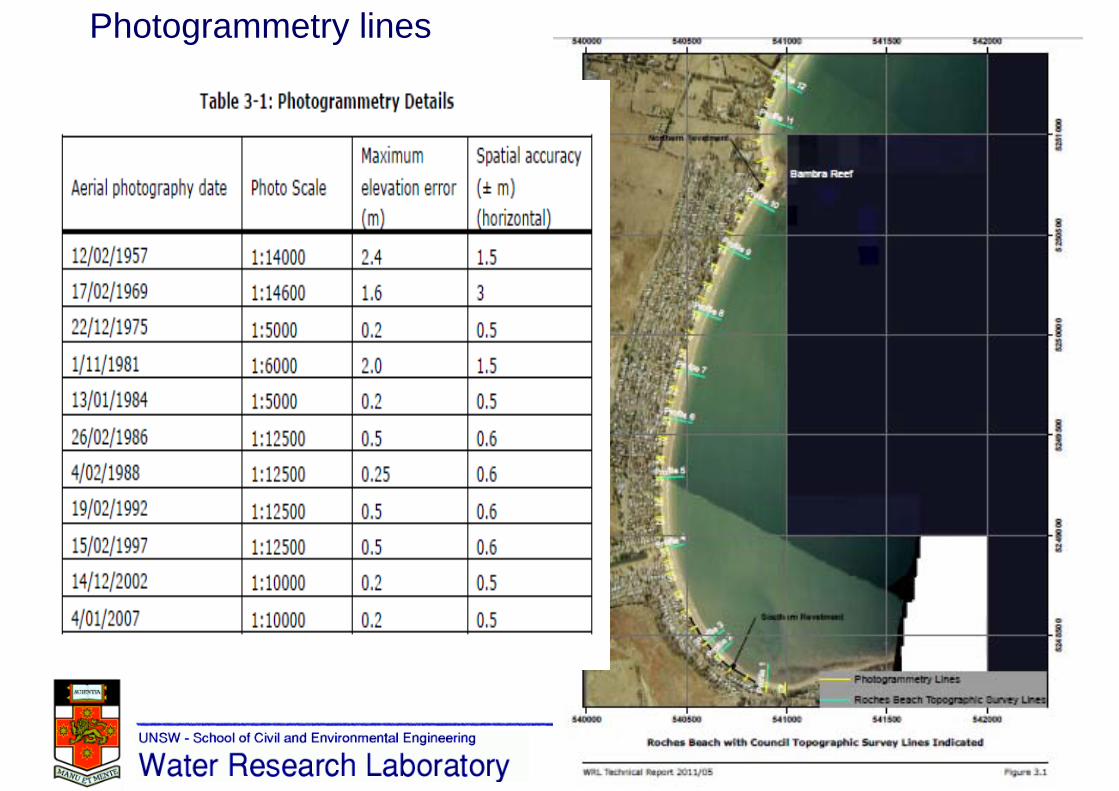
Photogrammetry lines

S2: Underlying recession

S2: Long term change from photogrammetry
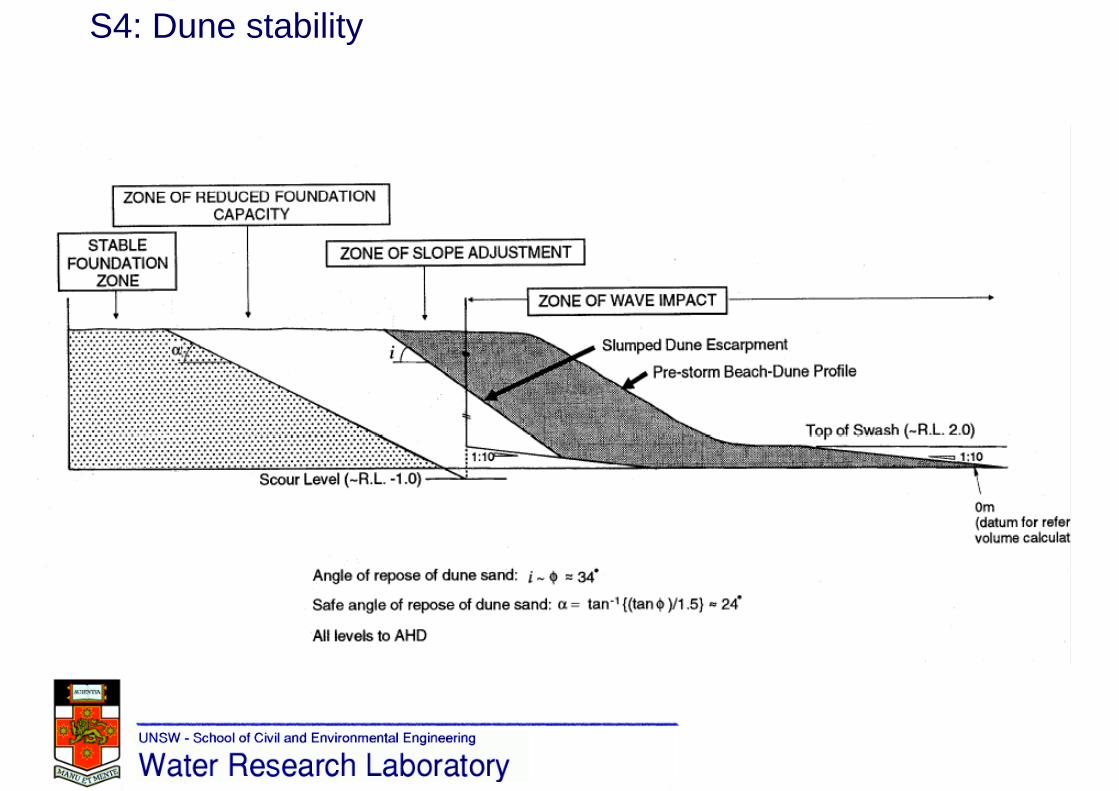
S4: Dune stability

Erosion Hazard Linesfor coastal setback
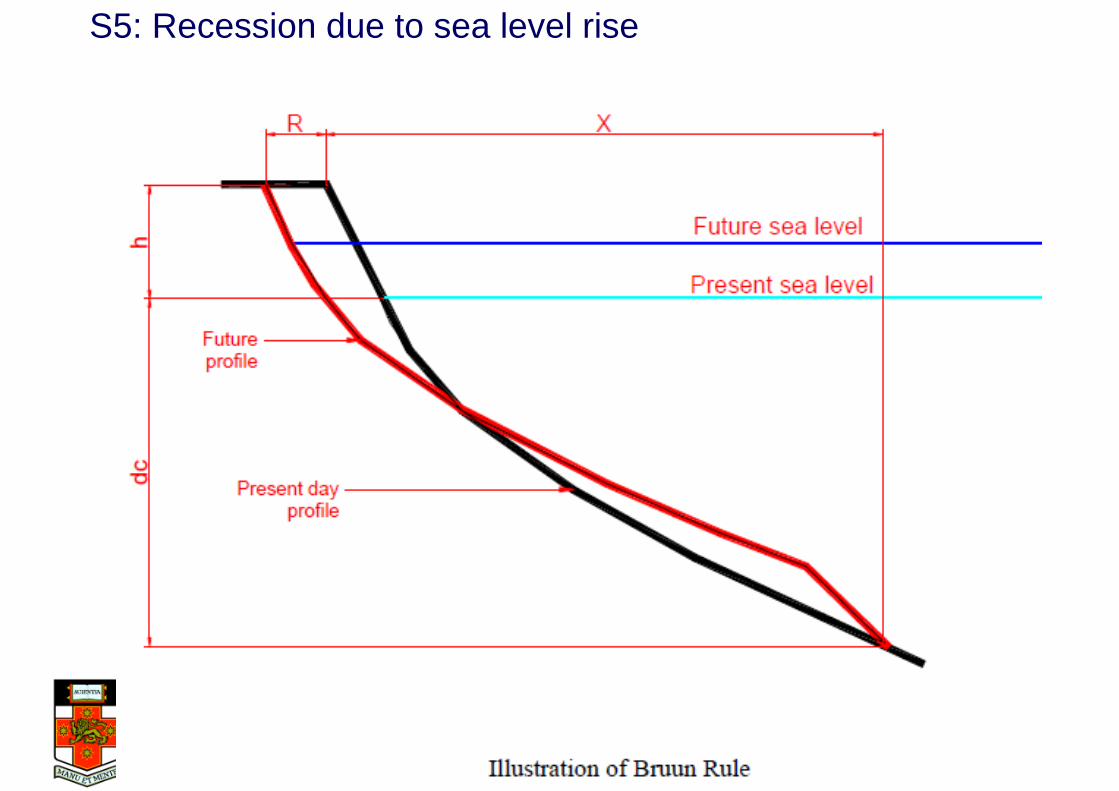
S5: Recession due to sea level rise
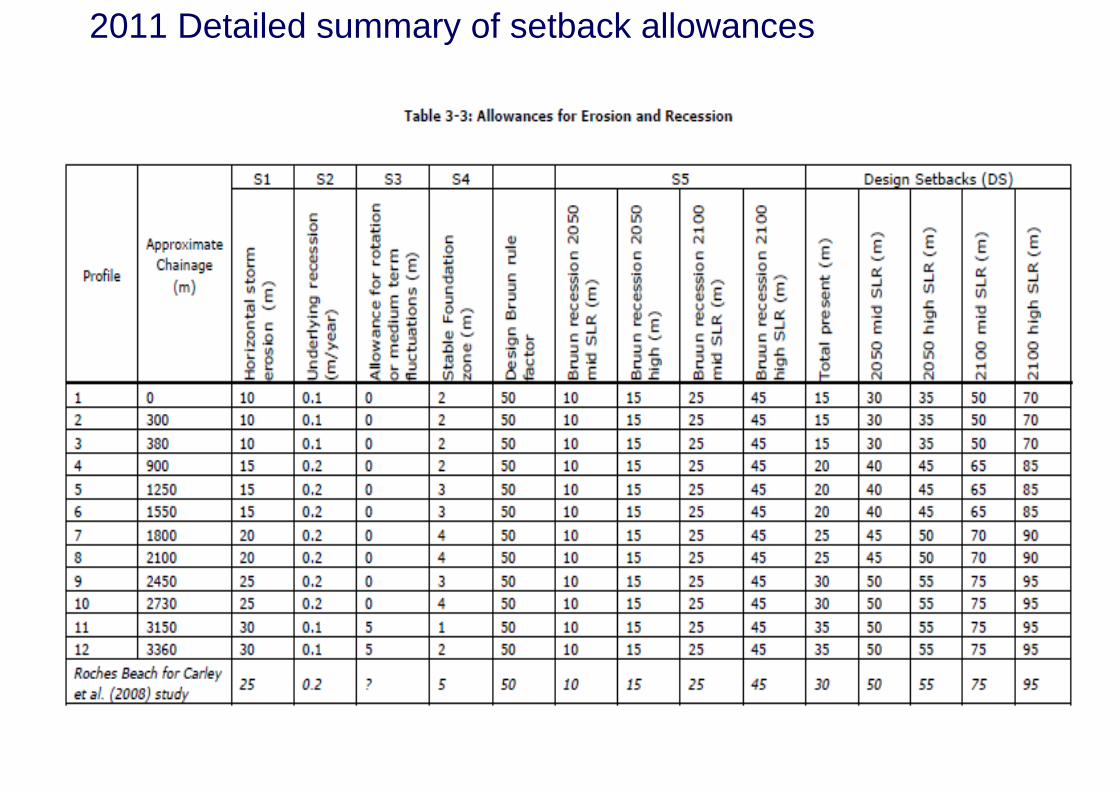
2011 Detailed summary of setback allowances
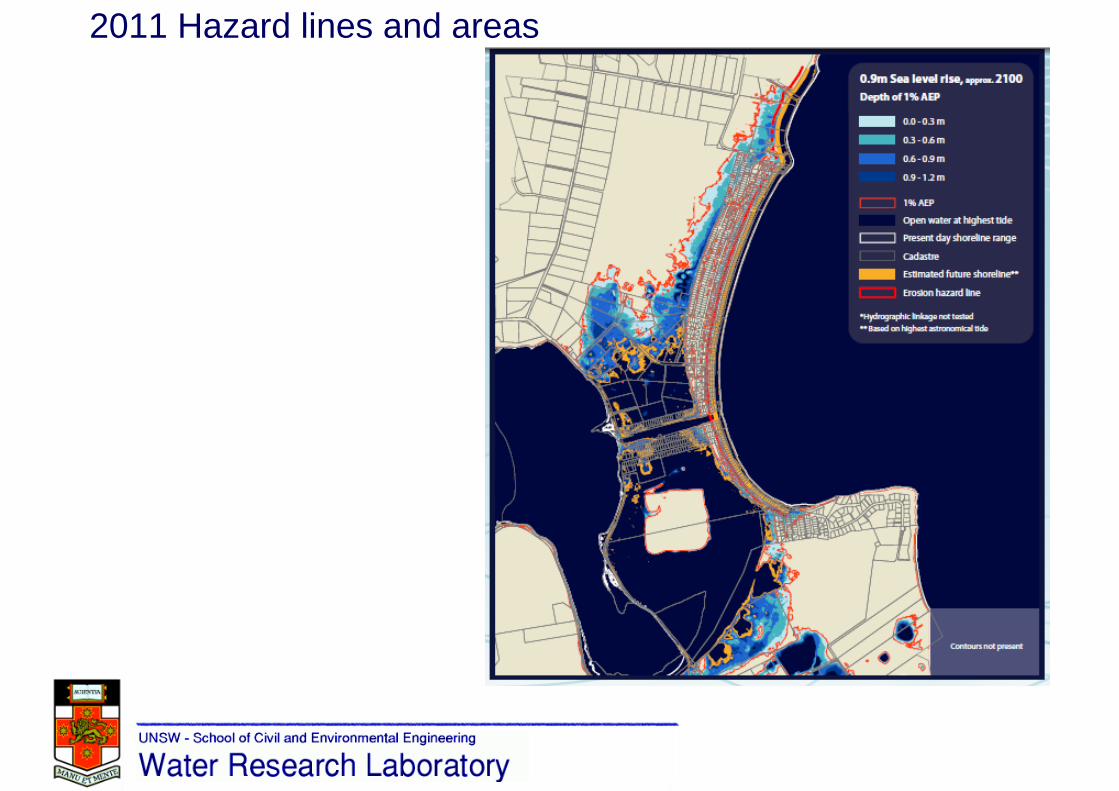
2011 Hazard lines and areas

2011 storms8 June 20119-10 July 2011
1 hour wave height Hs = 10.0 mapproximately a 4 year ARI;
48 hour wave height: Hs = 7.0 m, approximately a 40 year ARI.
Site visit by Dr Tom ShandFrom WRL
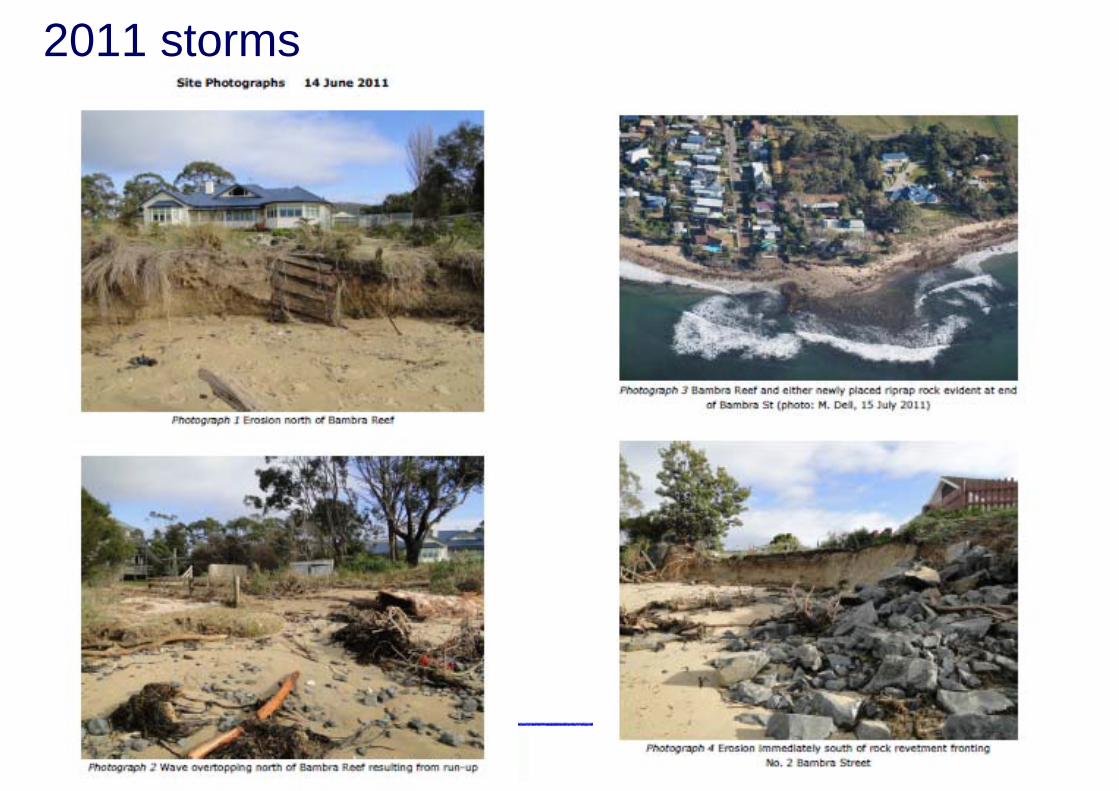
2011 storms
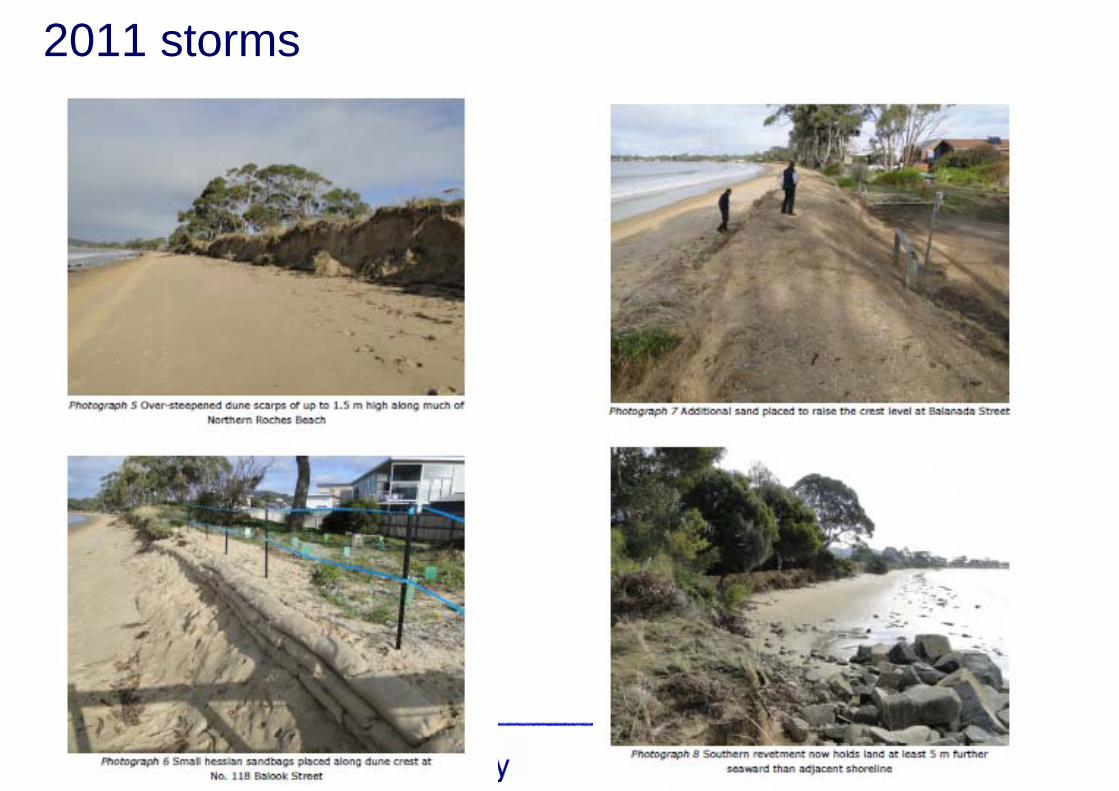
2011 storms

2011 storms
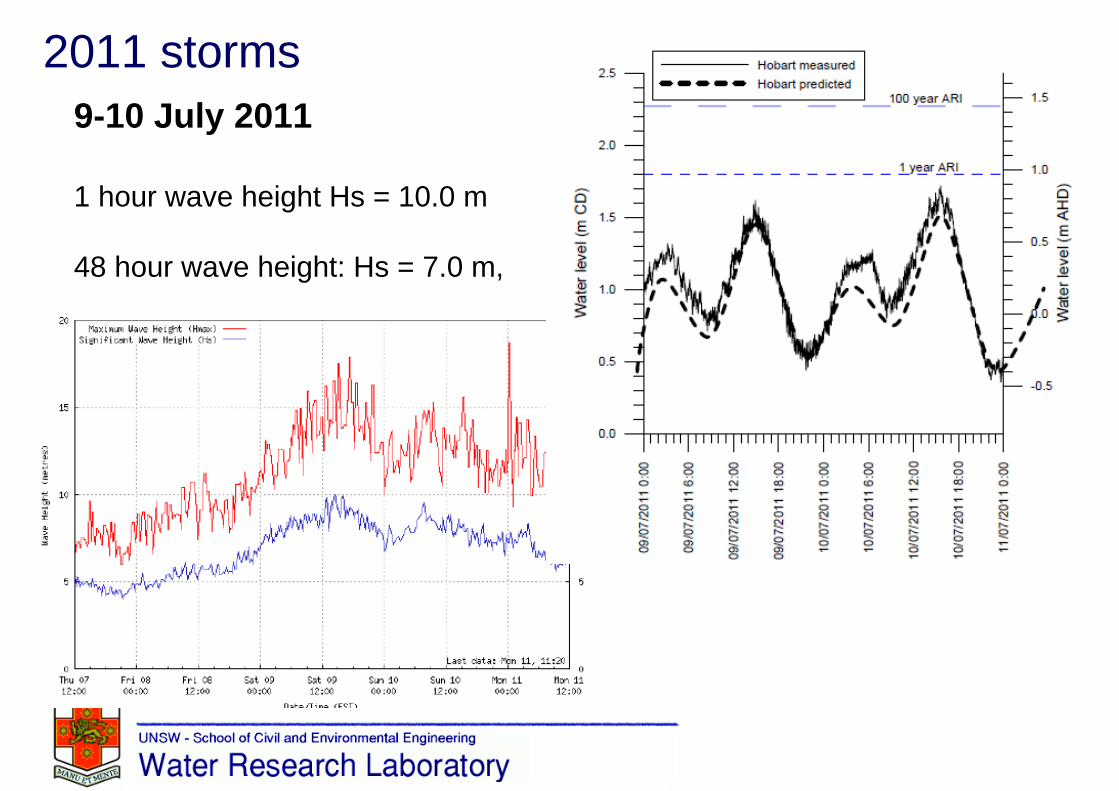
2011 storms9-10 July 2011
1 hour wave height Hs = 10.0 m
48 hour wave height: Hs = 7.0 m,
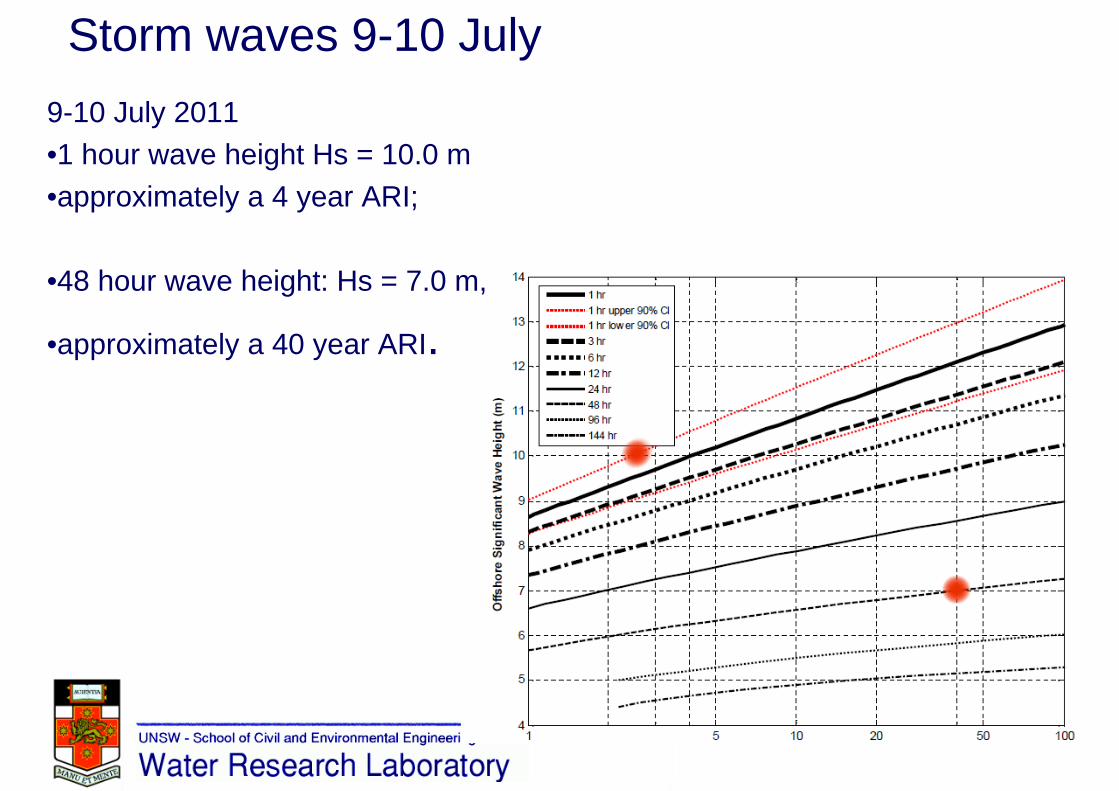
Storm waves 9-10 July9-10 July 2011•1 hour wave height Hs = 10.0 m•approximately a 4 year ARI;
•48 hour wave height: Hs = 7.0 m,
•approximately a 40 year ARI.

Water levels 9-10 July 2011
Predicted tide 1.54 m CDMeasured Port of Hobart 1.72 m CD, 0.89 m AHD< 1 year ARI ~0.2 m “storm surge”

Summary / conclusions / discussion
•Rigorous contemporary coastal engineering studies have been undertaken.
•Roches Beach has receded over the last 50 years.
•Erosion, recession, inundation and potential sea level rise are the dominant coastal hazards to consider for planning.
•Numerous feasible adaptation options are available.

The end