Embed Size (px)
Citation preview
Coastal ocean and shelf-sea biogeochemical cycling of trace elements and 1 isotopes: lessons learned from GEOTRACES 2 3 Matthew A. Charette*a, Phoebe J. Lamb, Maeve C. Lohanc, Eun Young Kwond, Vanessa 4 Hatjee, Catherine Jeandelf, Alan M. Shillerg, Gregory A. Cutterh, Alex Thomasi, Philip 5 W. Boydj, William B. Homokyk, Angela Milnel, Helmuth Thomasm, Per S. Anderssonn, 6 Don Porcellio, Takahiro Tanakap, Walter Geibertq, Frank Dehairsr, Jordi Garcia-7 Orellanas 8 9 *corresponding author, [email protected] 10 11 aDepartment of Marine Chemistry and Geochemistry, Woods Hole Oceanographic 12 Institution, Woods Hole, MA 02543 USA 13 14 bDepartment of Ocean Sciences, University of California-Santa Cruz, Santa Cruz, CA 15 95064 USA 16 17 cOcean and Earth Science, National Oceanography Centre, University of 18 Southampton, Southampton SO14 3ZH, United Kingdom 19 20 dResearch Institute of Oceanography, Seoul National University, Seoul 151-742 21 Korea 22 23 eCentro Interdisciplinar de Energia e Ambiente, Inst. de Química, Universidade 24 Federal da Bahia, Salvador, 40170-115 Brazil 25 26 fLEGOS (CNRS/CNES/IRD/UPS), Observatoire Midi-Pyrénées, Toulouse, 31400, 27 France 28 29 gDepartment of Marine Science, University of Southern Mississippi, Stennis Space 30 Center, MS 39529 USA 31 32 hDepartment of Ocean, Earth, and Atmospheric Sciences, Old Dominion University, 33 Norfolk, VA 23529 USA 34 35 iSchool of GeoSciences, University of Edinburgh, Edinburgh, EH9 3FE, United 36 Kingdom 37 38 jInstitute of Marine and Antarctic Studies, University of Tasmania, Hobart, Tasmania, 39 7005 Australia 40 41 kDepartment of Earth Sciences, University of Oxford, Oxford, OX1 3AN, United 42 Kingdom 43 44 lSchool of Geography, Earth and Environmental Sciences, Plymouth University, 45 Plymouth, PL4 8AA, United Kingdom 46
2
47 mDepartment of Oceanography, Dalhousie University, Halifax, NS, B3H 4R2 Canada 48 49 nDepartment of Geosciences, Swedish Museum of Natural History, Stockholm SE-50 104 05, Sweden 51 52 oDepartment of Earth Sciences, University of Oxford, Oxford OX1 3AN, United 53 Kingdom 54 55 pAtmosphere and Ocean Research Institute, University of Tokyo 56 Kashiwanoha 5-1-5 Kashiwa Chiba, 277-8564, Japan 57 58 qMarine Geochemistry Department, Alfred Wegener Institute Helmholtz Centre for 59 Polar and Marine Research, Am Handelshafen 12, 27570 Bremerhaven, Germany 60 61 rEarth System Sciences & Analytical, Environmental and Geo-Chemistry, Vrije 62 Universiteit Brussel, Brussels, B-1050 Belgium 63 64 sPhysics Department-ICTA, Universitat Autònoma de Barcelona, Barcelona, 08193 65 Spain 66 67 68 Abstract 69 70 Continental shelves and shelf seas play a central role in the global carbon cycle. 71
However, their importance with respect to trace element and isotope (TEI) inputs to 72
ocean basins is less well understood. Here, we present major findings on shelf TEI 73
biogeochemistry from the GEOTRACES program as well as a proof-of-concept for a 74
new method to estimate shelf TEI fluxes. The case studies focus on advances in our 75
understanding of TEI cycling in the Arctic, transformations within a major river 76
estuary (Amazon), shelf sediment micronutrient fluxes, and basin-scale estimates of 77
submarine groundwater discharge. The proposed shelf flux tracer is 228-radium 78
(T1/2=5.75 y), which is continuously supplied to the shelf from coastal aquifers, 79
sediment porewater exchange, and rivers. Model-derived shelf 228Ra fluxes are 80
combined with TEI/ 228Ra ratios to quantify ocean TEI fluxes from the western 81
North Atlantic margin. The results from this new approach agree well with previous 82
estimates for shelf Co, Fe, Mn, and Zn inputs and exceed published estimates of 83
atmospheric deposition by factors of ~3-23. Lastly, recommendations are made for 84
additional GEOTRACES process studies and coastal margin-focused section cruises 85
3
that will help refine the model and provide better insight on the mechanisms driving 86
shelf-derived TEI fluxes to the ocean. 87
88
1. Introduction 89
Continental shelves and shelf seas play an important role in modulating the transfer 90
of materials between the land and ocean. As such, quantifying processes occurring 91
within this key interface is essential to our understanding of the biogeochemistry of 92
trace elements and their isotopes (TEIs) in the ocean, a major goal of the 93
GEOTRACES program (www.geotraces.org). Moreover, the supply and removal of 94
elements in coastal oceans have direct influence on the structure of ocean 95
ecosystems and their productivity. Although coastal oceans comprise only around 96
7% of the total ocean area, they support 15-20% of total primary productivity and 97
provide 90% of the world’s fish yield [1]. As a critical Earth system interface, a large 98
proportion of CO2 exchange between the ocean and atmosphere occurs over the 99
shelf, which is thought to be a net sink for both atmospheric and terrestrial carbon 100
[2-4]. 101
102
In the nearshore environment, estuaries are known to be important zones of TEI 103
processing [5]. One classic example is the removal of dissolved iron during estuarine 104
mixing, which has been shown in many cases to vastly diminish the riverine flux of 105
this element to the ocean [6-8]. Similarly, uranium has an active biogeochemistry in 106
estuaries and salt marshes, which generally, yet not exclusively, act as sinks for 107
dissolved U [9-11]. Dissolved organic matter (DOM) and several other trace 108
elements may also be removed, at different rates, along the salinity gradient of 109
estuaries and shelves [8, 12-15], while some TEIs like barium and radium are 110
known to be added due to desorption from riverine particles [16-20]. In addition to 111
rivers [21], submarine groundwater discharge (SGD) may represent a large source 112
of TEIs to the coastal ocean [22, 23]. Comprising a mixture of meteoric groundwater 113
and seawater circulated through coastal aquifers, SGD has been estimated to exceed 114
river discharge both regionally [24, 25] and by a factor of 3-4 on a global basis [26]. 115
Furthermore, SGD has been shown to be an important source of micronutrients (e.g. 116
4
Fe [27]), contaminants (e.g. Hg [28] and Pb, [29]), and TEIs commonly used as 117
paleo-tracers (e.g. U and Ba [30]). 118
119
For some elements, boundary exchange processes involving sedimentary deposits 120
on the continental margins may have substantial or even greater fluxes to the ocean 121
than rivers. Diffusive benthic fluxes can be a major source of dissolved rare earth 122
elements (REE) to the ocean at levels that could explain the missing source 123
observed in recent isotopic modeling studies [31-33], where the REE flux from shelf 124
sediments is larger than other REE sources to the ocean [34]. The sedimentary 125
remobilization of Nd along continental margins, specifically due to sediment 126
dissolution, also illustrates the importance of shelf porewater exchange processes as 127
a source of TEIs to the ocean [31]. Studies at “mid-ocean” shelves, such as the 128
Kerguelen and Crozet Plateaus, showed a substantial role of sedimentary iron 129
release in alleviating Fe limitation and enhancing carbon sequestration in the 130
Southern Ocean [35-37]. 131
132
The GEOTRACES program has carried out basin scale sections to quantify and 133
identify the processes that supply TEIs at ocean boundaries (atmosphere-ocean, 134
sediment-water, ocean crust-overlying water, continent-ocean [38-41]). However, 135
the coastal or shelf ocean is an interface that requires additional process studies to 136
investigate the key processes impacting on the biogeochemical cycles of TEIs. The 137
identification and quantification of TEI distributions and fluxes along ocean margins 138
are important for a number of reasons, including their sensitivity to changing 139
precipitation and wind patterns, and potential impacts on aquaculture and fisheries. 140
Particularly striking is the extent and rate at which humans have modified the 141
coastal zone worldwide [42], a narrow strip of land within 100 km of the ocean 142
where half of the world’s population lives and where three-quarters of all large 143
cities are located [43, 44]. The impacts are numerous and include large-scale bottom 144
water anoxia, eutrophication, acidification, overfishing and anthropogenic 145
contaminant inputs. For instance, global budgets of TEIs such as Pb and Hg have 146
already been significantly altered in the ocean as a result of human induced 147
5
activities such as acid mine drainage [45, 46]. The role of changing sea-ice cover 148
may affect shelf TEI transport rates, and TEI discharges associated with the 149
accelerated melting of large ice sheets have the potential to increase in magnitude 150
over the coming decades to centuries. For present-day Greenland, the Fe flux may 151
already be on par with the total amount of Fe delivered to the North Atlantic Ocean 152
via dust [47], but the scale of this impact depends on the quantification of fluxes 153
between the coast and open ocean [48]. 154
155
An understanding of the mechanisms governing the linkages between the 156
terrestrialshelfopen ocean continuum is crucial [49]. Although some 157
GEOTRACES process studies have focused more in near shelf regions, GEOTRACES 158
sections to date have, by design, focused primarily on open ocean transects. Here we 159
highlight several examples of where GEOTRACES studies have yielded significant 160
insight on shelf TEI processes, defined as those occurring along ocean margins at 161
water depths <200 m. We further propose a new approach for quantifying the shelf 162
flux of TEIs using a radium isotope tracer (228Ra) and inverse modeling techniques. 163
Finally, we recommend a series of efforts that are necessary to constrain the 164
exchange processes at coastal/shelf ocean interfaces and to aid in the prediction of 165
fluxes of TEIs from this boundary to the ocean. 166
167
2. Significant GEOTRACES contributions to our understanding of shelf impacts 168
on TEI budgets for the open ocean 169
2.1 The Arctic 170
The Arctic Ocean is unique among the major ocean basins in having as much as one 171
half of its area taken up by shelves [50]. Further, the basin receives a 172
disproportionate percentage of the world’s river discharge (10% [51]). Arctic 173
waters are also highly stratified, with a distinct low salinity surface mixed layer, a 174
strong halocline, and clear shelf and river inputs. Because of these features, the 175
impact of shelf-basin interactions on TEI distributions is particularly prominent 176
throughout the Arctic Ocean. However, TEI data have been limited due to the 177
logistical difficulties of reaching remote and ice-covered regions. The International 178
6
Polar Year 2007-2008 provided a launching pad for the GEOTRACES program, with 179
five cruises in the Arctic region between 2006-2009, which led to new insights 180
about important Arctic coastal processes acting on TEI distributions. More recently, 181
in summer 2015 three nations mounted full GEOTRACES Arctic cruises; the results 182
of that coordinated effort are forthcoming. 183
184
High concentrations of shelf-derived trace metals in surface waters of the central 185
Arctic were reported by Moore [52]. This included Cd, which has been found to 186
exhibit only minor isotope shifts compared to other ocean basins where greater 187
variations are generated through biological removal [53]. Data from the Swedish-188
Russian GEOTRACES (GIPY13) cruise to the Siberian shelves found that Cd was not 189
removed in the Lena estuary, and there were further Cd additions to shelf waters 190
from the shelf sediments [54]. Another example of shelf influence on the deep basin 191
is the distribution of Ba, which is strongly enriched in estuarine waters due to 192
desorption from river sediments. In theory, Ba distributions can delineate shelf TEI 193
sources; however, isolating the terrestrial Ba source may be complicated due to 194
biogenic Ba uptake and vertical redistribution [55]. As part of the Canadian IPY-195
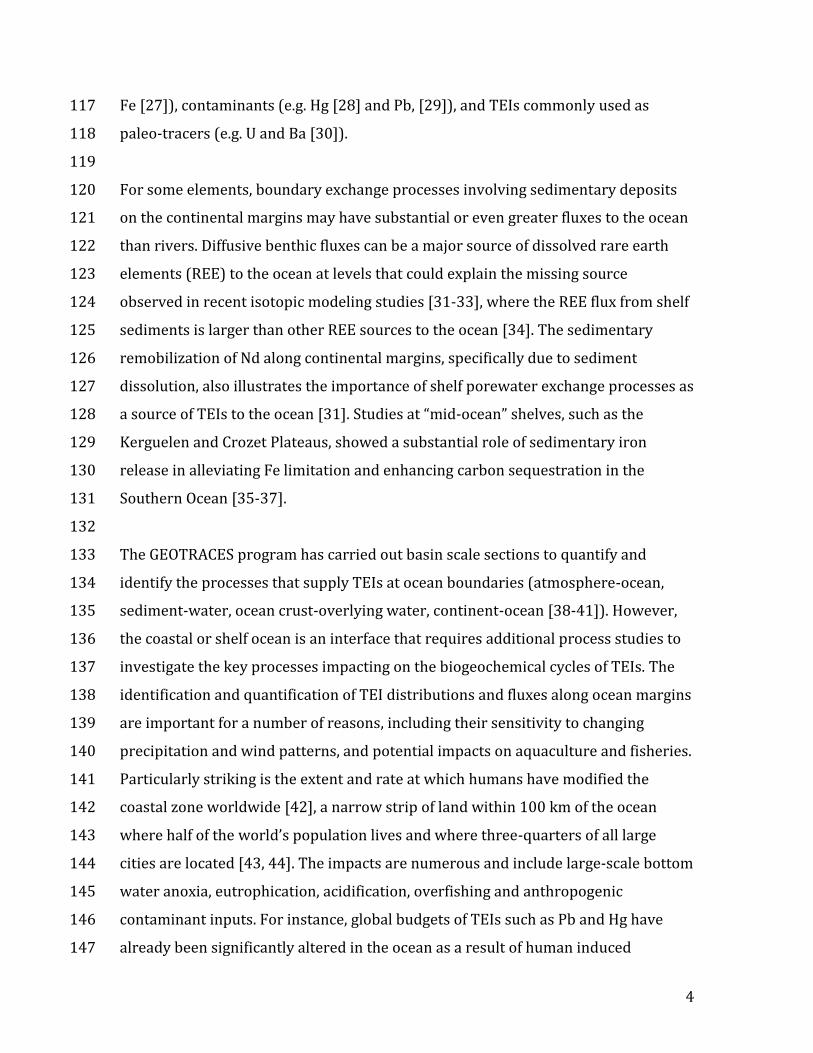
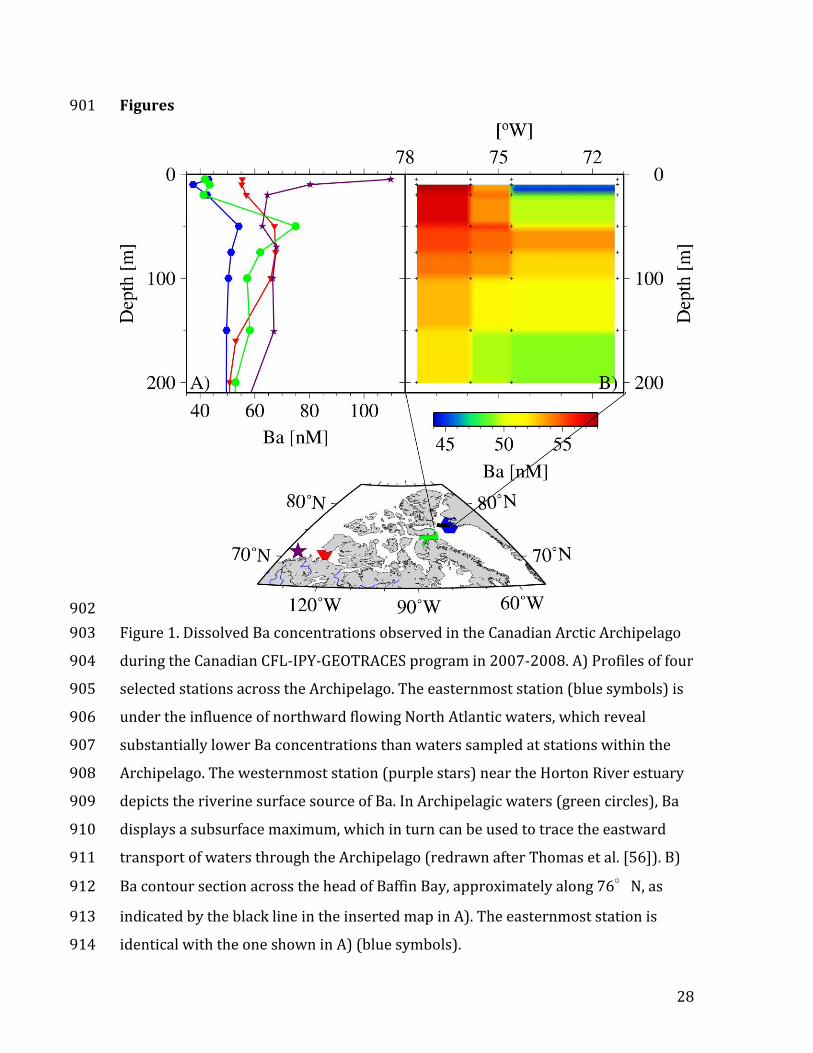
GEOTRACES, a dissolved Ba cross-section through the Canadian Archipelago 196
revealed high surface water Ba concentrations near the Horton River and a 197
pronounced Ba maximum in the upper halocline waters (Fig. 1; [56]). The latter was 198
thought to be due in part to Ba released to subsurface waters in the wake of organic 199
matter remineralization, a finding similar to Roeske et al. [55] who reported that 200
remineralization from the Siberian shelf led to a similar Ba enrichment below the 201
surface mixed layer. This may represent a dynamic process that is not at steady-202
state: such ‘metabolic Ba’ concentrations in the subsurface layer increase with the 203
arrival of organic matter sometime after the spring bloom, approaching maximum 204
values toward the end of winter [56]. 205
206
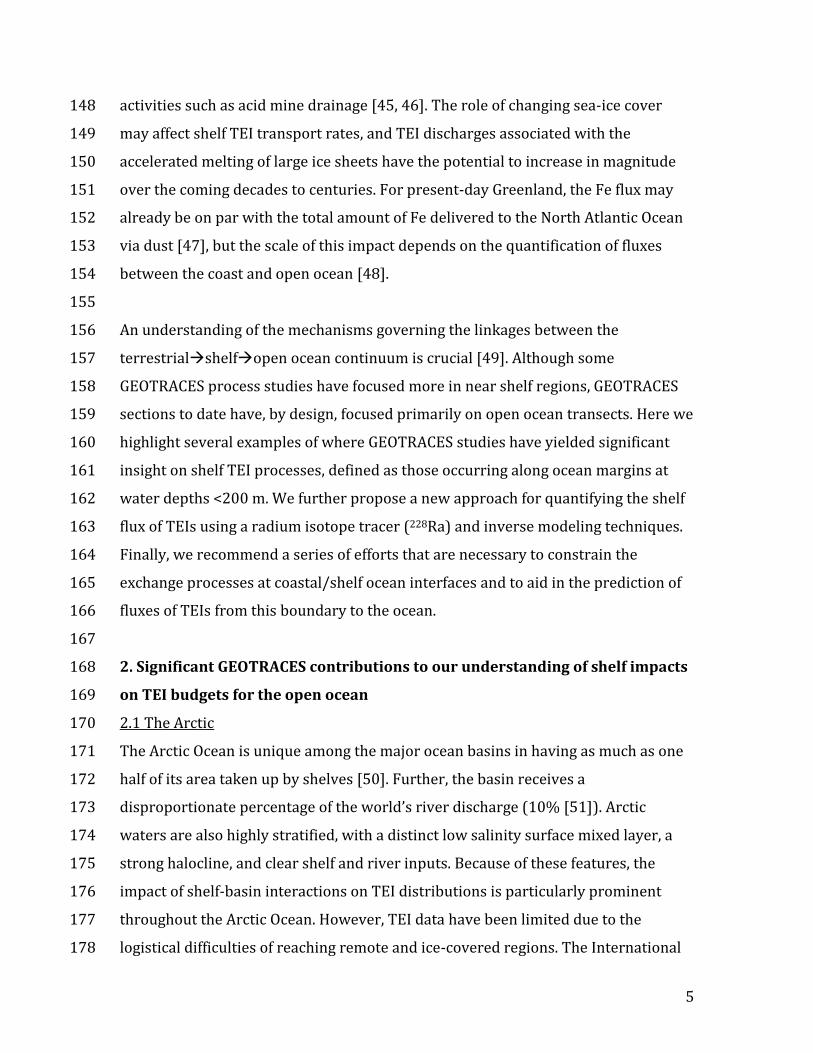
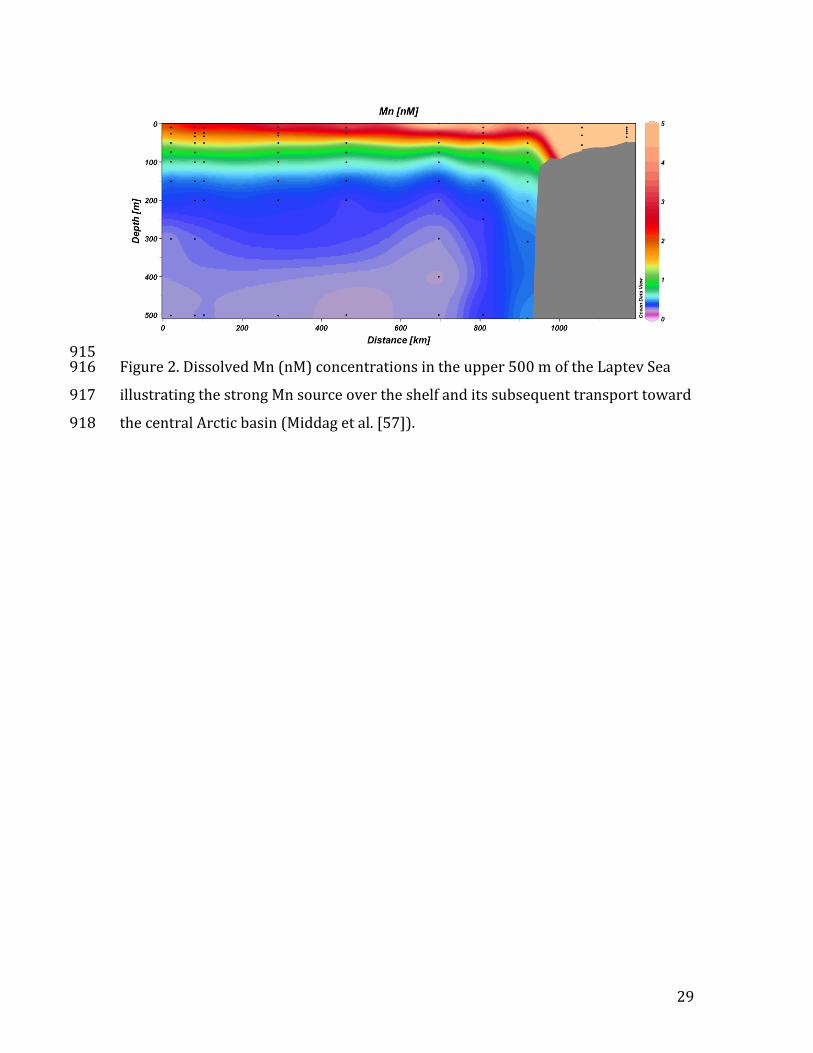
A strong Mn enrichment was also found in the surface layer of the central basin due 207
to riverine inputs of Mn (Fig. 2; [57]), though the inferred river component indicated 208
that river waters were significantly depleted by estuarine processes. Mid-depth 209
7
enrichments of Mn on the shelf also suggested that there were benthic 210
contributions, though this sediment source did not extend a significant distance off-211
shelf. The first measurements of Ga in Arctic waters found that its distribution 212
reflected mixing between Atlantic and Pacific waters, with evidence of both riverine 213
input and scavenging removal in shelf waters of the Beaufort Sea [58]. Further 214
studies of the shelf cycling of Ga and related elements (especially Al, which is 215
chemically similar to Ga though more readily scavenged) could provide insights into 216
how shelf scavenging removal affects the off-shelf transport of reactive TEIs. 217
218
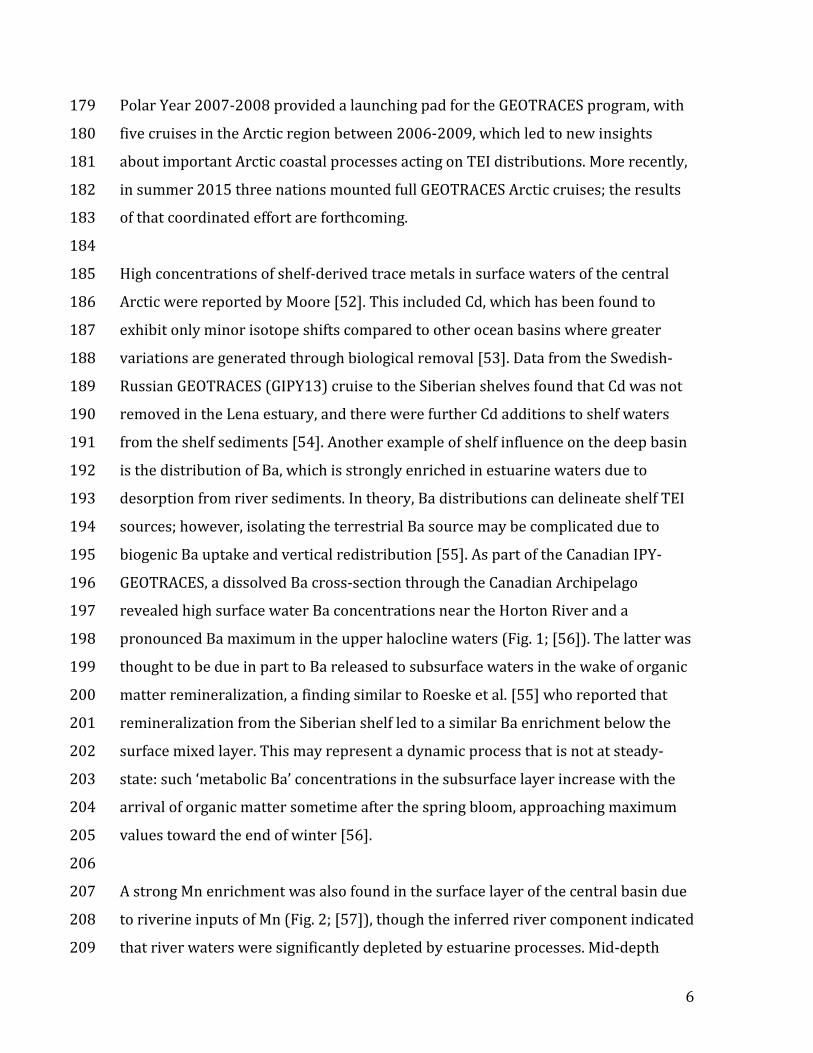
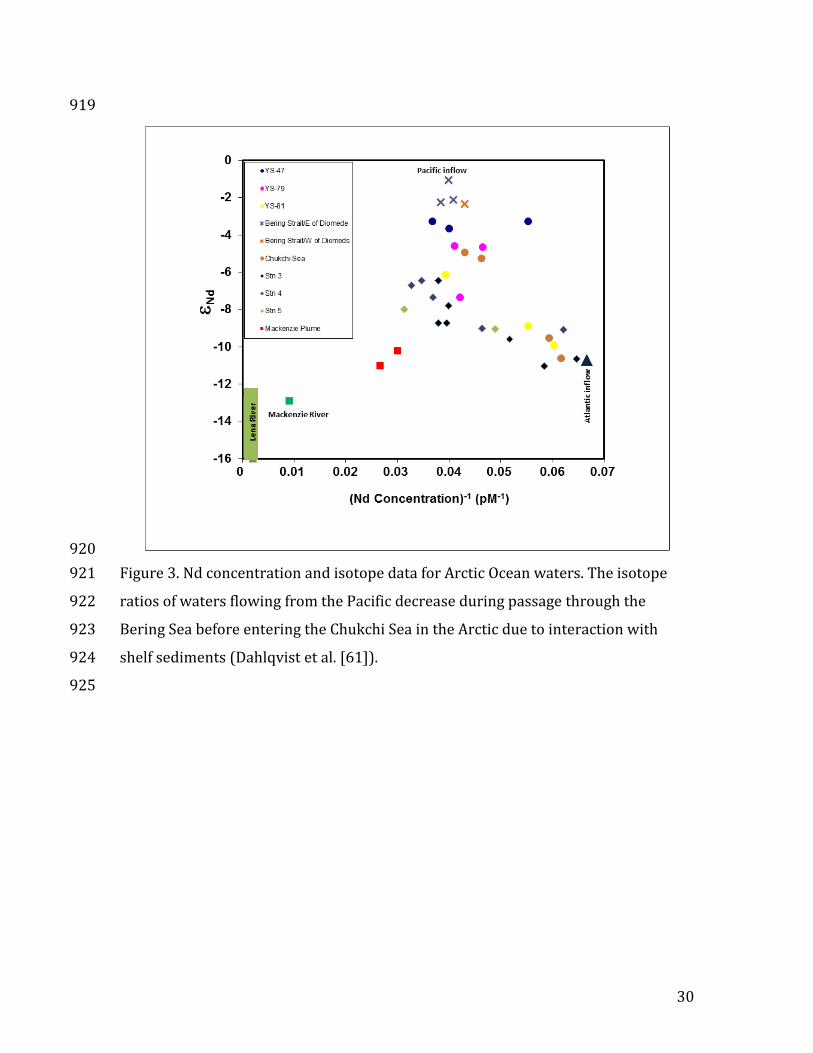
Isotope variations in Nd have been widely used to understand shelf-water 219
interactions and riverine inputs. Within the Arctic Ocean, gradients between surface 220
and halocline waters reflected inputs from the Pacific [59] as well as a source that 221
isotopically matched the major rivers, indicating that the concentrations of the river 222
components reaching the central basin did not reflect the considerable estuarine Nd 223
losses commonly seen elsewhere [60]. These datasets were extended with samples 224
from the BERINGIA 2005 and GIPY13 GEOTRACES cruises, which clearly 225
demonstrated how Nd isotopes and concentrations in the Pacific layer were 226
modified while crossing the Bering Sea through sediment-water exchange processes 227
as was inferred for other shelf areas (Fig. 3; [61]). Furthermore, Lena River waters 228
did not suffer strong modification through estuarine losses like in the Amazon [62]. 229
230
Data from GEOTRACES cruises have also documented the behavior of carbon on the 231
Arctic shelves. Alling et al. [63] demonstrated for the first time that substantial 232
degradation of DOC occurs in the Lena River estuary, with greater degradation in 233
the broad East Siberian Seas where shelf water residence times are several years; 234
along with degassing of CO2, this process was clearly shown in DIC 13C signatures 235
[64]. Rising Arctic Ocean temperatures are leading to the thawing of permafrost and 236
release of its stored methane [65, 66]. Indeed, preliminary results from the recent 237
2015 U.S. GEOTRACES Arctic section (GN01) show shelf enrichments of tracers such 238
as CH4 [67], though the impact of this process on other TEIs remains to be seen. 239
8
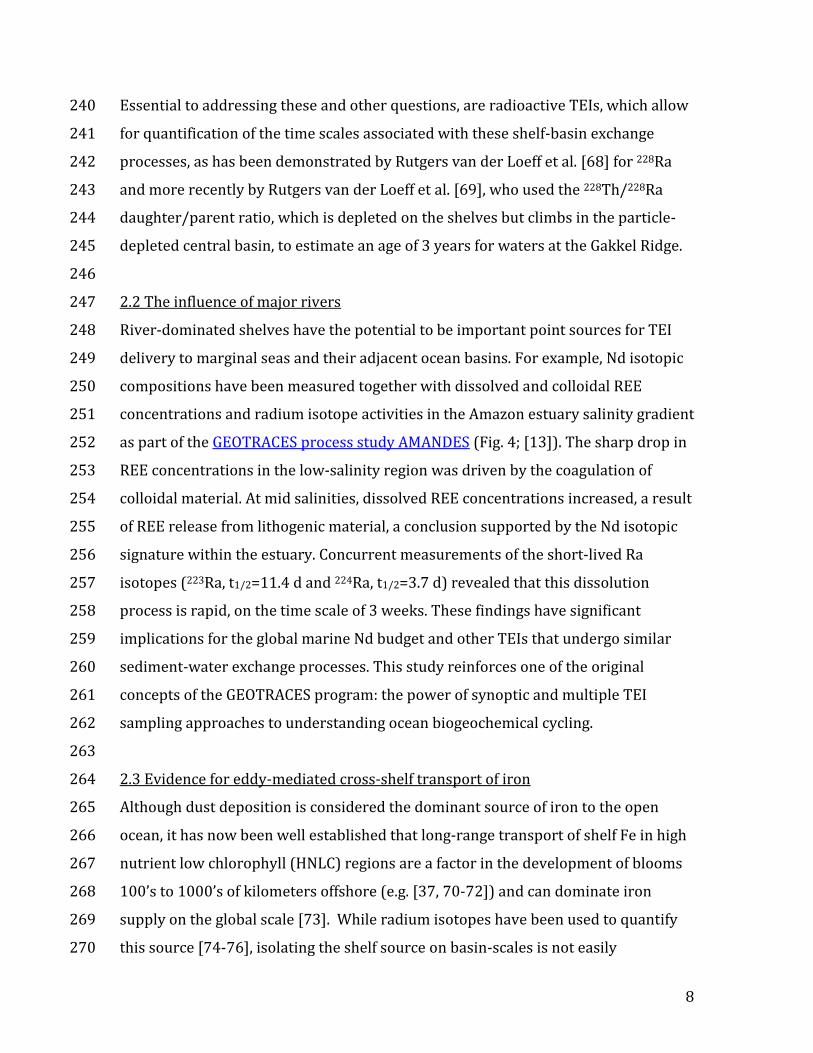
Essential to addressing these and other questions, are radioactive TEIs, which allow 240
for quantification of the time scales associated with these shelf-basin exchange 241
processes, as has been demonstrated by Rutgers van der Loeff et al. [68] for 228Ra 242
and more recently by Rutgers van der Loeff et al. [69], who used the 228Th/228Ra 243
daughter/parent ratio, which is depleted on the shelves but climbs in the particle-244
depleted central basin, to estimate an age of 3 years for waters at the Gakkel Ridge. 245
246
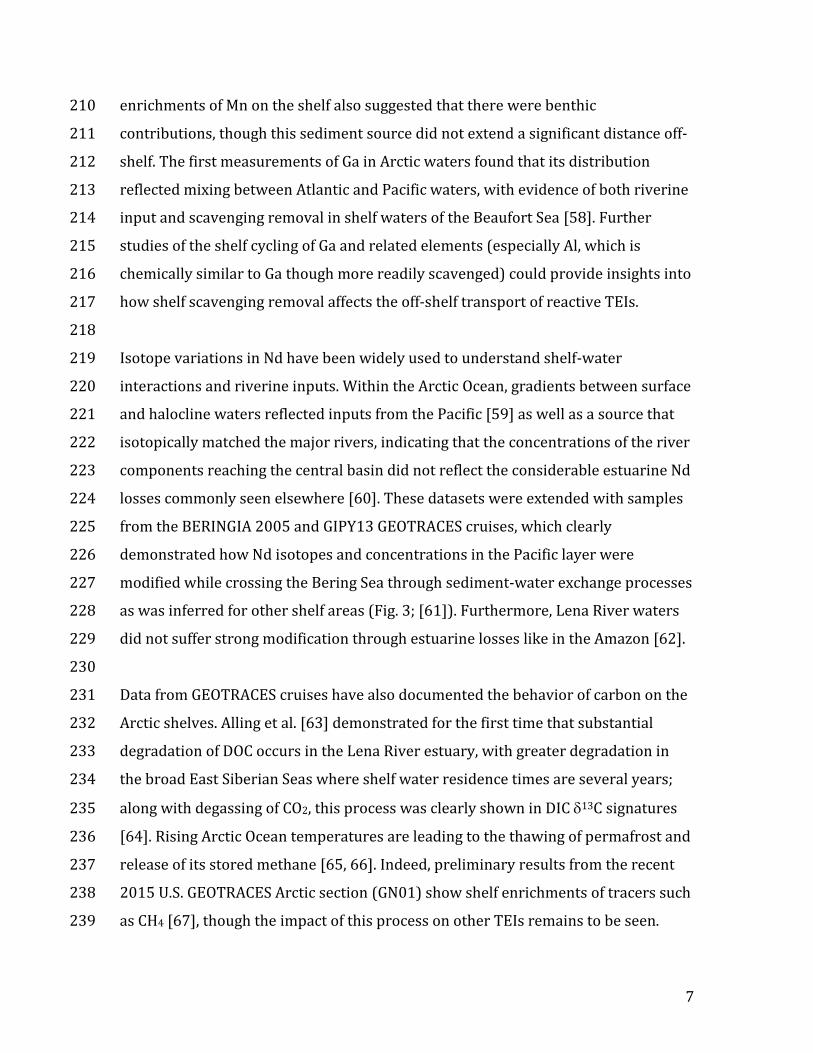
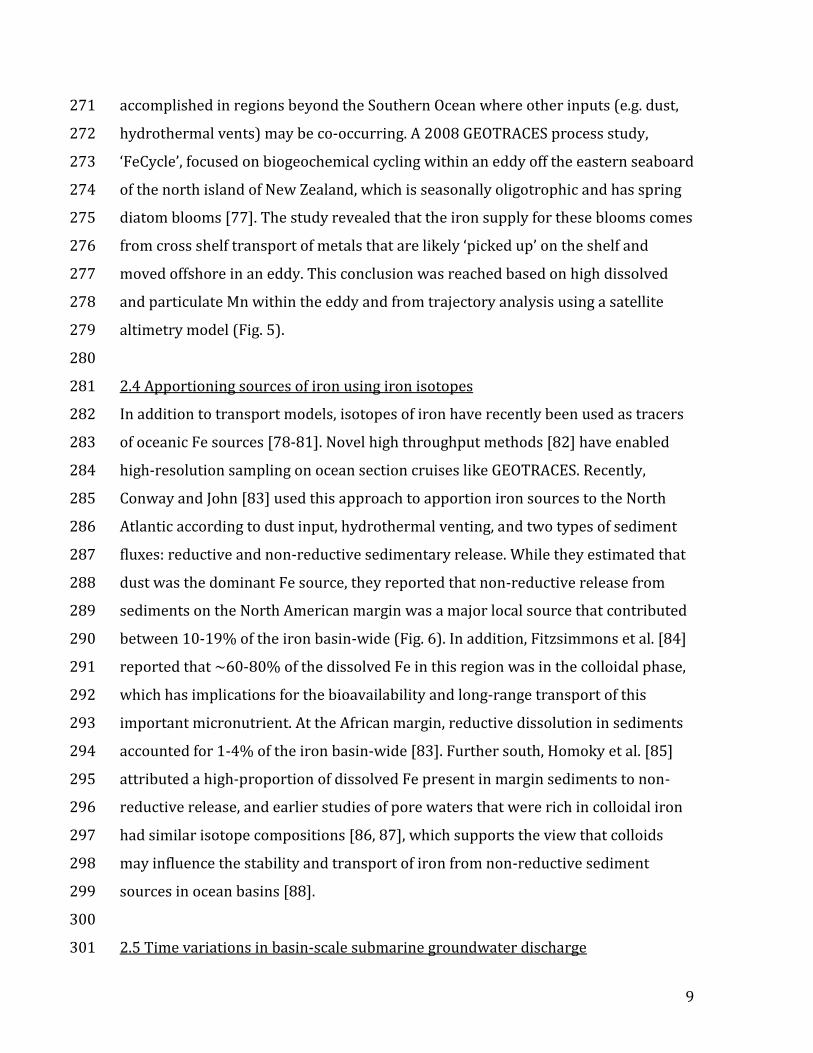
2.2 The influence of major rivers 247
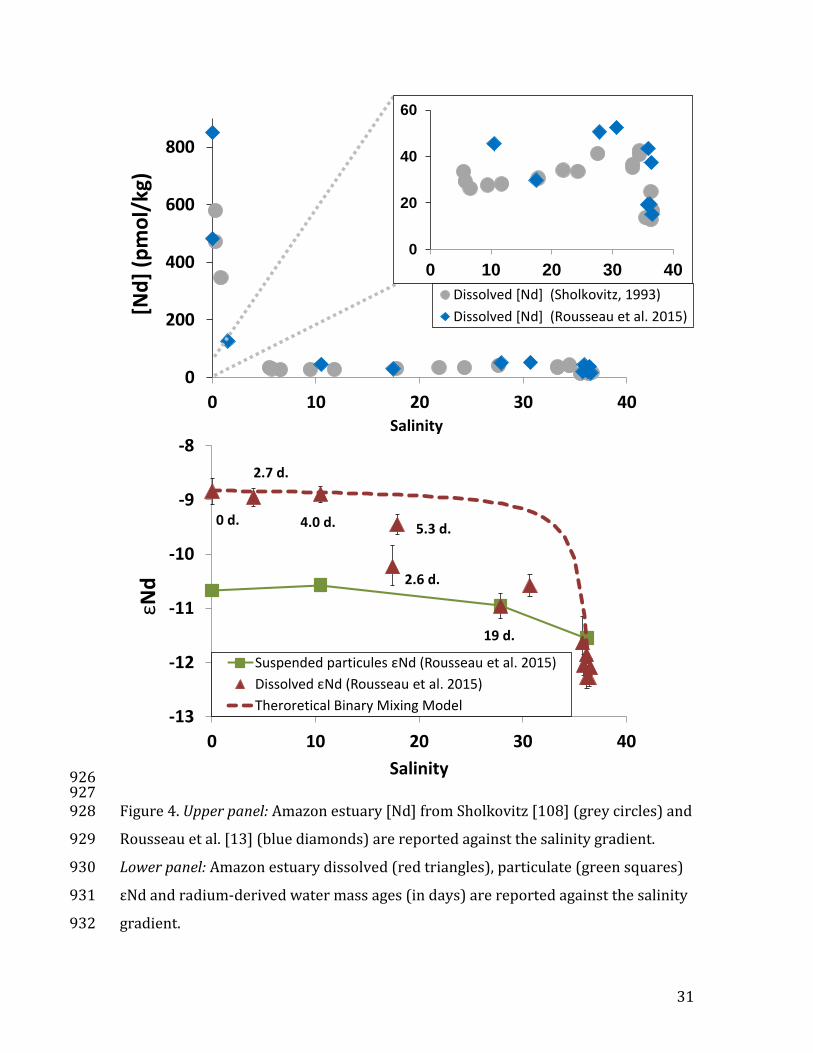
River-dominated shelves have the potential to be important point sources for TEI 248
delivery to marginal seas and their adjacent ocean basins. For example, Nd isotopic 249
compositions have been measured together with dissolved and colloidal REE 250
concentrations and radium isotope activities in the Amazon estuary salinity gradient 251
as part of the GEOTRACES process study AMANDES (Fig. 4; [13]). The sharp drop in 252
REE concentrations in the low-salinity region was driven by the coagulation of 253
colloidal material. At mid salinities, dissolved REE concentrations increased, a result 254
of REE release from lithogenic material, a conclusion supported by the Nd isotopic 255
signature within the estuary. Concurrent measurements of the short-lived Ra 256
isotopes (223Ra, t1/2=11.4 d and 224Ra, t1/2=3.7 d) revealed that this dissolution 257
process is rapid, on the time scale of 3 weeks. These findings have significant 258
implications for the global marine Nd budget and other TEIs that undergo similar 259
sediment-water exchange processes. This study reinforces one of the original 260
concepts of the GEOTRACES program: the power of synoptic and multiple TEI 261
sampling approaches to understanding ocean biogeochemical cycling. 262
263
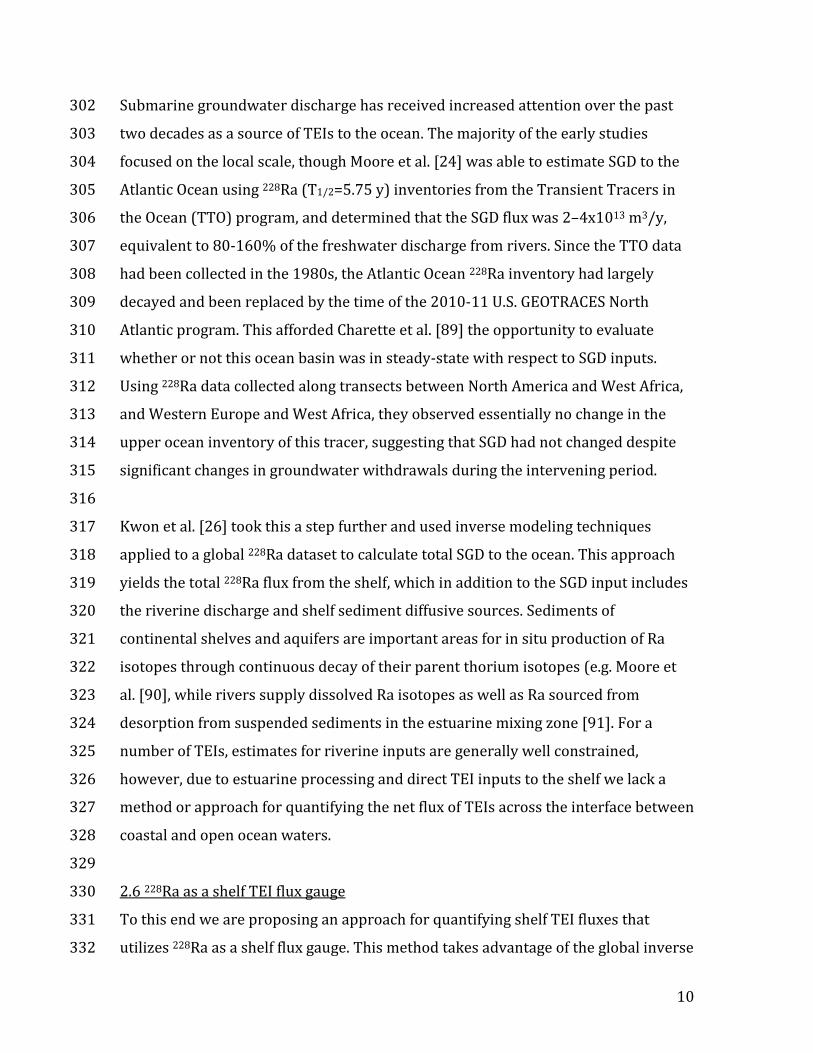
2.3 Evidence for eddy-mediated cross-shelf transport of iron 264
Although dust deposition is considered the dominant source of iron to the open 265
ocean, it has now been well established that long-range transport of shelf Fe in high 266
nutrient low chlorophyll (HNLC) regions are a factor in the development of blooms 267
100’s to 1000’s of kilometers offshore (e.g. [37, 70-72]) and can dominate iron 268
supply on the global scale [73]. While radium isotopes have been used to quantify 269
this source [74-76], isolating the shelf source on basin-scales is not easily 270
9
accomplished in regions beyond the Southern Ocean where other inputs (e.g. dust, 271
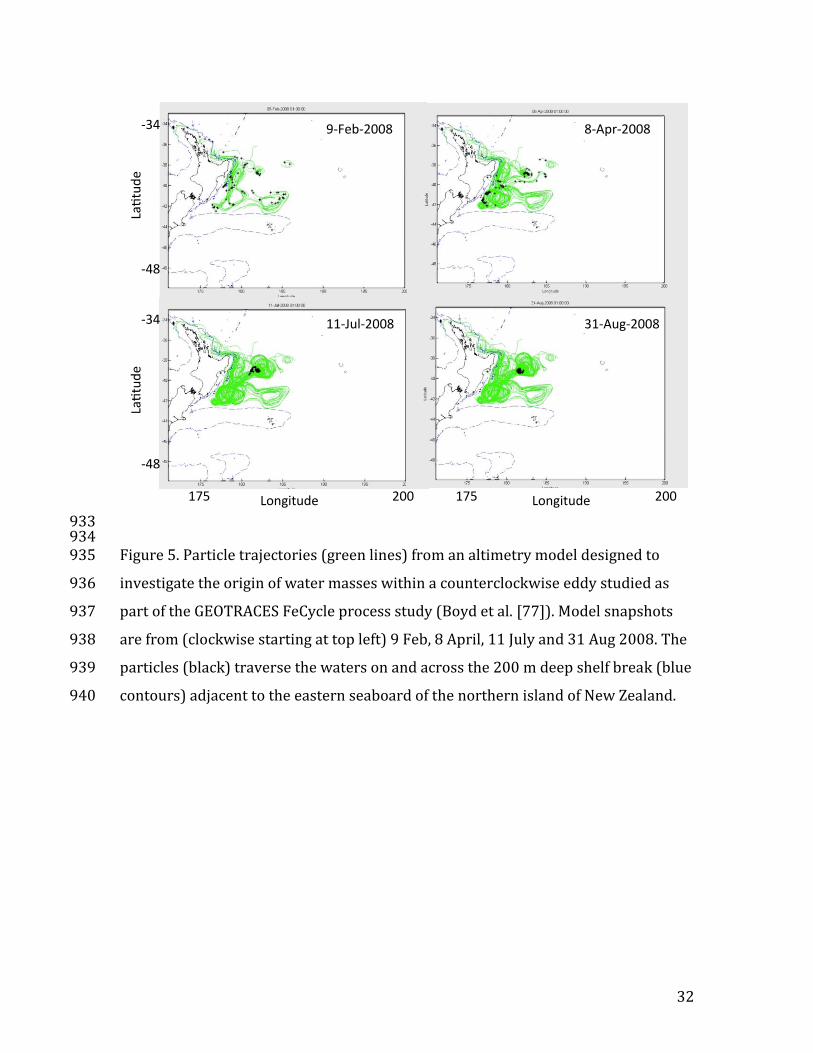
hydrothermal vents) may be co-occurring. A 2008 GEOTRACES process study, 272
‘FeCycle’, focused on biogeochemical cycling within an eddy off the eastern seaboard 273
of the north island of New Zealand, which is seasonally oligotrophic and has spring 274
diatom blooms [77]. The study revealed that the iron supply for these blooms comes 275
from cross shelf transport of metals that are likely ‘picked up’ on the shelf and 276
moved offshore in an eddy. This conclusion was reached based on high dissolved 277
and particulate Mn within the eddy and from trajectory analysis using a satellite 278
altimetry model (Fig. 5). 279
280
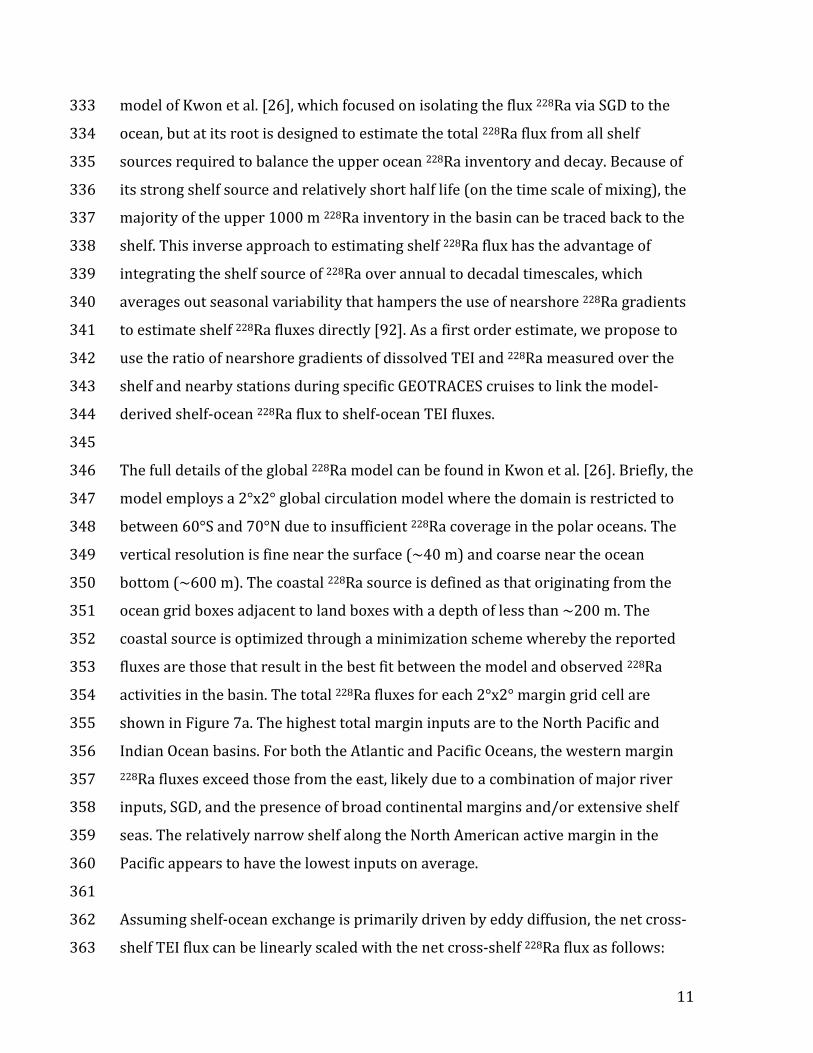
2.4 Apportioning sources of iron using iron isotopes 281
In addition to transport models, isotopes of iron have recently been used as tracers 282
of oceanic Fe sources [78-81]. Novel high throughput methods [82] have enabled 283
high-resolution sampling on ocean section cruises like GEOTRACES. Recently, 284
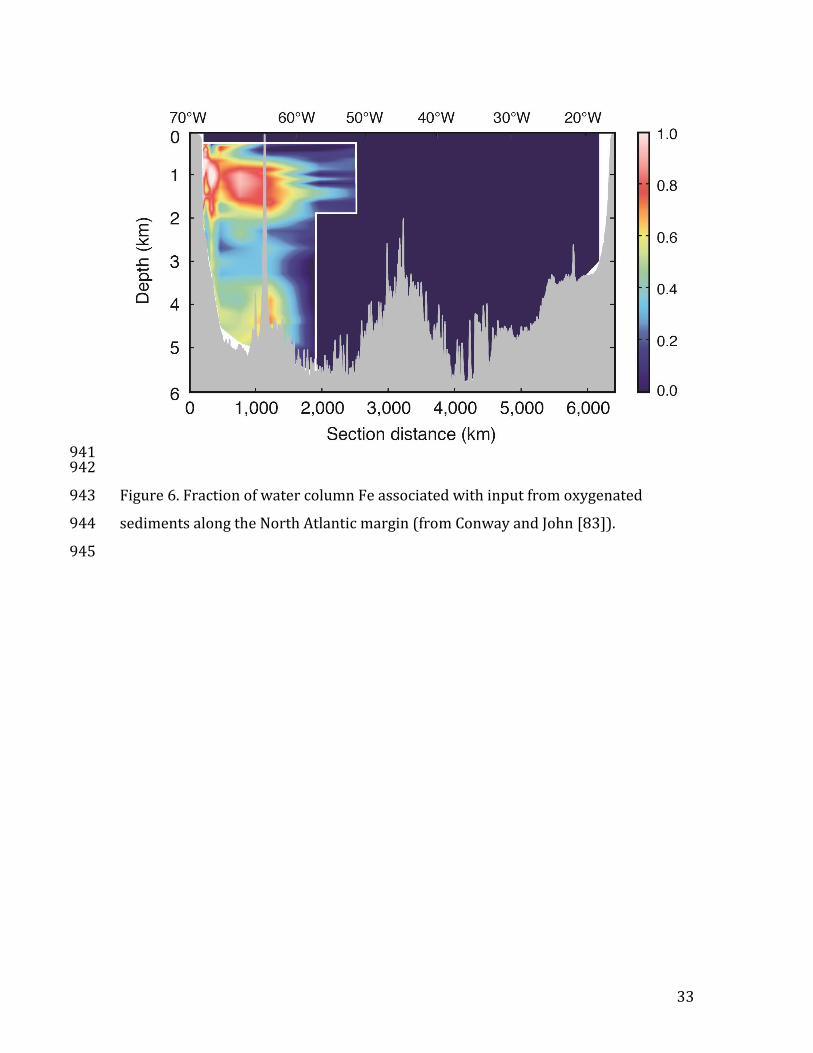
Conway and John [83] used this approach to apportion iron sources to the North 285
Atlantic according to dust input, hydrothermal venting, and two types of sediment 286
fluxes: reductive and non-reductive sedimentary release. While they estimated that 287
dust was the dominant Fe source, they reported that non-reductive release from 288
sediments on the North American margin was a major local source that contributed 289
between 10-19% of the iron basin-wide (Fig. 6). In addition, Fitzsimmons et al. [84] 290
reported that ~60-80% of the dissolved Fe in this region was in the colloidal phase, 291
which has implications for the bioavailability and long-range transport of this 292
important micronutrient. At the African margin, reductive dissolution in sediments 293
accounted for 1-4% of the iron basin-wide [83]. Further south, Homoky et al. [85] 294
attributed a high-proportion of dissolved Fe present in margin sediments to non-295
reductive release, and earlier studies of pore waters that were rich in colloidal iron 296
had similar isotope compositions [86, 87], which supports the view that colloids 297
may influence the stability and transport of iron from non-reductive sediment 298
sources in ocean basins [88]. 299
300
2.5 Time variations in basin-scale submarine groundwater discharge 301
10
Submarine groundwater discharge has received increased attention over the past 302
two decades as a source of TEIs to the ocean. The majority of the early studies 303
focused on the local scale, though Moore et al. [24] was able to estimate SGD to the 304
Atlantic Ocean using 228Ra (T1/2=5.75 y) inventories from the Transient Tracers in 305
the Ocean (TTO) program, and determined that the SGD flux was 2–4x10¹³ m3/y, 306
equivalent to 80-160% of the freshwater discharge from rivers. Since the TTO data 307
had been collected in the 1980s, the Atlantic Ocean 228Ra inventory had largely 308
decayed and been replaced by the time of the 2010-11 U.S. GEOTRACES North 309
Atlantic program. This afforded Charette et al. [89] the opportunity to evaluate 310
whether or not this ocean basin was in steady-state with respect to SGD inputs. 311
Using 228Ra data collected along transects between North America and West Africa, 312
and Western Europe and West Africa, they observed essentially no change in the 313
upper ocean inventory of this tracer, suggesting that SGD had not changed despite 314
significant changes in groundwater withdrawals during the intervening period. 315
316
Kwon et al. [26] took this a step further and used inverse modeling techniques 317
applied to a global 228Ra dataset to calculate total SGD to the ocean. This approach 318
yields the total 228Ra flux from the shelf, which in addition to the SGD input includes 319
the riverine discharge and shelf sediment diffusive sources. Sediments of 320
continental shelves and aquifers are important areas for in situ production of Ra 321
isotopes through continuous decay of their parent thorium isotopes (e.g. Moore et 322
al. [90], while rivers supply dissolved Ra isotopes as well as Ra sourced from 323
desorption from suspended sediments in the estuarine mixing zone [91]. For a 324
number of TEIs, estimates for riverine inputs are generally well constrained, 325
however, due to estuarine processing and direct TEI inputs to the shelf we lack a 326
method or approach for quantifying the net flux of TEIs across the interface between 327
coastal and open ocean waters. 328
329
2.6 228Ra as a shelf TEI flux gauge 330
To this end we are proposing an approach for quantifying shelf TEI fluxes that 331
utilizes 228Ra as a shelf flux gauge. This method takes advantage of the global inverse 332
11
model of Kwon et al. [26], which focused on isolating the flux 228Ra via SGD to the 333
ocean, but at its root is designed to estimate the total 228Ra flux from all shelf 334
sources required to balance the upper ocean 228Ra inventory and decay. Because of 335
its strong shelf source and relatively short half life (on the time scale of mixing), the 336
majority of the upper 1000 m 228Ra inventory in the basin can be traced back to the 337
shelf. This inverse approach to estimating shelf 228Ra flux has the advantage of 338
integrating the shelf source of 228Ra over annual to decadal timescales, which 339
averages out seasonal variability that hampers the use of nearshore 228Ra gradients 340
to estimate shelf 228Ra fluxes directly [92]. As a first order estimate, we propose to 341
use the ratio of nearshore gradients of dissolved TEI and 228Ra measured over the 342
shelf and nearby stations during specific GEOTRACES cruises to link the model-343
derived shelf-ocean 228Ra flux to shelf-ocean TEI fluxes. 344
345
The full details of the global 228Ra model can be found in Kwon et al. [26]. Briefly, the 346
model employs a 2°x2° global circulation model where the domain is restricted to 347
between 60°S and 70°N due to insufficient 228Ra coverage in the polar oceans. The 348
vertical resolution is fine near the surface (~40 m) and coarse near the ocean 349
bottom (~600 m). The coastal 228Ra source is defined as that originating from the 350
ocean grid boxes adjacent to land boxes with a depth of less than ~200 m. The 351
coastal source is optimized through a minimization scheme whereby the reported 352
fluxes are those that result in the best fit between the model and observed 228Ra 353
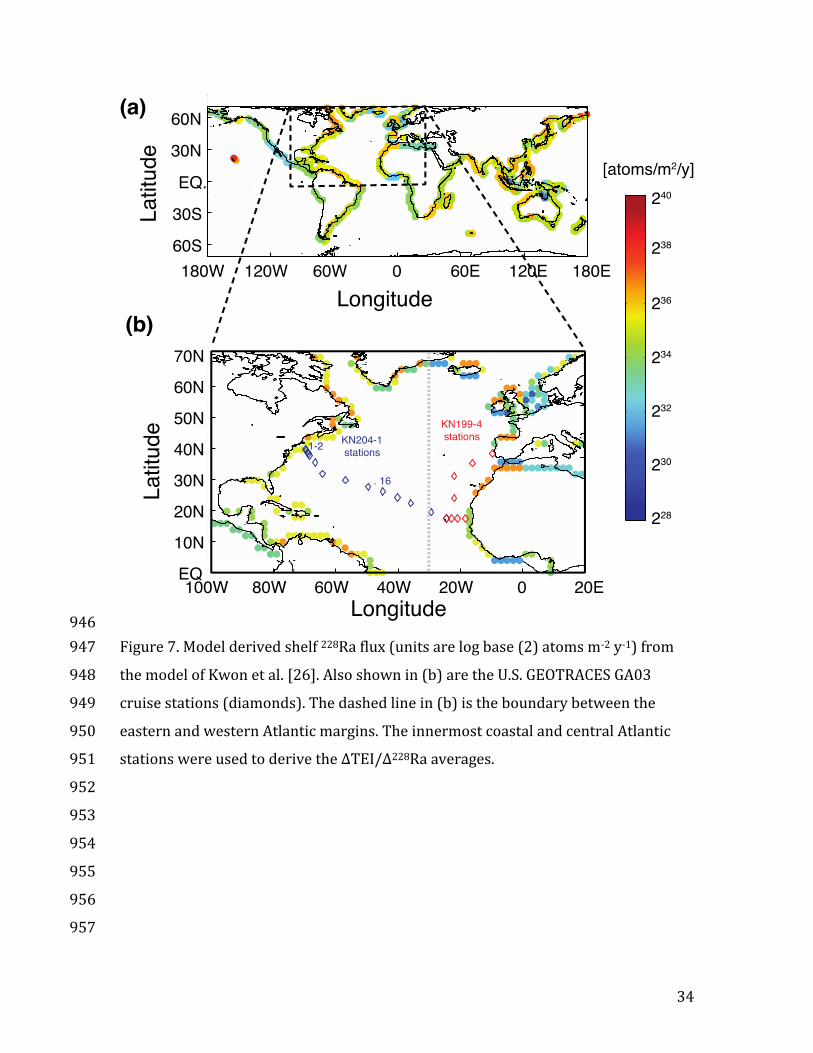
activities in the basin. The total 228Ra fluxes for each 2°x2° margin grid cell are 354
shown in Figure 7a. The highest total margin inputs are to the North Pacific and 355
Indian Ocean basins. For both the Atlantic and Pacific Oceans, the western margin 356
228Ra fluxes exceed those from the east, likely due to a combination of major river 357
inputs, SGD, and the presence of broad continental margins and/or extensive shelf 358
seas. The relatively narrow shelf along the North American active margin in the 359
Pacific appears to have the lowest inputs on average. 360
361
Assuming shelf-ocean exchange is primarily driven by eddy diffusion, the net cross-362
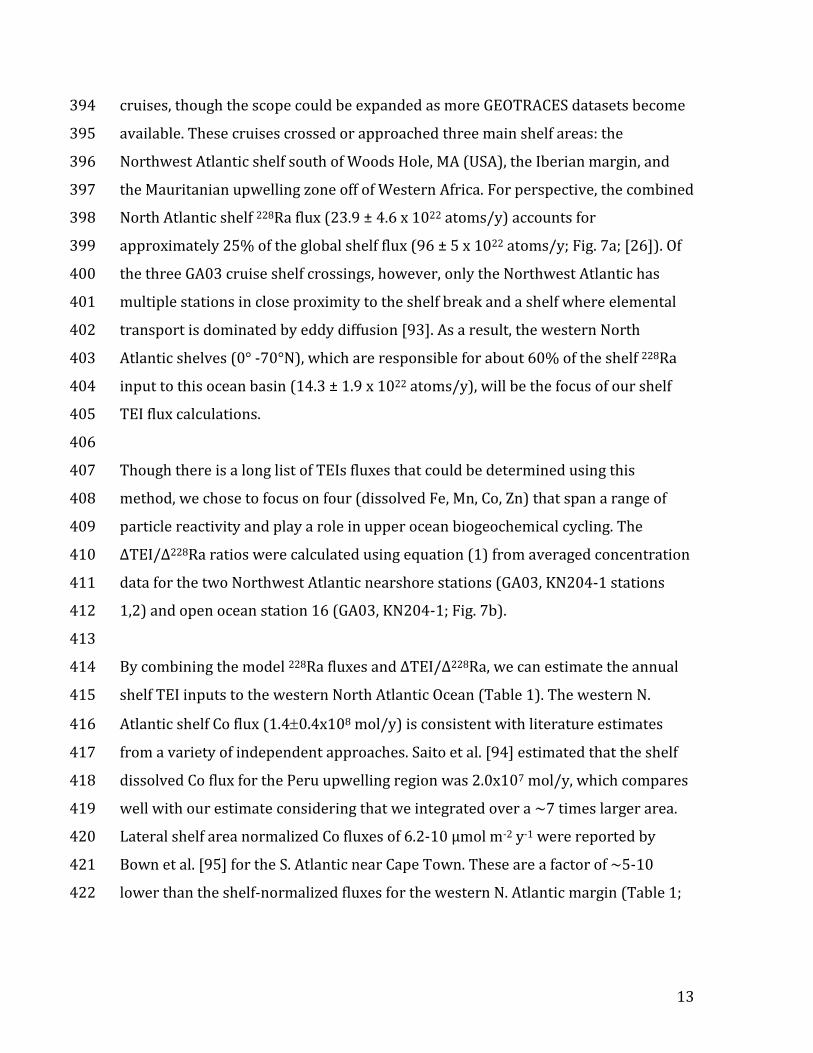
shelf TEI flux can be linearly scaled with the net cross-shelf 228Ra flux as follows: 363
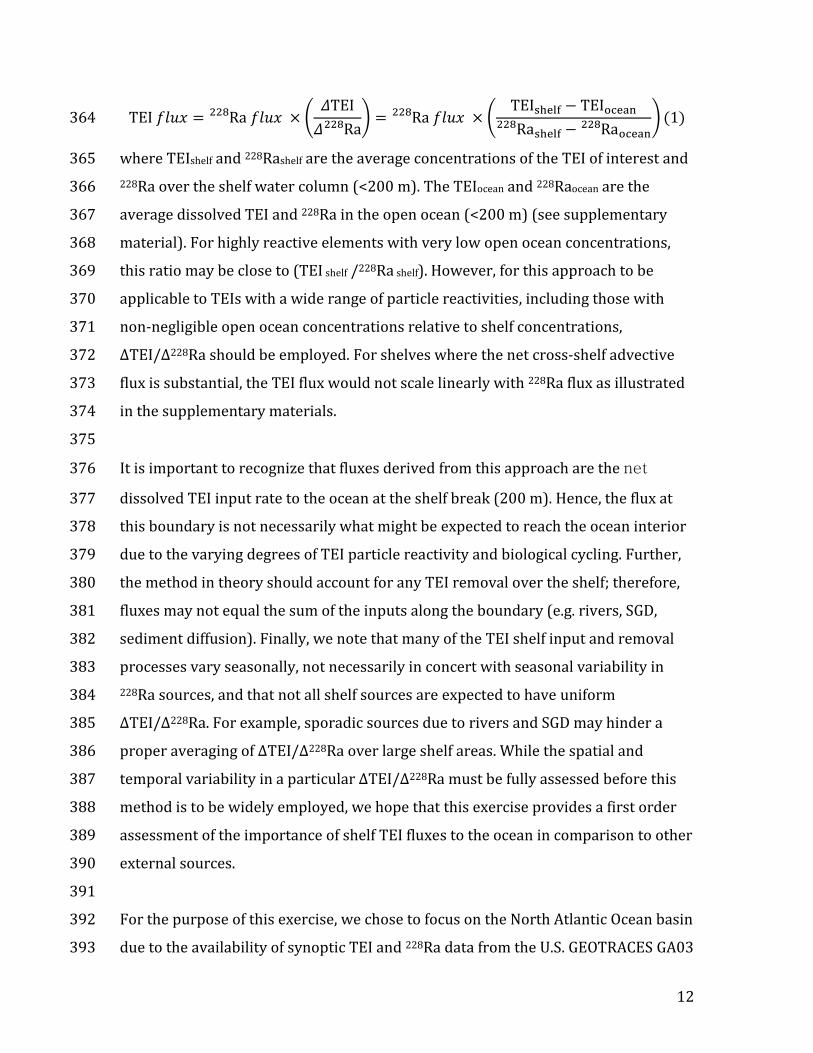
12
TEI 𝑓𝑙𝑢𝑥 = Ra228 𝑓𝑙𝑢𝑥 × (𝛥TEI
𝛥 Ra228 ) = Ra228 𝑓𝑙𝑢𝑥 × (TEIshelf − TEIocean
Rashelf −228 Raocean228 ) (1) 364
where TEIshelf and 228Rashelf are the average concentrations of the TEI of interest and 365
228Ra over the shelf water column (<200 m). The TEIocean and 228Raocean are the 366
average dissolved TEI and 228Ra in the open ocean (<200 m) (see supplementary 367
material). For highly reactive elements with very low open ocean concentrations, 368
this ratio may be close to (TEI shelf /228Ra shelf). However, for this approach to be 369
applicable to TEIs with a wide range of particle reactivities, including those with 370
non-negligible open ocean concentrations relative to shelf concentrations, 371
ΔTEI/Δ228Ra should be employed. For shelves where the net cross-shelf advective 372
flux is substantial, the TEI flux would not scale linearly with 228Ra flux as illustrated 373
in the supplementary materials. 374
375
It is important to recognize that fluxes derived from this approach are the net 376
dissolved TEI input rate to the ocean at the shelf break (200 m). Hence, the flux at 377
this boundary is not necessarily what might be expected to reach the ocean interior 378
due to the varying degrees of TEI particle reactivity and biological cycling. Further, 379
the method in theory should account for any TEI removal over the shelf; therefore, 380
fluxes may not equal the sum of the inputs along the boundary (e.g. rivers, SGD, 381
sediment diffusion). Finally, we note that many of the TEI shelf input and removal 382
processes vary seasonally, not necessarily in concert with seasonal variability in 383
228Ra sources, and that not all shelf sources are expected to have uniform 384
ΔTEI/Δ228Ra. For example, sporadic sources due to rivers and SGD may hinder a 385
proper averaging of ΔTEI/Δ228Ra over large shelf areas. While the spatial and 386
temporal variability in a particular ΔTEI/Δ228Ra must be fully assessed before this 387
method is to be widely employed, we hope that this exercise provides a first order 388
assessment of the importance of shelf TEI fluxes to the ocean in comparison to other 389
external sources. 390
391
For the purpose of this exercise, we chose to focus on the North Atlantic Ocean basin 392
due to the availability of synoptic TEI and 228Ra data from the U.S. GEOTRACES GA03 393
13
cruises, though the scope could be expanded as more GEOTRACES datasets become 394
available. These cruises crossed or approached three main shelf areas: the 395
Northwest Atlantic shelf south of Woods Hole, MA (USA), the Iberian margin, and 396
the Mauritanian upwelling zone off of Western Africa. For perspective, the combined 397
North Atlantic shelf 228Ra flux (23.9 ± 4.6 x 10²² atoms/y) accounts for 398
approximately 25% of the global shelf flux (96 ± 5 x 10²² atoms/y; Fig. 7a; [26]). Of 399
the three GA03 cruise shelf crossings, however, only the Northwest Atlantic has 400
multiple stations in close proximity to the shelf break and a shelf where elemental 401
transport is dominated by eddy diffusion [93]. As a result, the western North 402
Atlantic shelves (0° -70°N), which are responsible for about 60% of the shelf 228Ra 403
input to this ocean basin (14.3 ± 1.9 x 10²² atoms/y), will be the focus of our shelf 404
TEI flux calculations. 405
406
Though there is a long list of TEIs fluxes that could be determined using this 407
method, we chose to focus on four (dissolved Fe, Mn, Co, Zn) that span a range of 408
particle reactivity and play a role in upper ocean biogeochemical cycling. The 409
ΔTEI/Δ228Ra ratios were calculated using equation (1) from averaged concentration 410
data for the two Northwest Atlantic nearshore stations (GA03, KN204-1 stations 411
1,2) and open ocean station 16 (GA03, KN204-1; Fig. 7b). 412
413
By combining the model 228Ra fluxes and ΔTEI/Δ228Ra, we can estimate the annual 414
shelf TEI inputs to the western North Atlantic Ocean (Table 1). The western N. 415
Atlantic shelf Co flux (1.40.4x108 mol/y) is consistent with literature estimates 416
from a variety of independent approaches. Saito et al. [94] estimated that the shelf 417
dissolved Co flux for the Peru upwelling region was 2.0x10⁷ mol/y, which compares 418
well with our estimate considering that we integrated over a ~7 times larger area. 419
Lateral shelf area normalized Co fluxes of 6.2-10 µmol m-2 y-1 were reported by 420
Bown et al. [95] for the S. Atlantic near Cape Town. These are a factor of ~5-10 421
lower than the shelf-normalized fluxes for the western N. Atlantic margin (Table 1; 422
14
56 µmol m-2 y-1), though their estimate was based on transport across a boundary 423
several hundred km from the shelf-break. 424
425
The ΔTEI/Δ228Ra approach yielded a shelf Fe flux of 3.91.4x108 mol/y for the 426
western N. Atlantic. When normalized to shelf-area, this flux is 160 µmol m-2 y-1. 427
Sedimentary Fe inputs [88], which are expectedly higher as they do not account for 428
any removal over the shelf, range from 900 µmol m-2 y-1 [73] to 1570 µmol m-2 y-1 429
[71] to 2700 µmol m-2 y-1 [96]. On a global scale, the shelf-sedimentary Fe inputs as 430
reported by Tagliabue et al. [73], Elrod et al. [71], and Dale et al. [96] are 2.7x10¹⁰ 431
mol/y, 8.9x10¹⁰ mol/y, and 7.2x10¹⁰ mol/y, respectively. The western N. Atlantic 432
Ocean total shelf input as determined by our method would therefore represent 433
only 0.4-1.4% of the global sediment flux. If we assume that our ΔFe/Δ228Ra is 434
comparable to the global shelf average, our approach would predict a global shelf-435
ocean Fe flux of 2.3x10⁹ mol/y. If the western N. Atlantic shelf is representative of 436
shelf systems globally, our model suggests that only a small fraction of the shelf 437
sedimentary Fe input is exported to the open ocean and therefore available for 438
biological uptake where Fe may be limiting. 439
440
The western N. Atlantic Mn shelf flux is 5.41.0x108 mol/y or 220 µmol m-2 y-1. 441
Literature values for shelf Mn fluxes are largely focused on the shelf sediment 442
source. For example, Landing and Bruland [97] reported sedimentary Mn flux of up 443
to 140 µmol m-2 y-1 for the Monterey Shelf, while McManus et al. [98] observed much 444
higher values for the Oregon/California shelf (2900±900 µmol m-2 y-1). The former 445
agrees quite well with our estimate based on equation (1) while the latter is likely 446
higher due to the high productivity associated with the strong upwelling in that 447
region. Lastly, the total Zn shelf flux is 1.60.6x109 mol/y or 630 µmol m-2 y-1. To the 448
best of our knowledge, the shelf Zn flux estimates reported herein are the first of 449
their kind. 450
451
15
In terms of other major sources to the surface ocean, shelf inputs can be on par with 452
or even dominant for certain TEIs. The dissolved cobalt flux for the western N. 453
Atlantic shelf alone is over an order of magnitude higher than the atmospheric 454
deposition of soluble Co to the entire ocean basin as reported by two independent 455
studies (~11x106 mol/y; [99, 100]). Soluble Fe (wet+dry) atmospheric deposition to 456
the tropical N. Atlantic ranges from 2.9-43 µmol m-2 y-1 [101]; scaled to the basin the 457
atmospheric Fe flux becomes 1.2-18x108 mol/y or 31-460% of the western North 458
Atlantic dissolved shelf flux using the TEI/228Ra approach. Powell et al. [101] also 459
reported soluble (wet+dry) atmospheric Mn fluxes, which we scaled to the N. 460
Atlantic (0.75-15x108 mol/y), equivalent to 14-280% of the shelf inputs reported 461
herein. Assuming 15% solubility, Little et al. [102] estimated the atmospheric Zn 462
input to the surface ocean to be 6.9x10⁷ mol/y; our estimates for the western North 463
Atlantic shelf alone exceed that flux by a factor of ~23. Higher concentrations of Zn 464
along with lighter isotopes were observed at both eastern and western Atlantic 465
margins indicating sediments were a source of Zn to this region [83]. Our net shelf-466
ocean flux of Zn is almost a factor of three higher than the Little et al. [102] global 467
estimate for riverine input (5.9x10⁸ mol/y); this is in contrast with their suggestion 468
that scavenging removal of Zn and burial in continental margin sediments might 469
represent the “missing sink” for Zn in the global ocean mass balance for this 470
element. 471
472
3. Recommendations for the future 473
We have presented a possible path forward in quantifying TEI shelf-open ocean 474
exchange rates using 228Ra and demonstrated the potential of the method by 475
focusing on the western North Atlantic Ocean. This exercise was made possible by 476
publication of a recent global model for shelf radium inputs and synoptic TEI and 477
228Ra measurements on a series of U.S. GEOTRACES cruises in 2010-11. Since Ra 478
isotope measurements are not a requirement for GEOTRACES compliance, we 479
suggest that future section cruises and shelf process studies include at least 228Ra so 480
that we can better understand how to relate this tracer to other TEIs. Ra isotope 481
data are especially needed for the Indian and Pacific Oceans where historical data 482
16
coverage is sparse. Shelf process studies would be needed for a range of shelf 483
settings, i.e. how do ΔTEI/Δ228Ra ratios vary seasonally and as a function of 484
hydrological state, shelf width, and coastline lithology (e.g. karst vs. volcanic)? 485
Lastly, for shelf environments where advection plays an important role in TEI 486
transport, a second conservative tracer in addition to 228Ra would be needed to 487
constrain the shelf-ocean TEI flux (Supplementary Material). 488
489
While we have used an inverse approach, which was based on a coarse resolution 490
model, in order to calculate shelf fluxes at a near basin-wide scale, a finer resolution 491
model needs to be combined with coastal 228Ra and TEI data in order to constrain 492
various shelf TEI sources more precisely. Where 228Ra measurements are not 493
possible on future GEOTRACES cruises, we advocate for concurrent physical 494
measurements that may also be used to quantify the shelf flux of TEIs. For example, 495
Tanaka et al. [103] combined DFe distributions with turbulence measurements 496
using a vertical microstructure profiler (VMP) in the Bering Sea; they found that 497
productivity in this region was driven in part by injections of iron-rich subsurface 498
layer at the southeastern shelf break. 499
500
Our discussion above highlights the potential importance of shelf processes on open 501
ocean TEI distributions. Results to date are somewhat limited because of the 502
programmatic emphasis placed on open ocean full depth profiles. For example, lack 503
of data over the shelf for GA03 precluded the inclusion of the eastern boundary 504
shelves in our analysis of TEI fluxes to the North Atlantic Ocean. To better 505
understand the role of shelf input to the open ocean (and vice versa) in global TEI 506
budgets, future GEOTRACES sections may need to be reconfigured with an increased 507
emphasis on shelf stations. Given the shallow depths involved, this change would 508
not impact ship-time requirements to any significant extent. Also, sections in 509
regions with wide shelves and high ratios of shelf area to open water will be 510
particularly useful. The recent 2015 Canadian, U.S., and German sections in the 511
Arctic Ocean are examples of this approach. Fortunately, Ra isotopes were measured 512
on all three cruises. 513

17
514
There are a number of margin-centric GEOTRACES sections that have been 515
identified in the program planning documents but have yet to be realized due to a 516
variety of factors. These include two of the three proposed for the coastal China 517
seas, Brazil margin, and the Gulf of Mexico. Regarding the latter, the 2007 518
GEOTRACES Atlantic Workshop Report identified a section through the Caribbean 519
and Gulf of Mexico that contains significant opportunities to examine shelf impacts. 520
Roughly a third of the area of the Gulf of Mexico is comprised of shelf waters less 521
than 200 m deep. Portions of the coastline are river dominated (Mississippi) while 522
others are groundwater runoff dominated carbonate platforms (Yucatan peninsula, 523
southern Florida). Furthermore, the Loop Current, a major oceanic current, runs 524
through the Gulf, variably interacting with the shelf. Thus, the Gulf of Mexico is a 525
unique basin for the study of margin/open ocean interactions. Surprisingly, though, 526
despite the significant interest in Louisiana Shelf hypoxia in the northern Gulf as 527
well as recent studies engendered by the Deepwater Horizon blowout, few studies 528
have addressed the issue of the shelf’s influence on open Gulf waters and then 529
generally only in a tangential way. For instance, early studies by Brooks et al. [104], 530
Reid [105], and Todd et al. [106] all pointed to the likelihood of off-shelf transport of 531
methane and radium in the Gulf. Likewise, Trefry and Presley [107] suggested that 532
Mn fluxes from shelf sediments provided a source for ‘excess’ Mn in deep Gulf of 533
Mexico sediments. Nonetheless, these studies have not been followed up by more 534
detailed surveys or process studies. Surprisingly, TEI distributions in open waters of 535
the Gulf are generally unknown. 536
537
In this report, we have summarized evidence supporting the importance of 538
continental shelves and shelf seas in the oceanic mass balance of TEIs. Furthermore, 539
we have outlined a methodology utilizing 228Ra to more consistently estimate the 540
flux of TEIs from the margins to the open ocean. To improve these estimates, we 541
recommend that GEOTRACES sections place more emphasis on sampling along the 542
margins and that increased consideration be given to completing margin-focused 543
sections, such as that previously proposed for the Gulf of Mexico. 544
18
Data accessibility 545
http://data.bco-dmo.org/jg/dir/BCO/GEOTRACES/NorthAtlanticTransect/ 546
547
Authors’ contributions 548
All authors contributed to the discussion that formed the basis of this manuscript 549
during the Royal Society workshop on “Quantifying fluxes and processes in trace-550
metal cycling at ocean boundaries” (Chicheley Hall, UK, December 9-10, 2015). 551
M.A.C. wrote the manuscript with significant written contributions or editorial 552
comments from all authors. M.A.C., P.J.L., M.C.L, and E.Y.K. developed the concept for 553
228Ra as a TEI shelf flux gauge. V.H. and G.A.C. wrote the introduction. A.M. organized 554
the vast reference list. C.J., A.M.S., P.W.B., W.B.H., H.T., P.S.A., D.P., and F.D. 555
contributed written examples and figures for the review section of the manuscript. 556
All authors gave final approval for publication. 557
558
Competing interests 559
The authors’ declare no competing interests. 560
561
Funding 562
This paper would not have been possible without the financial support of a number 563
of national funding agencies (U.S. NSF OCE-1458305 to M.A.C.; Korea NRF-564
2013R1A1A1058203 to E.Y.K; U.K. NERC NE/G016267/1 to M.C.L and A.M.; U.K. 565
NERC NE/K009532/1 to W.B.H.). 566
567
Acknowledgements 568
We thank Gideon Henderson and the meeting organizers for inviting us to 569
participate in the Royal Society workshop and contribute a paper to the special 570
issue. For their constructive comments on the manuscript the authors thank Editor 571
Micha Rijkenberg, Michiel Rutgers van der Loeff, and one anonymous reviewer. We 572
gratefully acknowledge Francois Primeau for his feedback on derivation of the TEI 573
flux model and Abby Bull of the British Oceanographic Data Centre for her 574
assistance with data mining for the paper. 575
19
576
Literature Cited 577
1. Simpson JH, Sharples J. Introduction to the Physical and Biological 578 Oceanography of Shelf Seas: Cambridge University Press; 2012. 579
2. Bourgeois T, Orr JC, Resplandy L, Ethé C, Gehlen M, Bopp L. Coastal-ocean 580 uptake of anthropogenic carbon. Biogeosci Disc. 2016;2016:1-34. 581
3. Chen C-TA, Borges AV. Reconciling opposing views on carbon cycling in the 582 coastal ocean: Continental shelves as sinks and near-shore ecosystems as 583 sources of atmospheric CO2. Deep Sea Res (Part II: Top Stud Oceanogr). 584 2009;56(8-10):578-90. 585
4. Regnier P, Friedlingstein P, Ciais P, Mackenzie FT, Gruber N, Janssens IA, et al. 586 Anthropogenic perturbation of the carbon fluxes from land to ocean. Nature 587 Geo. 2013;6(8):597-607. 588
5. Olausson E, Cato I, (Eds). Chemistry and biochemistry of estuaries. 589 Chichester: John Wiley & Sons Ltd; 1980. 452 p. 590
6. Boyle EA, Edmond JM, Sholkovitz ER. Mechanism of iron removal in 591 estuaries. Geochim Cosmochim Acta. 1977;41(9):1313-24. 592
7. Eckert JM, Sholkovitz ER. Flocculation of iron, aluminum and humates from 593 river water by electrolytes. Geochim Cosmochim Acta. 1976;40(7):847-8. 594
8. Sholkovitz ER, Copland D. The coagulation, solubility and adsorption 595 properties of Fe, Mn, Cu, Ni, Cd, Co and humic acids in a river water. Geochim 596 Cosmochim Acta. 1981;45(2):181-9. 597
9. Barnes CE, Cochran JK. Uranium geochemistry in estuarine sediments - 598 controls on removal and release processes. Geochim Cosmochim Acta. 599 1993;57(3):555-69. 600
10. Church TM, Sarin MM, Fleisher MQ, Ferdelman TG. Salt marshes: An 601 important coastal sink for dissolved uranium. Geochim Cosmochim Acta. 602 1996;60(20):3879-87. 603
11. Andersen MB, Stirling CH, Porcelli D, Halliday AN, Andersson PS, Baskaran M. 604 The tracing of riverine U in Arctic seawater with very precise U-234/U-238 605 measurements. Earth Planet Sci Lett. 2007;259(1-2):171-85. 606
12. Elderfield H, Upstillgoddard R, Sholkovitz ER. The rare-earth elements in 607 rivers, estuaries, and coastal seas and their significance to the composition of 608 ocean waters. Geochim Cosmochim Acta. 1990;54(4):971-91. 609
13. Rousseau TCC, Sonke JE, Chmeleff J, van Beek P, Souhaut M, Boaventura G, et 610 al. Rapid neodymium release to marine waters from lithogenic sediments in 611 the Amazon estuary. Nature Comm. 2015;6. 612
14. Sholkovitz E, Szymczak R. The estuarine chemistry of rare earth elements: 613 comparison of the Amazon, Fly, Sepik and the Gulf of Papua systems. Earth 614 Planet Sci Lett. 2000;179(2):299-309. 615
15. Sholkovitz ER, Cochran JK, Carey AE. Laboratory stidues of the diagenesis 616 and mobility of Pu-239, Pu-240 and Cs-137 in nearshore sediments. Geochim 617 Cosmochim Acta. 1983;47(8):1369-79. 618
20
16. Carroll J, Falkner KK, Brown ET, Moore WS. The role of the Ganges-619 Brahmaputra mixing zone in supplying barium and Ra-226 to the Bay of 620 Bengal. Geochim Cosmochim Acta. 1993;57(13):2981-90. 621
17. Coffey M, Dehairs F, Collette O, Luther G, Church T, Jickells T. The behaviour 622 of dissolved barium in estuaries. Estuar Coast Shelf Sci. 1997;45(1):113-21. 623
18. Edmond JM, Boyle ED, Drummond D, Grant B, Mislick T. Desorption of 624 barium in the plume of the Zaire (Congo) River. Netherlands J of Sea Res. 625 1978;12(3-4):324-8. 626
19. Hanor JS, Chan LH. Non-conservative behaviour of barium during mixing of 627 Mississippi River and Gulf of Mexico waters. Earth Planet Sci Lett. 628 1977;37(2):242-50. 629
20. Li YH, Chan LH. Desorption of Ba and Ra-226 from river-borne sediments in 630 the Hudson estuary. Earth Planet Sci Lett. 1979;43(3):343-50. 631
21. Martin JM, Meybeck M. Elemental mass-balance of material carried by major 632 world rivers. Mar Chem. 1979;7(3):173-206. 633
22. Burnett WC, Dulaiova H, Stringer C, Peterson R. Submarine groundwater 634 discharge: Its measurement and influence on the coastal zone. J Coast Res. 635 2006:35-8. 636
23. Moore WS. Large groundwater inputs to coastal waters revealed by Ra-226 637 enrichments. Nature. 1996;380(6575):612-4. 638
24. Moore WS, Sarmiento JL, Key RM. Submarine groundwater discharge 639 revealed by Ra-228 distribution in the upper Atlantic Ocean. Nature Geo. 640 2008;1(5):309-11. 641
25. Rodellas V, Garcia-Orellana J, Masque P, Feldman M, Weinstein Y. Submarine 642 groundwater discharge as a major source of nutrients to the Mediterranean 643 Sea. Proc Natl Acad Sci USA. 2015;112(13):3926-30. 644
26. Kwon EY, Kim G, Primeau F, Moore WS, Cho H-M, DeVries T, et al. Global 645 estimate of submarine groundwater discharge based on an observationally 646 constrained radium isotope model. Geophys Res Lett. 2014;41(23):8438-44. 647
27. Windom HL, Moore WS, Niencheski LFH, Jahrike RA. Submarine groundwater 648 discharge: A large, previously unrecognized source of dissolved iron to the 649 South Atlantic Ocean. Mar Chem. 2006;102(3-4):252-66. 650
28. Bone SE, Charette MA, Lamborg CH, Gonneea ME. Has submarine 651 groundwater discharge been overlooked as a source of mercury to coastal 652 waters? Environ Sci Technol. 2007;41(9):3090-5. 653
29. Trezzi G, Garcia-Orellana J, Santos-Echeandia J, Rodellas V, Garcia-Solsona E, 654 Garcia-Fernandez G, et al. The influence of a metal-enriched mining waste 655 deposit on submarine groundwater discharge to the coastal sea. Mar Chem. 656 2016;178:35-45. 657
30. Gonneea ME, Charette MA, Liu Q, Herrera-Silveira JA, Morales-Ojeda SM. 658 Trace element geochemistry of groundwater in a karst subterranean estuary 659 (Yucatan Peninsula, Mexico). Geochim Cosmochim Acta. 2014;132:31-49. 660
31. Arsouze T, Dutay JC, Lacan F, Jeandel C. Reconstructing the Nd oceanic cycle 661 using a coupled dynamical - biogeochemical model. Biogeosciences. 662 2009;6(12):2829-46. 663
21
32. Jeandel C, Oelkers EH. The influence of terrigenous particulate material 664 dissolution on ocean chemistry and global element cycles. Chem Geol. 665 2015;395:50-66. 666
33. Tachikawa K, Athias V, Jeandel C. Neodymium budget in the modern ocean 667 and paleo-oceanographic implications. J Geophys Res:Oceans. 2003;108(C8). 668
34. Abbott AN, Haley BA, McManus J, Reimers CE. The sedimentary flux of 669 dissolved rare earth elements to the ocean. Geochim Cosmochim Acta. 670 2015;154:186-200. 671
35. Blain S, Queguiner B, Armand L, Belviso S, Bombled B, Bopp L, et al. Effect of 672 natural iron fertilization on carbon sequestration in the Southern Ocean. 673 Nature. 2007;446(7139):1070-U1. 674
36. Bowie AR, van der Merwe P, Queroue F, Trull T, Fourquez M, Planchon F, et 675 al. Iron budgets for three distinct biogeochemical sites around the Kerguelen 676 Archipelago (Southern Ocean) during the natural fertilisation study, KEOPS-677 2. Biogeosciences. 2015;12(14):4421-45. 678
37. Pollard RT, Salter I, Sanders RJ, Lucas MI, Moore CM, Mills RA, et al. Southern 679 Ocean deep-water carbon export enhanced by natural iron fertilization. 680 Nature. 2009;457(7229):577-U81. 681
38. Anderson RF, Mawji E, Cutter GA, Measures CI, Jeandel C. GEOTRACES 682 Changing the Way We Explore Ocean Chemistry. Oceanography. 683 2014;27(1):50-61. 684
39. Anderson RF, Henderson GM. Program update: GEOTRACES—A Global study 685 of the marine biogeochemical cycles of trace elements and their isotopes. 686 Oceanography. 2005;18(3):76-9. 687
40. Plan GS. GEOTRACES: An international study of the marine biogeochemical 688 cycles of traces elements and their isotopes: Scientific Committee in Ocean 689 Research; 2006. 690
41. Mawji E, Schlitzer R, Dodas EM, Abadie C, Abouchami W, Anderson RF, et al. 691 The GEOTRACES Intermediate Data Product 2014. Mar Chem. 2015;177:1-8. 692
42. Glavovic BC, Limburg K, Liu KK, Emeis KC, Thomas H, Kremer H, et al. Living 693 on the Margin in the Anthropocene: engagement arenas for sustainability 694 research and action at the ocean-land interface. Curr Opin Env Sustain. 695 2015;14:232-8. 696
43. McGranahan G, Balk D, Anderson B. The rising tide: assessing the risks of 697 climate change and human settlements in low elevation coastal zones. 698 Environ Urban. 2007;19(1):17-37. 699
44. Small C, Nicholls RJ. A global analysis of human settlement in coastal zones. J 700 Coast Res. 2003;19(3):584-99. 701
45. Boyle EA, Lee J-M, Echegoyen Y, Noble A, Moos S, Carrasco G, et al. 702 Anthropogenic Lead Emission in the Ocean The Evolving Global Experiment. 703 Oceanography. 2014;27(1):69-75. 704
46. Lamborg CH, Hammerschmidt CR, Bowman KL, Swarr GJ, Munson KM, 705 Ohnemus DC, et al. A global ocean inventory of anthropogenic mercury based 706 on water column measurements. Nature. 2014;512(7512):65-+. 707
22
47. Bhatia MP, Kujawinski EB, Das SB, Breier CF, Henderson PB, Charette MA. 708 Greenland meltwater as a significant and potentially bioavailable source of 709 iron to the ocean. Nature Geo. 2013;6(4):274-8. 710
48. Hopwood MJ, Bacon S, Arendt K, Connelly DP, Statham PJ. Glacial meltwater 711 from Greenland is not likely to be an important source of Fe to the North 712 Atlantic. Biogeochemistry. 2015;124(1-3):1-11. 713
49. Jeandel C. Solid river inputs and ocean margins as critical sources of elements 714 to the oceans. Philos Trans R Soc London, Ser A. 2016;In Press (this issue). 715
50. Jakobsson M. Hypsometry and volume of the Arctic Ocean and its constituent 716 seas. Geochem Geophys Geosystems. 2002;3. 717
51. Aagaard K, Carmack EC. The role of sea ice and other freshwater in the arctic 718 circulation. J Geophys Res:Oceans. 1989;94(C10):14485-98. 719
52. Moore RM. Oceanographic distributions of zinc, cadmium, copper and 720 aluminum in waters of the central Arctic. Geochim Cosmochim Acta. 721 1981;45(12):2475-82. 722
53. Ripperger S, Rehkaemper M, Porcelli D, Halliday AN. Cadmium isotope 723 fractionation in seawater - A signature of biological activity. Earth Planet Sci 724 Lett. 2007;261(3-4):670-84. 725
54. Lambelet M, Rehkaemper M, de Flierdt Tv, Xue Z, Kreissig K, Coles B, et al. 726 Isotopic analysis of Cd in the mixing zone of Siberian rivers with the Arctic 727 Ocean-New constraints on marine Cd cycling and the isotope composition of 728 riverine Cd. Earth Planet Sci Lett. 2013;361:64-73. 729
55. Roeske T, Bauch D, Van Der Loeff MR, Rabe B. Utility of dissolved barium in 730 distinguishing North American from Eurasian runoff in the Arctic Ocean. Mar 731 Chem. 2012;132:1-14. 732
56. Thomas H, Shadwick E, Dehairs F, Lansard B, Mucci A, Navez J, et al. Barium 733 and carbon fluxes in the Canadian Arctic Archipelago. J Geophys Res:Oceans. 734 2011;116. 735
57. Middag R, de Baar HJW, Laan P, Klunder MB. Fluvial and hydrothermal input 736 of manganese into the Arctic Ocean. Geochim Cosmochim Acta. 737 2011;75(9):2393-408. 738
58. McAlister JA, Orians KJ. Dissolved gallium in the Beaufort Sea of the Western 739 Arctic Ocean: A GEOTRACES cruise in the International Polar Year. Mar 740 Chem. 2015;177:101-9. 741
59. Andersson PS, Porcelli D, Frank M, Bjork G, Dahlqvist R, Gustafsson O. 742 Neodymium isotopes in seawater from the Barents Sea and Fram Strait 743 Arctic-Atlantic gateways. Geochim Cosmochim Acta. 2008;72(12):2854-67. 744
60. Porcelli D, Andersson PS, Baskaran M, Frank M, Bjork G, Semiletov I. The 745 distribution of neodymium isotopes in Arctic Ocean basins. Geochim 746 Cosmochim Acta. 2009;73(9):2645-59. 747
61. Dahlqvist RM, Andersson PS, Porcelli D. REE seawater concentrations in the 748 Bering Strait and the Chukchi Sea. Ocean Sciences 2008 Meeting Poster 749 session #0722008. 750
62. Persson P, Andersson PS, Porcelli D, Semiletov I. The influence of Lena River 751 water inflow and shelf sediment-sea water exchange for the Nd isotopic 752
23
composition in the Laptev Sea and Arctic Ocean. European Geosciences 753 Union 2011 Meeting Abstract 1012032011. 754
63. Alling V, Sanchez-Garcia L, Porcelli D, Pugach S, Vonk JE, van Dongen B, et al. 755 Nonconservative behavior of dissolved organic carbon across the Laptev and 756 East Siberian seas. Global Biogeochem Cycles. 2010;24. 757
64. Alling V, Porcelli D, Morth CM, Anderson LG, Sanchez-Garcia L, Gustafsson O, 758 et al. Degradation of terrestrial organic carbon, primary production and out-759 gassing of CO2 in the Laptev and East Siberian Seas as inferred from delta C-760 13 values of DIC. Geochim Cosmochim Acta. 2012;95:143-59. 761
65. Portnov A, Smith AJ, Mienert J, Cherkashov G, Rekant P, Semenov P, et al. 762 Offshore permafrost decay and massive seabed methane escape in water 763 depths > 20m at the South Kara Sea shelf. Geophys Res Lett. 764 2013;40(15):3962-7. 765
66. Shakhova N, Semiletov I, Salyuk A, Yusupov V, Kosmach D, Gustafsson O. 766 Extensive Methane Venting to the Atmosphere from Sediments of the East 767 Siberian Arctic Shelf. Science. 2010;327(5970):1246-50. 768
67. Whitmore L, Shiller AM. Dissolved methane in the US GEOTRACES Arctic 769 scetion. Ocean Sciences 2016 Meeting Poster A44A-26832016. 770
68. Rutgers van der Loeff M, Key RM, Scholten J, Bauch D, Michel A. Ra-228 as a 771 tracer for shelf water in the Arctic Ocean. Deep Sea Res (Part II: Top Stud 772 Oceanogr). 1995;42(6):1533-53. 773
69. Rutgers van der Loeff M, Cai P, Stimac I, Bauch D, Hanfland C, Roeske T, et al. 774 Shelf-basin exchange times of Arctic surface waters estimated from Th-775 228/Ra-228 disequilibrium. J Geophys Res:Oceans. 2012;117. 776
70. Aguilar-Islas AM, Hurst MP, Buck KN, Sohst B, Smith GJ, Lohan MC, et al. 777 Micro- and macronutrients in the southeastern Bering Sea: Insight into iron-778 replete and iron-depleted regimes. Prog Oceanogr. 2007;73(2):99-126. 779
71. Elrod VA, Berelson WM, Coale KH, Johnson KS. The flux of iron from 780 continental shelf sediments: A missing source for global budgets. Geophys 781 Res Lett. 2004;31(12):art. no.-L12307. 782
72. Tyrrell T, Merico A, Waniek JJ, Wong CS, Metzl N, Whitney F. Effect of seafloor 783 depth on phytoplankton blooms in high-nitrate, low-chlorophyll (HNLC) 784 regions. J Geophys Res: Biogeosci. 2005;110(G2). 785
73. Tagliabue A, Aumont O, Bopp L. The impact of different external sources of 786 iron on the global carbon cycle. Geophys Res Lett. 2014;41(3):920-6. 787
74. Charette MA, Gonneea ME, Morris PJ, Statham P, Fones G, Planquette H, et al. 788 Radium isotopes as tracers of iron sources fueling a Southern Ocean 789 phytoplankton bloom. Deep Sea Res (Part II: Top Stud Oceanogr). 790 2007;54(18-20):1989-98. 791
75. Dulaiova H, Ardelan MV, Henderson PB, Charette MA. Shelf-derived iron 792 inputs drive biological productivity in the southern Drake Passage. Global 793 Biogeochem Cycles. 2009;23. 794
76. van Beek P, Bourquin M, Reyss JL, Souhaut M, Charette MA, Jeandel C. Radium 795 isotopes to investigate the water mass pathways on the Kerguelen Plateau 796 (Southern Ocean). Deep Sea Res (Part II: Top Stud Oceanogr). 2008;55(5-797 7):622-37. 798
24
77. Boyd PW, Strzepek R, Chiswell S, Chang H, DeBruyn JM, Ellwood M, et al. 799 Microbial control of diatom bloom dynamics in the open ocean. Geophys Res 800 Lett. 2012;39. 801
78. John SG, Adkins J. The vertical distribution of iron stable isotopes in the 802 North Atlantic near Bermuda. Global Biogeochem Cycles. 2012;26. 803
79. Labatut M, Lacan F, Pradoux C, Chmeleff J, Radic A, Murray JW, et al. Iron 804 sources and dissolved-particulate interactions in the seawater of the 805 Western Equatorial Pacific, iron isotope perspectives. Global Biogeochem 806 Cycles. 2014;28(10):1044-65. 807
80. Lacan F, Radic A, Jeandel C, Poitrasson F, Sarthou G, Pradoux C, et al. 808 Measurement of the isotopic composition of dissolved iron in the open ocean. 809 Geophys Res Lett. 2008;35(24):5. 810
81. Radic A, Lacan F, Murray JW. Iron isotopes in the seawater of the equatorial 811 Pacific Ocean: New constraints for the oceanic iron cycle. Earth Planet Sci 812 Lett. 2011;306(1-2):1-10. 813
82. Conway TM, Rosenberg AD, Adkins JF, John SG. A new method for precise 814 determination of iron, zinc and cadmium stable isotope ratios in seawater by 815 double-spike mass spectrometry. Anal Chim Acta. 2013;793:44-52. 816
83. Conway TM, John SG. Quantification of dissolved iron sources to the North 817 Atlantic Ocean. Nature. 2014;511(7508):212-+. 818
84. Fitzsimmons JN, Carrasco GG, Wu J, Roshan S, Hatta M, Measures CI, et al. 819 Partitioning of dissolved iron and iron isotopes into soluble and colloidal 820 phases along the GA03 GEOTRACES North Atlantic Transect. Deep Sea Res 821 (Part II: Top Stud Oceanogr). 2015;116:130-51. 822
85. Homoky WB, John SG, Conway TM, Mills RA. Distinct iron isotopic signatures 823 and supply from marine sediment dissolution. Nature Comm. 2013;4:10. 824
86. Homoky WB, Severmann S, Mills RA, Statham PJ, Fones GR. Pore-fluid Fe 825 isotopes reflect the extent of benthic Fe redox recycling: Evidence from 826 continental shelf and deep-sea sediments. Geology. 2009;37(8):751-4. 827
87. Homoky WB, Hembury DJ, Hepburn LE, Mills RA, Statham PJ, Fones GR, et al. 828 Iron and manganese diagenesis in deep sea volcanogenic sediments and the 829 origins of pore water colloids. Geochim Cosmochim Acta. 2011;75(17):5032-830 48. 831
88. Homoky WB, Weber T, Berelson WM, Conway TM, Henderson GM, van Hulten 832 M, et al. An assessment of oceanic trace element and isotope exchange at the 833 sediment-water boundary. Philos Trans R Soc London, Ser A. 2016;In Press 834 (this issue). 835
89. Charette MA, Morris PJ, Henderson PB, Moore WS. Radium isotope 836 distributions during the US GEOTRACES North Atlantic cruises. Mar Chem. 837 2015;177:184-95. 838
90. Moore WS, Astwood H, Lindstrom C. Radium isotopes in coastal waters on 839 the Amazon shelf. Geochim Cosmochim Acta. 1995;59(20):4285-98. 840
91. Krest JM, Moore WS, Rama. Ra-226 and Ra-228 in the mixing zones of the 841 Mississippi and Atchafalaya Rivers: indicators of groundwater input. Mar 842 Chem. 1999;64(3):129-52. 843
25
92. Moore WS. Inappropriate attempts to use distributions of Ra-228 and Ra-226 844 in coastal waters to model mixing and advection rates. Cont Shelf Res. 845 2015;105:95-100. 846
93. Moore WS. Determining coastal mixing rates using radium isotopes. Cont 847 Shelf Res. 2000;20(15):1993-2007. 848
94. Saito MA, Moffett JW, DiTullio GR. Cobalt and nickel in the Peru upwelling 849 region: A major flux of labile cobalt utilized as a micronutrient. Global 850 Biogeochem Cycles. 2004;18(4). 851
95. Bown J, Boye M, Baker A, Duvieilbourg E, Lacan F, Le Moigne F, et al. The 852 biogeochemical cycle of dissolved cobalt in the Atlantic and the Southern 853 Ocean south off the coast of South Africa. Mar Chem. 2011;126(1-4):193-206. 854
96. Dale AW, Nickelsen L, Scholz F, Hensen C, Oschlies A, Wallmann K. A revised 855 global estimate of dissolved iron fluxes from marine sediments. Global 856 Biogeochem Cycles. 2015;29(5):691-707. 857
97. Landing WM, Bruland KW. The Contrasting Biogeochemistry of Iron and 858 Manganese in the Pacific-Ocean. Geochim Cosmochim Acta. 1987;51(1):29-859 43. 860
98. McManus J, Berelson WM, Severmann S, Johnson KS, Hammond DE, Roy M, et 861 al. Benthic manganese fluxes along the Oregon-California continental shelf 862 and slope. Cont Shelf Res. 2012;43:71-85. 863
99. Saito MA, Moffett JW. Temporal and spatial variability of cobalt in the Atlantic 864 Ocean. Geochim Cosmochim Acta. 2002;66(11):1943-53. 865
100. Dulaquais G, Boye M, Rijkenberg MJA, Carton X. Physical and 866 remineralization processes govern the cobalt distribution in the deep 867 western Atlantic Ocean. Biogeosciences. 2014;11(6):1561-80. 868
101. Powell CF, Baker AR, Jickells TD, Bange HW, Chance RJ, Yodle C. Estimation of 869 the Atmospheric Flux of Nutrients and Trace Metals to the Eastern Tropical 870 North Atlantic Ocean. J Atmos Sci. 2015;72(10):4029-45. 871
102. Little SH, Vance D, Walker-Brown C, Landing WM. The oceanic mass balance 872 of copper and zinc isotopes, investigated by analysis of their inputs, and 873 outputs to ferromanganese oxide sediments. Geochim Cosmochim Acta. 874 2014;125:673-93. 875
103. Tanaka T, Yasuda I, Kuma K, Nishioka J. Vertical turbulent iron flux sustains 876 the Green Belt along the shelf break in the southeastern Bering Sea. Geophys 877 Res Lett. 2012;39. 878
104. Brooks JM, Reid DF, Bernard BB. Methane in the upper water column of the 879 northwestern Gulf of Mexico. J Geophys Res:Oceans. 1981;86(NC11):1029-880 40. 881
105. Reid DF. Radium variability produced by shelf-water transport and mixing in 882 the western Gulf of Mexico. Deep Sea Res (Part I: Oceanogr Res Papers). 883 1984;31(12):1501-10. 884
106. Todd JF, Wong GTF, Reid DF. The geochemistries of Po-210 and Pb-210 in 885 waters overlying and within the Orca Basin, Gulf of Mexico. Deep Sea Res 886 (Part I: Oceanogr Res Papers). 1986;33(10):1293-306. 887
107. Trefry JH, Presley BJ. Manganese fluxes from Mississippi Delta sediments. 888 Geochim Cosmochim Acta. 1982;46(10):1715-26. 889
26
108. Sholkovitz ER. The geochemistry of rare-earth elements in the Amazon River 890 estuary. Geochim Cosmochim Acta. 1993;57(10):2181-90. 891
892
27
Tables 893
894
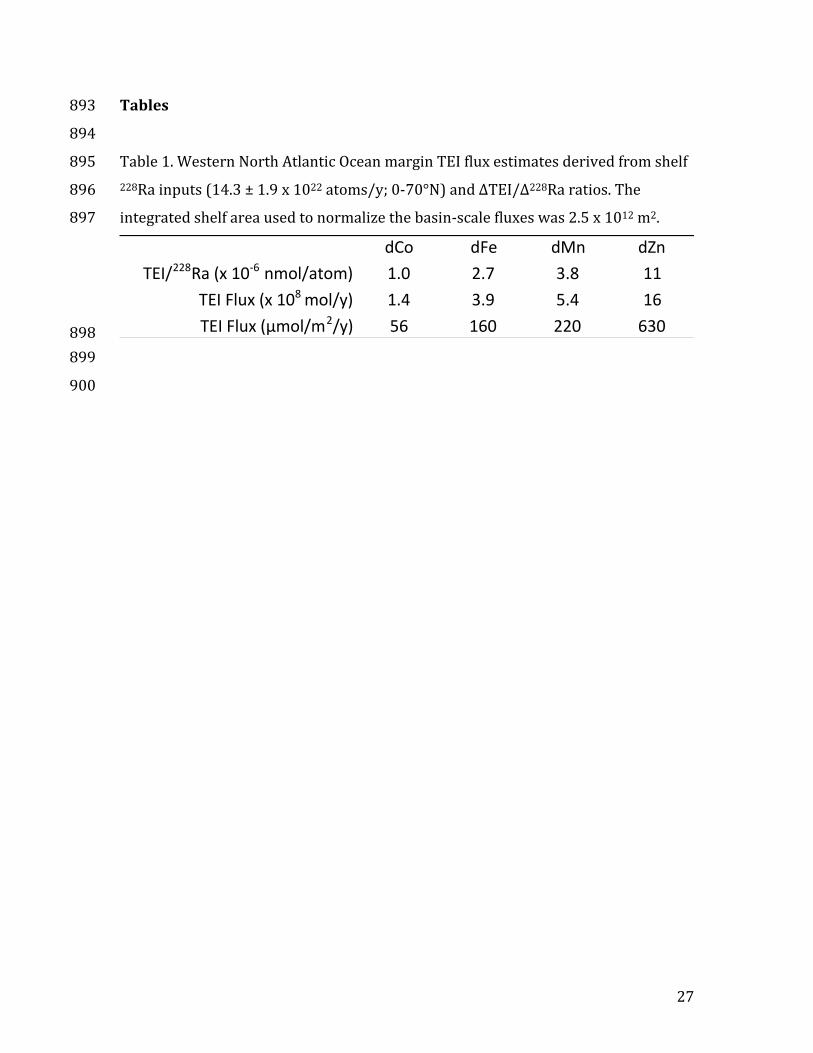
Table 1. Western North Atlantic Ocean margin TEI flux estimates derived from shelf 895
228Ra inputs (14.3 ± 1.9 x 10²² atoms/y; 0-70°N) and ΔTEI/Δ228Ra ratios. The 896
integrated shelf area used to normalize the basin-scale fluxes was 2.5 x 10¹² m2. 897
898
899
900
dCo dFe dMn dZn
TEI/228Ra(x10-6nmol/atom) 1.0 2.7 3.8 11
TEIFlux(x108mol/y) 1.4 3.9 5.4 16
TEIFlux(µmol/m2/y) 56 160 220 630
28
Figures 901
902
Figure 1. Dissolved Ba concentrations observed in the Canadian Arctic Archipelago 903
during the Canadian CFL-IPY-GEOTRACES program in 2007-2008. A) Profiles of four 904
selected stations across the Archipelago. The easternmost station (blue symbols) is 905
under the influence of northward flowing North Atlantic waters, which reveal 906
substantially lower Ba concentrations than waters sampled at stations within the 907
Archipelago. The westernmost station (purple stars) near the Horton River estuary 908
depicts the riverine surface source of Ba. In Archipelagic waters (green circles), Ba 909
displays a subsurface maximum, which in turn can be used to trace the eastward 910
transport of waters through the Archipelago (redrawn after Thomas et al. [56]). B) 911
Ba contour section across the head of Baffin Bay, approximately along 76°N, as 912
indicated by the black line in the inserted map in A). The easternmost station is 913
identical with the one shown in A) (blue symbols). 914
29
915 Figure 2. Dissolved Mn (nM) concentrations in the upper 500 m of the Laptev Sea 916
illustrating the strong Mn source over the shelf and its subsequent transport toward 917
the central Arctic basin (Middag et al. [57]). 918
30
919
920
Figure 3. Nd concentration and isotope data for Arctic Ocean waters. The isotope 921
ratios of waters flowing from the Pacific decrease during passage through the 922
Bering Sea before entering the Chukchi Sea in the Arctic due to interaction with 923
shelf sediments (Dahlqvist et al. [61]). 924
925
31
926 927 Figure 4. Upper panel: Amazon estuary [Nd] from Sholkovitz [108] (grey circles) and 928
Rousseau et al. [13] (blue diamonds) are reported against the salinity gradient. 929
Lower panel: Amazon estuary dissolved (red triangles), particulate (green squares) 930
εNd and radium-derived water mass ages (in days) are reported against the salinity 931
gradient. 932
0
200
400
600
800
0 10 20 30 40
[Nd
] (p
mo
l/kg
)
Salinity
Dissolved [Nd] (Sholkovitz, 1993)
Dissolved [Nd] (Rousseau et al. 2015)
0
20
40
60
0 10 20 30 40
-13
-12
-11
-10
-9
-8
0 10 20 30 40
εNd
Salinity
Suspended particules εNd (Rousseau et al. 2015)
Dissolved εNd (Rousseau et al. 2015)
Theroretical Binary Mixing Model
0 d.
2.7 d.
4.0 d. 5.3 d.
19 d.
2.6 d.
32
933 934 Figure 5. Particle trajectories (green lines) from an altimetry model designed to 935
investigate the origin of water masses within a counterclockwise eddy studied as 936
part of the GEOTRACES FeCycle process study (Boyd et al. [77]). Model snapshots 937
are from (clockwise starting at top left) 9 Feb, 8 April, 11 July and 31 Aug 2008. The 938
particles (black) traverse the waters on and across the 200 m deep shelf break (blue 939
contours) adjacent to the eastern seaboard of the northern island of New Zealand. 940
9-Feb-2008 8-Apr-2008
11-Jul-2008 31-Aug-2008
-34
-48
Latude
-34
-48
Latude
Longitude175 200 Longitude175 200
33
941 942
Figure 6. Fraction of water column Fe associated with input from oxygenated 943
sediments along the North Atlantic margin (from Conway and John [83]). 944
945
34
946
Figure 7. Model derived shelf 228Ra flux (units are log base (2) atoms m-2 y-1) from 947
the model of Kwon et al. [26]. Also shown in (b) are the U.S. GEOTRACES GA03 948
cruise stations (diamonds). The dashed line in (b) is the boundary between the 949
eastern and western Atlantic margins. The innermost coastal and central Atlantic 950
stations were used to derive the ΔTEI/Δ228Ra averages. 951
952
953
954
955
956
957